11email: a.s.parikh@uva.nl 22institutetext: SRON, Netherlands Institute for Space Research, Sorbonnelaan 2, 3584 CA Utrecht, The Netherlands 33institutetext: Eureka Scientific, Inc., 2452 Delmer Street, Oakland, CA 94602, USA 44institutetext: Instituto de Astronomía, Universidad Nacional Autónoma de México, Mexico D.F. 04510, Mexico
Unexpected late-time temperature increase observed in the two neutron star crust-cooling sources XTE J1701462 and EXO 0748676
Transient low-mass X-ray binaries (LMXBs) that host neutron stars (NSs) provide excellent laboratories for probing the dense matter physics present in NS crusts. During accretion outbursts in LMXBs, exothermic reactions may heat the NS crust, disrupting the crust-core equilibrium. When the outburst ceases, the crust cools to restore thermal equilibrium with the core. Monitoring this cooling evolution allows us to probe the dense matter physics in the crust. Properties of the deeper crustal layers can be probed at later times after the end of the outburst. We report on the unexpected late-time temperature evolution (2000 days after the end of their outbursts) of two NSs in LMXBs, XTE J1701462 and EXO 0748676. Although both these sources exhibited very different outbursts (in terms of duration and the average accretion rate), they exhibit an unusually steep decay of 7 eV in the observed effective temperature (occurring in a time span of 700 days) around 2000 days after the end of their outbursts. Furthermore, they both showed an even more unexpected rise of 3 eV in temperature (over a time period of 500-2000 days) after this steep decay. This rise was significant at the 2.4 and 8.5 level for XTE J1701462 and EXO 0748676, respectively. The physical explanation for such behaviour is unknown and cannot be straightforwardly be explained within the cooling hypothesis. In addition, this observed evolution cannot be well explained by low-level accretion either without invoking many assumptions. We investigate the potential pathways in the theoretical heating and cooling models that could reproduce this unusual behaviour, which so far has been observed in two crust-cooling sources. Such a temperature increase has not been observed in the other NS crust-cooling sources at similarly late times, although it cannot be excluded that this might be a result of the inadequate sampling obtained at such late times.
Key Words.:
Accretion, accretion disks – Stars: neutron – X-rays: binaries – X-rays: individuals (EXO 0748676 and XTE J1701462)1 Introduction
Low-mass X-ray binaries (LMXBs) host neutron stars (NS), typically with sub-solar mass companion stars that overflow their Roche lobes. These systems may exhibit outbursts as a result of instabilities in the accretion discs (e.g. Lasota, 2001). The outbursts cause accretion of matter onto the NS, which compresses its crust and results in heat-releasing reactions (e.g. Haensel & Zdunik, 1990, 2008; Steiner, 2012). These reactions cause the crust to be heated out of thermal equilibrium with the core. They produce 2 MeV per accreted nucleon in total (e.g. Haensel & Zdunik, 2008). Several NS LMXB systems are transient, and the source transitions to quiescence when the outburst ends. During quiescence, the heating reactions are thought to stop, and the crust cools to restore thermal equilibrium with the core.
Modelling the observed crust-cooling behaviour using theoretical crust-heating and -cooling models (e.g. Brown & Cumming, 2009; Page, 2016) show that an additional, theoretically unexplained, heat source is present (in the current version of the models) in most NSs in LMXBs. This is known as the ‘shallow heat source’ because it occurs at shallower depths in the crust as compared to the heating processes discussed above. The contribution of the shallow heating is found to be 1–2 MeV per accreted nucleon in most sources (Brown & Cumming, 2009; Degenaar et al., 2011). However, MAXI J0556332 exhibited 10–17 MeV per accreted nucleon of shallow heating (Homan et al., 2014; Deibel et al., 2015; Parikh et al., 2017), but it is currently unknown why this source exhibited such a different amount of shallow heating compared to the other sources.
Although it only makes up 1% of the total NS mass by volume, the crust is interesting to study because the density increases by over 8 orders of magnitude. This is accompanied by changing properties of matter with these increasing densities. Quiescent observations of accretion-heated NSs track the cooling crust and allow us to infer the properties of the dense matter physics present in the crust. These observations, obtained using X-ray telescopes, can only measure the surface temperature of the NS. Observations of some years to several decades after the end of the outburst are needed to probe the deeper layers because the heat from these deeper layers takes this time to be conducted to the surface, where it can be observed (Brown & Cumming, 2009). X-ray spectra (in the 0.5–10 keV energy range) of cooling crusts observed in quiescence are characterised by a soft spectral component which may be accompanied by a hard spectral component that is due to an increased presence of photons at energies 3 keV.
2 Observations
We examine the similar late-time quiescent crust cooling behaviour of two systems, XTE J1701462 and EXO 0748676, that exhibited very different outburst properties. For details of the data analysis method, we refer to Appendix A and Parikh et al. (2019). The details of all the observations we analysed are shown in Table 1. All errors reported here correspond to 1 errors.
2.1 XTE J1701462
XTE J1701462 was discovered in January 2006 (Remillard et al., 2006) when it exhibited a bright accretion outburst close to its Eddington luminosity. This outburst ended 1.6 years later in August 2007 (Homan et al., 2007), after which the accretion-heated crust was found to cool down. So far, the cooling has been reported up to 1200 days after the end of its outburst (i.e. tq, which is also the number of days into quiescence; e.g. Fridriksson et al., 2010, 2011). Here, we report on three new observations, extending the cooling baseline to 3200 tq. Several quiescent observations of XTE J1701462 exhibited enhanced accretion activity in the form of flares (e.g. Fridriksson et al., 2010), which are not used for our crust-cooling study. These flaring data are characterised by a large contribution from a hard, power-law-shaped emission component. Therefore, we have only examined non-flaring data here, that is, data for which the flux contribution from the soft spectral component is 70 %.
2.2 EXO 0748676
EXO 0748676 exhibited an about 24-year-long outburst at an average luminosity corresponding to 5% of the Eddington luminosity (Degenaar et al., 2009). This outburst ended in September 2008 (Wolff et al., 2008), and observations made since this time indicate a cooling crust. So far, cooling up to 1700 tq has been reported (e.g. Díaz Trigo et al., 2011; Degenaar et al., 2009, 2011, 2014; Cheng et al., 2017). We report on two new observations, which increases the observed cooling baseline to 3500 tq. EXO 0748676 is observed nearly edge-on (at an inclination of 80∘; Parmar et al., 1986) and exhibits eclipses lasting 8.3 minutes during its 3.8-hour orbit. We focus on the non-eclipsing ‘persistent’ emission of the source here. Therefore we removed all the data corresponding to the eclipse times, which we determined using the ephemeris reported by Wolff et al. (2009).
2.3 Spectral fitting
All the XTE J1701462 and EXO 0748676 spectra were grouped to have a minimum of 25 counts per bin, using the grppha tool. We collectively fit the spectra for the individual sources using XSpec111https://heasarc.gsfc.nasa.gov/xanadu/xspec/ (version 12.9; Arnaud, 1996) and employing statistics.
We fitted the spectra using the NS atmosphere model nsatmos (Heinke et al., 2006). Our models assumed that the NSs have masses and radii of 1.6 and 12 km, respectively. The assumed distances to XTE J1701462 and EXO 0748676 are 8.8 kpc (Lin et al., 2009) and 7.4 kpc (Galloway et al., 2008; Degenaar et al., 2009), respectively. For the spectral modelling of both sources, we assumed that the entire NS surface was emitting and hence set the nsatmos normalisation parameter to 1. We used tbabs to model the equivalent hydrogen column density () with WILM abundances and VERN cross sections (Verner et al., 1996; Wilms et al., 2000).
The spectra from the two sources could not be well fit (as determined using the reduced statistic) with only an nsatmos model because photons at higher energies were present during some observations (at 3.5 keV; e.g. Fridriksson et al., 2010; Degenaar et al., 2011). We therefore used an additional power-law component to fit the data. The quality of these data is not good enough to allow the photon index () to vary between the various observations. We therefore tied the across the different observations for each source. However, the associated normalisation was allowed to vary. We found that was not well constrained (as determined during its error estimation) for several observations. However, the closest fit obtained for had rather a low value, and we therefore fixed = 1 for both sources.222We also fitted the data from both sources using = 1.5 and 2, and the qualitative trend exhibited by the inferred NS surface temperature did not change.
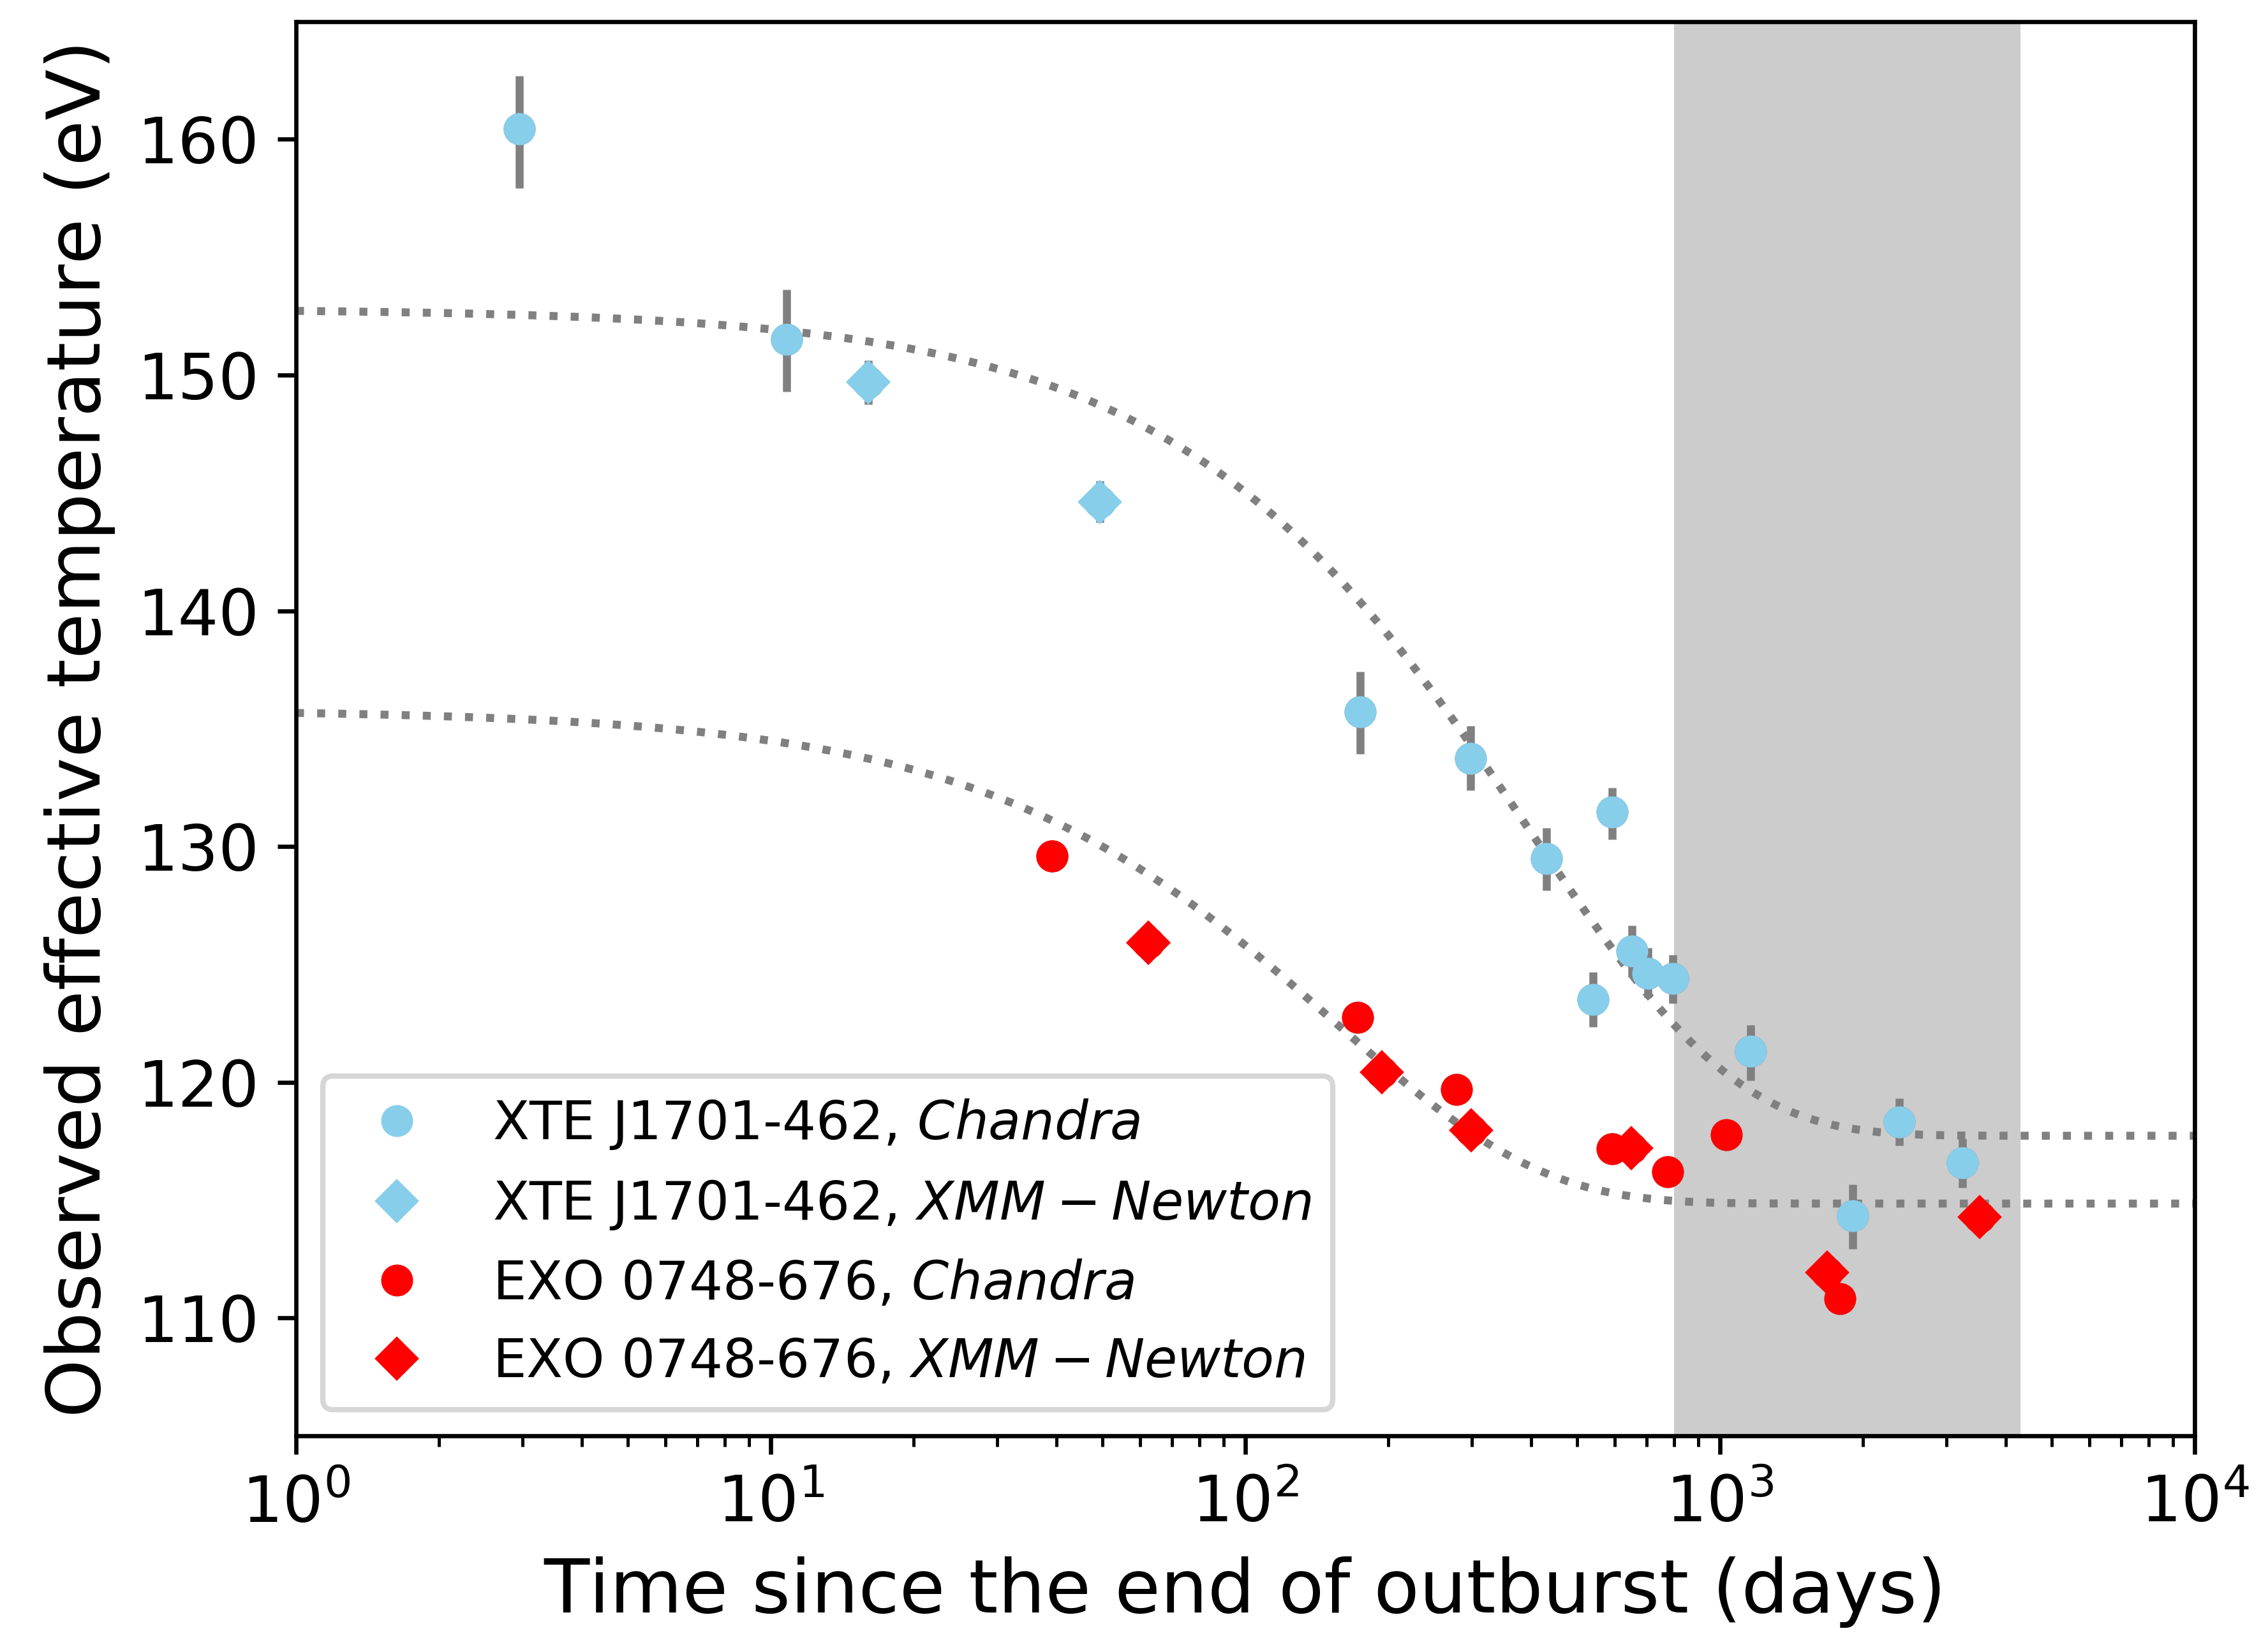
Initially, the was left free but was found to be consistent (within the error bars) across all the observations for each source. This parameter was accordingly tied across the various observations (of each source), but was allowed to vary. The best-fit determined for XTE J1701462 and EXO 07486762 were cm-2 and cm-2, respectively. The errors on the observed effective NS temperature ( ) were determined after fixing the best-fit values corresponding to the normalisation of the power-law component (because the errors on the were often unconstrained). The results of our spectral fitting are shown in Table 1 and Figure 1. The dotted grey lines in Figure 1 are fits of simple exponential decay functions. The figure shows that this function is only a poor fit to the evolution and is not intended to be a good fit. Its main purpose is to guide the eye to the approximate evolution of each source.
| Observatory | Observation | MJD | Exposure | nsatmos luminosityd | Total luminositye | % contribution | ||
|---|---|---|---|---|---|---|---|---|
| Idb | timec (ksec) | (eV) | ( erg s-1) | ( erg s-1) | of | |||
| XTE J1701462 | ||||||||
| 1 | Chandra | 7513 | 54324.9 | 4.7 | 160.42.4 | 172.1 13.9 | 181.6 13.8 | 5.2 |
| 2 | —”— | 7514 | 54332.8 | 8.8 | 151.52.1 | 135.3 10.4 | 184.9 11.7 | 26.8 |
| 3 | XMM-Newton | 0413390101 | 54338.0 | 9.5, 20.1, 19.3 | 149.70.9 | 128.0 3.9 | 131.3 3.9 | 2.5 |
| 4 | —”— | 0413390201 | 54371.3 | 12.3, 23.2, 23.2 | 144.60.9 | 110.9 3.3 | 115.7 3.3 | 4.2 |
| 5 | Chandra | 7515 | 54496.3 | 19.9 | 135.71.7 | 83.9 5.9 | 120.9 6.0 | 29.8 |
| 6 | —”— | 7516 | 54620.3 | 27.4 | 133.81.4 | 78.7 4.3 | 88.4 4.4 | 11.0 |
| 7 | —”— | 7517 | 54753.0 | 39.9 | 129.51.3 | 68.1 3.6 | 91.6 3.6 | 25.7 |
| 8 | —”— | 10063 | 54862.0 | 50.1 | 123.51.1 | 55.1 2.8 | 59.8 2.8 | 7.9 |
| 9 | —”— | 10064, 10889, 10890, 10891 | 54914.6 | 53.7 | 131.51.0 | 72.0 3.1 | 86.7 3.0 | 17.0 |
| 10 | —”— | 10065 | 54974.6 | 62.3 | 125.61.1 | 59.2 2.7 | 71.4 2.6 | 17.0 |
| 11 | —”— | 10066 | 55027.3 | 65.5 | 124.61.0 | 58.2 2.6 | 69.9 2.5 | 16.7 |
| 12 | —”— | 10067, 12006 | 55117.6 | 59.4 | 124.41.0 | 56.7 2.4 | 63.7 2.4 | 11.0 |
| 13 | —”— | 11087 | 55480.8 | 56.6 | 121.31.1 | 50.6 2.6 | 56.2 2.6 | 9.9 |
| 14 | —”— | 13730 | 56227.4 | 64.2 | 114.41.3 | 38.8 2.5 | 53.7 2.3 | 27.8 |
| 15 | —”— | 15800 | 56706.1 | 113.5 | 118.31.0 | 45.6 1.9 | 61.0 1.8 | 25.3 |
| 16 | —”— | 17870 | 57561.3 | 98.8 | 116.61.0 | 42.5 2.0 | 48.8 1.9 | 12.9 |
| EXO 0748676 | ||||||||
| 1 | Chandra | 9070, 10783 | 54753.2 | 26.1 | 129.6 0.4 | 67.9 0.9 | 79.4 1.0 | 14.5 |
| 2 | XMM-Newton | 0560180701 | 54776.4 | 24.2, 29.0, 29.0 | 125.9 0.2 | 60.3 0.4 | 64.7 0.5 | 6.8 |
| 3 | Chandra | 9071, 10871 | 54886.5 | 23.9 | 122.7 0.4 | 53.5 0.8 | 57.4 0.9 | 6.8 |
| 4 | XMM-Newton | 0605560401 | 54908.0 | 33.1, 43.2, 42.0 | 120.4 0.2 | 49.6 0.3 | 49.6 0.3 | 0.0 |
| 5 | Chandra | 9072 | 54992.5 | 26.0 | 119.7 0.4 | 47.8 0.7 | 48.0 0.8 | 0.4 |
| 6 | XMM-Newton | 0605560501 | 55013.3 | 66.5, 91.4, 92.9 | 118.0 0.1 | 45.3 0.2 | 45.3 0.2 | 0.0 |
| 7 | Chandra | 11059 | 55306.1 | 25.9 | 117.2 0.5 | 43.6 0.7 | 52.9 0.9 | 17.6 |
| 8 | XMM-Newton | 0651690101 | 55364.2 | 39.0, 43.0, 40.4 | 117.2 0.2 | 44.0 0.3 | 43.9 0.3 | 0.0 |
| 9 | Chandra | 11060 | 55489.6 | 26.2 | 116.2 0.5 | 42.2 0.7 | 49.1 0.8 | 14.1 |
| 10 | —”— | 12414 | 55745.0 | 37.1 | 117.8 0.4 | 44.2 0.6 | 51.0 0.7 | 13.3 |
| 11 | XMM-Newton | 0690330101 | 56397.2 | 81.5, 99.1, 99.2 | 111.9 0.1 | 35.9 0.2 | 35.9 0.2 | 0.0 |
| 12 | Chandra | 14663 | 56505.1 | 41.1 | 110.8 0.4 | 33.9 0.6 | 35.8 0.6 | 5.3 |
| 13 | XMM-Newton | 0824420101 | 58240.3 | 63.2, 74.1, 74.1 | 114.3 0.1 | 39.0 0.2 | 40.9 0.2 | 4.7 |
| aAll errors reported are 1 errors. | ||||||||
| b If multiple observations Ids are listed, the spectra obtained from these observations were combined into one single spectrum, resulting in a single temperature estimate. | ||||||||
| cThe exposure times are reported after the removal of background flares and eclipses. The XMM-Newton exposure times correspond to data from the pn, MOS1, and MOS2 times, respectively. | ||||||||
| dThe nsatmos luminosity refers to the total unabsorbed luminosity corresponding only to the contribution from the nsatmos component for the 0.5–10 keV energy range. | ||||||||
| eThe total luminosity refers to the total unabsorbed luminosity (corresponding to the contributions from the nsatmos and power-law components) for the 0.5–10 keV energy range. | ||||||||
3 Results and discussion
3.1 Results
We present the observed quiescent temperature evolution of two NS crust-cooling sources, XTE J1701462 and EXO 0748676, in Figure 1 and Table 1. Both sources exhibit a cooling evolution similar to those observed for other sources up to 1000 tq. However, observations obtained at 2000 tq show a steeper cooling decay in both sources than their previous observed evolution (as is predicted by some of the models for XTE J1701462, presented in Page & Reddy, 2013). During this stage, the sources decayed by 6–7 eV over 650–750 days. However, unanticipated for sources that exhibit crust cooling, the observations of both sources (at 2000 tq) exhibit a rise in the observed (by 3 eV over 500–2000 days) instead of a further decay. The observed rise for XTE J1701462 and EXO 0748676 was significant at the 2.4 and 8.5 level, respectively. Extraordinarily, the magnitude of the observed rise in and the time after the end of the outburst at which both sources exhibited this rise are similar333The exact times at which the sources were observed to decay or exhibit their subsequent rise are better constrained for XTE J1701462 than for EXO 0748676 due to the observational sampling. although they exhibited different outburst properties. Other cooling sources observed at late times do not exhibit a similar behaviour (see Figure 2 of Wijnands et al., 2017, for the late-time crust-cooling curve of several sources). However, this may be a result of the sparse observational sampling obtained, therefore it remains possible that these sources behaved in a similar fashion.
The solid grey rectangle in Figure 1 highlights the area of interest in the cooling curves. A decrease and subsequent increase in the is observed there.
3.2 Examining the spectra and their fits
A potential explanation for the sudden increase in at late times in both sources might be that the sources exhibited low-level accretion events during these observations. Such events may affect the spectra so as to result in an inferred increase in (likely without an actual physical increase in the crust temperature). However, such events tend to be characterised by an increased contribution from a hard spectral component (contributing 50% in the 0.5–10 keV energy range; e.g. Fridriksson et al., 2010; Chakrabarty et al., 2014; Wijnands et al., 2015; D’Angelo et al., 2015). The last few observations for both our sources during which a rise in the was observed do not exhibit a dominant contribution from the power-law component (the contribution was 50% in the 0.5–10 keV energy range, see Table 1), suggesting that the observed rise is not a result of accretion events.
A change in the actual compared to its assumed value might also affect the spectral fit parameters and result in an observed increase in the (as was discussed for the crust-cooling source MXB 165929; Cackett et al., 2013). This is especially pertinent for EXO 0748676 because the source is viewed at a high inclination, and the build-up of the disc in quiescence might increase the towards the source (as was suggested to occur in MXB 165929 as well; Cackett et al., 2013). However, the observed increase in is not a result of our assumptions because the remains consistent within the error bars (when left free to vary during our spectral fits; see Section 2.3) between the various spectra of EXO 0748676 (and for XTE J1701462 as well, for which we did a similar test).
3.3 Might it still be crust cooling?
The late-time evolutions of XTE J1701462 and EXO 0748676 are very similar, exhibiting a steep decay followed by a rise in the observed after the end of their accretion outbursts. This suggests that the cause of the observed behaviour may have the same physical explanation. Below we discuss possible reasons for crust-cooling sources to exhibit this unexpected late-time rise in the observed .
3.3.1 Investigating the possibility of an intermediate outburst
An accretion outburst occurring at an intermediate time (i.e. after the end of the observed main outburst and before the observed increase) might result in reheating of a cooling crust and might explain (if such outburst indeed occurred) the observed increase in temperature (as was observed for MAXI J0556-332; Parikh et al., 2017). An accretion outburst might also result in a change in the composition of the envelope (the outer 100 m of the crust that translates the temperature at the top layers of the crust to the effective surface temperature), thereby changing its thermal conductivity and the observed (Brown et al., 2002). It may also be a combination of both these effects.
The observed decay and subsequent rise in the (with respect to our limited observational sampling) is separated by 1.3 and 4.8 years in XTE J1701462 and EXO 0748676, respectively. We investigated the archival data from both these sources to examine whether they exhibited any intermediate outbursts before the observed rise in temperature. We used data from the Burst Alert Telescope (BAT) on board the Neil Gehrels Swift Observatory and the Monitor of All-sky X-ray Image (MAXI) on board the International Space Station. However, no evidence for enhanced activity was exhibited by either source. Thus, if these sources experienced any intermediate outburst, it would have been rather faint, having a maximum luminosity of erg s-1 (Hiroi et al., 2009; Krimm et al., 2013), such that it is not detected by these all-sky monitors. However, we note that XTE J1701462 typically cannot be observed for about three months of the year (from early November to the end of January) because of the constraint imposed by the location of the Sun in the sky. It might have exhibited a brighter outburst during this time. EXO 0748676 is never Sun constrained and can be observed throughout the year. Short and faint accretion episodes are not expected to significantly heat up the crust (e.g. Wijnands & Degenaar, 2013).
3.3.2 Ocean freezing
The NS crust may melt to form an ‘ocean’ as a result of the heat released during the accretion outburst. During quiescence, this ocean cools and solidifies (e.g. Medin & Cumming, 2011). Heavy elements preferentially freeze out from the ocean, enlarging the solid crust and setting up convection in the ocean (e.g. Medin & Cumming, 2011, 2014, 2015; Mckinven et al., 2016). This affects the evolution of the modelled crust-cooling curve as compared to the scenario during which no chemical convection is accounted for. Medin & Cumming (2014) presented some crust-cooling studies that included the solidification of the ocean. Their Figure 1 shows that a decrease followed by a rise at late times can be observed under certain assumptions (see Medin & Cumming, 2014, 2015, for more details). This is reminiscent of what we have observed for our sources.
3.3.3 Nuclear pasta
The late-time evolution of crust cooling NSs, as studied here, provide the exciting possibility to probe the physics in the deeper crust where nuclear pasta may be present (e.g. Caplan & Horowitz, 2017). Nuclear pasta refers to the disordered, non-spherical matter, expected at the large densities near the crust-core interface, as the short range nuclear attraction competes with the long range Coulomb repulsion (e.g. Pethick & Potekhin, 1998). This disordered nuclear pasta is expected to be characterised by low thermal conductivity, forming a heat barrier (e.g. Horowitz et al., 2015).
During accretion, the heat-producing reactions result in the overall heating of the crust. If the NS contained low thermal conductivity pasta and a relatively cold core, the heat would flow inwards during accretion and not contribute much to the observed crust-cooling evolution in quiescence due to the thermal profile in the crust. Alternatively, if the core is relatively hot, the crustal thermal profile would be such that the heat flux during quiescence, from the core outwards towards the surface would not change much. We therefore hypothesise that the presence of pasta (in an NS with either a cold or a hot core) would not explain the decay and subsequent rise in our observed evolution because this would only produce a decay in the cooling curve and no subsequent rise. Cooling-curve modelling including a pasta layer has previously been carried out for several crust-cooling sources (MXB 165929, MAXI J0556332, and Terzan 5 X-3; Horowitz et al., 2015; Parikh et al., 2017; Ootes et al., 2019) which showed the expected behaviour we hypothesised for XTE J1701462 and EXO 0748676 here.
3.3.4 Time-variable properties of a deep crust layer
Although nuclear pasta cannot reproduce the decay in the observed , the decay may be reproduced by a relatively deep crust layer that exhibits a time-variable thermal conductivity that suddenly increases and leads to the observed decrease in , and then subsequently decreases again and leads to a sudden rise in the . However, there does not appear to be any physical motivation for a such a time-dependent thermal conductivity.
Our study of the crust-cooling sources, XTE J1701462 and EXO 0748676, has shown an unexpected rise in the temperature at late times in quiescence. The physical explanation for this behaviour is unknown. Intensive theoretical investigations (beyond the scope of this paper) may provide an insight into the underlying physics and investigate whether the new physical explanations invoked by the theoretical models would only affect the late-time crust-cooling evolution or have a broader effect on the physics inferred across all timescales.
Acknowledgements.
This work benefitted from support by the National Science Foundation under Grant No. PHY-1430152 (JINA Center for the Evolution of the Elements). AP, RW, and LO were supported by a NWO Top Grant, Module 1, awarded to RW. AP and ND are supported by an NWO/Vidi grant awarded to ND. JH acknowledges financial support that was provided by the National Aeronautics and Space Administration through Chandra Award Numbers GO2-13060X, GO4-15048X, and GO6-17048X issued by the Chandra X-ray Center, which is operated by the Smithsonian Astrophysical Observatory for and on behalf of the National Aeronautics Space Administration under contract NAS8-03060. DP is partially supported by the Consejo Nacional de Ciencia y Tecnología with a CB-2014-1 grant 240512.References
- Arnaud (1996) Arnaud, K. 1996, in Astronomical Data Analysis Software and Systems V, Vol. 101, 17
- Brown et al. (2002) Brown, E. F., Bildsten, L., & Chang, P. 2002, ApJ, 574, 920
- Brown & Cumming (2009) Brown, E. F. & Cumming, A. 2009, ApJ, 698, 1020
- Cackett et al. (2013) Cackett, E., Brown, E., Cumming, A., et al. 2013, ApJ, 774, 131
- Caplan & Horowitz (2017) Caplan, M. E. & Horowitz, C. J. 2017, Reviews of Modern Physics, 89, 041002
- Chakrabarty et al. (2014) Chakrabarty, D., Tomsick, J. A., Grefenstette, B. W., et al. 2014, ApJ, 797, 92
- Cheng et al. (2017) Cheng, Z., Mendez, M., Diaz-Trigo, M., & Costantini, E. 2017, MNRAS, 471, 2605
- D’Angelo et al. (2015) D’Angelo, C., Fridriksson, J., Messenger, C., & Patruno, A. 2015, MNRAS, 449, 2803
- Degenaar et al. (2011) Degenaar, N., Brown, E., & Wijnands, R. 2011, MNRAS: Letters, 418, L152
- Degenaar et al. (2014) Degenaar, N., Medin, Z., Cumming, A., et al. 2014, ApJ, 791, 47
- Degenaar et al. (2009) Degenaar, N., Wijnands, R., Wolff, M. T., et al. 2009, MNRAS, 396, L26
- Degenaar et al. (2011) Degenaar, N., Wolff, M. T., Ray, P. S., et al. 2011, MNRAS, 412, 1409
- Deibel et al. (2015) Deibel, A., Cumming, A., Brown, E. F., & Page, D. 2015, ApJ Letters, 809, L31
- Díaz Trigo et al. (2011) Díaz Trigo, M., Boirin, L., Costantini, E., Méndez, M., & Parmar, A. 2011, AAP, 528, A150
- Fridriksson et al. (2011) Fridriksson, J. K., Homan, J., Wijnands, R., et al. 2011, ApJ, 736, 162
- Fridriksson et al. (2010) Fridriksson, J. K., Homan, J., Wijnands, R., et al. 2010, ApJ, 714, 270
- Galloway et al. (2008) Galloway, D. K., Muno, M. P., Hartman, J. M., Psaltis, D., & Chakrabarty, D. 2008, ApJ Supplement Series, 179, 360
- Haensel & Zdunik (1990) Haensel, P. & Zdunik, J. 1990, A&A, 227, 431
- Haensel & Zdunik (2008) Haensel, P. & Zdunik, J. 2008, A&A, 480, 459
- Heinke et al. (2006) Heinke, C. O., Rybicki, G. B., Narayan, R., & Grindlay, J. E. 2006, ApJ, 644, 1090
- Hiroi et al. (2009) Hiroi, K., Ueda, Y., Eguchi, S., et al. 2009, orbit (pattern 1), 21, 23
- Homan et al. (2014) Homan, J., Fridriksson, J. K., Wijnands, R., et al. 2014, ApJ, 795, 131
- Homan et al. (2007) Homan, J., van der Klis, M., Wijnands, R., et al. 2007, ApJ, 656, 420
- Horowitz et al. (2015) Horowitz, C., Berry, D., Briggs, C., et al. 2015, Phys. Rev. Lett., 114, 031102
- Krimm et al. (2013) Krimm, H. A., Holland, S. T., Corbet, R. H., et al. 2013, AJSS, 209, 14
- Lasota (2001) Lasota, J.-P. 2001, New Astronomy Reviews, 45, 449
- Lin et al. (2009) Lin, D., Remillard, R. A., & Homan, J. 2009, ApJ, 696, 1257
- Mckinven et al. (2016) Mckinven, R., Cumming, A., Medin, Z., & Schatz, H. 2016, ApJ, 823, 117
- Medin & Cumming (2011) Medin, Z. & Cumming, A. 2011, ApJ, 730, 97
- Medin & Cumming (2014) Medin, Z. & Cumming, A. 2014, ApJ, 783, L3
- Medin & Cumming (2015) Medin, Z. & Cumming, A. 2015, ApJ, 802, 29
- Ootes et al. (2019) Ootes, L. S., Vats, S., Page, D., et al. 2019, MNRAS, 487, 1447
- Page (2016) Page, D. 2016, NSCool: Neutron star cooling code, Astrophysics Source Code Library
- Page & Reddy (2013) Page, D. & Reddy, S. 2013, Phys. Rev. Lett., 111, 241102
- Parikh et al. (2017) Parikh, A. S., Homan, J., Wijnands, R., et al. 2017, ApJL, 851, L28
- Parikh et al. (2019) Parikh, A. S., Wijnands, R., Ootes, L. S., et al. 2019, A&A, 624, A84
- Parmar et al. (1986) Parmar, A. N., White, N. E., Giommi, P., & Gottwald, M. 1986, ApJ, 308, 199
- Pethick & Potekhin (1998) Pethick, C. J. & Potekhin, A. Y. 1998, Physics Letters B, 427, 7
- Remillard et al. (2006) Remillard, R. A., Lin, D., ASM Team at MIT, & NASA/GSFC. 2006, The Astronomer’s Telegram, 696, 1
- Steiner (2012) Steiner, A. W. 2012, Phys. Rev. C, 85, 055804
- Verner et al. (1996) Verner, D., Ferland, G., Korista, K., & Yakovlev, D. 1996, ApJ, 465
- Wijnands & Degenaar (2013) Wijnands, R. & Degenaar, N. 2013, MNRAS, 434, 1599
- Wijnands et al. (2015) Wijnands, R., Degenaar, N., Padilla, M. A., et al. 2015, MNRAS, 454, 1371
- Wijnands et al. (2017) Wijnands, R., Degenaar, N., & Page, D. 2017, Journal of Astrophysics and Astronomy, 38, 49
- Wilms et al. (2000) Wilms, J., Allen, A., & McCray, R. 2000, ApJ, 542, 914
- Wolff et al. (2008) Wolff, M., Ray, P., Wood, K., & Wijnands, R. 2008, ATel, 1812
- Wolff et al. (2009) Wolff, M. T., Ray, P. S., Wood, K. S., & Hertz, P. L. 2009, ApJS, 183, 156
Appendix A Data analysis
We processed the quiescent observations from both sources using the same software version. We briefly describe the processes below.
A.1 Chandra
The Chandra data were processed using CIAO444https://cxc.harvard.edu/ciao/ (v4.11). The data were examined for background flares by making light curves of the background (excluding all bright sources), but no evidence of any strong flaring was detected. A source region centred on the source location with a radius of 3 arcsec was used to extract the spectra for both sources. The background region we used for the spectral extractions of all observations was annular, with an inner and outer radius of 10 and 20 arcsec, respectively. The annulus was centred on the source location. The specextract tool was used to generate the spectra from the various observations, along with the aperture-corrected auxiliary response files and the redistribution matrix files. We combined Chandra spectra that were close in time (i.e. obtained 3 days apart) to obtain data with higher quality. This was done using the combine_spectra tool. The observations combined into single spectral intervals are shown in Table 1.
A.2 XMM-Newton
The XMM-Newton data were processed using SAS555https://www.cosmos.esa.int/web/xmm-newton/download-and-install-sas (v18.0) We inspected all the XMM-Newton data for any evidence of background flares by examining the 10–12 keV and 10 keV data for the pn and MOS detectors, respectively. All occurrences of background flaring were removed by discarding data from time intervals when flaring was observed. On average, we discarded 20 % of the data as a result of such flaring.
Source regions with a radius of 25 arcsec, placed on the source (as suggested by the eregionanalyse tool), were used to extract the spectra of both sources. A circular background region with a radius of 50 arcsec whose location was recommended by the ebkgreg tool was used for the spectral extraction of all observations we examined here. The ancillary response function and response matrix files were generated using arfgen and rmfgen.