ALMA Cii 158m Imaging of an Hi-Selected Major Merger at
Abstract
We present high spatial-resolution ( kpc) Atacama Large Millimeter/submillimeter Array (ALMA) observations of [Cii] 158 m and dust-continuum emission from a galaxy at selected by its strong Hi absorption (a damped Ly absorber, DLA) against a background QSO. Our ALMA images reveal a pair of star-forming galaxies separated by kpc (projected) undergoing a major merger. Between these galaxies is a third emission component with highly elevated () [Cii] 158 m emission relative to the dust continuum, which is likely to arise from stripped gas associated with the merger. This merger of two otherwise-normal galaxies is not accompanied by enhanced star-formation, contrary to mergers detected in most luminosity-selected samples. The DLA associated with the merger exhibits extreme kinematics, with a velocity width for the low-ionization metal lines of , that spans the velocity spread revealed in the [Cii] 158 m emission. We propose that DLAs with high values are a signpost of major mergers in normal galaxies at high redshifts, and use the distribution of the velocity widths of metal lines in high- DLAs to provide a rough estimate the fraction of galaxies that are undergoing a major merger.
1 Introduction
At the heart of modern cosmology is the concept that large structures are built up from the collapse and agglomeration of smaller structures. This holds for both dark matter halos and the galaxies within them, which together are predicted to merge across cosmic time to yield the massive galaxies observed today. Such mergers are observed and predicted to transform the morphology of galaxies (e.g. Mihos & Hernquist, 1996; Naab & Burkert, 2003; Lotz et al., 2008), to dominate the mass evolution in quiescent galaxies (e.g. Bell et al., 2006), and to trigger dramatic enhancements or declines in a galaxy’s star formation rate (e.g. Somerville et al., 2001; Jogee et al., 2009; Patton et al., 2011). One is thus motivated to track the incidence and processes that govern galaxy mergers across cosmic time.
Despite these strong motivations to study mergers, empirical studies – especially in the high- universe – are relatively scarce. Indeed, the majority of merging systems known are serendipitous discoveries (e.g. Cooke et al., 2010) or are associated with the most luminous galaxies, e.g. sub-mm galaxies with extreme star-formation rates (SFRs; Olivares et al., 2016), or galaxies hosting ultra-luminous quasars (Neeleman et al., 2019a). There is also a set of imaging studies that statistically identify galaxies likely to merge within approximately a dynamical time (e.g. Patton et al., 1997; Bundy et al., 2009; Mantha et al., 2018). These studies are limited by the lack of spectroscopy which means ambiguous identifications of individual mergers and, more importantly, no analysis of the system dynamics (e.g. Ellison et al., 2010).
An important exception are the analyses by Ventou et al. (2017, 2019) who used deep VLT/MUSE integral field spectroscopy to study mergers of sub- galaxies. These studies are, however, flux-limited and therefore prone to selection biases. Such biases could manifest in either direction, e.g. a higher inferred merger rate if gas is preferentially driven towards the central regions to ignite star-formation and/or AGN activity (e.g. Mihos & Hernquist, 1996), or a lower rate if processes driving the merger enshroud the system in dust and obscure it from detection (e.g. Treister et al., 2010).
An additional tenant of our cosmological paradigm is that the rate of assembly on galaxy scales was greater in the past. Analyses of cosmological simulations report that on average major mergers (defined here as at least a 1:4 mass ratio) occur every Gyr at for galaxies with stellar mass (Rodríguez-Puebla et al., 2017). The merger rate is expected to increase with redshift, with mergers playing an increasingly important role in galaxy assembly at early times.
Empirically, it is challenging to assess the merger rate because we cannot directly estimate the timescale for these events from the ‘static’ observations afforded on human timescales. Instead, the majority of studies have focused on the fraction of galaxies in a population that are interacting and/or likely to undergo a major merger, . is frequently defined as the fraction of galaxies with projected physical separation kpc and velocity offset . The current literature reports a low major merger fraction today ( Xu et al., 2012), with a rise from to , peaking at (López-Sanjuan et al., 2013; Ventou et al., 2017, 2019). At high redshifts (), the results are drawn solely from the VLT/MUSE surveys of Ventou et al. (2017, 2019), which report a surprising decline in at , in apparent contradiction with the theoretical rise in the accretion rate. This apparent conundrum has been resolved by recognizing that the time to merge is much shorter in the high density environment of the high- Universe.Interpretations aside, this provides a limited dataset to examine the merger fraction and/or the detailed impacts of the merging process on high- galaxies.
Over the last few years, we have used the Atacama Large Millimeter/submillimeter Array (ALMA) to search for redshifted [Cii] 158 m emission from a sample of Hi-selected galaxies at (Neeleman et al., 2017, 2019b). These galaxies were targeted because of their association with a high column density of Hi (), identified as a damped Ly absorber (DLA; Wolfe et al., 2005) in a background quasar spectrum. Given the paucity of quiescent galaxies devoid of an interstellar medium at , Hi-selection should yield galaxies spanning nearly the complete distribution at any redshift. Our ALMA [Cii] 158 m sample of 19 DLAs therefore defines a representative set of normal, star-forming systems in their early phases of formation.
Our ALMA observations of two DLAs in an initial low-resolution [Cii] 158 m search resulted in the discovery of strong [Cii] 158 m emission from galaxies associated with the DLAs (Neeleman et al., 2017). In one of these galaxies, at towards DLA1201+2117_3.80, the [Cii] 158 m morphology and kinematics showed evidence for a complex system, which we suggested might arise from a pair of merging galaxies. Here, we present new ALMA observations, using a more extended configuration, aiming to resolve the [Cii] 158 m and dust far-infrared (FIR) continuum emission.
This paper is organized as follows. Section 2 presents the new ALMA observations, while Section 3 characterizes the morphology of the merging galaxies, and discusses the implications for estimating at . We conclude in Section 4 with thoughts on the future and a brief summary. Throughout the manuscript, we adopt a -Cold Dark Matter cosmology with cosmological parameters as defined in Planck Collaboration et al. (2016), and report physical distances unless otherwise noted.
2 Observations and Data Analysis
The DLA towards J120110.31+211758.5 (hereafter DLA1201+2117_3.80), with an Hi column density of , was discovered by a DLA survey of the Sloan Digital Sky Survey (Prochaska et al., 2005). Follow-up Keck/ESI observations yielded a high gas-phase metallicity ([M/H] ) and a large velocity width for its low-ionization metal-line profiles (Rafelski et al., 2012). Because of these features, we selected it for our original ALMA observations, which yielded detections of both [Cii] 158 m line and dust continuum emission from a galaxy offset by kpc from the quasar sightline at (Neeleman et al., 2017).
Owing to the kinematic complexity of the [Cii] 158 m line-emission already present in the low resolution observations and its relatively high flux density, we used the ALMA Band-7 receivers to observe the galaxy in configuration C43-4, with a higher angular resolution (, i.e. kpc at ), in Cycle 5, for a total on-source time of 2.25 h. We used four 1.875 GHz IF bands for the observations, one centered on the redshifted [Cii] 158 m line frequency (at 396.127 GHz), with 3840 channels, and the other three at neighbouring frequencies, each with 128 channels to sample the dust continuum of the galaxy.
The initial data analysis was carried out with the ALMA pipeline in the Common Astronomy Software Application (casa) package; this included the removal of bad data (e.g. due to non-working antennas), and calibration of the flux density scale and the antenna-based complex gains and system bandpass. After this, the target source data were split into a separate measurement set, and a self-calibration procedure was carried out on the continuum data, in casa, to more accurately measure the antenna-based gains. The self-calibration procedure involved a few rounds of imaging and phase-only self-calibration, followed by a couple of rounds of amplitude-and-phase self-calibration and imaging, until the gain solutions converged and no improvement was seen in the image on further self-calibration. The self-calibration used a “robust” scheme, with custom routines written in the casa environment. The final naturally-weighted continuum image has a root-mean-square (RMS) noise value of Jy/Bm and an angular resolution of . The peak signal-to-noise ratio on the image improved from before self-calibration to after self-calibration, and the image RMS noise improved by a factor of , indicating a significant improvement due to the self-calibration process. The antenna-based gains derived from the above procedure were then applied to the line data. Finally, a spectral cube was made using the visibilities from the band centered on the redshifted [Cii] 158 m frequency, using natural weighting. The spectral cube has an RMS noise of Jy/Bm per 50 km/s channel, and an angular resolution of .
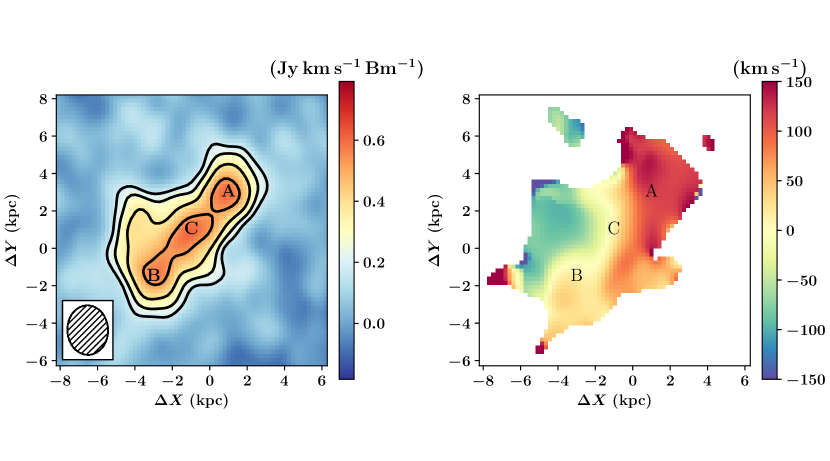
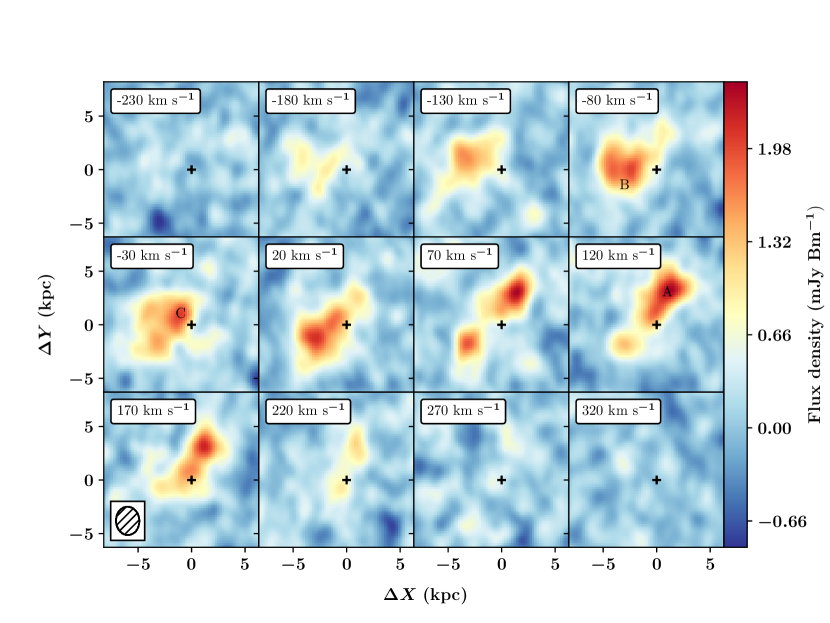
Figure 1 presents the zeroth and first moments of the [Cii] 158 m emission, centered on the galaxy position as determined from the lower resolution data (J120110.26+211756.2). The axes are labeled in physical units (kpc), at , with , the negative offset in RA, and , the offset in Dec, relative to J120110.26+211756.2. At the higher spatial resolution of the new observations, the source reported by Neeleman et al. (2017) separates into several components, in both space and velocity. This is clearly visible in the [Cii] 158 m channel maps (relative to ) shown in Figure 2, which further discriminate between the different components. At velocities , the emission is dominated by an extended source located kpc East of J120110.26+211756.2. We refer to this source as component B, and note that it also exhibits substantial emission at . At , the brightest emission occurs at kpc and kpc, which we refer to as component A. In between these two components is emission that spans a range of velocities, hereafter component C. For quantitative measurements, we define the following three regions, to clearly separate the three components:
-
•
A: Emission below the line
-
•
B: Emission above the line
-
•
C: emission between the above two lines
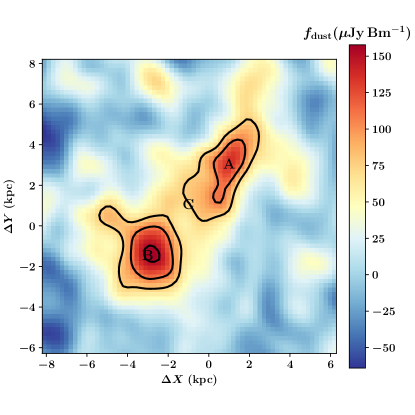
These three components are labeled in Figure 1. The brightest components (A and B) are also clearly detected as separate dust peaks in the continuum emission map, whereas component C is observed as weak extended emission in the dust continuum (Fig. 3). This suggests a scenario of two merging, star-forming galaxies (A and B), with stripped gas dominating the emission in component C. The lines demarcating the different components are shown in Figure 4.
To test the assertion of multiple sources, we attempted to fit the line emission with a single rotating-disk model using the fitting code described in Neeleman et al. (2020). The code compares the observed spectral cube to a cube generated from the model convolved with the instrument resolution. The best-fit parameters and uncertainties are then estimated through a Markov Chain Monte Carlo analysis of the parameter space. While the first-moment map shows a significant velocity shear across the system, the residuals of the models are significantly higher than the RMS uncertainty of the data cube. In other words, we find that no single-disk model can reliable reproduce the observed [Cii] 158 m line-emission.
We therefore conclude that the emission arises from at least two physically-distinct galaxies with projected separation kpc and a line-of-sight velocity separation of . Although we cannot strictly rule out a chance projection, the probability that the true separation greatly exceeds scales as the cube of the ratio of the separations. Thus, the probability that the true separation is kpc is %. The presence of substantial [Cii] 158 m emission between the two galaxies (component C) is further evidence that the galaxies are physically nearby. Simulations of merging galaxies report a high probability for galaxies with such small separations to undergo a merger (e.g. Patton et al., 2000). We therefore conclude that the [Cii] 158 m emission data indicate that A and B are in the process of merging.
3 Discussion
Our discovery of a pair of merging Hi-selected galaxies with ALMA offers a unique opportunity to examine the astrophysics of galaxy mergers in the young Universe, and inspires a new assessment of the fraction of major mergers. We discuss each of these in turn.
3.1 The nature of a merger
In the previous section, we argued that the [Cii] 158 m line-emission associated with DLA1201+2117_3.80 arises from a complex of merging galaxies. This is based on the morphology and kinematics seen in Figures 1, 2, and 3. We now describe the properties of these components to provide a quantitative assessment of the system that may be compared against models of galaxy mergers. Table 1 lists integrated and flux-weighted measurements for the line and continuum emission of the components. For these measurements, we have analyzed our naturally-weighted data cube, using simple box-car integrations to estimate the integrated flux densities. We have converted the continuum flux density measurements (obtained at Hz) to an IR luminosity (spanning 8 to 1,000 microns) assuming the dust emits as a modified blackbody with K and a Raleigh-Jeans slope of . For a discussion of the uncertainties of these assumptions for this galaxy see Neeleman et al. (2017).
| Quantity | Unit | Value | ErrorA | Value | ErrorB | Value | ErrorC | Value | ErrorT |
|---|---|---|---|---|---|---|---|---|---|
| Jy km s-1 | 0.51 | 0.007 | 0.51 | 0.006 | 0.34 | 0.005 | 1.36 | 0.010 | |
| 2.5 | 0.0 | 2.5 | 0.0 | 1.7 | 0.0 | 6.6 | 0.1 | ||
| mJy | 0.133 | 0.003 | 0.097 | 0.003 | 0.039 | 0.002 | 0.269 | 0.005 | |
| 10.0 | 0.2 | 7.2 | 0.2 | 2.9 | 0.2 | 20.1 | 0.4 | ||
| SFR | M⊙ yr-1 | 10.8 | 0.3 | 7.8 | 0.2 | 3.1 | 0.2 | 21.8 | 0.4 |
| / | 2.5 | 0.1 | 3.4 | 0.1 | 5.8 | 0.3 | 3.3 | 0.1 | |
| km/s | 44.4 | N/A | 1.7 | N/A | 7.7 | N/A | 19.3 | N/A |
Note. — Note that fluxes and quantities derived from them (e.g. SFR) have a systematic error of 15%.
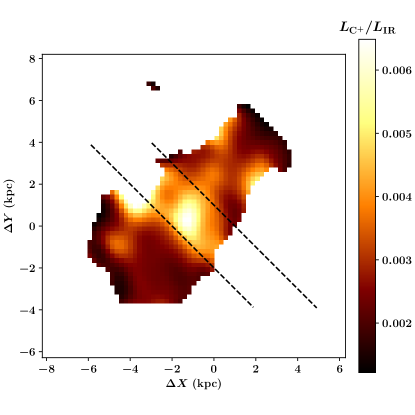
From the measurements in Table 1, we estimate the C+/IR luminosity ratio / which has been observed to anti-correlate with the IR surface density (e.g. Smith et al., 2017; Litke et al., 2019) yielding a [Cii] 158 m deficit in the most intensely star-forming regions. The / values for components A and B are consistent with the values derived from galaxies with modest SFRs (e.g., Capak et al., 2015). This supports the association of these components with individual, normal galaxies.
The integrated flux of central component C, however, shows a much higher / ratio: a factor of approximately two times higher than the integrated values for the other two components. This is illustrated in Figure 4 and Table 1. Referring to Figure 1, the [Cii] 158 m emission in this region is not substantially higher than that from components A or B; the high / ratio here is thus driven by low dust continuum emission (Fig. 3) and therefore a low value. Indeed, the ratio in component C lies close to an extrapolation of the relation between / and to lower values (see also Smith et al., 2017). This would imply either a dust-poor environment or, less likely, dust with a substantially lower temperature. It further suggests that the [Cii] 158 m emission in component C does not mainly arise from photo-dissociation regions but instead tracks primarily atomic or even ionized gas.
Elevated [Cii] 158 m luminosities relative to the dust emission have been reported for Lyman-break galaxies at , possibly due to lower internal dust-to-gas ratios (e.g. Capak et al., 2015). The galaxy, however, marks the first report of spatial variations within a system to such high / values. We propose that the gas in component C is material stripped from one (or both) of galaxies A and B. This leads to the picture of two merging, star-forming galaxies that have tidally interacted to pull gas into the region between them. This picture is supported by theoretical results on merging galaxies that predict significant tidal interactions when galaxies lie within kpc (Chilingarian et al., 2010) although a quantitative comparison is beyond the scope of this manuscript.
It is commonly assumed that merger events drive an enhanced SFR in gas-rich galaxies. This assertion has theoretical underpinnings (Mihos & Hernquist, 1996) and observational support, e.g., the frequent detection of multiple components in the most luminous sub-mm galaxies (Hayward et al., 2018). However, as noted above, components A and B have modest values and correspondingly modest SFRs: (A) and (B) . These values are consistent with the local correlation between SFR and [Cii] 158 m line luminosity (De Looze et al., 2011, 2014). We thus find no evidence for elevated star formation in this merger. Given that it was selected in absorption, we speculate that the elevated SFRs reported for other mergers may represent a selection bias.
3.2 On the origin of high DLAs
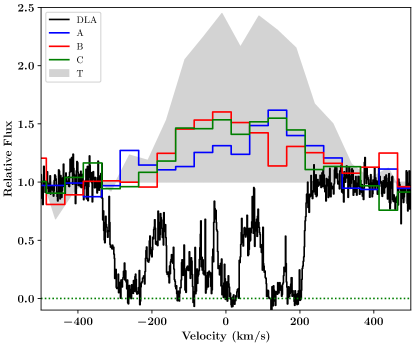
Figure 5 compares the line-of-sight velocity profiles of the three [Cii] 158 m components with a low-ionization metal-line absorption profile, each relative to . The velocity width of the metal-line absorption is extreme, , which we again emphasize was part of our selection criteria for the original ALMA search for [Cii] 158 m emission (Neeleman et al., 2017). Tellingly, the velocity profiles of the three [Cii] 158 m components span nearly the entire velocity width of DLA1201+2117_3.80. Specifically, these components correspond closely to the main complexes of the absorption profile. The only (possible) exception is the absorption at , which corresponds to of the total optical depth.
The close correspondence in kinematics between the galaxy’s [Cii] 158 m emission and the metal-line absorption suggests a causal relationship, i.e. that gas associated with the merging galaxies contributes to the DLA profile to yield its high . Indeed, a number of previous studies on DLA kinematics have asserted that the largest values of the distribution correspond to DLAs arising from multiple, merging galaxies (e.g. Prochaska & Wolfe, 1997; Maller et al., 2001; Pontzen et al., 2008; Bird et al., 2015).
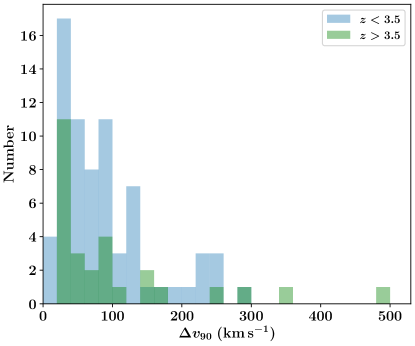
Figure 6 shows the distributions measured from high-resolution absorption studies of DLAs, and is restricted to systems without kinematic pre-selection (Neeleman et al., 2013; Rafelski et al., 2012). The median of each distribution lies at , which is predicted to reflect the gravitational potential of the dark matter halos hosting DLAs (Bird et al., 2015; Pérez-Ràfols et al., 2018). One notes further that the distribution is highly asymmetric, i.e. skewed with a tail to high values. The 90th percentile of the and distributions are and , respectively. These exceed the differential velocity that can be produced by a rotating disk, even with extreme thickness, inclination, and rotation speed (Prochaska & Wolfe, 1997). This has motivated interpretions involving multiple galaxies and mergers, to account for the high values (and the occasional call for non-gravitational motions, e.g. winds; Nulsen et al., 1998).
While DLA1201+2117_3.80 offers only a single example, the results described here support the merger interpretation for DLAs with the highest values. Evidence for companion galaxies at the DLA redshift was also obtained by Neeleman et al. (2019b) in another of our [Cii] 158 m emitters, at towards PSS 1443+2741, albeit with a slightly larger separation, kpc. This absorber too has a large value, (Neeleman et al., 2019b). Adopting this interpretation, it provides an explanation for why high- DLAs show a larger dispersion around the correlation between metallicity and DLA kinematics (Prochaska et al., 2008). It also tempers the need to introduce galactic-scale winds that accelerate neutral gas to speeds greatly exceeding the escape velocity.
3.3 Inferring the Major Merger Fraction
Having associated large values from DLAs with galaxy mergers, we proceed to use DLA statistics to roughly infer the (major) merger fraction of galaxies at . We make the ansatz that every DLA with tags an ongoing major merger. The ratio of the number of DLAs with to the total number of DLAs then immediately yields the fraction of DLAs undergoing a merger.
| (1) |
Taking , as inferred from the distributions in Fig. 6, we estimate and for and 4, respectively. Given that there would not be a sharp transition in on the occurence of a merger, we allow to range from to , and thus estimate the systematic uncertainty on these estimates.
Orientation and projection effects may yield for some mergers; one might hence adopt these values as lower limits to the DLA merger fraction. Conversely, it is possible that other physical processes contribute to large values, implying that the values are over-estimates. This could include minor mergers, although numerical simulations suggest that their contributions are small (Bird et al., 2015). We proceed with our nominal approach and emphasize that this yields only a coarse estimate of the major merger fraction. Analysis of simulations could constrain these effects; however, this is beyond the scope of this paper.
To roughly estimate the merger fraction of galaxies, one must account for the cross-sectional weighting that is inherent to DLA analysis, i.e. systems with a larger projected area whose Hi column density exceeds the DLA threshold have a higher probability of intersecting a quasar sightline. If the merger does not affect , then we expect the merging system to have , i.e. twice the area owing to the presence of two galaxies. This leads to an estimate for the fraction of galaxies undergoing a major merger: . Any enhancement due to the merger, e.g. from stripped gas as inferred for the system presented here, would require a downward correction. In the following, we include a systematic uncertainty to , corresponding to allowing to range from 2 to 4 .
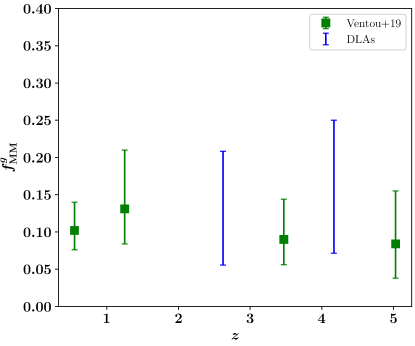
Figure 7 presents our first estimates of from DLA surveys (blue). These are presented as error intervals that express the large systematic uncertainties described above. They are compared with estimates of from the incidence of spectroscopically-confirmed galaxies with kpc and (green; Ventou et al., 2017). It is clear that our results are consistent with the directly observed merger fraction (Ventou et al., 2019), albeit with large systematic uncertainties. We do not observe the decrease in at higher redshifts, although our large systematics do not allow us to constrain the evolution with redshift.
4 Summary
We have used the ALMA Band-7 receivers to image, at kpc resolution, the [Cii] 158 m line and FIR dust-continuum emission from an absorption-selected galaxy at . The [Cii] 158 m and dust emission arise from at least three distinct source components lying within kpc (projected), two of which (components A and B) have / ratios consistent with values in high- galaxies with moderate SFRs, while the third (component C), has an elevated / ratio. The images are consistent with a scenario in which components A and B are normal star-forming galaxies separated by kpc and undergoing a major merger, while component C arises from gas that has been stripped from one or both of the galaxies. The velocity spread of the [Cii] 158 m emission is in good agreement with the large velocity spread of the low-ionization metal absorption lines, suggesting that the merger is likely to have caused the large value of the DLA.
This is the first clear evidence that some of the large values observed in DLAs arises from merging galaxies. We propose that major mergers at high redshifts can be identified in a luminosity-independent manner from the fraction of DLAs with large values. We use the distribution of DLAs at to roughly estimate the fraction of major mergers amongst normal high- galaxies , obtaining at and , consistent with independent estimates from recent VLT/MUSE studies (albeit with large systematic uncertainty).
_Gas).
NK acknowledges support from the Department of Science and Technology via a Swarnajayanti
Fellowship (DST/SJF/PSA-01/2012-13). NK thanks Aditya Chowdhury for discussion and the use of
his robust calibration routines for the analysis.
References
- Bell et al. (2006) Bell, E. F., Phleps, S., Somerville, R. S., Wolf, C., Borch, A., & Meisenheimer, K. 2006, ApJ, 652, 270
- Bird et al. (2015) Bird, S., Haehnelt, M., Neeleman, M., Genel, S., Vogelsberger, M., & Hernquist, L. 2015, MNRAS, 447, 1834
- Bundy et al. (2009) Bundy, K., Fukugita, M., Ellis, R. S., Targett, T. A., Belli, S., & Kodama, T. 2009, ApJ, 697, 1369
- Capak et al. (2015) Capak, P. L., et al. 2015, Nature, 522, 455
- Chilingarian et al. (2010) Chilingarian, I. V., Di Matteo, P., Combes, F., Melchior, A. L., & Semelin, B. 2010, A&A, 518, A61
- Cooke et al. (2010) Cooke, J., Berrier, J. C., Barton, E. J., Bullock, J. S., & Wolfe, A. M. 2010, MNRAS, 403, 1020
- De Looze et al. (2011) De Looze, I., Baes, M., Bendo, G. J., Cortese, L., & Fritz, J. 2011, MNRAS, 416, 2712
- De Looze et al. (2014) De Looze, I., et al. 2014, A&A, 568, A62
- Ellison et al. (2010) Ellison, S. L., Patton, D. R., Simard, L., McConnachie, A. W., Baldry, I. K., & Mendel, J. T. 2010, MNRAS, 407, 1514
- Hayward et al. (2018) Hayward, C. C., et al. 2018, MNRAS, 476, 2278
- Jogee et al. (2009) Jogee, S., et al. 2009, ApJ, 697, 1971
- Litke et al. (2019) Litke, K. C., et al. 2019, ApJ, 870, 80
- López-Sanjuan et al. (2013) López-Sanjuan, C., et al. 2013, A&A, 553, A78
- Lotz et al. (2008) Lotz, J. M., et al. 2008, ApJ, 672, 177
- Maller et al. (2001) Maller, A. H., Prochaska, J. X., Somerville, R. S., & Primack, J. R. 2001, MNRAS, 326, 1475
- Mantha et al. (2018) Mantha, K. B., et al. 2018, MNRAS, 475, 1549
- Mihos & Hernquist (1996) Mihos, J. C., & Hernquist, L. 1996, ApJ, 464, 641
- Naab & Burkert (2003) Naab, T., & Burkert, A. 2003, ApJ, 597, 893
- Neeleman et al. (2019a) Neeleman, M., et al. 2019a, ApJ, 882, 10
- Neeleman et al. (2017) Neeleman, M., Kanekar, N., Prochaska, J. X., Rafelski, M., Carilli, C. L., & Wolfe, A. M. 2017, Science, 355, 1285
- Neeleman et al. (2019b) Neeleman, M., Kanekar, N., Prochaska, J. X., Rafelski, M. A., & Carilli, C. L. 2019b, ApJ, 870, L19
- Neeleman et al. (2020) Neeleman, M., Prochaska, J. X., & Kanekar, N. an dRafelski, M. A. 2020, Science, submitted, xxx
- Neeleman et al. (2013) Neeleman, M., Wolfe, A. M., Prochaska, J. X., & Rafelski, M. 2013, ApJ, 769, 54
- Nulsen et al. (1998) Nulsen, P. E. J., Barcons, X., & Fabian, A. C. 1998, MNRAS, 301, 168
- Olivares et al. (2016) Olivares, V., et al. 2016, ApJ, 827, 57
- Patton et al. (2000) Patton, D. R., Carlberg, R. G., Marzke, R. O., Pritchet, C. J., da Costa, L. N., & Pellegrini, P. S. 2000, ApJ, 536, 153
- Patton et al. (2011) Patton, D. R., Ellison, S. L., Simard, L., McConnachie, A. W., & Mendel, J. T. 2011, MNRAS, 412, 591
- Patton et al. (1997) Patton, D. R., Pritchet, C. J., Yee, H. K. C., Ellingson, E., & Carlberg, R. G. 1997, ApJ, 475, 29
- Pérez-Ràfols et al. (2018) Pérez-Ràfols, I., Miralda-Escudé, J., Arinyo-i-Prats, A., Font-Ribera, A., & Mas-Ribas, L. 2018, MNRAS, 480, 4702
- Planck Collaboration et al. (2016) Planck Collaboration et al. 2016, A&A, 594, A13
- Pontzen et al. (2008) Pontzen, A., et al. 2008, MNRAS, 390, 1349
- Prochaska et al. (2008) Prochaska, J. X., Chen, H.-W., Wolfe, A. M., Dessauges-Zavadsky, M., & Bloom, J. S. 2008, ApJ, 672, 59
- Prochaska et al. (2005) Prochaska, J. X., Herbert-Fort, S., & Wolfe, A. M. 2005, ApJ, 635, 123
- Prochaska & Wolfe (1997) Prochaska, J. X., & Wolfe, A. M. 1997, ApJ, 487, 73
- Rafelski et al. (2012) Rafelski, M., Wolfe, A. M., Prochaska, J. X., Neeleman, M., & Mendez, A. J. 2012, ApJ, 755, 89
- Rodríguez-Puebla et al. (2017) Rodríguez-Puebla, A., Primack, J. R., Avila-Reese, V., & Faber, S. M. 2017, MNRAS, 470, 651
- Smith et al. (2017) Smith, J. D. T., et al. 2017, ApJ, 834, 5
- Somerville et al. (2001) Somerville, R. S., Primack, J. R., & Faber, S. M. 2001, MNRAS, 320, 504
- Treister et al. (2010) Treister, E., Natarajan, P., Sand ers, D. B., Urry, C. M., Schawinski, K., & Kartaltepe, J. 2010, Science, 328, 600
- Ventou et al. (2017) Ventou, E., et al. 2017, A&A, 608, A9
- Ventou et al. (2019) —. 2019, arXiv e-prints, arXiv:1909.03706
- Wolfe et al. (2005) Wolfe, A. M., Gawiser, E., & Prochaska, J. X. 2005, ARA&A, 43, 861
- Xu et al. (2012) Xu, C. K., Zhao, Y., Scoville, N., Capak, P., Drory, N., & Gao, Y. 2012, ApJ, 747, 85