Overcoming detection loss and noise in squeezing-based optical sensing
Among the known resources of quantum metrology, one of the most practical and efficient is squeezing. Squeezed states of atoms and light improve the sensing of the phase, magnetic field, polarization, mechanical displacement. They promise to considerably increase signal-to-noise ratio in imaging and spectroscopy, and are already used in real-life gravitational-wave detectors. But despite being more robust than other states, they are still very fragile, which narrows the scope of their application. In particular, squeezed states are useless in measurements where the detection is inefficient or the noise is high. Here, we experimentally demonstrate a remedy against loss and noise: strong noiseless amplification before detection. This way, we achieve loss-tolerant operation of an interferometer fed with squeezed and coherent light. With only 50% detection efficiency and with noise exceeding the level of squeezed light more than 50 times, we overcome the shot-noise limit by 6 dB. Sub-shot-noise phase sensitivity survives up to 87% loss. Application of this technique to other types of optical sensing and imaging promises a full use of quantum resources in these fields.
Quantum resources promise advances in sensing and metrology (Giovannetti et al., 2004; Mitchell et al., 2004; Nagata et al., 2007; Resch et al., 2007; Degen et al., 2017; Pezzè et al., 2018; Wolf et al., 2019), beyond the fundamental limits of precision set for classical light. They enable overcoming the shot-noise limit (SNL) and achieving the ultimate Heisenberg limit in phase sensing (Demkowicz-Dobrzański et al., 2015). Within the quantum states toolbox, most practical are squeezed states. Unlike exotic non-Gaussian states, squeezed states of atoms and light can contain a macroscopic number of particles and survive a reasonable amount of loss while providing reduced uncertainty in a plethora of measurements. As a result, their use noticeably improved the sensitivity of modern gravitational-wave detectors (The LIGO Scientific Collaboration, 2011; Barsotti et al., 2018; Tse et al., 2019; Acernese et al., 2019). There are also numerous proof-of-principle experiments on squeezing-enhanced absorption measurement and spectroscopy (Polzik et al., 1992; Whittaker et al., 2017; Moreau et al., 2017), imaging and microscopy (Brida et al., 2010; Taylor et al., 2014; Samantaray et al., 2017; Sabines-Chesterking et al., 2019), polarimetry (Feng and Pfister, 2004), magnetometry (Wolfgramm et al., 2010; Lucivero et al., 2016), and other types of sensing (Treps et al., 2002; Lawrie et al., 2019).
Although more robust than non-Gaussian states, squeezed states are still very susceptible to loss. Therefore, overcoming the SNL in optical sensing requires extremely efficient detection (Eberle et al., 2010; Samantaray et al., 2017). The quantum advantage provided by squeezing strongly depends on the detection efficiency (Demkowicz-Dobrzański et al., 2013; Manceau et al., 2017a; Knyazev et al., 2019), and completely disappears for . Similarly, detection noise becomes a problem if the probing state is not very bright. In spectral ranges where detection is inefficient or noise is high, sub-shot-noise optical sensing is impossible.
Here we experimentally demonstrate a solution to this problem, namely strong parametric amplification of the signal before detection. Although proposed long ago (Caves, 1981) and already applied to the detection of microwave quantum states (Mallet et al., 2011), to the improvement of the homodyne detection bandwidth (Shaked et al., 2018), to the tomography of optical non-Gaussian states (Le Jeannic et al., 2018), and to atom interferometry (Hosten et al., 2016), this method has not been implemented in optical sensing. A similar principle provides loss tolerance of so-called SU(1,1) (nonlinear) interferometers (Yurke et al., 1986; Ou, 2012; Manceau et al., 2017b), both optical and atomic. But SU(1,1) has certain limitations, among them, a narrow range of phase sensitivity (Manceau et al., 2017a) and more complexity in realization, at least in the multimode version. For making phase measurement loss- and noise-tolerant, much more practical is to add an amplifier to the output of a linear [SU(2)] interferometer. This is what we do in our experiment; the same method can be applied to sub-shot-noise imaging and absorption measurement.
I Results
The principle is illustrated in Fig. 1 showing a Mach-Zehnder interferometer as an example. In classical interferometry (a), coherent light is fed into one input port, and direct or homodyne detection is performed in one output port in order to sense a phase difference between the two arms. The best sensitivity is achieved in the ‘dark fringe’, with no light in the output port. This becomes clear by looking at the Wigner function of the output state. In panel b, it is plotted for for the input coherent state containing photons. Whenever the output states are well separated, the phase sensitivity is high; this happens around . The phase can be retrieved by measuring the quadrature (homodyne detection) or the number of photons (direct detection).
To increase the phase sensitivity, a squeezed vacuum state is injected into the unused input port (Caves, 1981; Xiao et al., 1987; Grangier et al., 1987; Schäfermeier et al., 2018) (Fig. 1 c). Then, under the ‘dark fringe’ condition , the detected output port contains the squeezed vacuum ( dB squeezing is assumed). As the phase changes from to , the output state evolves to a coherent state (Fig. 1 d). Near the ‘dark fringe’, the states are squeezed in the quadrature and therefore better distinguishable. However, if the detection is lossy (we assume ), the squeezing is degraded, the states overlap, and the advantage of squeezing is fully or partly lost.
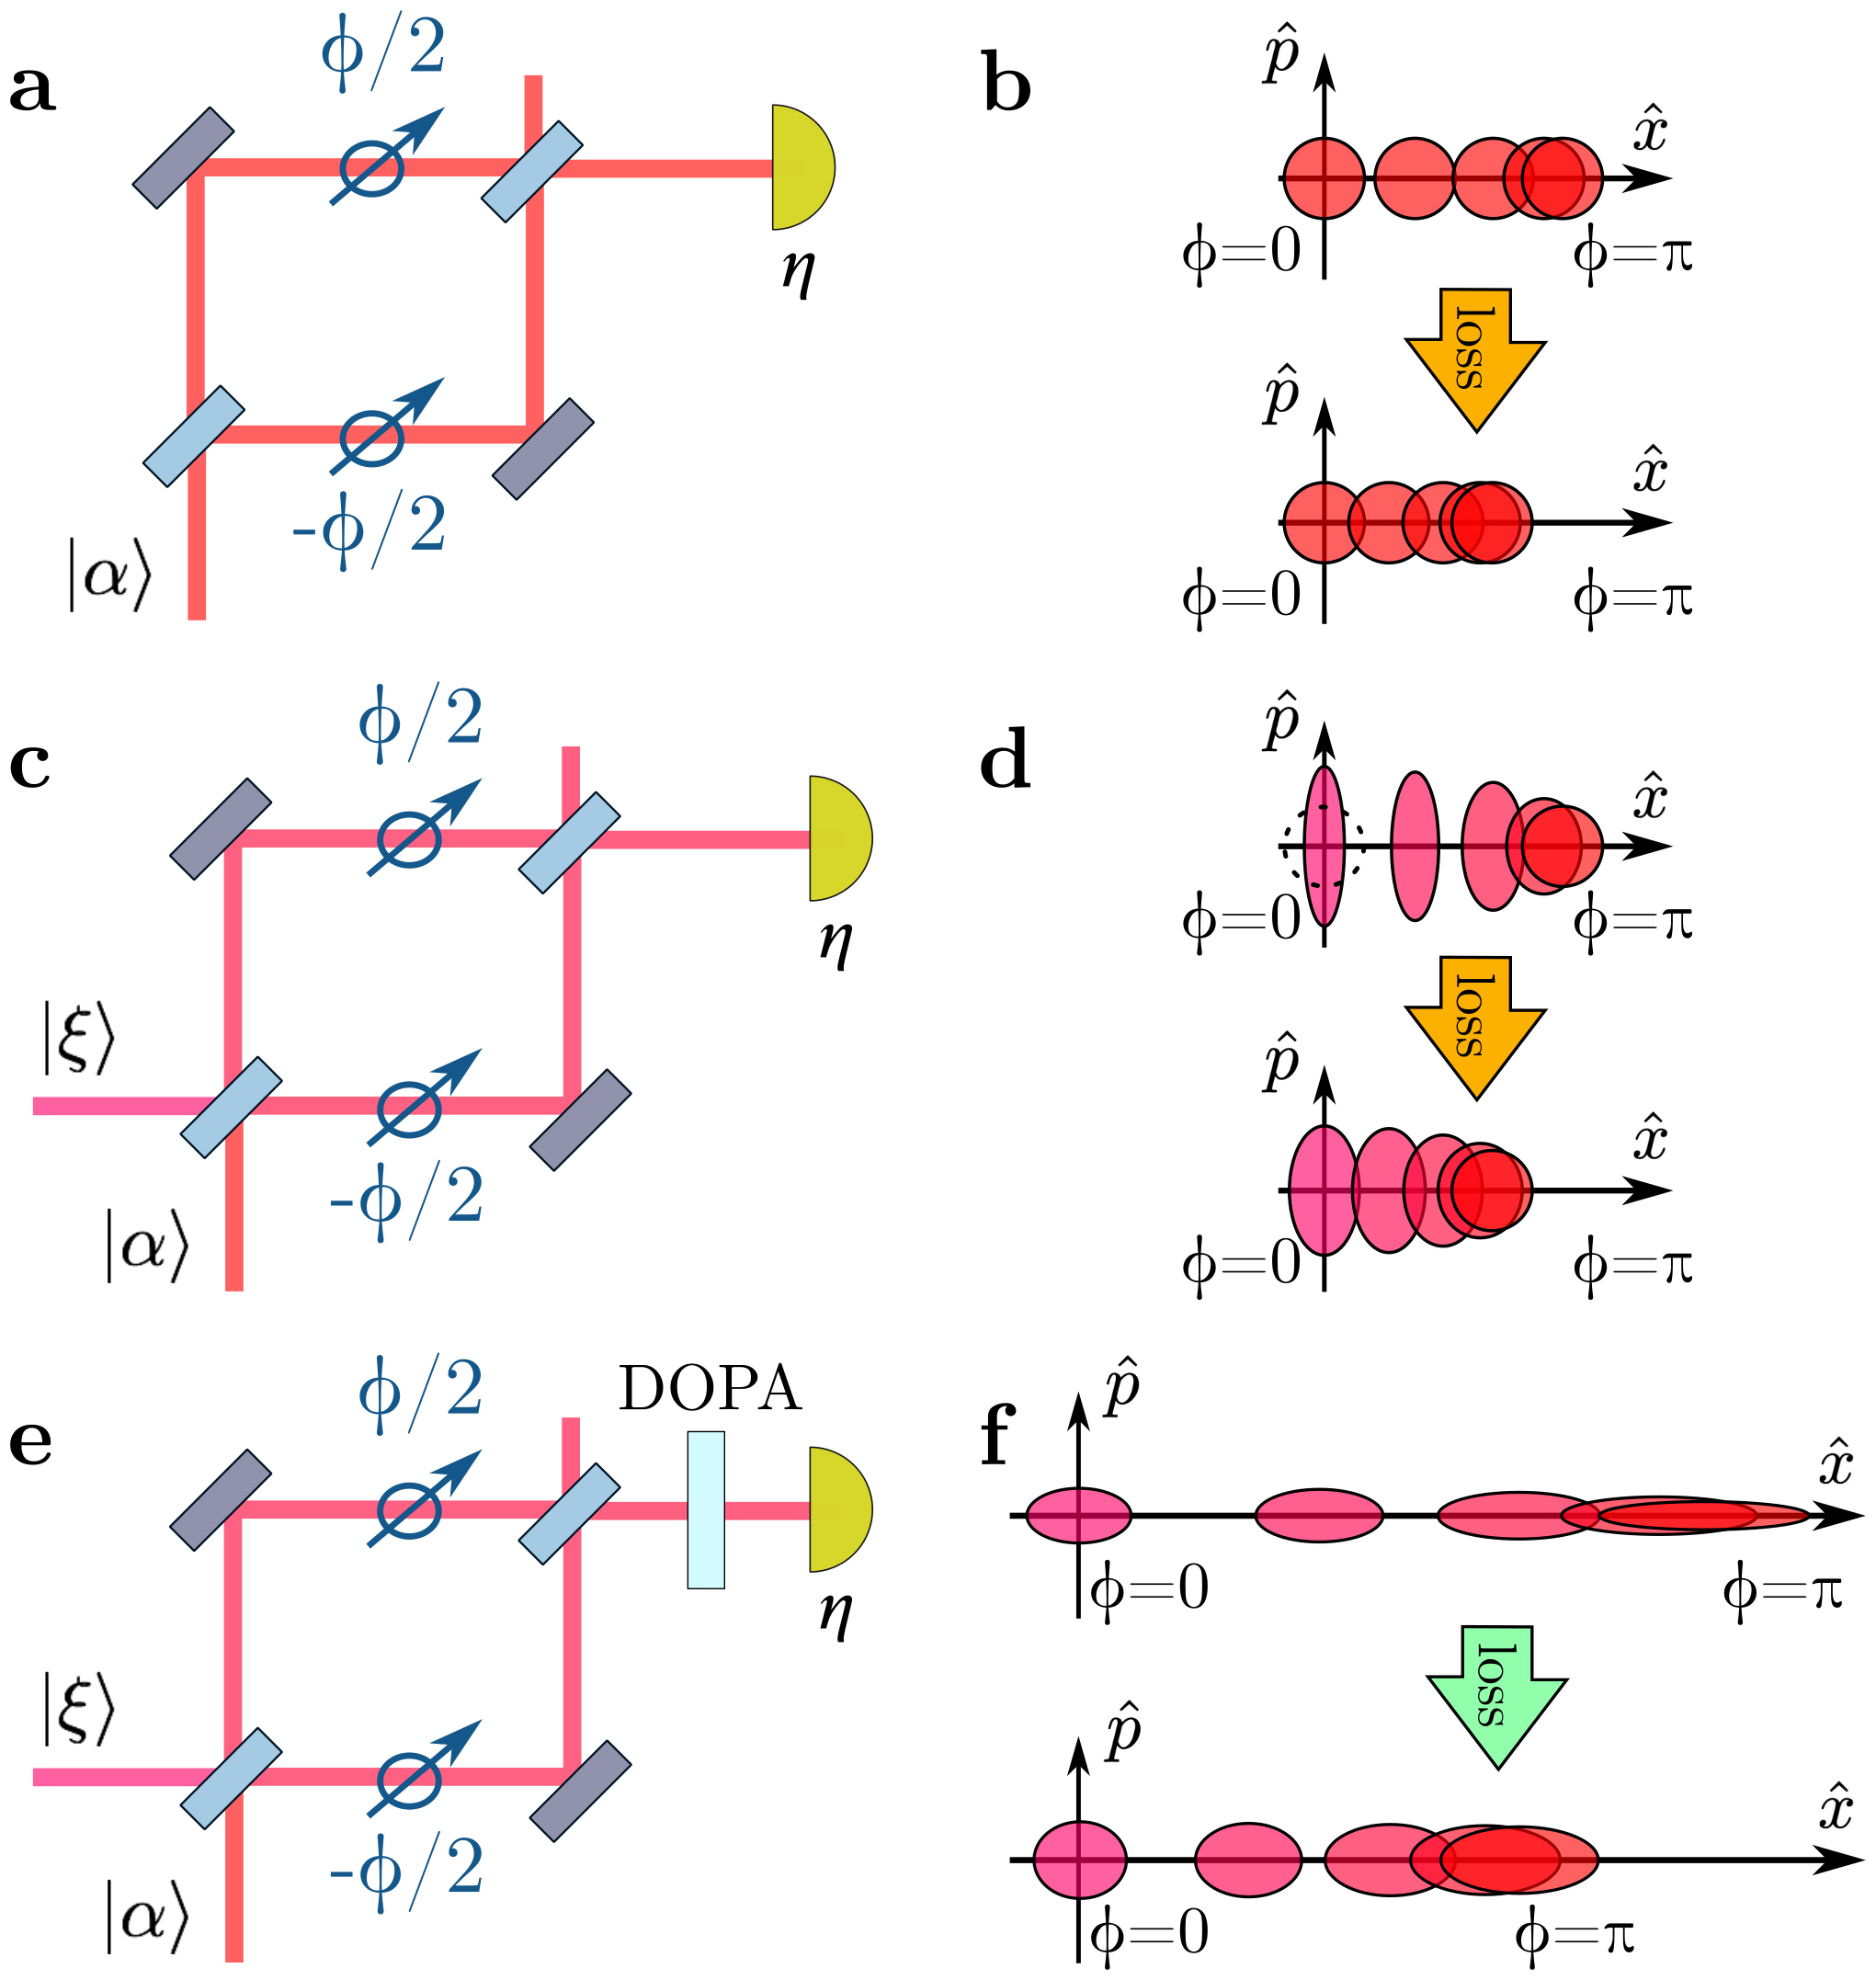
As a remedy, the state at the output of the interferometer is amplified by a phase sensitive amplifier (a degenerate optical parametric amplifier, DOPA), see Fig. 1 e. The DOPA amplifies the quadrature carrying the phase information, but it also makes this quadrature anti-squeezed. The relative separation of the states at the output (Fig. 1 f) remains the same, but the phase information is now in the anti-squeezed quadrature and therefore less susceptible to loss. In the calculation, quadrature anti-squeezing of dB completely eliminates the effect of loss; as we will see below, experiment provides even stronger amplification and a much higher loss can be overcome. If strong enough, amplification also protects the measurement against the detection noise. Importantly, a DOPA does not change the signal-to-noise ratio of the input state and therefore does not add noise.
In our experiment, we provide strong phase-sensitive parametric amplification with a nonlinear beta-barium borate (BBO) crystal pumped by picosecond pulses under collinear frequency-degenerate type-I phasematching. The amplification is defined by the squeeze factor , where is the length of the nonlinear crystal, its second-order susceptibility, and the pump power (Iskhakov et al., 2012). The quadratures after such an amplifier evolve as , and the mean photon number of a coherent state, as . Generally, we can achieve up to (Iskhakov et al., 2012). The current experiment uses squeeze factors only up to , which still means impressive -fold intensity amplification and dB quadrature variance anti-squeezing.
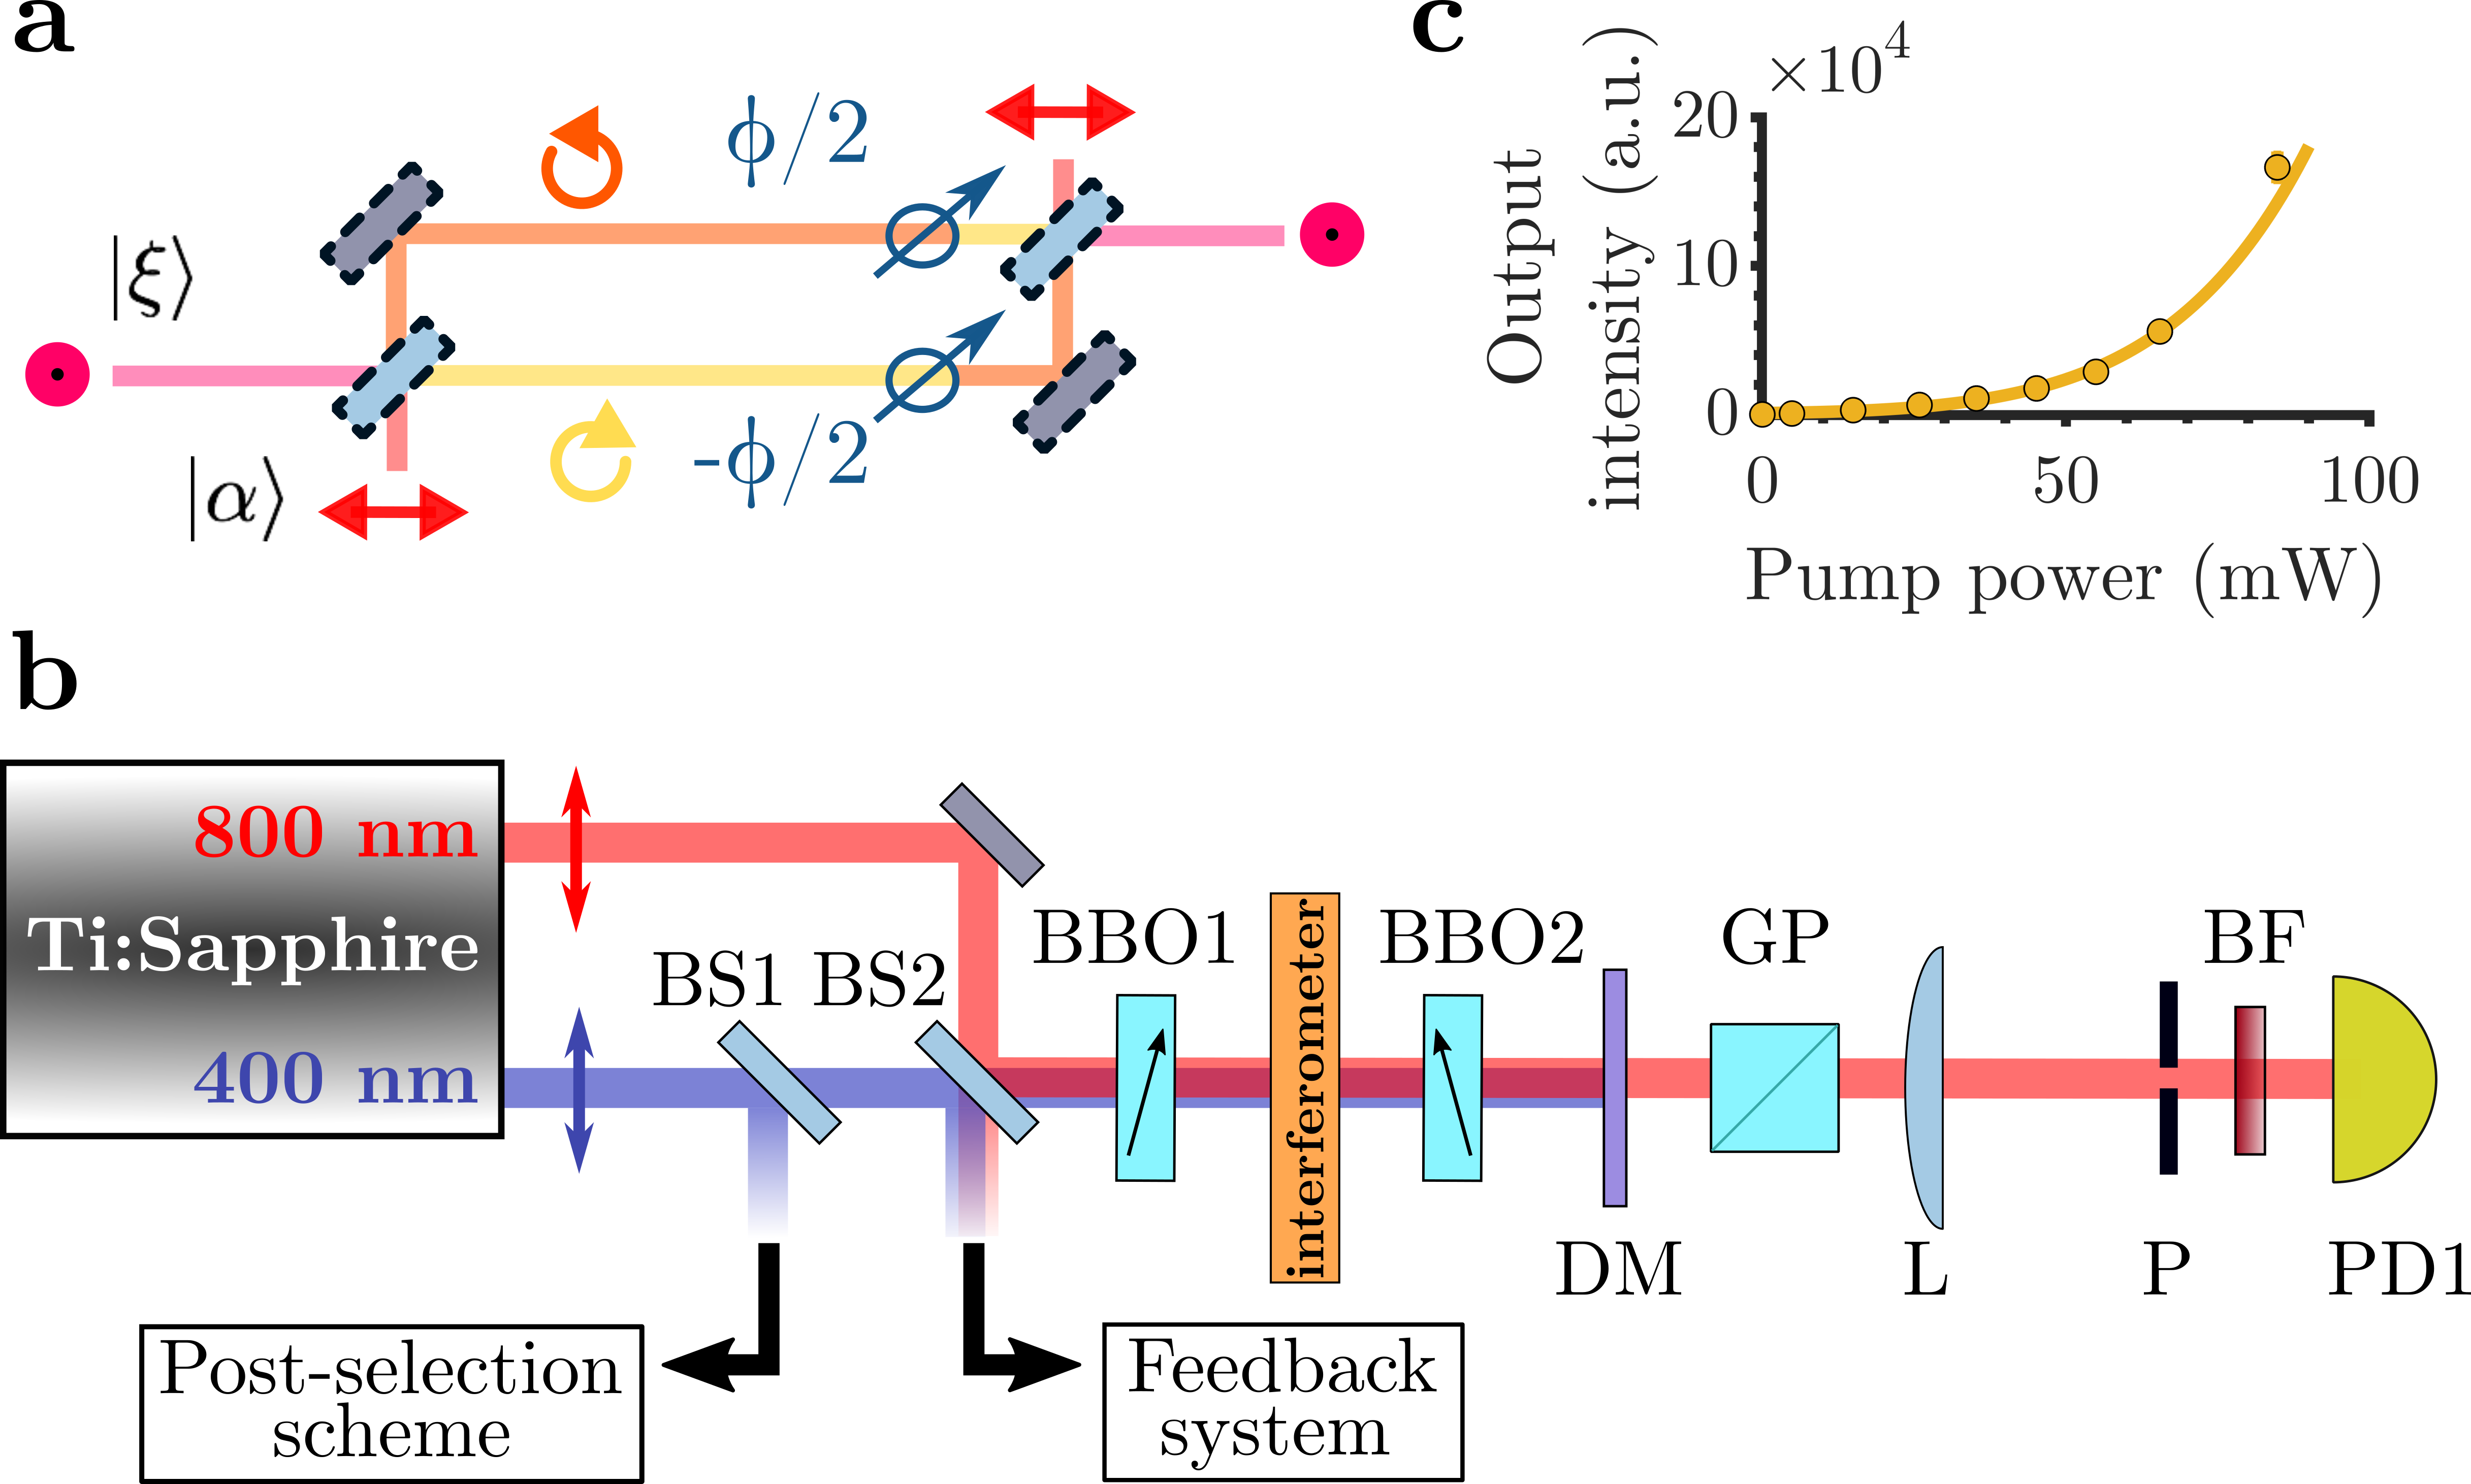
In our proof-of-principle implementation, the interferometer is simulated by a half-wave plate (HWP) (Schäfermeier et al., 2018), see Fig. 2 a. Instead of two spatial modes, the two arms of the interferometer are the right- and left-circularly polarized modes, and rotation of the HWP leads to a phase shift between them (see Methods). The inputs and outputs of the interferometer are linear polarization modes. The coherent state is the radiation of a Spectra Physics Spitfire Ace laser with the central wavelength nm, ps pulse duration, kHz repetition rate, horizontally polarized (Fig. 2 b), attenuated to photons/pulse. The squeezed vacuum (SV), produced in the first amplifier BBO1 pumped by the second harmonic of the same laser and unseeded, is vertically polarized. The coherent beam, injected through beamsplitter BS2, does not interact with BBO1 because there is no phase matching for its polarization. The output amplifier BBO2 amplifies only the vertical polarization mode 111The de-amplification phase is set by properly choosing the distance between the two crystals Manceau et al. (2017b), while the amplification phase of the coherent beam is set with a piezoelectric actuator (Sec. II of the Supplemental Material).. The pump is rejected with dichroic mirror DM and the vertical polarization is selected by Glan polarizer GP. To ensure good de-amplification of the SV, we select an angular bandwidth of with pinhole P in the focal plane of lens L (). The bandpass filter BF has nm spectral bandwidth around the central wavelength nm. Photodetector PD1 registers the number of photons per pulse, with a dark noise of photons.
The loss between BBO1 and BBO2 (internal) amounts to and is impossible to compensate for. The loss after the amplifier (‘detection loss’) is incorporated into the detection efficiency (for the detailed description of losses, see Sec. III of the Supplemental Material). Please note that spatial and spectral filtering, i.e. the pinhole and the bandpass filter, restricts the amount of photons detected but cannot be considered as loss since all the measurements are carried out within the same bandwidths. Meanwhile, the optical transmission of the bandpass filter within the spectral bandwidth is taken into account. The amplification at the interferometer output, if strong enough, can completely overcome the detection inefficiencies. Both the amplification of BBO2 and the squeezing of BBO1 are characterized by measuring the photon numbers at their outputs with a vacuum at the input (see Methods and Fig. 2 c). In all measurements, (measured as described in Methods), from which an initial dB level of squeezing is inferred.
Beamsplitters BS1 and BS2 serve, respectively, for monitoring/stabilizing the pump intensity (Methods) and locking the phase between the coherent and SV beams at the input of the HWP (Sec. II of the Supplemental Material).
The phase sensitivity is evaluated as
| (1) |
where is the measured uncertainty of the photon number, detector dark noise included, and is the average number of photons. The slope of the dependence is inferred from the fit.
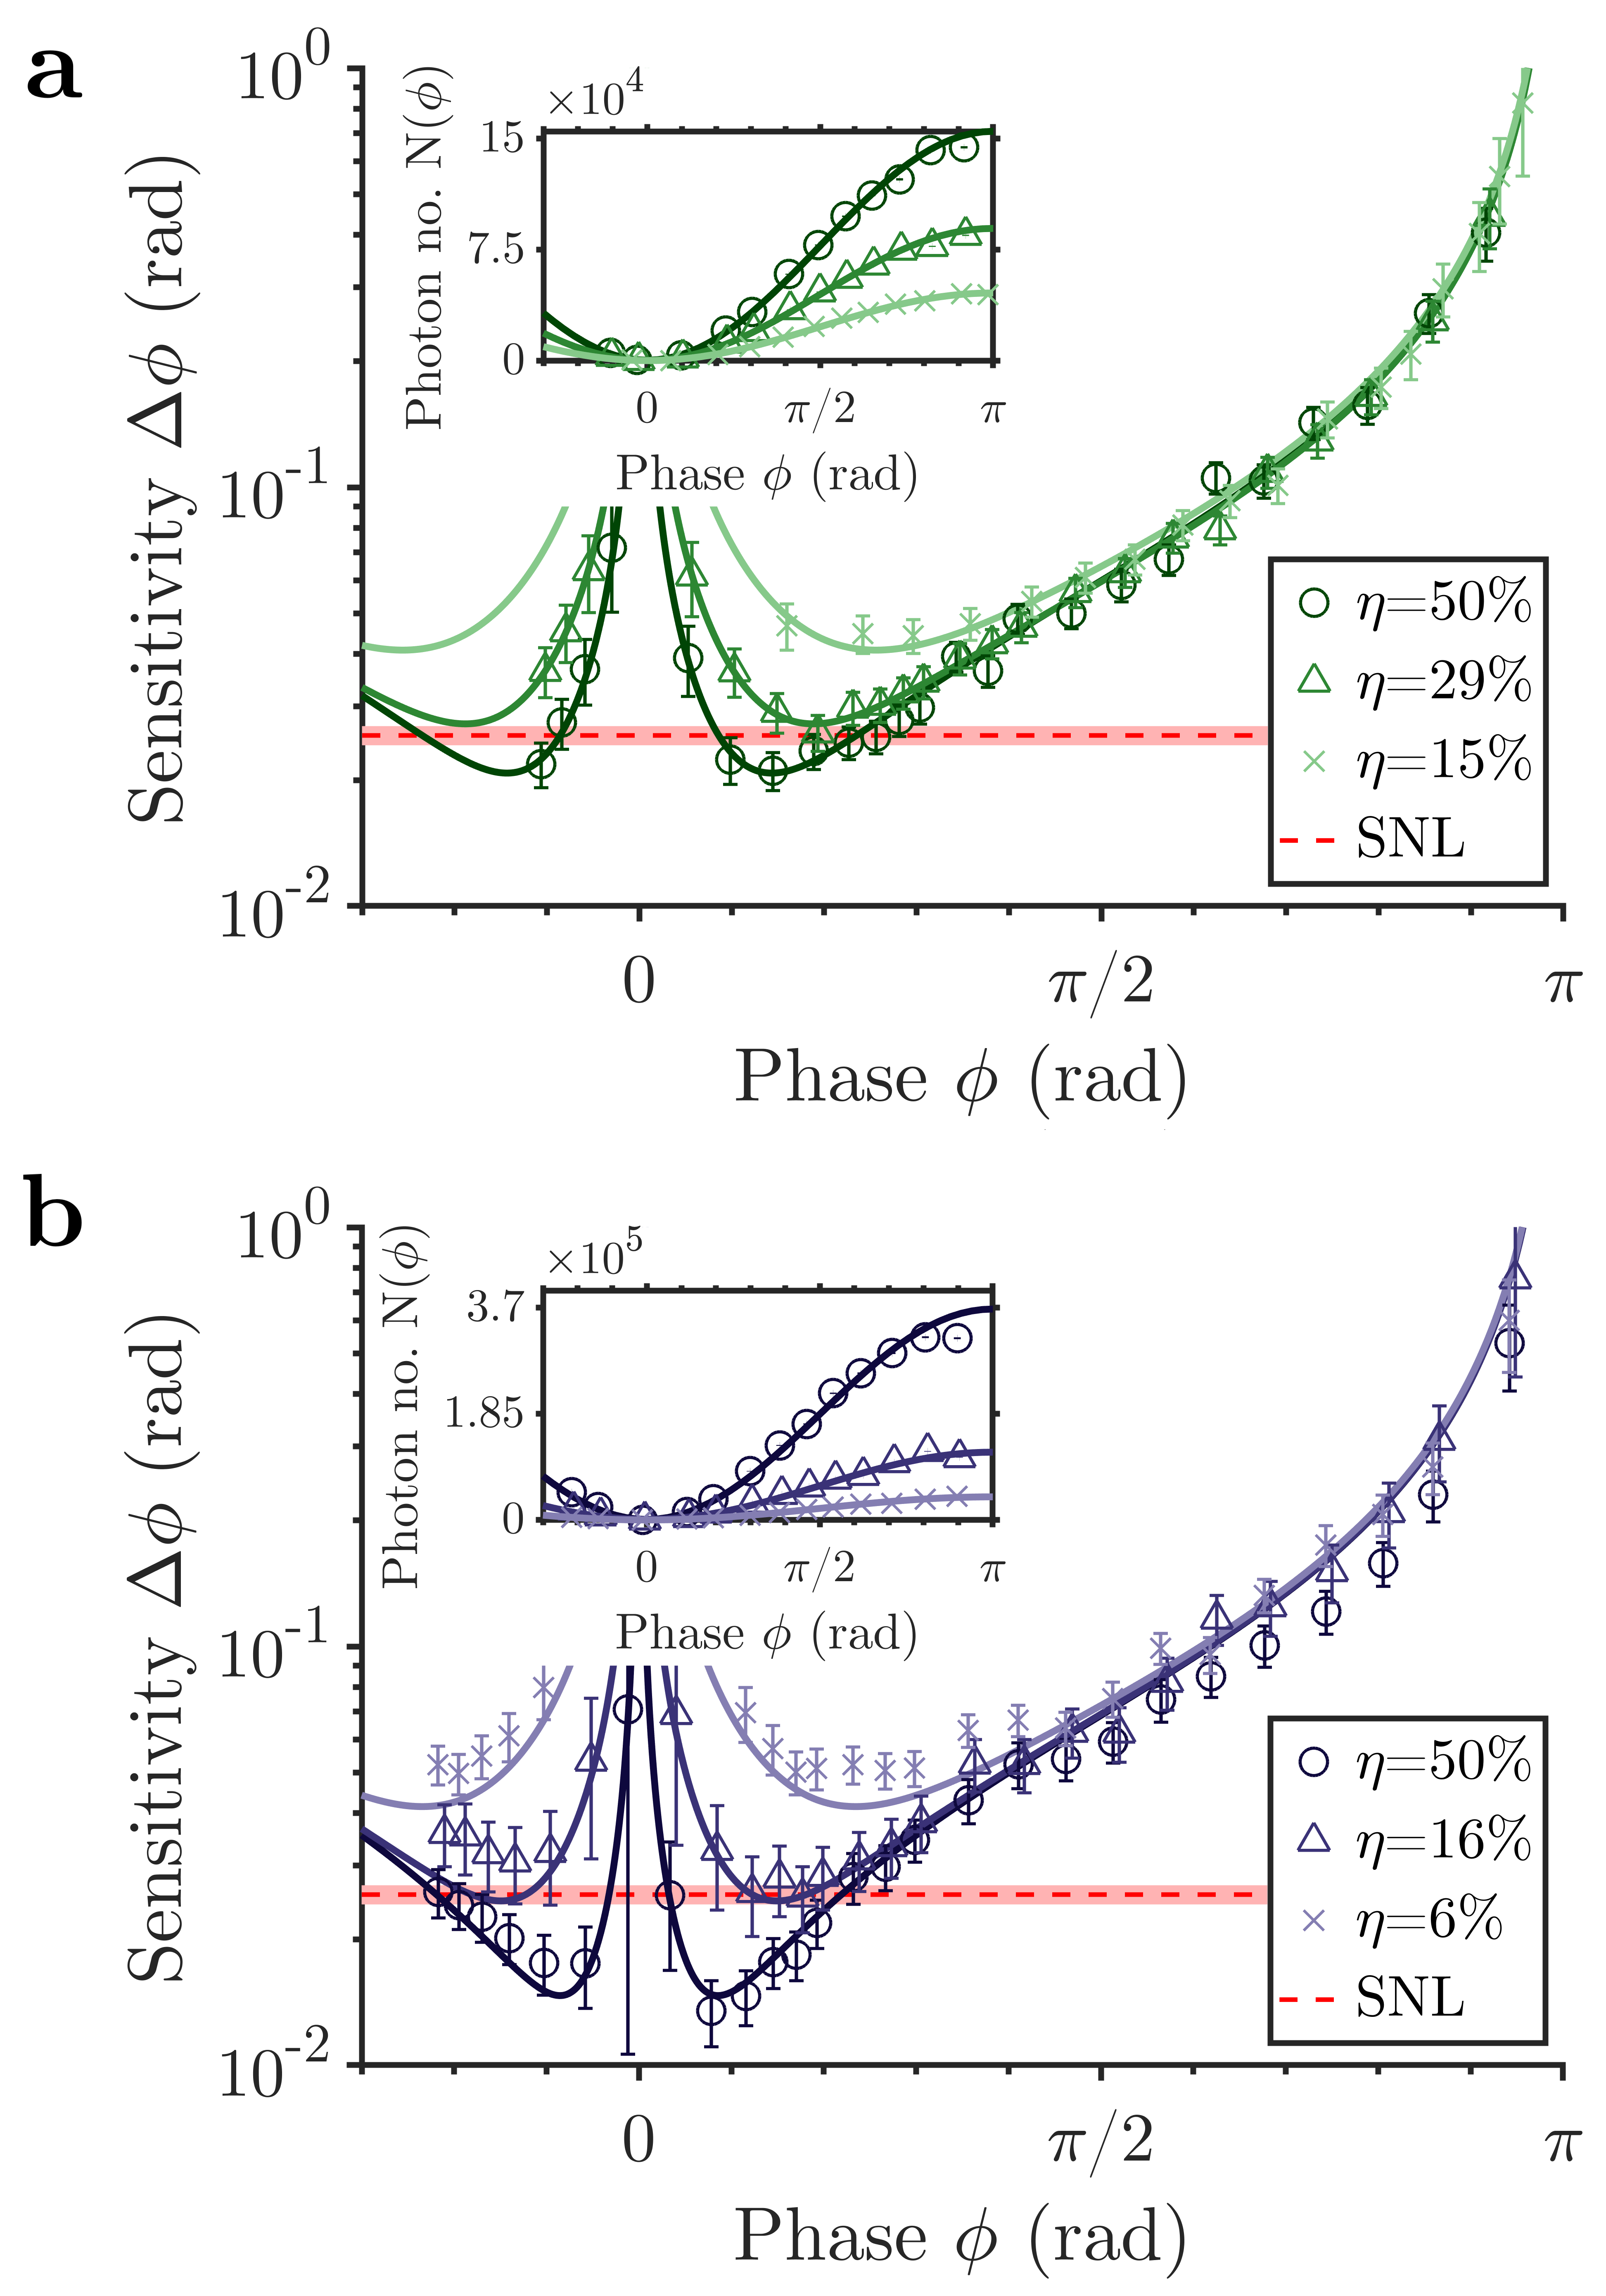
Figure 3 shows the results of phase sensitivity measurements, with the SNL (measured as described in Methods) marked with a dashed red line. In panel a, the second amplifier has the squeeze factor measured to be (photon-number amplification times) and the detection efficiency is and . To vary , we place a HWP and a GP (not shown in Fig. 2) before lens L. For the highest efficiency (circles), the SNL variance is overcome by dB in the best case, i.e. at . Note that without the output amplifier, the phase sensitivity would not overcome the SNL at all, in particular due to the large detection noise. With the amplifier, the performance just overcomes the SNL for detection efficiency (triangles). Exactly at , the average number of photons is the lowest and the detector dark noise spoils the sensitivity, hence the peak.
By increasing the output parametric amplification (the measured squeeze factor ), the phase sensitivity is improved (Fig. 3 b). The measurements shown with circles, triangles and crosses correspond, respectively, to detection efficiencies and . For the highest value of , the SNL variance is overcome by dB. In addition, with lower detection efficiency we need a stronger amplification for overcoming SNL. Indeed, while it is for lower (a), for higher it is only (b).
To fit the experimental points, we derive the phase sensitivity for a lossy squeezing-assisted interferometer with an OPA at the output and direct detection (Manceau et al., 2017a). The model also takes into account the relative excess noise of the coherent beam, i.e. deviation of the normalised second-order correlation function from unity (see Secs. IV-V of the Supplemental Material), which we measured to be . We use two fitting parameters and for the model (lines), in reasonable agreement with the experiment for and (a) and for and (b).
Ideally, the sub-shot-noise sensitivity phase range should cover half of the period (Manceau et al., 2017a). In our case, it is at most in panel a and in panel b. The main reason is that our coherent beam is not shot-noise limited. Additionally, the detector dark noise excludes part of this range near . But even with these imperfections, the sub-shot-noise sensitivity range is broader than the one of the SU(1,1) interferometer (Manceau et al., 2017b; Anderson et al., 2017).
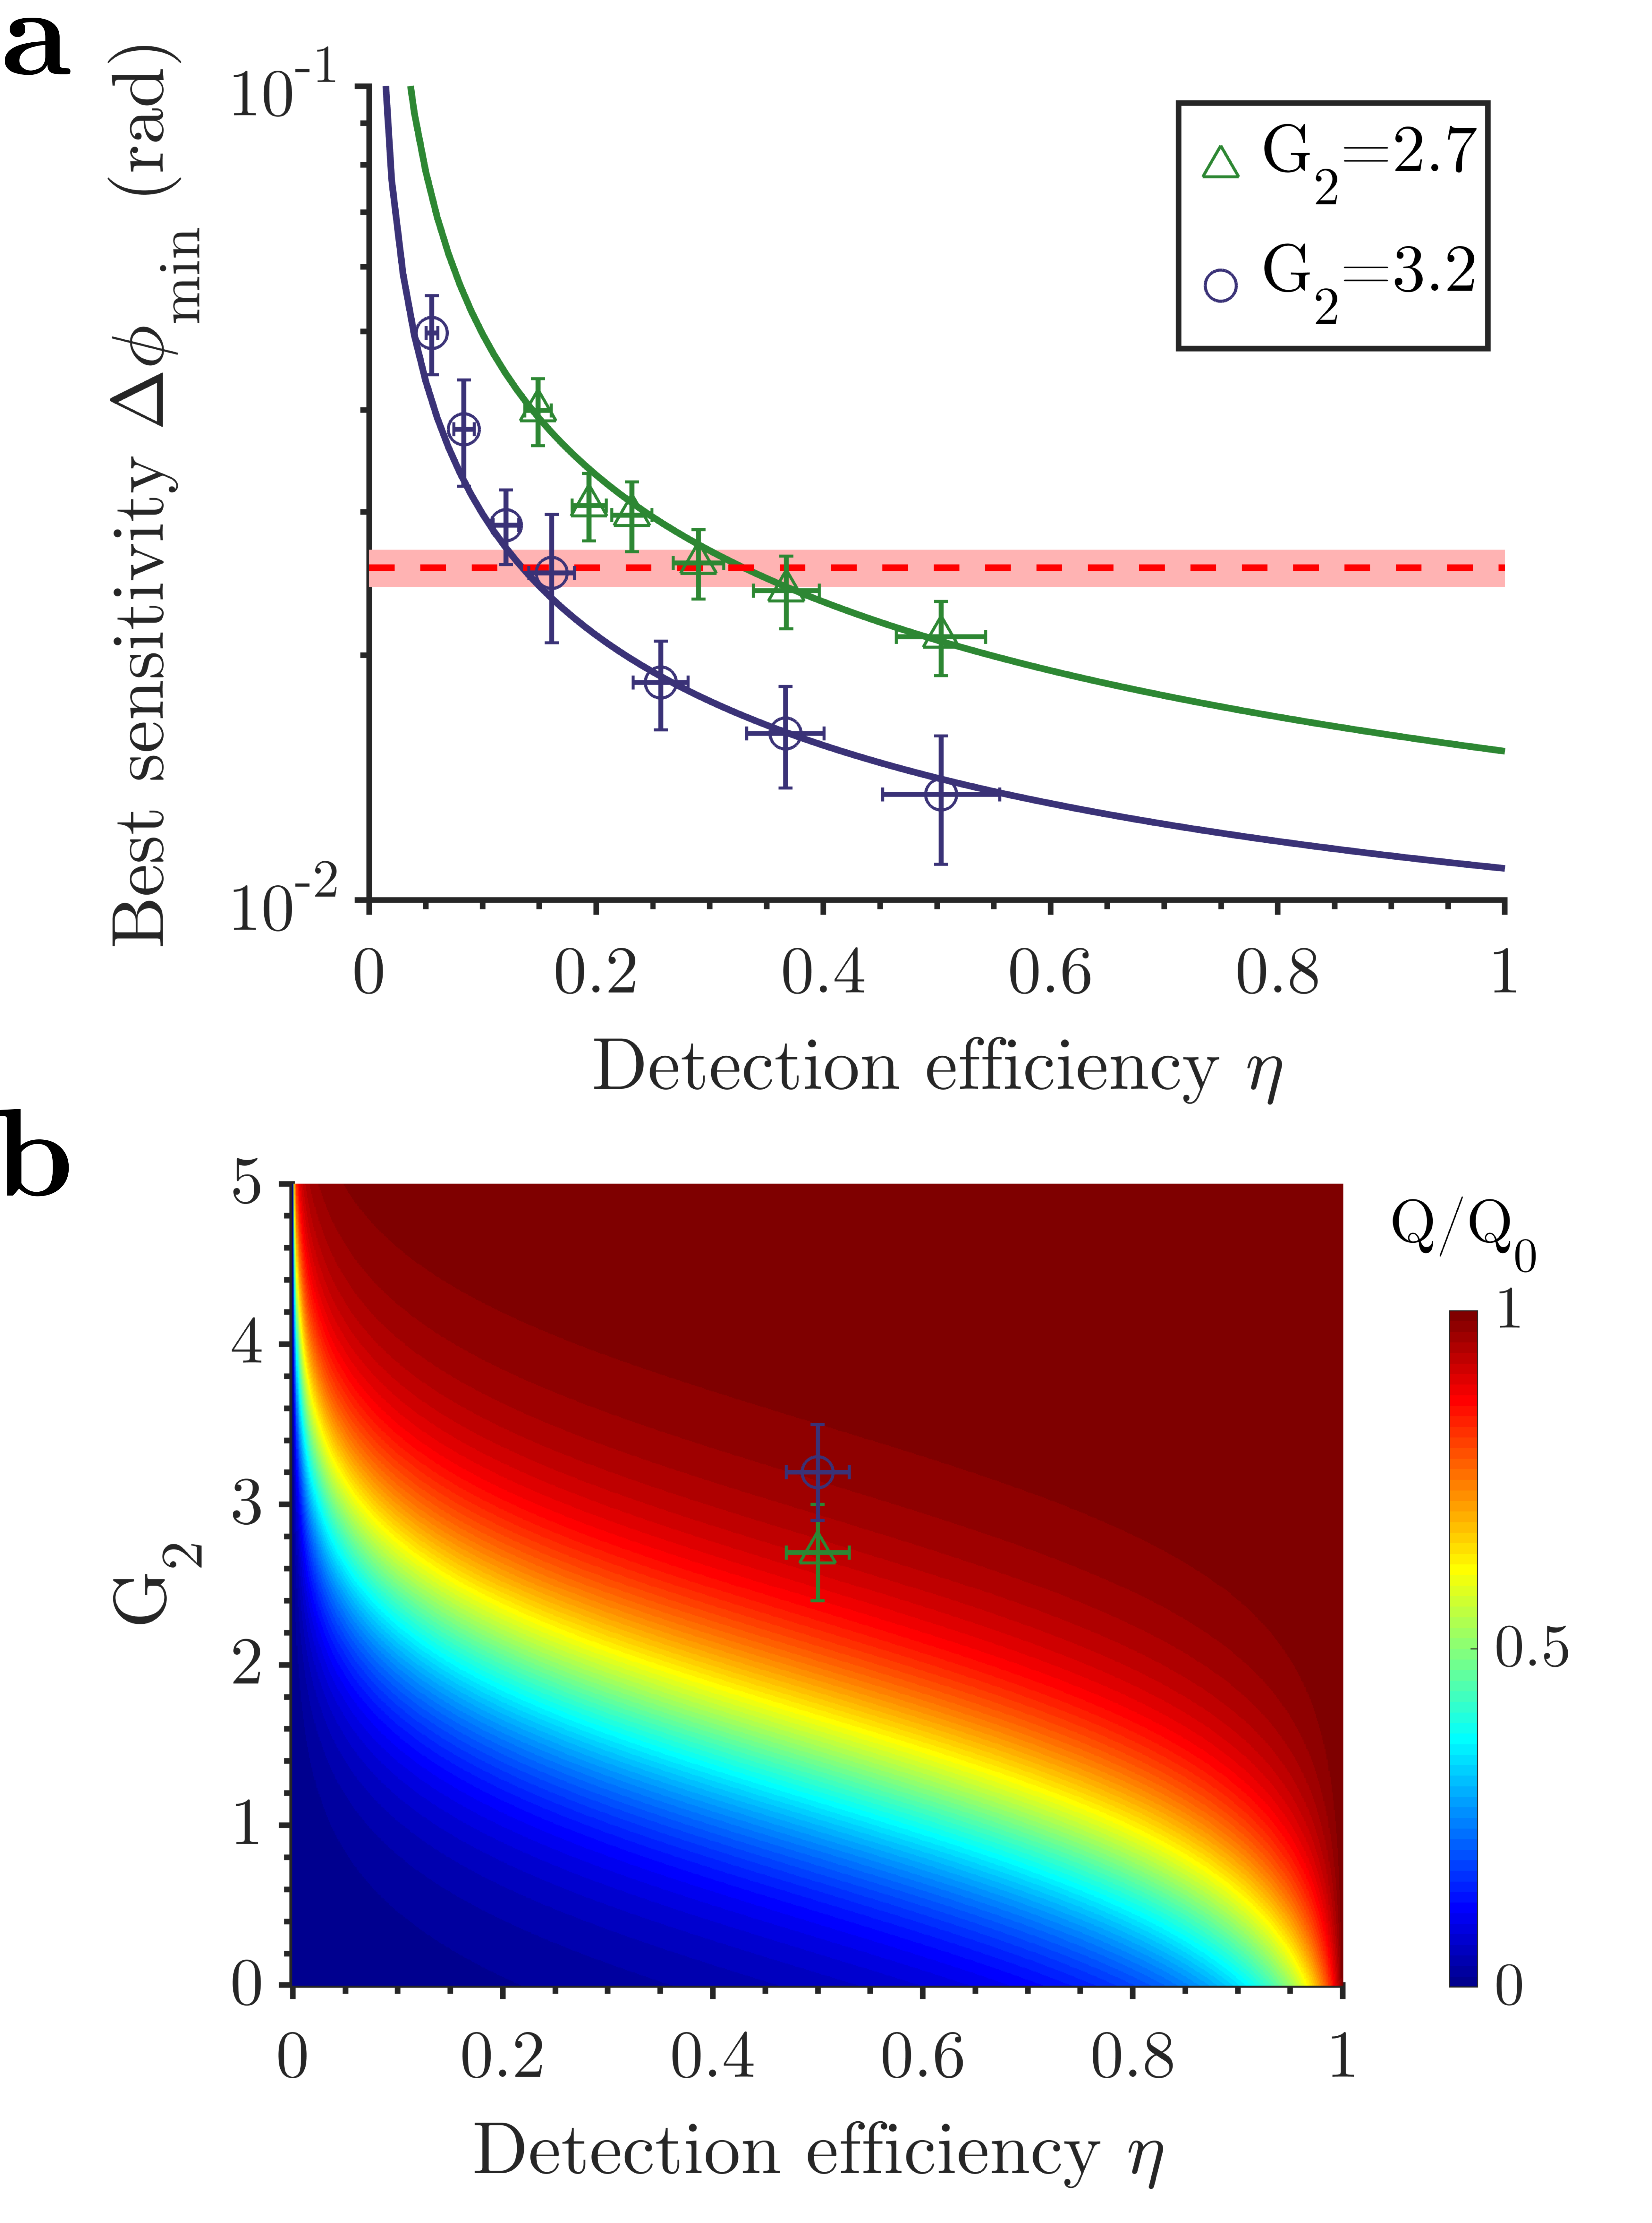
To demonstrate tolerance to detection inefficiency, Fig. 4 a shows the best phase sensitivity versus the detection efficiency . The photon number for the coherent beam and the input squeezing are kept constant; the common SNL is marked with a red dashed line. We observe that with (green triangles), the system provides sub-shot-noise sensitivity for . For (blue circles), the best sensitivity proves more robust and overcomes the SNL for .
For any detection efficiency, by increasing one can get as close as necessary to perfect-detection performance. Indeed, with an account for amplification, the quantum advantage in phase sensitivity is
| (2) |
where is the quantum advantage under perfect detection (Manceau et al., 2017a) and the internal loss. Figure 4 b shows , where is determined by the initial dB squeezing and % internal loss, as a function of and . Blue and green points mark the parameters of our experiment. For very low detection efficiency, the required amplification can be unrealistically high, but , easily achievable in experiment (Iskhakov et al., 2012; Manceau et al., 2017b), already enables overcoming loss.
Noteworthy, the detection of pulsed light we perform here has a considerable noise, equivalent to photons per pulse. Yet, although this noise is much stronger than the SV (about photons per pulse) and comparable to the coherent beam ( photons per pulse) injected into the interferometer, parametric amplification provides noise robustness and enables sub-shot-noise phase sensitivity. Meanwhile, it is the detection noise that prevents reaching the ‘perfect detection’ quantum advantage (green and blue points in Fig. 4 b).
II Discussion
We have demonstrated that for a squeezing-assisted interferometer the detrimental effects of detection loss and noise can be eliminated with a phase-sensitive parametric amplifier at the output. In particular, our experiment shows phase sensitivity overcoming the SNL by dB even with detection efficiency and noise comparable to the signal sensing the phase. Increasing the output amplification helps to overcome a higher amount of loss. By amplifying the output photon number about times we overcome the SNL for detection efficiency down to . Even lower detection efficiencies will not be an obstacle for squeezing-assisted measurements if stronger amplification is used; it is realistic to go down to % efficiency.
This result is relevant to many schemes where losses in the output optical path, including limited detection efficiency, reduce the advantage brought by squeezing. An example is the gravitational-wave detectors, where, due to the output losses, 7-10 dB of the input squeezing gives only dB of the sensitivity gain (Tse et al., 2019; Acernese et al., 2019). Compensating for these losses with a continuous-wave scheme similar to ours could revolutionize gravitational-wave detection (note that the 6 dB gain in the phase sensitivity translates to almost an order of magnitude increase of the detection rate). Importantly, the homodyne scheme (used in gravitational-wave detectors) will also benefit from pre-amplification; moreover, unlike direct detection, it is not affected by detector dark noise (Manceau et al., 2017a).
A similar amplification strategy will be valid for imaging experiments involving multimode radiation, considered theoretically in (Knyazev et al., 2019). Indeed, the scheme could be accommodated to support more than a single spatial mode, similarly to Ref. (Frascella et al., 2019), and this opens up a considerable amount of experiments on sub-shot-noise imaging. The method will be also applicable to sub-shot-noise measurement of very small loss, where otherwise a very high detection efficiency is required (Losero et al., 2018; Knyazev et al., 2019).
Detection efficiency proves to be an especially important constraint for experiments with mid-infrared and terahertz radiation, used for biological and industrial applications. Another case is where the whole angular spectrum of radiation cannot be collected due to small detector sizes. This is an issue in sub-shot-noise microscopy where high resolution compromises the detection efficiency (Samantaray et al., 2017). In these cases, parametric amplification before detection will be indispensable.
III Methods
Polarization Mach-Zehnder interferometer is implemented using a single HWP (Fig. 2 a). The input coherent state has horizontal polarization and the SV state , vertical polarization. The 50:50 beam splitters correspond to the transition between linear and circular polarization bases. The HWP with the optic axis at an angle introduces a phase shift between the two arms, see Sec. V of the Supplemental Material. The HWP is a 45--thick dual-wavelength waveplate: a HWP for nm; a full-wave plate for nm.
Parametric amplifiers BBO1 and BBO2 are 2 mm BBO crystals pumped by the second harmonic of Spectra Physics Spitfire Ace laser (central wavelength nm, horizontal polarization, average power mW, waist intensity FWHM ). Their squeeze factors are found by measuring the mean numbers of photons per pulse at their outputs in the regime of vacuum amplification (high-gain parametric down-conversion) and fitting with the parameters the obtained dependences on the pump power with the functions , . By detuning BBO1 from exact phase matching, is reduced compared to . The waist of the coherent beam is inside BBO2 and the waist intensity FWHM is chosen close to the one of the first Schmidt mode (Wasilewski et al., 2006), i.e. . This ensures mode matching for the coherent beam and, as a result, efficient amplification. Meanwhile, the SV is de-amplified efficiently only in the collinear direction due to its divergence, and spatial filtering at the detection stage is necessary for this purpose.
For pump intensity stabilization, we tap off part of the pump beam by BS1 (Fig. 2 b), amplify the fluctuations (initially RMS) approximately 7 times using high-gain parametric down-conversion, and post-select measurements for which the pump fluctuations were within RMS (see Sec. I of the Supplemental Material).
The shot-noise limit for the phase sensitivity is found as
| (3) |
where and are, respectively, the photon numbers of the coherent and SV beams inside the interferometer, i.e. at the HWP, within the spatial and spectral bandwidths registered at the detector. For the SV beam, we can use the estimate . For the coherent beam, we measure with the photo-detector at the output of the interferometer an average number of photons per pulse of , whose uncertainty is reduced by repeated measurements. Dividing this number by the total efficiency , we obtain and, neglecting the small value of , the SNL sensitivity is mrad.
We also test the interferometer in the classical regime, by blocking the SV and leaving only the laser beam at the input. In this case, the phase sensitivity is much worse than SNL, due to the detection loss and noise (see Sec. III of the Supplemental Material). We note that it is this test that identifies the SNL in most of experiments. While it might work for continuous-wave lasers, it leads to the overestimation of the SNL for pulsed light, which usually has stronger intensity fluctuations.
The error bars reported in this work represent the standard error of the mean with a sample size of 1000. For the measurement of the number of photons, the error bars are too small to be seen.
IV Supplementary information
Supplementary information to “Overcoming detection loss and noise in squeezing-based optical sensing” contains sections on stabilizing the pump fluctuations (I), locking the phase (II), measurement of the SNL (III), the effect of the excess noise of the coherent beam (IV) and derivation of the phase sensitivity (V).
V References
References
- Giovannetti et al. (2004) V. Giovannetti, S. Lloyd, and L. Maccone, Science 306, 1330 (2004).
- Mitchell et al. (2004) M. W. Mitchell, J. S. Lundeen, and A. M. Steinberg, Nature 429, 161 (2004).
- Nagata et al. (2007) T. Nagata, R. Okamoto, J. L. O’Brien, K. Sasaki, and S. Takeuchi, Science 316, 726 (2007).
- Resch et al. (2007) K. J. Resch, K. L. Pregnell, R. Prevedel, A. Gilchrist, G. J. Pryde, et al., Phys. Rev. Lett. 98, 223601 (2007).
- Degen et al. (2017) C. L. Degen, F. Reinhard, and P. Cappellaro, Rev. Mod. Phys. 89, 035002 (2017).
- Pezzè et al. (2018) L. Pezzè, A. Smerzi, M. K. Oberthaler, R. Schmied, and P. Treutlein, Rev. Mod. Phys. 90, 035005 (2018).
- Wolf et al. (2019) F. Wolf, C. Shi, J. C. Heip, M. Gessner, L. Pezzè, et al., Nature Communications 10, 2929 (2019).
- Demkowicz-Dobrzański et al. (2015) R. Demkowicz-Dobrzański, M. Jarzyna, and J. Kołodyński (Elsevier, 2015) pp. 345 – 435.
- The LIGO Scientific Collaboration (2011) The LIGO Scientific Collaboration, Nature Physics 7, 962 EP (2011).
- Barsotti et al. (2018) L. Barsotti, J. Harms, and R. Schnabel, Reports on Progress in Physics 82, 016905 (2018).
- Tse et al. (2019) M. Tse, H. Yu, N. Kijbunchoo, A. Fernandez-Galiana, P. Dupej, et al., Physical Rev. Lett. 123, 231107 (2019).
- Acernese et al. (2019) F. Acernese, M. Agathos, L. Aiello, A. Allocca, A. Amato, et al. (Virgo Collaboration), Phys. Rev. Lett. 123, 231108 (2019).
- Polzik et al. (1992) E. S. Polzik, J. Carri, and H. J. Kimble, Phys. Rev. Lett. 68, 3020 (1992).
- Whittaker et al. (2017) R. Whittaker, C. Erven, A. Neville, M. Berry, J. L. O’Brien, et al., New Journal of Physics 19, 023013 (2017).
- Moreau et al. (2017) P.-A. Moreau, J. Sabines-Chesterking, R. Whittaker, S. K. Joshi, P. M. Birchall, et al., Scientific Reports 7, 6256 (2017).
- Brida et al. (2010) G. Brida, M. Genovese, and I. Ruo Berchera, Nature Photonics 4, 227 (2010).
- Taylor et al. (2014) M. A. Taylor, J. Janousek, V. Daria, J. Knittel, B. Hage, et al., Phys. Rev. X 4, 011017 (2014).
- Samantaray et al. (2017) N. Samantaray, I. Ruo-Berchera, A. Meda, and M. Genovese, Light: Science & Applications 6, e17005 (2017).
- Sabines-Chesterking et al. (2019) J. Sabines-Chesterking, A. R. McMillan, P. A. Moreau, S. K. Joshi, S. Knauer, et al., Opt. Express 27, 30810 (2019).
- Feng and Pfister (2004) S. Feng and O. Pfister, Opt. Lett. 29, 2800 (2004).
- Wolfgramm et al. (2010) F. Wolfgramm, A. Cerè, F. A. Beduini, A. Predojević, M. Koschorreck, et al., Phys. Rev. Lett. 105, 053601 (2010).
- Lucivero et al. (2016) V. G. Lucivero, R. Jiménez-Martínez, J. Kong, and M. W. Mitchell, Phys. Rev. A 93, 053802 (2016).
- Treps et al. (2002) N. Treps, U. Andersen, B. Buchler, P. K. Lam, A. Maître, H.-A. Bachor, et al., Phys. Rev. Lett. 88, 203601 (2002).
- Lawrie et al. (2019) B. J. Lawrie, P. D. Lett, A. M. Marino, and R. C. Pooser, ACS Photonics 6, 1307 (2019).
- Eberle et al. (2010) T. Eberle, S. Steinlechner, J. Bauchrowitz, V. Händchen, H. Vahlbruch, et al., Phys. Rev. Lett. 104, 251102 (2010).
- Demkowicz-Dobrzański et al. (2013) R. Demkowicz-Dobrzański, K. Banaszek, and R. Schnabel, Physical Rev. A 88, 041802 (2013).
- Manceau et al. (2017a) M. Manceau, F. Khalili, and M. Chekhova, New Journal of Physics 19, 013014 (2017a).
- Knyazev et al. (2019) E. Knyazev, F. Y. Khalili, and M. V. Chekhova, Opt. Express 27, 7868 (2019).
- Caves (1981) C. M. Caves, Phys. Rev. D 23, 1693 (1981).
- Mallet et al. (2011) F. Mallet, M. A. Castellanos-Beltran, H. S. Ku, S. Glancy, E. Knill, et al., Phys. Rev. Lett. 106, 220502 (2011).
- Shaked et al. (2018) Y. Shaked, Y. Michael, R. Z. Vered, L. Bello, M. Rosenbluh, et al., Nature Communications 9, 609 (2018).
- Le Jeannic et al. (2018) H. Le Jeannic, A. Cavaillès, K. Huang, R. Filip, and J. Laurat, Phys. Rev. Lett. 120, 073603 (2018).
- Hosten et al. (2016) O. Hosten, R. Krishnakumar, N. J. Engelsen, and M. A. Kasevich, Science 352, 1552 (2016).
- Yurke et al. (1986) B. Yurke, S. L. McCall, and J. R. Klauder, Phys. Rev. A 33, 4033 (1986).
- Ou (2012) Z. Y. Ou, Phys. Rev. A 85, 023815 (2012).
- Manceau et al. (2017b) M. Manceau, G. Leuchs, F. Khalili, and M. Chekhova, Phys. Rev. Lett. 119, 223604 (2017b).
- Xiao et al. (1987) M. Xiao, L.-A. Wu, and H. J. Kimble, Phys. Rev. Lett. 59, 278 (1987).
- Grangier et al. (1987) P. Grangier, R. E. Slusher, B. Yurke, and A. LaPorta, Phys. Rev. Lett. 59, 2153 (1987).
- Schäfermeier et al. (2018) C. Schäfermeier, M. Ježek, L. S. Madsen, T. Gehring, and U. L. Andersen, Optica 5, 60 (2018).
- Iskhakov et al. (2012) T. S. Iskhakov, A. M. Pérez, K. Y. Spasibko, M. V. Chekhova, and G. Leuchs, Opt. Lett. 37, 1919 (2012).
- Note (1) The de-amplification phase is set by properly choosing the distance between the two crystals Manceau et al. (2017b), while the amplification phase of the coherent beam is set with a piezoelectric actuator (Sec. II of the Supplemental Material).
- Anderson et al. (2017) B. E. Anderson, P. Gupta, B. L. Schmittberger, T. Horrom, C. Hermann-Avigliano, et al., Optica 4, 752 (2017).
- Frascella et al. (2019) G. Frascella, E. E. Mikhailov, N. Takanashi, R. V. Zakharov, O. V. Tikhonova, et al., Optica 6, 1233 (2019).
- Losero et al. (2018) E. Losero, I. Ruo-Berchera, A. Meda, A. Avella, and M. Genovese, Scientific Reports 8, 7431 (2018).
- Wasilewski et al. (2006) W. Wasilewski, A. I. Lvovsky, K. Banaszek, and C. Radzewicz, Phys. Rev. A 73, 063819 (2006).