Stellar variability in a forming massive star cluster
Abstract
We present a near-infrared (NIR) variability analysis for an 6′ 6′ region, which encompasses the massive protocluster G286.21+0.17. The total sample comprises more than 5000 objects, of which 562 show signs of a circumstellar disk based on their infrared colors. The data includes HST observations taken in two epochs separated by 3 years in the F110W and F160W bands. 363 objects (7% of the sample) exhibit NIR variability at a significant level (Stetson index ), and a higher variability fraction (14%) is found for the young stellar objects (YSOs) with disk excesses. We identified 4 high amplitude ( mag) variables seen in both NIR bands. Follow up and archival observations of the most variable object in this survey (G286.2032+0.1740) reveal a rising light curve over 8 years from 2011 to 2019, with a K band brightening of 3.5 mag. Overall the temporal behavior of G286.2032+0.1740 resembles that of typical FU Ori objects, however its pre-burst luminosity indicates it has a very low mass (), making it an extreme case of an outburst event that is still ongoing.
1 Introduction
Variability is ubiquitous among young stellar objects (YSOs). A low level of variability (i.e., typically below a few 0.1 mag) has been observed in most YSOs in the optical and NIR (e.g., Parihar et al., 2009). Mechanisms to produce such variations include rotationally modulated cool spots, hot spots on the stellar surface, extinction changes, and changes in the inner circumstellar disk (Wolk et al., 2013). Some of these mechanisms, like hot spots and varying extinction, may also produce variability with larger amplitudes (see, e.g., Grankin et al., 2007; Bouvier et al., 2013). Apart from these common causes of variability, a small fraction of YSOs show evidence for eruptive behavior, with variations larger than 1 magnitude in the optical or NIR bands over a few years or decades. This type of variability is thought to be related to the process of accretion from the circumstellar disk on to the protostar. During these bursts the YSO may increase its mass accretion rate by several orders of magnitude compared with quiescent phases, resulting in strong variability. While this episodic accretion scenario is well established, the driving force of this phenomenon is still poorly understood (e.g., Audard et al., 2014). Understanding the underlying mechanisms is crucial not only for building a complete picture of star formation, but also for the potential implications on the planet formation process (e.g., Zhu et al., 2009).
The nature of YSOs favors observations at near and mid-IR wavelengths, which allow for direct detection of optically thick disks, e.g., via excess K-band flux (Lada & Adams, 1992). Over recent years there has been an increasing interest to search for eruptive variables with long-term NIR observations. Scholz (2012) used archival NIR photometry to investigate the long-term variability in a few nearby low-mass star-forming regions and found a low fraction (2% in the YSO sample) of large amplitude variable objects. A higher incidence of K band variations mag (7%) has been reported in Class I YSOs in the dark cloud L1003 in Cygnus OB7 (Rice et al., 2012; Wolk et al., 2013). A panoramic search by the UKIRT Infrared Deep Sky Survey (UKIDSS; Lawrence et al., 2007) found a strong concentration of high-amplitude IR variables towards star-forming regions (Contreras Peña et al., 2014), and this is confirmed by recent VVV survey (VISTA Variables in the Via Lactea; Minniti et al. (2010)), in which more than 100 eruptive YSOs are detected (Contreras Peña et al., 2017a).
G286.21+0.17 (hereafter G286) is a massive () protocluster associated with the Car giant molecular cloud at a distance of 2.50.3 kpc (Barnes et al., 2010). The gas and dust component is well studied with ALMA, which reveals dense cores in millimeter continuum emission (Cheng et al., 2018). NIR observations reveal a high disk fraction of the YSOs, which suggests the cluster is very young ( 1 Myr; Andersen et al., 2017a). Here we present analysis of two-epoch HST NIR imaging of G286, with the main goal of characterizing variabilities. In particular, we report the discovery of a strong outburst in a low-mass embedded YSO, as well as its photometric and spectroscopic follow-up using Gemini observations.
2 Data
2.1 HST WFC3/IR imaging
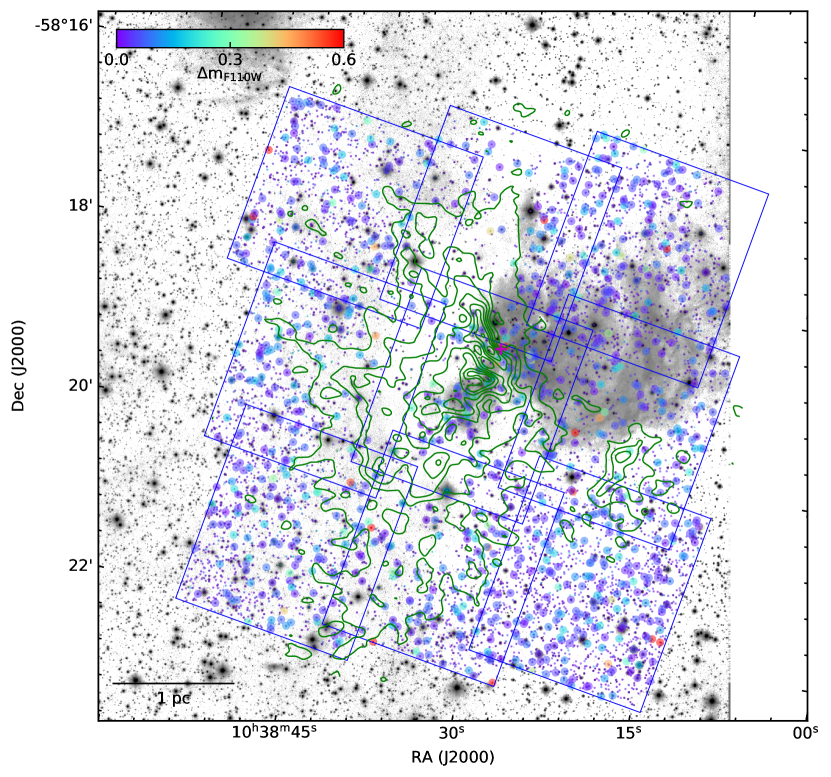
HST-WFC3/IR observations of the central cluster region of G286 were obtained in Cycle 22 and 24 under program IDs 13742 and 14680 (PI: J. Tan), obtained in October 2014 and October 2017, respectively. Observations were carried out in F110W, F160W and F167N filters and in this study we will focus on the two wide band filters. The field of view (FOV) for WFC3 is 136″123″, and the pixel scale is 0.128″. A 3 3 grid (with 10″ overlap between adjacent pointings) was observed to cover the 6’ 6’ central region of G286, as shown in Figure 2. In both bands three exposures were obtained for each position in the mosaic with a total integration time of 897 seconds in F110W and 847 seconds in F160W.
The data reduction used the STScI processed flt frames and they were combined using multidrizzle with the default parameter settings. For photometry each tile in the mosaic was handled individually to avoid potential issues with slight misalignments. The full width at half-maximum of the point-spread function (PSF) are 0.12″ and 0.15″ for the F110W and F160W, respectively.
As input for photometry we used the VLT source catalog from Andersen et al. (2017a), which contained 6207 members inside the HST FOV. The completeness is expected to be better than 80% for sources brighter than = 17 and 50% for sources down to = 19, as suggested by the artificial star experiments. Aperture photometry was performed with the Daophot package in Pyraf. For stars located in the overlap regions of different tiles, we adopted the photometric measurements with smaller errors. An aperture of 3 pixel radius was used to measure the flux of a source, and the background was measured in an annulus from 20 to 30 pixels. Restricting the list of objects to those with photometric errors smaller than 0.1 mag in both the F110W and F160W bands results in a list of 5273 sources with photometry in both epochs.
2.2 VLT and Gemini observations
To provide more photometric constraints on an extreme variable star in this survey (G286.2032+0.1740), we also collected additional observations including the VLT/HAWK-I JHKs imaging, Gemini/GSAOI Ks band imaging and Gemini/Flamingos 2 (F2) JHKs imaging. The VLT observations were obtained in the programs and over the period of 2011-2013 (see Andersen et al. (2017a) for details). The seeing during the observations was 0.4”-0.6”. A mosaic of 8’13’ was observed. The total exposure times were 6000s in J, 1500s in H, and 1500s in , respectively. For this study we used the pipeline reduced and mosaiced images obtained from each observing block instead of the combined images in Andersen et al. (2017a) to be able to follow the time evolution of the object.
G286 was observed with Gemini/GSAOI in 2019 March as part of the proposal GS-2019A-DD-103 (PI: M. Andersen). GSAOI has a resolution of 0.02″/pixel and consists of four 2048 2048 pixels detectors, divided by gaps of 2″, providing a total FOV of almost 85″85″. Two pointings were obtained, but here we only discuss the one covering the variable source. A total exposure time of 45 minutes on-source, was acquired during the run. The data were reduced in a standard manner using dedicated sky frames and up to date flat fields, using the gsaoi package in the Gemini pyraf package. Before co-addition of the individual frames, they were corrected for distortion using the program discostu. All the frames were aligned to the first GSAOI frame and then average combined using bad pixel masks for the individual frames. Aperture photometry was performed using the Daophot package in Pyraf. An aperture of 3.5 pixel radius was used to measure the flux, and the background was measured in an annulus from 20 to 35 pixels.
Gemini/F2 JHKs imaging was performed in 2019 June and December (proposal DT-2019A-129 and GS-2019B-FT-109, PI: Y. Cheng). For each observation, we obtained a total exposure time of 90 seconds in J, 48 seconds in H and 60 seconds in Ks, respectively. The raw images were reduced using the Gemini.F2 package provided in the Pyraf environment. The aperture photometry was done following similar procedures as the GSAOI data.
In 2019 June we also obtained H and K band spectra of G286.2032+0.1740 using F2 under thin cirrus conditions. We used the 2 pixel slit with the R3K grating resulting in a spectral resolution of 2800 in H and 2900 in K. Ten 120-second exposures were obtained for both the H and K band spectra in a typical ABBA dither pattern. A telluric star was observed for both spectral settings. The data were reduced in a standard manner using flat and Argon lamp observations obtained after the science exposures. Each science frame was dark subtracted, flat fielded and sky subtracted using the temporal nearest offset position before the frames were cross correlated and coadded. The Argon lamp was used for wavelength calibration. The cirrus did result in a rather variable sky that has left several OH lines poorly subtracted in the H band spectrum. These lines are marked in the final spectrum shown in Figure 8.
3 Results
3.1 Overview of the Region
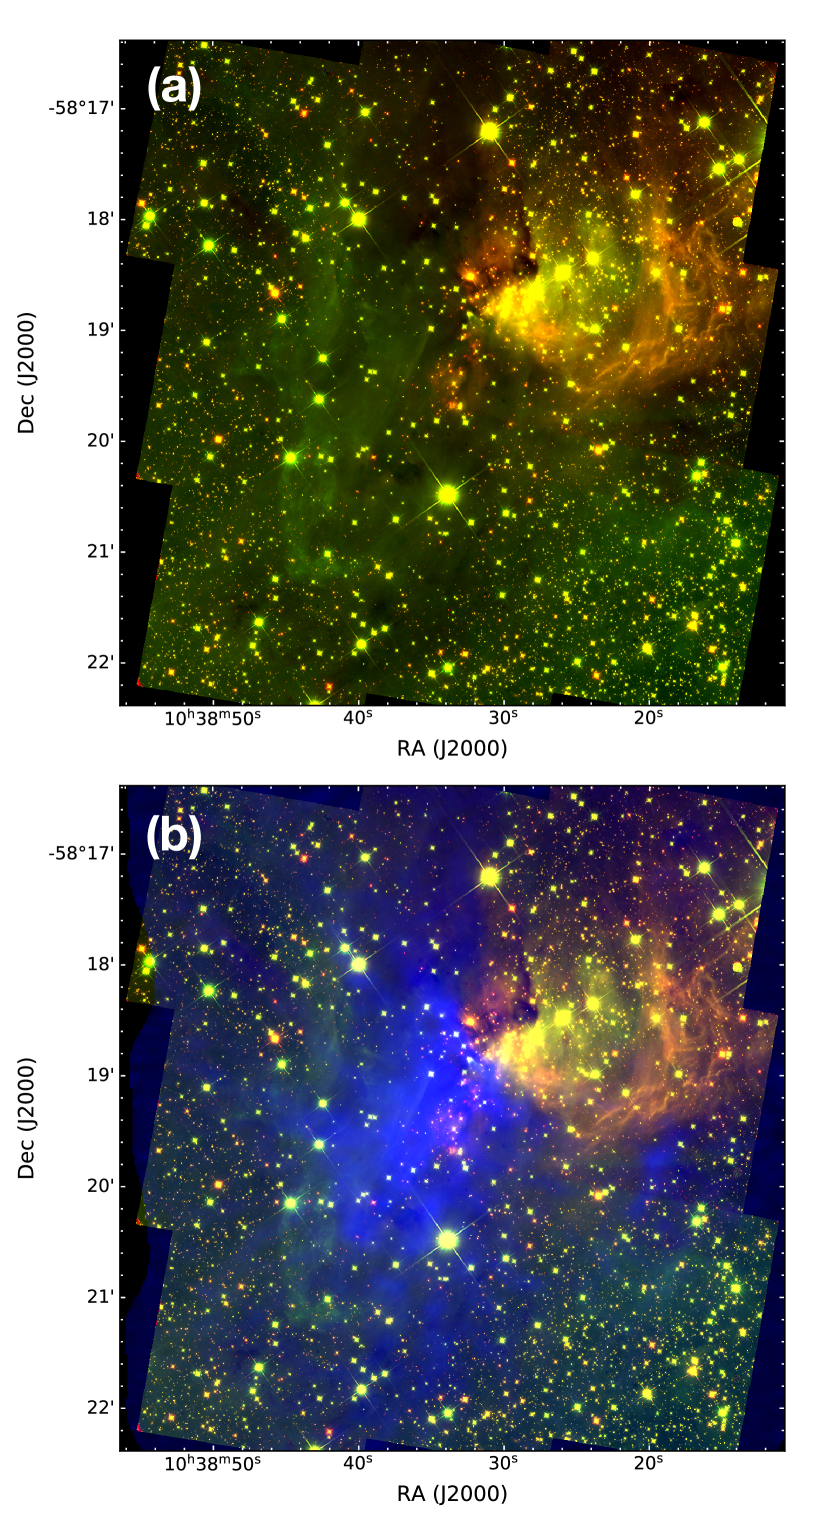
Figure 1(a) shows a two-color image of G286 with HST F110W and F160W data (green and red, respectively). The stellar component in this region has been characterized by Andersen et al. (2017a) with VLT NIR observations, but the embedded YSO population is better revealed with our more sensitive and higher resolution HST observations. Some strong diffuse nebulosity is clearly seen in the northwest, which is associated with a shell-like HII region, where the stars are less affected by extinction (Barnes et al., 2010). In the central 30″ region there is a heavily obscured star cluster (i.e., region R1 in Andersen et al. (2017a)), which appears as redder objects in this two-color image. Compared with the background/foreground stars near the edge of the field, there is a relative paucity of stars extending to the north and south from the center, suggesting existence of substantial extincting molecular cloud material. This is confirmed by our ALMA (2-1) observations (Cheng Y. et al. 2020, in preparation), as shown in Figure 1(b). is known to be a good tracer of high column density regions and the integrated emission has a close correspondence with the dark lanes seen in the HST image.
3.2 Near-IR variability
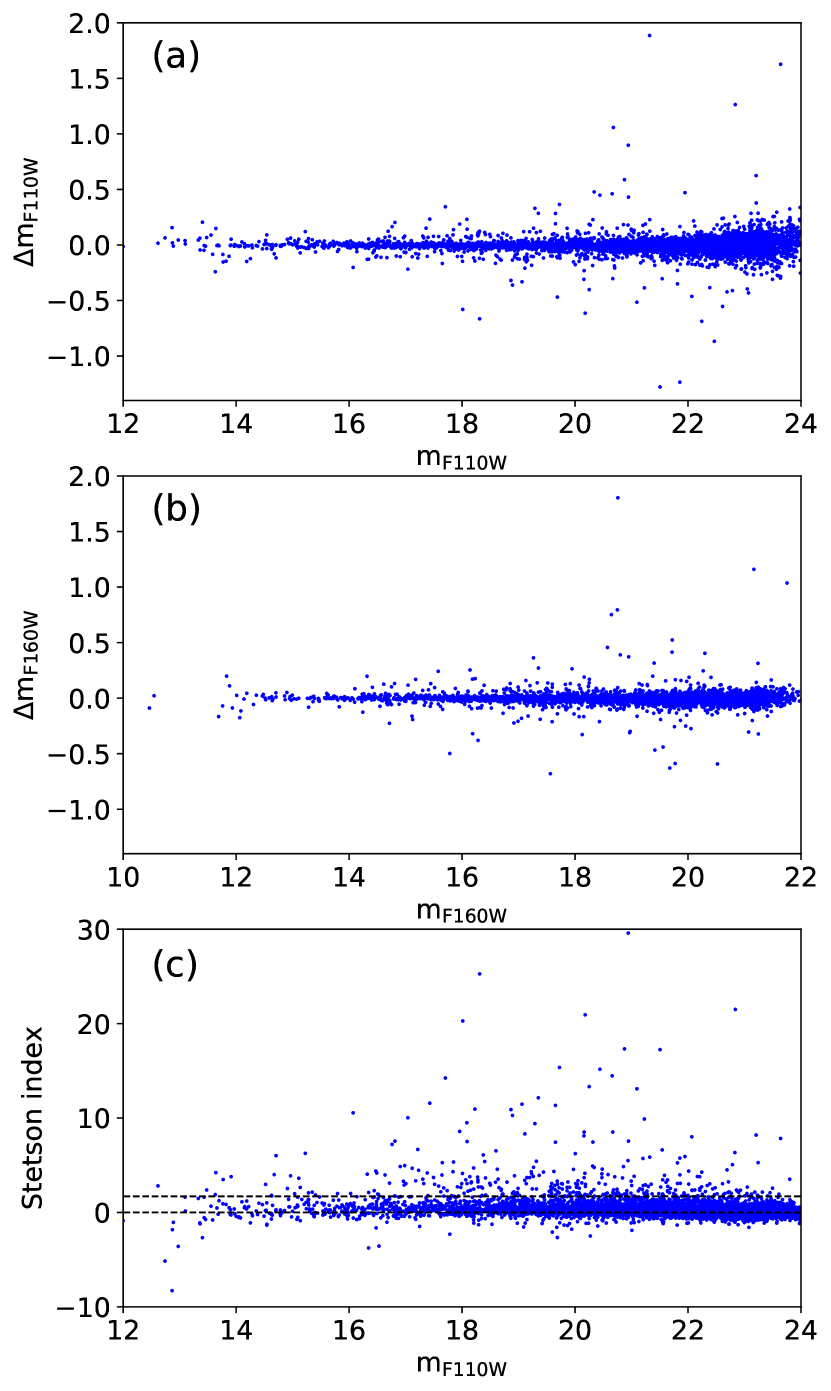
Figure 3(a) shows the F110W band variation against first epoch F110W magnitude for the 5273 point sources with photometric errors smaller than 0.1 mag. A larger scatter in magnitude variation is seen towards fainter F110W magnitudes, which is mostly contributed by increasing photometric uncertainties due to the lower signal for fainter sources. A Gaussian fit gives a dispersion of for the whole sample. A similar analysis for F160W band gives a and the distribution is shown in Figure 3(b).
To quantitatively select stars that are variable, we use the Stetson variability index (Stetson, 1996), which is defined as
| (1) |
where is the number of pairs of simultaneous observations of an object. is the product of the relative error of two observations, which is defined as
| (2) |
for a given band. Here is the number of measurements used to determine the mean magnitude and is the photometric uncertainty. The Stetson statistic has been widely used to characterize variability in multi-wavelength observations (e.g., Carpenter et al., 2001; Rice et al., 2012). Since it accounts for the correlated changes in multiband magnitudes, the Stetson index can be used to identify variables with relatively low variability compared with photometric errors.
Figure 3(c) shows the Stetson statistics as a function of F110W magnitude. For random noise, the Stetson index should be scattered around zero, and larger positive values indicate correlated variabilities. An outlier-clipped gaussian fitting of the Stetson index distribution gives a mean value of and a dispersion of 0.5. Therefore, objects with can be considered variables and we use as our criterion for variability hereafter. Of all the 5273 objects, we have found that 363 (7%) are variable. The spatial distribution of these variables is illustrated in Figure 2.
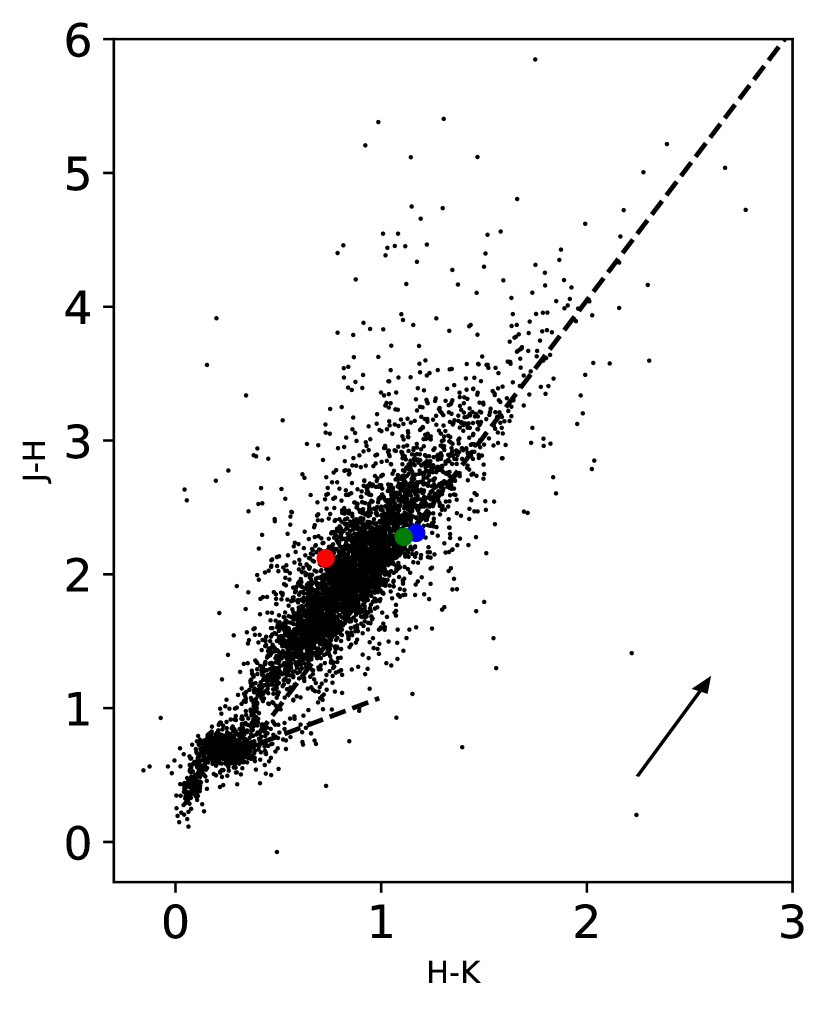
The sample consists of heterogeneous populations, including foreground and background field stars and cluster members. To characterize the variability for young stars that possess disks, which are mostly cluster members, we plot versus diagrams in Figure 4 using the VLT JHKs photometry using the catalog from Andersen et al. (2017a). This color-color diagram is an effective tool to identify objects with warm circumstellar disks (e.g., Meyer et al., 1997). Following Andersen et al. (2017a), the sample has two distinct populations: a bluer population (), which is mostly field stars in the foreground of the clump, and a redder population () consisting of the cluster content and also some field star contamination. To detect optically thick disks, we use the NIR excess criterion devoloped by Lada & Adams (1992). We consider stars to have a NIR excess consistent with an optically thick disk if they are located to the right of the reddening vector from the M6 main sequence colors, as shown in Figure 4. The objects also have to be above the empirically derived dereddened T-Tauri locus (Meyer et al., 1997). In addition, all objects with a color are ignored since they are expected to be foreground objects. These criteria yield 562 disk excess candidates, of which 80 are variable at a significant level ().
The fraction of variables in our identified YSOs that show evidence for a circumstellar disk is relatively low (14%) compared with other NIR surveys (e.g., Carpenter et al., 2001; Scholz, 2012; Rice et al., 2012), in which most YSOs have been observed to show a low level of NIR variability, with typical band amplitude of 0.15 mag. This is mainly due to the distance to the cluster. We have increasing photometric errors for fainter objects (e.g., for ) and hence it is difficult to detect variability at a significant level for these faint objects, assuming a typical variation of 0.15 mag. A higher variable fraction is achieved with a brightness cut. For example, the variable fraction is 57% (24/42) for disk candidates with . Furthermore, we only have HST observations over two epochs separated by 3 years, which may miss some short-term (weeks to months) variability.
Our observational setup is more suitable to survey long-term, large amplitude variations. Typical short-term NIR variations, arising from rotation, hot spots or inner disk inhomogenities, are in the range of 0.1-0.6 mag (Scholz et al., 2013, and references therein). Larger amplitude variations in YSOs are usually associated with accretion outbursts or extinction events. Of all the 5273 objects, 12 have and 7 have . The maximum amplitude in F110W and F160W band are 1.890.03 and 1.800.02, respectively. Of all the 562 YSO candidates with evidence for a circumstellar disk, 3 (0.5%) have and 1 (0.2%) has . To search for eruptive events, we further require a positive change in luminosity and magnitude variations larger than 0.6 in both bands. This gives 5 candidates, with 1 object also satisfying the disk excess criteria. Detailed inspection suggests that one of them (G286.2182+0.1507) was affected by a bad spot in the detector in the first epoch and hence is excluded in the following analysis.
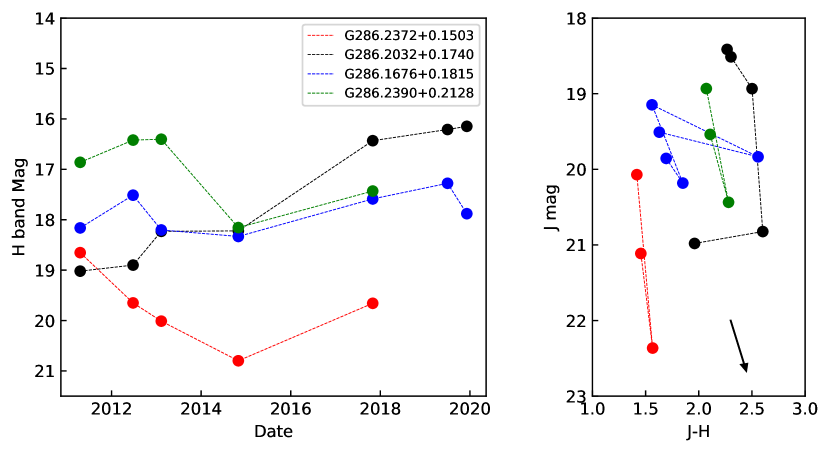
To investigate the nature of these objects, we have collected more observations, including our early VLT HAWK-I observations (2011-2013) and recent Gemini GSAOI band imaging (March 2019) and F2 band imaging (June 2019, December 2019). For direct comparison the HST F110W/F160W photometry was converted into the 2MASS system (i.e., corresponding to bands) following similar procedures as in Andersen et al. (2017b). In Figure 5 we show light curves and color-magnitude diagrams of the four high amplitude variables in H band, for which we have better sampling. Three of them (G286.2372+0.1503, G286.1676+0.1815, G286.2390+0.2128) show a declining trend from 2012 to 2015, so the brightening between two HST epochs could be understood as returning to their normal luminosity (after a fading event). It is unclear whether we are observing part of a periodic variation or an isolated event. This type of object might be related to either stars going back to quiescent states after an outburst or objects dominated by long-term extinction events similar to the long-lasting fading event in AA Tau (Bouvier et al., 2013) or some of the faders in (Findeisen et al., 2013). The color-magnitude diagram is supportive of the explanation of varying extinction, since most data points of G286.1676+0.1815 and G286.2390+0.2128 seem to follow the direction of the reddening vector. G286.2372+0.1503 has a steeper slope in the color-magnitude diagram, with significant variation in brightness but relative stable color, and hence its variability may also be contributed by other mechanisms besides extinction. The other object (G286.2032+0.1740) is the only one of these four objects that exhibits continuous brightening over the observation period of years, and thus is more likely to be a long-period accretion outburst event. We discuss its nature further in the following section.
3.3 An object with extreme variability
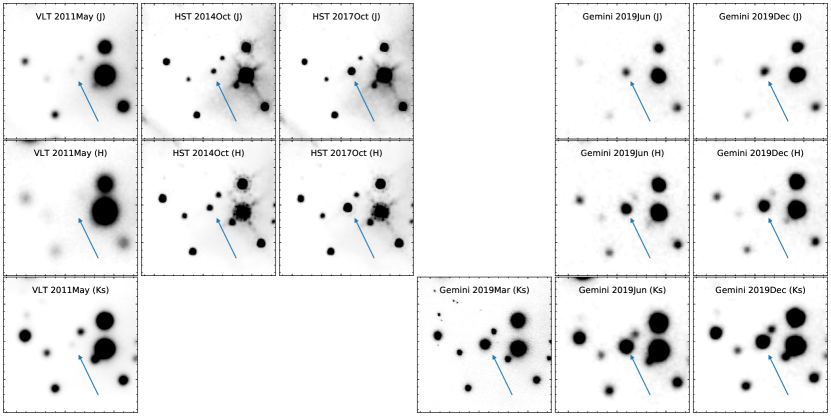
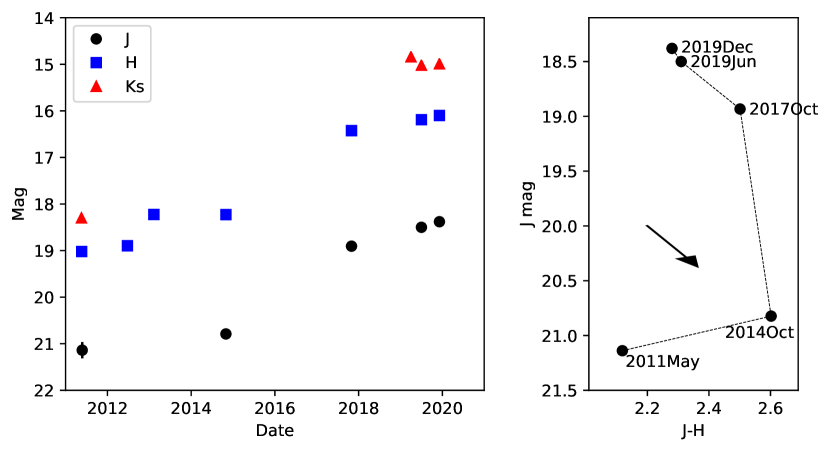
In our variability analysis, we have identified an object with eruptive variability, i.e., G286.2032+0.1740, located at (, = 18′48.2″). G286.2032+0.1740 has the most extreme variations in both bands, with an brightening of = 1.89 and =1.79. Further literature research indicates this object was a faint, virtually unstudied star prior to the onset of its eruption. G286.2032+0.1740 was not previously detected in early NIR surveys such as 2MASS, DENIS and WISE, due to its faintness before eruption. In Figure 6, we show the pre- and post-outburst images of G286.2032+0.1740 in (top), (middle) and band (bottom), taken at different dates, which clearly reveals a brightness increase in all three bands. The corresponding lightcurves and photometry are shown in Figure 7 and Table 1, respectively. The most striking contrast is seen in the band: comparing the Gemini GSAOI results (2019) with the earliest VLT photometry (2011), we measure an amplitude change of = 3.5 mag, i.e., a flux increase by a factor of 25.
Following the light curve morphology categorization in the VVV survey (Contreras Peña et al., 2017a), G286.2032+0.1740 falls in the “eruptive variability” category. In the band, for which we have better sampling of the light curve, G286.2032+0.1740 exhibits a monotonic rise over 8 years, with in May 2011 increasing to in Dec. 2019, though a lower level scatter is present from 2013 to 2014. On the other hand, the band luminosity remains roughly constant until 2015 ( in May 2011 and in Oct 2014), and rises to in Dec 2019. Judging from the band light curve, G286.2032+0.1740 went into outburst no later than June 2012, but we caution that this estimate may be affected by our relatively sparse sampling of the light curve. G286.2032+0.1740 appears only slightly brightened from June to December in 2019 and it is not clear if it has reached the plateau phase.
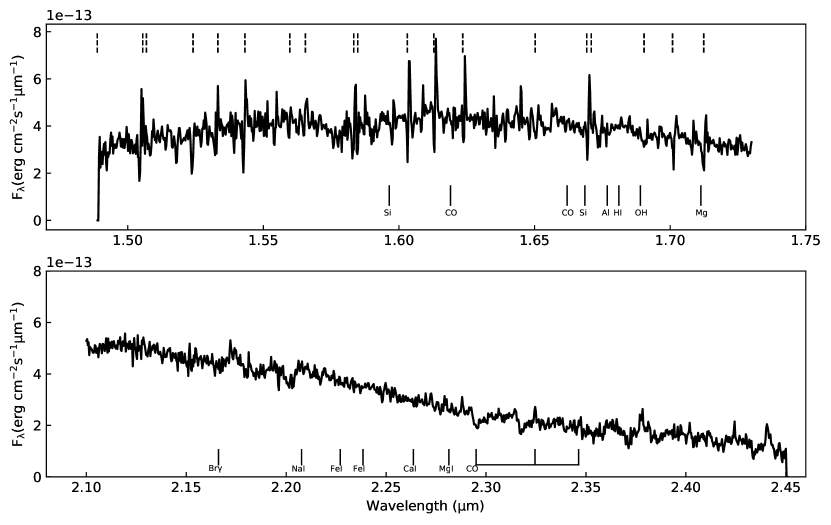
Figure 8 shows the H and K band spectra taken during June 2019, when G286.2032+0.1740 was in its bright state. There is a hint of shallow CO absorption at 2.29 m. The location of the most prominent lines expected for a late-type star are marked but there is no clear evidence for emission or absorption lines, perhaps indicating that they are masked by veiling from the disk. There is no sign of Brγ emission either, suggesting the accretion disk may extend all the way to the stellar surface during this outburst. We discuss the nature of G286.2032+0.1740 in the next section.
4 Discussion
Although the fraction of eruptive variables is very low among YSOs, they could provide unique insights into specific important processes occurring in the vicinity of the star, i.e., the star-disk interface, the inner disk as well as spatial scales beyond 1 AU, depending on specific mechanisms (Audard et al., 2014). A commonly accepted picture is that these objects are undergoing accretion outbursts, during which the accretion rate rapidly increases by several orders of magnitude. A significant fraction of the mass of the star may be accreted in such bursts. The eruptive YSOs have been traditionally divided into two classes: FUors, which have large flux increases and long outburst durations (tens to hundreds of years)(e.g., Herbig, 1977; Hartmann & Kenyon, 1996); and EXors, which have recurrent short-lived outbursts (weeks to months)(e.g., Herbig, 1989, 2008). Episodic accretion has several key implications for star formation and evolution, including solving the “luminosity problem” for embedded sources (Kenyon et al., 1990; Evans et al., 2009) and contributing to the luminosity spread of young star clusters in the Hertzsprung-Russell (HR) diagram (e.g., Baraffe et al., 2009).
However, many aspects of eruptive YSOs, including the recurrence time-scale and its relation with evolutionary stage, are still under active debate(e.g., Scholz et al., 2013; Fischer et al., 2019; Contreras Peña et al., 2019), partly due to limited numbers of examples. Both FUor and EXors categories have fewer than 20 that are known in total (Reipurth & Aspin, 2010; Connelley & Reipurth, 2018).
Comparing with known eruptive variables classes, G286.2032+0.1740, characterized by a long-term large-amplitude rising light curve, resembles an FUor object in its temporal behavior. In principle, high-amplitude variability in the NIR can be produced by various physical phenomena, including evolved giant and supergiant stars like Mira variables, cataclysmic variables and active galactic nuclei (AGN), etc (see Catelan et al., 2013, for a discussion). However, none of these possibilities is consistent with the characteristics of G286.2032+0.1740, including its faintness, NIR color and shape of the light curve. For example, there is no indication of periodicity from the light curve of G286.2032+0.1740, in contrast with what is expected for evolved stars like asymptotic giant branch (AGB) stars. The slowly rising light curve over years is also inconsistent with a nova outburst event(Warner, 2003). The NIR variability of AGN, on the other hand, is relatively smooth, but with smaller amplitude (Enya et al., 2002; Cioni et al., 2013). Furthermore, the fact that G286.2032+0.1704 is located in the Galactic plane with moderate extinction also makes it highly unlikely to be a background object like AGB star or AGN. In Figure 4 we overplot the vs. colors of G286.2032+0.1740 for three epochs with sufficient data (i.e., where the different bands were obtained close to each other within 5 days) (2011 May, 2019 June, 2019 December). At the more recent two epochs G286.2032+0.1740 appeared close to the boundary of the disk excess criterion, while in the early epoch G286.2032+0.1740 was to the left of that boundary, indicating a later evolutionary stage without much disk/envelope material. However, observations are known to be less sensitive to disks around young stars, compared with -band observations or mid-infrared diagnostics (e.g., Haisch et al., 2000) and stars with disks may drift in color space, rendering a smaller detection rate with only single epoch observations (Rice et al., 2012). Overall, given its location in a known active star-forming region and its photometric behavior, we consider that G286.2032+0.1740 is more likely to be an outbursting YSO. Similar to other FUor/FUor candidates, G286.2032+0.1740 has a spectrum lacking emission lines. This relatively featureless spectrum, as well as possible CO absorption, is broadly consistent with the FUor category. A similar example is VVVv721 (Contreras Peña et al., 2017b; Guo et al., 2020), which is classified as a FUor and characterized by having CO absorption and broad absorption bands, with a lack of other photospheric features. In the case of G286.2032+0.1740 some doubts will remain since the CO absorption features are very weak compared to typical FUors (Reipurth & Aspin, 2010) and some other common characteristics of FUors, like broad band water vapor absorption, are also not clearly seen. G286.2032+0.1740 has a relatively slow rise in its light curve (rise time 8 years), which is similar to the classical FUor V1515 Cyg (Kenyon et al., 1991)and VVVv721(Contreras Peña et al., 2017b). This slow rise may be explained as resulting from thermal instabilities that spread from the inner regions towards the outer parts of the accretion disc (see e.g., Audard et al., 2014).
Apart from accretion bursts, variable extinction may also be the reason for some extreme variation cases. For example, the variability of ESO-Oph-50 is explained by a low mass star seen through circumstellar matter, with changing inhomogeneities in the inner parts of the disk (Scholz et al., 2015). In the bright state the emission is consistent with a photosphere reddened by circumstellar dust, while in the faint state we are observing bluer scattered light since the direct stellar emission is blocked. However, the color behavior of G286.2032+0.1740 is inconsistent with this scenario. In Figure 7 we plot the color-magnitude diagram of G286.2032+0.1740. The trajectory can be divided into two stages: from May 2011 to Oct 2014 G286.2032+0.1740 became redder with slight brigtenning in the band. In the second stage, G286.2032+0.1740 turned bluer and brighter, which is in contrast to ESO-Oph-50 (bluer when fainter), but consistent with some outburst cases (e.g., Aspin & Reipurth, 2009). The magnitude changes in this stage are also steeper than expected from the reddening vector and thus cannot be attributed to variable extinction. The color variation in the first stage (from 2011 to 2014) is more erratic, in which G286.2032+0.1740 was reddened by 0.5 mag but kept similar band brightness. Unfortunately we only have a handful of data points in this pre/early outburst stage and thus cannot give more constraint on the nature of its color variation.
In the earliest epoch (2011), G286.2032+0.1740 was a faint object with a magnitude of 18.3, suggesting its nature as a very low-mass YSO and/or it was observed through substantial extinction. To quantitatively estimate its mass, we compare its photometry with the predictions from the Baraffe et al. (2015) isochrone, assuming a typical age of 1 Myr for G286 (Andersen et al., 2017a). Depending on which two colors are used for de-reddening, we obtain a range of masses from 0.06 to 0.10 . The mass estimation falls in a similar range (0.05 to 0.12 ) with varying assumed ages from 0.5 Myr to 2 Myr. Note that even the earliest epoch data here may not represent the pre-outburst quiescent state, so this estimation should be considered as an upper limit. If this is confirmed by further spectroscopic observations, G286.2032+0.1740 provides a unique case to study the extreme variability for YSOs in the very low-mass regime, for which our knowledge is still sparse. Very low-mass stars and brown dwarfs have been observed to have both low-level periodic variability, and more irregular high amplitude variability, but typically only with I-band amplitude changes up to 1 mag (Scholz & Eislöffel, 2005; Bozhinova et al., 2016). In terms of high amplitude variables ( 3 mag) that are likely associated with strong accretion outbursts, there are very few cases reported in the very low-mass range () (e.g., ASASSN-13db, (CTF93)216-2, Holoien et al., 2014; Caratti o Garatti et al., 2011). G286.2032+0.1740, with mass , is the lowest mass YSO with a strong outburst found so far. Combining its very low mass and strong outburst, G286.2032+0.1740 is apparently an extreme case of YSO varability. Since the object is currently near its brightest state, it gives a unique chance to characterize a very low mass YSO in its eruption stage.
| Date(y.m) | Instrument | J | H | Ks |
|---|---|---|---|---|
| 2011.5 | VLT/HAWK-I | 21.140.17 | 19.020.11 | 18.300.08 |
| 2012.6 | VLT/HAWK-I | … | 18.900.06 | … |
| 2013.2 | VLT/HAWK-I | … | 18.230.09 | … |
| 2014.10 | HST/WFC3 | 20.820.03 | 18.220.02 | … |
| 2017.10 | HST/WFC3 | 18.930.01 | 16.430.01 | … |
| 2019.3 | Gemini/GASOI | … | … | 14.840.01 |
| 2019.6 | Gemini/F2 | 18.500.03 | 16.190.02 | 15.020.01 |
| 2019.12 | Gemini/F2 | 18.380.03 | 16.110.02 | 14.990.01 |
References
- Andersen et al. (2017a) Andersen, M., Barnes, P. J., Tan, J. C., Kainulainen, J., & de Marchi, G. 2017a, ApJ, 850, 12
- Andersen et al. (2017b) Andersen, M., Gennaro, M., Brandner, W., et al. 2017b, A&A, 602, A22
- Aspin & Reipurth (2009) Aspin, C., & Reipurth, B. 2009, AJ, 138, 1137
- Audard et al. (2014) Audard, M., Ábrahám, P., Dunham, M. M., et al. 2014, in Protostars and Planets VI, ed. H. Beuther, R. S. Klessen, C. P. Dullemond, & T. Henning, 387
- Baraffe et al. (2009) Baraffe, I., Chabrier, G., & Gallardo, J. 2009, ApJ, 702, L27
- Baraffe et al. (2015) Baraffe, I., Homeier, D., Allard, F., & Chabrier, G. 2015, A&A, 577, A42
- Barnes et al. (2010) Barnes, P. J., Yonekura, Y., Ryder, S. D., et al. 2010, MNRAS, 402, 73
- Bouvier et al. (2013) Bouvier, J., Grankin, K., Ellerbroek, L. E., Bouy, H., & Barrado, D. 2013, A&A, 557, A77
- Bozhinova et al. (2016) Bozhinova, I., Scholz, A., & Eislöffel, J. 2016, MNRAS, 458, 3118
- Caratti o Garatti et al. (2011) Caratti o Garatti, A., Garcia Lopez, R., Scholz, A., et al. 2011, A&A, 526, L1
- Carpenter et al. (2001) Carpenter, J. M., Hillenbrand, L. A., & Skrutskie, M. F. 2001, AJ, 121, 3160
- Catelan et al. (2013) Catelan, M., Minniti, D., Lucas, P. W., et al. 2013, arXiv e-prints, arXiv:1310.1996
- Cheng et al. (2018) Cheng, Y., Tan, J. C., Liu, M., et al. 2018, ApJ, 853, 160
- Cioni et al. (2013) Cioni, M. R. L., Kamath, D., Rubele, S., et al. 2013, A&A, 549, A29
- Connelley & Reipurth (2018) Connelley, M. S., & Reipurth, B. 2018, ApJ, 861, 145
- Contreras Peña et al. (2019) Contreras Peña, C., Naylor, T., & Morrell, S. 2019, MNRAS, 486, 4590
- Contreras Peña et al. (2014) Contreras Peña, C., Lucas, P. W., Froebrich, D., et al. 2014, MNRAS, 439, 1829
- Contreras Peña et al. (2017a) Contreras Peña, C., Lucas, P. W., Minniti, D., et al. 2017a, MNRAS, 465, 3011
- Contreras Peña et al. (2017b) Contreras Peña, C., Lucas, P. W., Kurtev, R., et al. 2017b, MNRAS, 465, 3039
- Enya et al. (2002) Enya, K., Yoshii, Y., Kobayashi, Y., et al. 2002, ApJS, 141, 45
- Evans et al. (2009) Evans, Neal J., I., Dunham, M. M., Jørgensen, J. K., et al. 2009, ApJS, 181, 321
- Findeisen et al. (2013) Findeisen, K., Hillenbrand, L., Ofek, E., et al. 2013, ApJ, 768, 93
- Fischer et al. (2019) Fischer, W. J., Safron, E., & Megeath, S. T. 2019, ApJ, 872, 183
- Grankin et al. (2007) Grankin, K. N., Melnikov, S. Y., Bouvier, J., Herbst, W., & Shevchenko, V. S. 2007, A&A, 461, 183
- Guo et al. (2020) Guo, Z., Lucas, P. W., Contreras Peña, C., et al. 2020, MNRAS, 492, 294
- Haisch et al. (2000) Haisch, Karl E., J., Lada, E. A., & Lada, C. J. 2000, AJ, 120, 1396
- Hartmann & Kenyon (1996) Hartmann, L., & Kenyon, S. J. 1996, ARA&A, 34, 207
- Herbig (1977) Herbig, G. H. 1977, ApJ, 217, 693
- Herbig (1989) Herbig, G. H. 1989, in European Southern Observatory Conference and Workshop Proceedings, Vol. 33, European Southern Observatory Conference and Workshop Proceedings, 233–246
- Herbig (2008) —. 2008, AJ, 135, 637
- Holoien et al. (2014) Holoien, T. W. S., Prieto, J. L., Stanek, K. Z., et al. 2014, ApJ, 785, L35
- Kenyon et al. (1991) Kenyon, S. J., Hartmann, L. W., & Kolotilov, E. A. 1991, PASP, 103, 1069
- Kenyon et al. (1990) Kenyon, S. J., Hartmann, L. W., Strom, K. M., & Strom, S. E. 1990, AJ, 99, 869
- Lada & Adams (1992) Lada, C. J., & Adams, F. C. 1992, ApJ, 393, 278
- Lawrence et al. (2007) Lawrence, A., Warren, S. J., Almaini, O., et al. 2007, MNRAS, 379, 1599
- Meyer et al. (1997) Meyer, M. R., Calvet, N., & Hillenbrand, L. A. 1997, AJ, 114, 288
- Minniti et al. (2010) Minniti, D., Lucas, P. W., Emerson, J. P., et al. 2010, New A, 15, 433
- Nishiyama et al. (2009) Nishiyama, S., Tamura, M., Hatano, H., et al. 2009, ApJ, 696, 1407
- Parihar et al. (2009) Parihar, P., Messina, S., Distefano, E., Shantikumar, N. S., & Medhi, B. J. 2009, MNRAS, 400, 603
- Reipurth & Aspin (2010) Reipurth, B., & Aspin, C. 2010, in Evolution of Cosmic Objects through their Physical Activity, ed. H. A. Harutyunian, A. M. Mickaelian, & Y. Terzian, 19–38
- Rice et al. (2012) Rice, T. S., Wolk, S. J., & Aspin, C. 2012, ApJ, 755, 65
- Scholz (2012) Scholz, A. 2012, MNRAS, 420, 1495
- Scholz & Eislöffel (2005) Scholz, A., & Eislöffel, J. 2005, A&A, 429, 1007
- Scholz et al. (2013) Scholz, A., Froebrich, D., & Wood, K. 2013, MNRAS, 430, 2910
- Scholz et al. (2015) Scholz, A., Mužić, K., & Geers, V. 2015, MNRAS, 451, 26
- Stetson (1996) Stetson, P. B. 1996, PASP, 108, 851
- Warner (2003) Warner, B. 2003, Cataclysmic Variable Stars, doi:10.1017/CBO9780511586491
- Wolk et al. (2013) Wolk, S. J., Rice, T. S., & Aspin, C. 2013, ApJ, 773, 145
- Zhu et al. (2009) Zhu, Z., Hartmann, L., Gammie, C., & McKinney, J. C. 2009, ApJ, 701, 620