Properties of Galactic B[e] Supergiants: V. 3 Pup – constraining the orbital parameters and modeling the circumstellar environments.
Abstract
We report the results of a long-term spectroscopic monitoring of the A–type supergiant with the B[e] phenomenon 3 Pup = HD 62623. We confirm earlier findings that it is a binary system. The orbital parameters were derived using cross-correlation of the spectra in a range of 4460–4632 Å, which contains over 30 absorption lines. The orbit was found circular with a period of days, radial velocity semi-amplitude km s-1, systemic radial velocity km s-1, and the mass function M⊙. The object may have evolved from a pair with initial masses of 6.0 M⊙ and 3.6 M⊙ with an initial orbital period of 5 days. Based on the fundamental parameters of the A-supergiant (luminosity L/L0.1 and effective temperature T500 K) and evolutionary tracks of mass-transferring binaries, we found current masses of the gainer M0.5 M⊙ and donor M M⊙. We also modeled the object’s IR-excess and derived a dust mass of M⊙ in the optically-thin dusty disk. The orbital parameters and properties of the H line profile suggest that the circumstellar gaseous disk is predominantly circumbinary. The relatively low mass of the gainer led us to a suggestion that 3 Pup should be excluded from the B[e] supergiant group and moved to the FS CMa group. Overall these results further support our original suggestion that FS CMa objects are binary systems, where an earlier mass-transfer caused formation of the circumstellar envelope.
Subject headings:
Stars: emission-line, Be; (Stars:) binaries: spectroscopic; Stars: individual: 3 Pup1. Introduction
The object 3 Pup (HD 62623, HR 2996) is the brightest ( 4.0 mag) among those exhibiting the B[e] phenomenon. The latter is defined as the presence of emission lines, including forbidden, in the spectra of B-type stars as well as an IR excess due to dust radiation. The emission-line spectrum of the star was first detected by Merrill (1934). The first identification of spectral lines in a wavelength range from 3300 Å to H was published by Swings (1950). A more detailed history of spectral studies of 3 Pup along with a line list found at a high resolution () in a range from 3682 to 8863 Å can be found in Chentsov et al. (2010). An atlas of the spectrum of 3 Pup in the spectral range from 3920 Å to 6920 Å at is presented by Klochkova et al. (2015). Parts of the spectrum at longer wavelengths from 7280 Å to 7340 Å and 8480 Å to 8680 Å at are presented by Aret et al. (2016).
Regular radial velocity (RV) variations of the absorption lines in the spectrum of 3 Pup were first detected by Johnson & Neubauer (1946), who reported an orbital period of 137.767 days and a RV semi-amplitude of 3.600.45 km s-1. These photographic data with addition of several higher-resolution CCD spectra were reanalyzed by Plets et al. (1995). Using a Fourier analysis technique, these authors found two equally probable orbital periods of 138.5 and 161.1 days. They also estimated the object’s distance modulus to be 10.8–12.4 mag corresponding to distances from 1.4 to 3.0 kpc. This result led Plets et al. (1995) to a very large luminosity of the star ranging from L⊙ and a conclusion that 3 Pup was a massive star. Such a large distance and a high luminosity were not supported by the results of Chentsov et al. (2010), who derived a distance of 650 pc from the spectral classification of the star (A2.7 ib) and comparison of its spectrum with those of other early A-type supergiants.
The IR excess of 3 Pup was analyzed by Rovero & Ringuelet (1994); Plets et al. (1995); Stee et al. (2004); Meilland et al. (2010). The former authors attributed the excess to chromospheric emission, while the others clearly showed that it is due to radiation of the circumstellar dust. A strong emission band, indicative of optically-thin radiation of silicate dusty particles was detected in the low-resolution IRAS spectrum. Stee et al. (2004) calculated a model SED of the star and the gas-and-dust disk-like envelope using a stellar temperature of 10,000 K, a typical accelerated stellar wind of a single supergiant with a latitudinal mass flux distribution, and spherical silicate dusty grains. The best model found by these authors contained dusty grains with a diameter of 1 micron and was consistent with near-IR interferometric data.
More recent studies (e.g., Monnier et al., 2004; Meilland et al., 2010; Millour et al., 2011) reported IR interferometry of the object, resolved the dusty disk around it, and concluded that the material accumulation in its equatorial plane is most likely due to the presence of a low-mass component. Also, spectroscopic studies by Kraus et al. (2015) and Aret et al. (2016) in the visual and near-IR regions suggested a Keplerian motion of the material in the circumstellar disk around the A-supergiant.
Nevertheless, there is still much uncertainty in the stellar and circumstellar parameters of the object. In particular, there is no generally accepted agreement on the luminosity of the A-supergiant, mass function of the binary, and even the orbital period. In this paper we report the results of a long-term high-resolution spectroscopic monitoring of 3 Pup and a new attempt to model the dusty portion of the system IR excess with the goal to further constrain the system parameters.
2. Observations
Spectroscopic observations of 3 Pup were obtained by A.M. and S.D. in 2012–2020 at the Three College Observatory in North Carolina (131 spectra). Additionally 17 spectra were obtained in 2004–2018 at four additional observatories. Table 1 summarizes these observations.
| Observatory | Telescope | Instrument | Resolution | Location |
| ID | ||||
| TCO | 0.81 m at the Three College | eShel (Shelyak | 12,000 | North Carolina, USA |
| Observatory | Instruments)111http://www.shelyak.com | |||
| SAO | 6 m at the Special Astrophysical | NES | 60,000 | Nizhniy Arkhyz, Russia |
| Observatory of the Russian Academy | (Panchuk et al., 2017) | |||
| of Sciences | ||||
| OAN | 2.1 m at the Observatorio Astronómico | REOSC | 18,000 | Baja California, Mexico |
| SPM | Nacional San Pedro Martir | |||
| McD | 2.7 m Harlan J. Smith | Tull coudé TS2 | 60,000 | Mt. Locke, Texas, USA |
| at the McDonald Observatory | (Tull et al., 1995) | |||
| CFHT | 3.6 m Canada-France-Hawaii | ESPaDOnS | 65,000 | Mauna Kea, Hawaii, USA |
| Telescope | (Manset & Donati, 2003) |
The data obtained at OAN SPM, McDonald (McD), and TCO were reduced in a standard way using the task of IRAF. Observations obtained at CFHT were reduced with the Upena and Libre-ESpRIT software packages (Donati et al., 1997). Typical uncertainties in the wavelength calibration are 0.5 km s-1 for the CFHT, McDonald, and TCO data and 1 km s-1 for OAN SPM. RV standard stars were observed every night at TCO and SPM to control the wavelength calibration. Unexpected deviations from the regular RV variations described in Sect. 3.1 were detected only several times and might have been due to either the pulsational activity of the A–supergiant or to effects of flexure (the spectrograph at OAN SPM is mounted at the Cassegrain focus). Log of the observations along with the measurements of the H line properties and cross-correlated RV is presented in Table 2.
| Date | HJD2450000 | Obs. | Range, Å | Phase | RV | (RV) | IV | IR | Id | |
|---|---|---|---|---|---|---|---|---|---|---|
| 12/25/04 | 3365.042 | CFHT | 360010500 | 0.287 | 5.5 | 0.3 | 1.92 | 2.84 | 0.84 | 0.68 |
| 12/12/06b | 4082.943 | SPM | 38506865 | 0.511 | 1.95 | 2.31 | 1.24 | 0.84 | ||
| 11/15/07 | 4420.016 | SPM | 36006775 | 0.964 | 1.1 | 0.4 | 1.63 | 2.12 | 1.36 | 0.77 |
| 11/20/07b | 4424.982 | SPM | 36006775 | 0.000 | 1.65 | 2.30 | 1.48 | 0.72 | ||
| 10/10/08 | 4750.017 | SPM | 36906800 | 0.365 | 4.4 | 0.5 | 1.75 | 2.98 | 1.15 | 0.59 |
| 11/04/08a | 4774.627 | SAO | 44625926 | 0.545 | 0.5 | 0.1 | ||||
| 12/11/08c | 4811.881 | McD | 360010140 | 0.816 | 1.60 | 2.88 | 1.14 | 0.56 |
-
Log of spectroscopic observations of 3 Pup. Full Table is shown in the electronic version of the paper. Column information: (1) – Calendar date (MM/DD/YY), (2) – Julian Date (JD2450000), (3) - Observatory ID (see Table 1), (4) – spectral range observed, (5) – orbital phase according to the RV solution (see text), (6) – radial velocity in km s-1 derived by cross-correlation in the range 4460–4632 Å (see Fig. 1), (7) uncertainty in the radial velocity determination in km s-1, (8–11) – parameters of the H line profiles: blue peak intensity in continuum units (IV), red peak intensity (IR), intensity of the central depression (Id), and the peak intensity ratio ().
-
Comments on the spectra with no RV measurements: a – a large portion or the entire cross-correlation region was not observed; b – a systematic error in the wavelength calibration; c – region damaged by reflection on the CCD chip.
3. Data Analysis
3.1. Binary Orbit
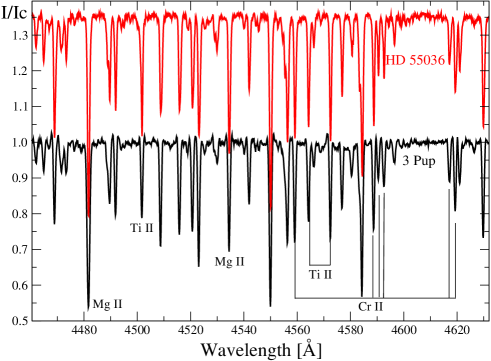
The optical spectrum of 3 Pup and line identification were described in detail in Chentsov et al. (2010). Our goal in this study was to investigate long-term line position and profile variations using a much larger data set than those reported previously. To reach this goal, we have measured the emission peaks intensity ratios in the H profile and positions of over 30 absorption lines of Fe ii, Mg ii, Ti ii, and Cr ii in a blue region from 4460 Å to 4632 Å as well as in a red region around the Si ii lines at 6347 Å and 6371 Å. Spectra with both regions of absorption lines were normalized to a local continuum and cross-correlated against a template spectrum, which was chosen to be a TCO spectrum of 3 Pup obtained on February 17, 2017 (signal to noise ratio in continuum over 200, see Fig. 1), using the package in IRAF. The template spectrum was obtained near an orbital phase, at which the observed RV is close to the systemic velocity. Also, using an individual spectrum as a template is better than an averaged one to avoid a spectral line broadening because of additional variations due to other processes, such as pulsations (see a brief discussion below).
The spectrum of HD 55036 shown for comparison in Fig. 1 was selected from a sample of A2–A3 ib supergiants that have been observed at TCO and OAN SPM. We show it just to demonstrate that the spectrum of 3 Pup looks like that of a typical supergiant in the regions with no line emission.
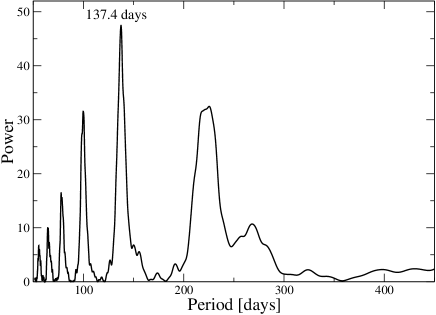
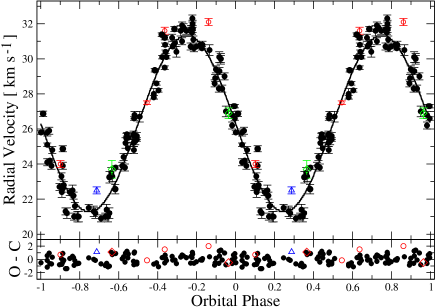
The main result found from the cross-correlation is a very well-defined pattern of the RV variations (see Fig. 2). It turned out to be sinusoidal within the measurement uncertainties, indicating a circular orbit of the A-supergiant around the center of mass of the system. The best fit to the blue region data has the following parameters: the orbital period P days, RV semi-amplitude km s-1, and the epoch of the superior conjunction HJD0 = HJD245,3325.73.0. The systemic velocity km s-1 was determined by adding the average RV from cross-correlation and the average RV of all the absorption lines in the blue region of the template spectrum.
Although the RV measurement accuracy is of the order of 0.3 km s-1, the uncertainty of the derived RV semi-amplitude due to the orbital motion is nearly three times higher. It is most likely due to short-term variations of the line positions mentioned by Chentsov et al. (2010). Such variations may be caused by pulsations typical of early-type supergiants (e.g., Saio et al., 2013).
The RV curve folded with the orbital period is shown in the lower panel of Fig. 2. The cross-correlation of the spectra in the red region showed virtually the same results as for the blue region. The orbital period and the RV semi-amplitude result in a mass function M⊙ which is discussed in Sect. 4.
3.2. Other Spectral Variations
Previous papers that reported high-resolution spectra of 3 Pup contained only limited discussion of the line profile variations because of a small number of spectra obtained. For example, Chentsov et al. (2010) mentioned profile variations of Fe ii and Na i lines comparing only two spectra. Our collection allows tracing variations of spectral lines over a period of nearly two decades. Overall, the absorption-line spectrum of 3 Pup in the visual region is typical of ib supergiants, and absorption lines show very weak variations of their profiles, taking into account uncertainties due to continuum normalization and wavelength calibration.
 |
 |
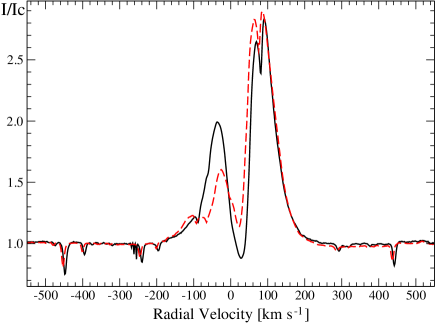
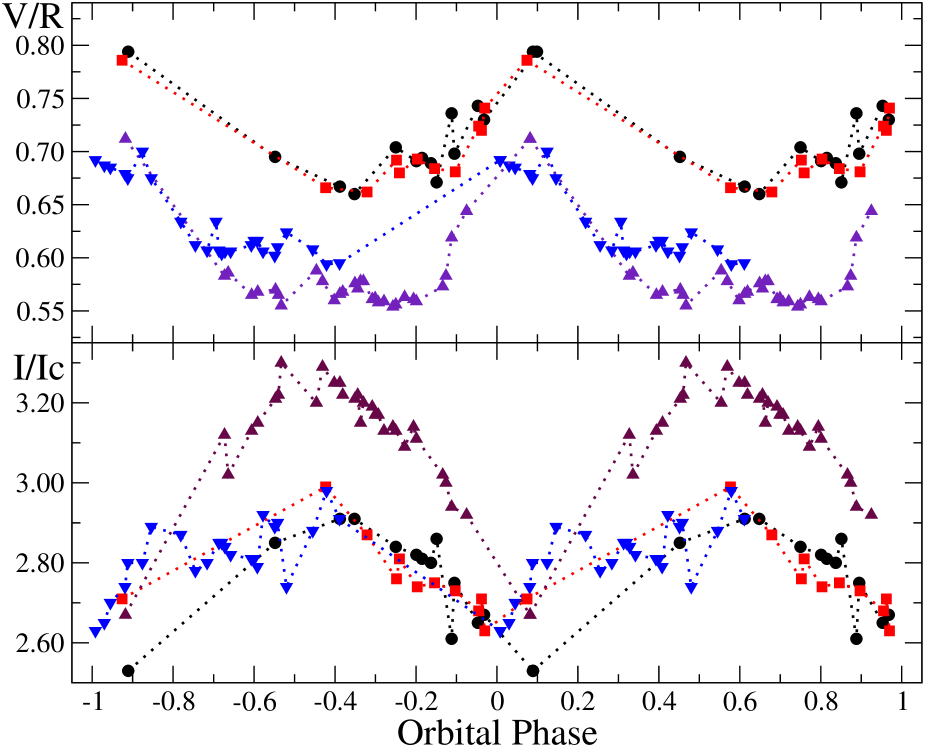
We analyzed the H line double-peaked profile variations and found several features of its long-term behavior. The first one concerns the strength of the central depression, which varied between 1.08 and 1.48 of the continuum intensity even in our highest-resolution spectra in 2006–2012. Since October 2013 it has never exceeded 1.03 of the continuum intensity. As seen in Fig. 3, the blue-shifted peak was lower during the former period compared to the latter one. Also, the blue-shifted peak was accompanied by a weaker and even bluer-shifted peak at a RV of km s-1.
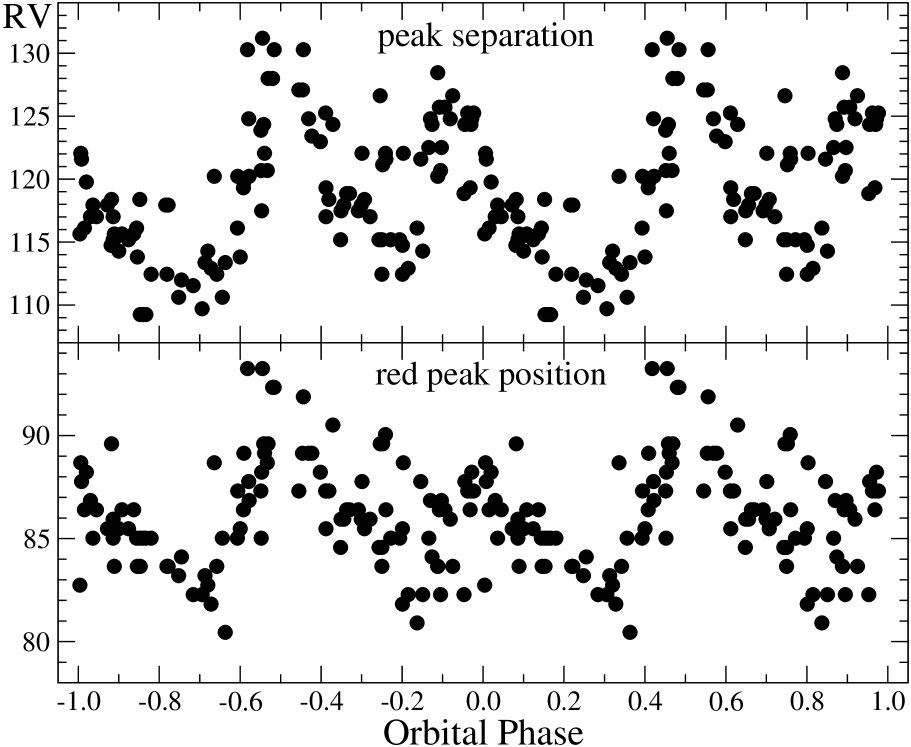
Other features show correlation with the orbital phase (see Fig. 4). The peak intensity ratio shows a tendency for a lower near inferior conjunction (orbital phase = 0.5), when the A-supergiant is located in front of the secondary component. At the same time, the red emission peak is noticeably stronger around this phase. The values of and the red peak intensity vary from cycle to cycle, but overall the dependence keeps its shape. Also, the emission peak separation and the red peak position (measured by fitting an area around the peak with a Gaussian) exhibit a well-defined maximum near the same phase.
|
|
Upper right panel: The H line emission-peak separation. Lower right panel: The H line red emission peak position. RVs are shown in km s-1.
3.3. Spectral Energy Distribution
The IR excess in the SED of 3 Pup has been discussed in several papers. Plets et al. (1995) mentioned that the dusty envelope extends from to , where is the radius of the A-supergiant, with a radial density profile of but have not given the modeling details. The best model of Stee et al. (2004) has similar parameters (, and ), uses a grain size of 1 m, and IR fluxes at wavelengths up to 100 m. The latter authors and Meilland et al. (2010) focused on explaining the mid-IR interferometry results.
We tried reproducing the SED shape in a wider wavelength range. The SED of 3 Pup was constructed from various sources, which included UV, optical photometry, near-IR, and IRAS photometry (presented in Plets et al., 1995), fluxes from more recent IR surveys (WISE, AKARI), and a set of submillimetric fluxes from Jura et al. (2001). The star has been found to show little variability in the visual spectral range (0.03 mag, e.g., Sterken et al., 1993; Adelman & Albayrak, 1997). Therefore, combining data taken at different times to construct the SED is justified. The SED was corrected for the interstellar extinction using mag (see Fig. 5) and the average Galactic reddening law from Savage & Mathis (1979).
It was assumed that the IR excess radiation at wavelengths m originates from a circumbinary dusty disk. The flux density in this case is given by
| (1) |
where and are the disk inner and outer radii, respectively, is the distance to the star, and is the Plank function. The computations were done for a distance of 650 pc. Optical depth of the disk material is the product of a wavelength-dependent disk opacity, , and the radial surface density distribution, . To calculate the disk opacity, we used the Mie theory and considered spherical grains composed of astronomical silicates with a density of 2.5 g cm-3, sizes of m (see Boehler et al., 2013, for a detailed description of the grain emissivity determination), and a size distribution typical of interstellar grains (Mathis et al., 1977). We assumed that the disk has a gas to dust mass ratio of 100 (Bohlin et al., 1978). Contributions from both gas and dust are taken into account in calculating the opacity of the circumstellar material.
The temperature , vertical height and surface density distributions were parametrized as power laws of the disk inner radius:
| (2) |
| (3) |
| (4) |
where is the disk temperature at , that we calculate using the radiative equilibrium equation. The index and the disk vertical height at the inner edge are taken to be free parameters. The index describes the surface density variation with distance from the star. is a surface density at . The total mass of the disk is related to the disk size and surface density as follows:
| (5) |
Conversely, one can express as a function of the disk mass:
| (6) |
Geometry of a disk tilted with respect to the line of sight is accounted for by the approach described in Zakhozhay et al. (2015). It assumes that the disk edges at the inner and outer radii have a cutoff flat geometry and emit as blackbodies with constant temperatures derived from the radiative equilibrium equation and Eq. 2 at the inner and outer edges, respectively.
Using the modeling approach described above and tested on the SED of the young star IRAS 22150+6109 (Zakhozhay et al., 2018), a grid of SEDs for the disk with different parameters was calculated. The ranges and increments of the modeling parameters are shown in Table 3.
The best fit for the SED was found by minimizing:
| (7) |
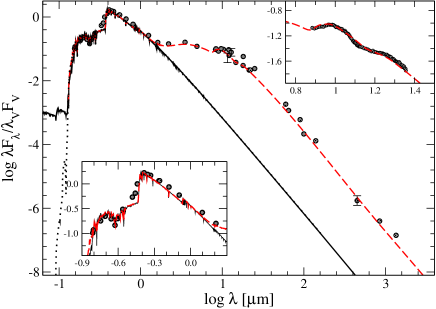
where and are the observed and modeled fluxes (at the corresponding wavelength) respectively. We normalize all the differences to the observed fluxes to account for their large range (, see Fig. 6). We compared the modeled and observed SED only at wavelengths 1 m, where the disk dominates the object’s radiation. At all tilt angles used in the fitting process, there was no attenuation of the A-supergiant by the disk. This is justified by a very good agreement of the dereddened observed UV fluxes and the intrinsic model SED for the chosen Teff of the star as well as by a much poorer agreement of the observed and model fluxes in the near IR region at a very high tilt angle of 80.
We fixed at 4 AU, because this is consistent with the results of the interferometric observations (Meilland et al., 2010; Millour et al., 2011). This value is in agreement with the minimum possible radius, which is the dust sublimation radius (3.88 AU), assuming that the dust sublimation temperature is 1500 K. The best-fit ( = 1.6, Fig. 6) model parameters are listed in the second column of Table 3. Three of them were constrained reasonably well: , = 0.75 and = 1.5. The error bars correspond to 1 uncertainties calculated from the confidence statistics.
Since the disk is optically-thin, which is supported by the presence of the silicate emission features at 10 and 18 m (see the upper inset in Fig. 6), the theoretical SED is not very sensitive to the tilt angle variation in a range of 40–60 and still result in a reasonably good fit to the observed one. The fits get worse outside of this angle range. Therefore, our results on the tilt angle are in good agreement with those from the previous modeling: by Meilland et al. (2010) and Millour et al. (2011).
Similarly, the model does not constrain the disk outer radius, , which determines the flux at the longest wavelengths. The minimum value of that gives a reasonably good agreement with the observed sub-mm flux is 50 AU. Increasing it to 120 AU only weakly contributes to the long-wavelength flux given the temperature decrease with distance from the star and a low optical depth of the dust. This uncertainty affects the total disk mass, which becomes an order of magnitude larger that the best-fit value presented in Table 3 at AU. Nevertheless, even with these problems the total mass of the circumstellar material (dust and gas) remains below 0.01 M⊙ and represents a very small fraction of the total mass of the entire system.
| Parameter | Best-fit | Range | Increment |
|---|---|---|---|
| 60 AU | 20 850 AU | 10 AU | |
| 0.75 | 0.05 | ||
| 1.5 | 0.3 | ||
| 10 | |||
| 10 |
-
The mass of the mass gainer, M2, is listed in Table 4. The uncertainties of the best-fit parameters are discussed in the text.
4. Discussion
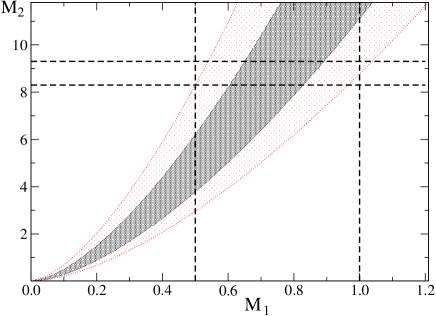
Our orbital solution clearly suggests a stable and unique orbital period of 137.4 days. This is the same as suggested in the very first study of the RV variations by Johnson & Neubauer (1946) and does not support later results by Plets et al. (1995). The RV semi-amplitude is small and, along with the orbital period, results in a small mass function (see Sect. 3.1). The mass function depends on three parameters: masses of both components and the tilt angle of the system rotational axis with respect to the line of sight: , where M1 is the mass of the currently lower-mass component, = M2/M1 is the component’s mass ratio, M2 is the mass of the A-supergiant, and is the tilt angle.
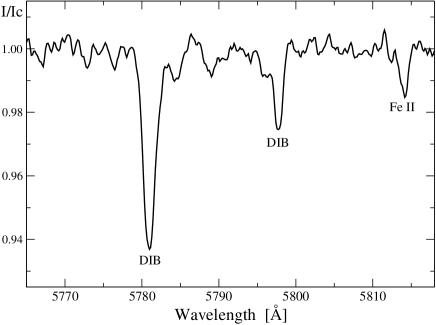
In order to estimate the mass of the A-supergiant, its fundamental parameters need to be determined. The spectral type has varied from B8 i to A3 ii in different papers summarized in SIMBAD, while the effective temperature was reported to be from 8250 K (Aret et al., 2016) to 10000 K (Stee et al., 2004). Comparison with optical spectra of a number of A–type supergiants done by Chentsov et al. (2010) and in this study (see Fig. 1) favors Teff = 8500 K with an uncertainty on the order of 500 K. It is also consistent with the UV and visual SED corrected for the interstellar reddening mag, which was derived from spectral features, such as the 2175 Å band (Rovero & Ringuelet, 1994) and diffuse interstellar bands (see Fig. 5), whose EW were converted into E() using a calibration by Herbig (1993).
The interstellar extinction calculated from the derived reddening, A mag, the absolute visual magnitude of M mag from Chentsov et al. (2010), and the average visual magnitude ( mag) imply a distance of 63085 pc. The latter within the measurement uncertainty coincides with the one (633 pc) calculated from the GAIA parallax (1.580.32 mas, Gaia Collaboration et al., 2018). A very similar distance (650 pc) was used in all the papers published after 2004 quoted here.
The mass of the A-supergiant can be estimated from the evolutionary tracks for single stars, as no signs of the current mass transfer are seen in both photometric (no large brightness variations) and spectroscopic data (weak emission-line spectrum with small and gradual line profile variations). The adopted values of MV and Teff imply a luminosity of L/L. Comparison of these parameters with the evolutionary tracks for rotating single stars with initial atmospheric solar abundances (Ekström et al., 2012) suggests two possible values of the A-supergiant mass: 9.50.5 M⊙ for the pre-red-supergiant phase and 8.80.5 M⊙ for the post-red-supergiant phase (see Fig. 7).
These mass estimates along with the orbital solution can be used to derive the mass of the secondary component. The dusty disk tilt angle derived from our SED modeling is consistent with the interferometric results (Meilland et al., 2010; Millour et al., 2011). Assuming that the binary orbit is tilted with respect to the line of sight at the same angle as the circumbinary disk ( from both interferometric and IR-excess modeling data), the secondary component should have a mass of M M⊙ (see Fig. 8).
There can be two evolutionary scenarios that lead to the current masses of the stars in this system. One scenario assumes the components’ evolution as single stars with no mass-exchange, while the other one involves mass-transfer between the components.
In the former scenario, the lower-mass component would be a solar-like star, which is much fainter than the A-supergiant, still located at main-sequence and not contributing to the observed spectrum. However it seems to be less likely, because the A-supergiant is not massive enough to develop a strong stellar wind, which would supply sufficient amount of material for the observed gaseous and dusty disk. Spectroscopic observations of many supergiants typically show either P Cyg type profiles of Balmer lines (in the most luminous ones with the luminosity type ia) or no line emission at all (in less luminous ones). Even the most luminous ones do not show the presence of dust in their circumstellar environments (e.g., Verdugo et al., 1999).
This reasoning applies to the earlier possible evolutionary phase of the A-supergiant (pre-red-supergiant). The possibility that it is currently a post-red-supergiant is very unlikely. When it reaches the lower-temperature end of the evolutionary track, its radius becomes so large that the system will go through a common envelope phase given the orbital period. After this phase the element abundances of the brighter component will be significantly altered (e.g., the hydrogen abundance becomes much lower, c.f. Vanbeveren et al., 1998), while the observed absorption spectrum of 3 Pup is typical for a pre-red-supergiant phase star (see Fig. 1). Therefore, we favor the scenario of the system evolution with mass-transfer between the components.
The derived components’ masses and the presence of the circumstellar material are qualitatively consistent with the evolutionary models of binary systems that undergo mass transfer calculated by van Rensbergen et al. (2008). A strong mass transfer during the Roche lobe overfilling time by a more massive and more evolved donor resulted in transferring most of its mass to the gainer as well as losing a fraction of the transferred mass to the circumstellar medium and beyond. Some models of van Rensbergen et al. (2008) show that the orbital period can reach several months after the end of the mass transfer phase, and that even the mass donor may get down to such a low mass as 0.6–1.0 M⊙.
Since there was no close match to the system parameters in the published model grid, we extended it using the same calculation approach and found one that has the final period (134 days) and luminosity of the more massive component close to those derived above. The adopted evolutionary track has initial masses of 6.0+3.6 M⊙ and an initial orbital period of 5.0 days using the same approach. It assumes a conservative mass transfer, since the mass of the circumstellar material that we found in our SED modeling (Sect. 3.3) is very small (see Fig. 9). The Roche lobe overflow phase (partially shown in the inset of Fig. 9) lasts for 0.4 Myrs. The system is currently 9 Myrs after this phase, 10 % of its total evolutionary time. These results along with a lack of studies of more distant B- and A-type supergiants may explain a rare detection of such objects.
The evolutionary track for the mass gainer gets close to the current position of the A-supergiant with a mass of 8.8 M⊙. After the end of the mass transfer phase, which lasts for years, the mass gainer evolves as a single star with nearly the final mass (with a small mass loss through the stellar wind). The mass donor has a final mass of 0.8 M⊙, a T K, and a bolometric luminosity an order of magnitude smaller than that of the mass gainer. With these parameters, the hot He-rich dwarf would noticeably contribute to the binary’s SED only at wavelengths below 1000 Å (see Fig. 6). The spectrum of 3 Pup has not been observed in this far-UV region yet.
The difference in the single and binary evolutionary mass of the gainer is not large (10 %) and can be attributed to differences in the evolutionary codes of Ekström et al. (2012) and van Rensbergen et al. (2008) as well as to a different internal structure of the star that is set by the evolutionary path. Since the object’s binarity was revealed and confirmed, we adopt the binary evolutionary mass of M0.5 M⊙ for the gainer. The mass uncertainty is based on that of the luminosity and should be similar to that estimated from the single star evolutionary tracks. The gainer’s mass leads to a slightly altered estimate for the donor’s mass (M0.25 M⊙, see Fig. 8).
| Parameter | Gainer | Donor |
|---|---|---|
| Teff | 8500500 K | 50,000 K |
| R/R⊙. | 547 | 0.3 |
| g | 1.90.1 | 5.0 |
| M/M⊙ | 8.80.5 | 0.750.25 |
-
The parameters are based on our analysis of the spectrum of the A-supergiant and the evolutionary model of the binary (Fig. 9). Teff, R, g, and M are the current effective temperature, radius, surface gravity, and mass of each of the system components.
Spectroscopically, the mass gainer in the 3 Pup binary system is a supergiant and has always been considered belonging to the Be supergiants subgroup. All other objects of the latter subgroup are typically much more massive with an average luminosity of an order of magnitude larger than that of the most luminous FS CMa objects (e.g., Miroshnichenko, 2007). The position of this component in the Hertzsprung-Russell diagram (see Fig. 7) implies that it is currently more consistent with the system classification as a FS CMa object. This subgroup of objects with the B[e] phenomenon was defined by Miroshnichenko (2007), and their properties were interpreted as due to consequences of the mentioned above non-conservative binary evolution. Most properties of 3 Pup (except for the strength of the emission-line spectrum) match those of the FS CMa group. Thus, we suggest a re-classification of the 3 Pup binary system into a FS CMa object.
The orbital solution and the components’ masses result in an orbital semi-major axis of AU or R2, where R2 is the radius of the A-supergiant. According to Eggleton (1983), the Roche lobe of the mass gainer has a radius of 0.65 for the current components’ mass ratio. Therefore, the mass gainer is well confined within its Roche lobe, and its gaseous disk is limited by the Roche lobe size to 2.9 R2.
The derived mass and radius of the mass gainer imply a critical rotation velocity km s-1. Our measurements with the Fourier transform method show that the projected rotational velocity of the A-supergiant is km s-1. This result indicates a slower rotation compared to the previously reported data (e.g., km s-1, Plets et al., 1995). Thus, one should not expect an enhanced mass loss from it. Assuming that the Keplerian gaseous disk extends all the way to the star and its density does not significantly drop outward, the separation of the line emission peaks should be km s-1 (c.f., Huang, 1972). However as seen in Fig. 4, the average peak separation in the H emission line is 120 km s-1. The latter value is expected at a distance of 6 R2, near the L2 point of the system. Along with a stable position of the H line central depression, this result may be interpreted as an evidence for a circumbinary location of the gaseous disk. This idea was suggested by Plets et al. (1995), but the location of the second star in the system was unknown at that time.
The typically weaker blue-shifted peak in this line can then be explained by the presence of a stellar wind from the A-supergiant. The presence of the wind is expected for such a large and a relatively massive star, but, as we mentioned above, a purely wind-driven H emission is usually observed only in more luminous in A-type ia supergiants (e.g., Verdugo et al., 1999). Nevertheless, even a weak wind might provide enough mass flux into the disk to distort the observed H line profile. Modeling of the spectral line profiles is a complicated task and will be attempted in a follow-up paper.
The H line profile features described in Sect. 3.2 can be due to the following mechanisms. The higher level of the central depression along with the presence of the weak bluest peak (see Fig. 3) may be due to an increase in the mass-loss rate from the A-supergiant. This process eventually results in mixing the new material with the disk and, as a consequence, a lower contribution of the circumstellar gas to the RV region responsible for the central depression. The dependence on the orbital phase may be due to a higher contribution of the stellar wind to the line profile, since a smaller fraction of the part of the wind directed toward the observer is attenuated by the mass donor near the superior conjunction orbital phase. The redshift of the red emission peak along with a greater peak separation (see Fig. 4) do not contradict the above explanation.
5. Conclusions
A long-term monitoring of the brightest object exhibiting the Be phenomenon, 3 Pup, resulted in refining the orbit of this binary system and detecting variations of the H line profile, the strongest emission feature in the object’s optical spectrum. From the spectroscopic and GAIA parallaxes, which agree with one another, the derived orbital solution, and consideration of the binary system evolutionary models, we determined the current masses of the system components to be M M⊙ and M M⊙. With such a mass, the mass gainer better fits into the group of FS CMa objects rather than into that of Be supergiants. The mass donor may be a helium-rich subdwarf of a much lower luminosity, explaining why no contribution from such a high-temperature object is observed in the UV fluxes of 3 Pup.
An evolutionary model of a binary system with the components’ initial masses of 6.0 and 3.6 M⊙ and conservative mass transfer was calculated to explain the current fundamental parameters of the A–type component and the observed orbital period. Although it does not imply mass loss from the system, the small amount of the circumstellar material estimated from the IR-excess modeling is not expected to noticeably change the components’ evolution.
We also suggest that the circumstellar gaseous disk is circumbinary. This follows from the separations of the double-peaked emission-line profiles. A stellar wind, which is expected from the A-supergiant, can be responsible for the lower strength of the blue-shifted peak in the H line profile. The circumstellar dust is located further away from the stars than the circumstellar gas, whose outer parts are most likely neutral due to a low temperature of the A-supergiant and a weak contribution of the ionizing radiation from the mass donor.
Modeling the object’s IR excess allowed us to put new constraints on the amount and structure of its dusty disk. The best disk model agrees with the interferometry data on the tilt angle with respect to the line of sight. It also suggests that a dust mass of M⊙ is currently present in the circumbinary disk.
Continuation of a spectroscopic monitoring is strongly suggested to increase the phase coverage during one orbital cycle to investigate the line profile variations in more detail and try detecting an onset of the next strengthening of the central depression in the H line profile. Measurements of the system far-UV fluxes (at Å) are needed to verify the nature of the mass donor.
References
- Adelman & Albayrak (1997) Adelman, S. J., & Albayrak, B. 1997, Information Bulletin on Variable Stars, 4541, 1
- Aret et al. (2016) Aret, A., Kraus, M., & Šlechta, M. 2016, MNRAS, 456, 1424
- Boehler et al. (2013) Boehler, Y., Dutrey, A., Guilloteau, S., & Piétu, V. 2013, MNRAS, 431, 1573
- Bohlin et al. (1978) Bohlin, R. C., Savage, B. D., & Drake, J. F. 1978, ApJ, 224, 132
- Castelli & Kurucz (2003) Castelli, F., & Kurucz, R. L. 2003, in IAU Symposium, Vol. 210, Modelling of Stellar Atmospheres, ed. N. Piskunov, W. W. Weiss, & D. F. Gray, A20
- Chentsov et al. (2010) Chentsov, E. L., Klochkova, V. G., & Miroshnichenko, A. S. 2010, Astrophysical Bulletin, 65, 150
- Donati et al. (1997) Donati, J.-F., Semel, M., Carter, B. D., Rees, D. E., & Collier Cameron, A. 1997, MNRAS, 291, 658
- Eggleton (1983) Eggleton, P. P. 1983, ApJ, 268, 368
- Ekström et al. (2012) Ekström, S., Georgy, C., Eggenberger, P., et al. 2012, A&A, 537, A146
- Gaia Collaboration et al. (2018) Gaia Collaboration, Brown, A. G. A., Vallenari, A., Prusti, T., & et al. 2018, A&A, 616, A1
- Herbig (1993) Herbig, G. H. 1993, ApJ, 407, 142
- Huang (1972) Huang, S.-S. 1972, ApJ, 171, 549
- Johnson & Neubauer (1946) Johnson, H. L., & Neubauer, F. J. 1946, PASP, 58, 248
- Jura et al. (2001) Jura, M., Webb, R. A., & Kahane, C. 2001, ApJ, 550, L71
- Klochkova et al. (2015) Klochkova, V. G., Sendzikas, E. G., & Chentsov, E. L. 2015, Astrophysical Bulletin, 70, 99
- Kraus et al. (2015) Kraus, M., Oksala, M. E., Cidale, L. S., et al. 2015, ApJ, 800, L20
- Manset & Donati (2003) Manset, N., & Donati, J.-F. 2003, in Proc. SPIE, Vol. 4843, Polarimetry in Astronomy, ed. S. Fineschi, 425–436
- Mathis et al. (1977) Mathis, J. S., Rumpl, W., & Nordsieck, K. H. 1977, ApJ, 217, 425
- Meilland et al. (2010) Meilland, A., Kanaan, S., Borges Fernandes, M., et al. 2010, A&A, 512, A73
- Merrill (1934) Merrill, P. W. 1934, PASP, 46, 156
- Millour et al. (2011) Millour, F., Meilland, A., Chesneau, O., et al. 2011, A&A, 526, A107
- Miroshnichenko (2007) Miroshnichenko, A. S. 2007, ApJ, 667, 497
- Monnier et al. (2004) Monnier, J. D., Millan-Gabet, R., Tuthill, P. G., et al. 2004, ApJ, 605, 436
- Panchuk et al. (2017) Panchuk, V. E., Klochkova, V. G., & Yushkin, M. V. 2017, Astronomy Reports, 61, 820
- Plets et al. (1995) Plets, H., Waelkens, C., & Trams, N. R. 1995, A&A, 293, 363
- Rovero & Ringuelet (1994) Rovero, A. C., & Ringuelet, A. E. 1994, MNRAS, 266, 203
- Saio et al. (2013) Saio, H., Georgy, C., & Meynet, G. 2013, MNRAS, 433, 1246
- Savage & Mathis (1979) Savage, B. D., & Mathis, J. S. 1979, ARA&A, 17, 73
- Stee et al. (2004) Stee, P., Bittar, J., & Lopez, B. 2004, ApJ, 602, 978
- Sterken et al. (1993) Sterken, C., Manfroid, J., Anton, K., et al. 1993, A&AS, 102, 79
- Swings (1950) Swings, P. 1950, Annales d’Astrophysique, 13, 114
- Tull et al. (1995) Tull, R. G., MacQueen, P. J., Sneden, C., & Lambert, D. L. 1995, PASP, 107, 251
- van Rensbergen et al. (2008) van Rensbergen, W., De Greve, J. P., De Loore, C., & Mennekens, N. 2008, A&A, 487, 1129
- Vanbeveren et al. (1998) Vanbeveren, D., De Loore, C., & Van Rensbergen, W. 1998, A&A Rev., 9, 63
- Verdugo et al. (1999) Verdugo, E., Talavera, A., & Gómez de Castro, A. I. 1999, A&A, 346, 819
- Zakhozhay et al. (2015) Zakhozhay, O. V., del Burgo, C., & Zakhozhay, V. A. 2015, Advances in Astronomy and Space Physics, 5, 33
- Zakhozhay et al. (2018) Zakhozhay, O. V., Miroshnichenko, A. S., Kuratov, K. S., et al. 2018, MNRAS, 477, 977
Log of spectroscopic observations of 3 Pup
| Date | HJD2450000 | Obs. | Range, Å | Phase | RV | (RV) | IV | IR | Id | |
| 12/25/04 | 3365.042 | CFHT | 360010500 | 0.287 | 5.5 | 0.3 | 1.92 | 2.84 | 0.84 | 0.68 |
| 12/12/06b | 4082.943 | SPM | 38506865 | 0.511 | 1.95 | 2.31 | 1.24 | 0.84 | ||
| 11/15/07 | 4420.016 | SPM | 36006775 | 0.964 | 1.1 | 0.4 | 1.63 | 2.12 | 1.36 | 0.77 |
| 11/20/07b | 4424.982 | SPM | 36006775 | 0.000 | 1.65 | 2.30 | 1.48 | 0.72 | ||
| 10/10/08 | 4750.017 | SPM | 36906800 | 0.365 | 4.4 | 0.5 | 1.75 | 2.98 | 1.15 | 0.59 |
| 11/04/08a | 4774.627 | SAO | 44625926 | 0.545 | 0.5 | 0.1 | ||||
| 12/11/08c | 4811.881 | McD | 360010140 | 0.816 | 1.60 | 2.88 | 1.14 | 0.56 | ||
| 12/13/08c | 4813.887 | McD | 360010140 | 0.830 | 1.58 | 2.90 | 1.15 | 0.55 | ||
| 12/15/08c | 4815.887 | McD | 360010140 | 0.845 | 1.57 | 2.89 | 1.15 | 0.54 | ||
| 02/02/10 | 5230.323 | SAO | 38175279 | 0.861 | 4.2 | 0.2 | ||||
| 02/03/10a | 5231.335 | SAO | 51606690 | 0.868 | 1.83 | 2.88 | 1.17 | 0.64 | ||
| 01/24/12a | 5951.691 | TCO | 45817243 | 0.110 | 2.19 | 2.54 | 1.17 | 0.86 | ||
| 01/27/12a | 5954.685 | TCO | 45797749 | 0.132 | 2.12 | 2.50 | 1.16 | 0.85 | ||
| 02/12/12a | 5970.638 | TCO | 45407242 | 0.248 | 2.10 | 2.59 | 1.14 | 0.81 | ||
| 03/06/12a | 5993.580 | TCO | 46007485 | 0.415 | 2.26 | 2.66 | 1.19 | 0.85 | ||
| 03/10/12a | 5997.571 | TCO | 46007485 | 0.444 | 2.18 | 2.59 | 1.08 | 0.84 | ||
| 10/14/13 | 6573.655 | SAO | 39166980 | 0.636 | 3.6 | 0.2 | 1.99 | 2.84 | 0.88 | 0.70 |
| 12/12/13 | 6639.812 | TCO | 42507900 | 0.118 | 5.2 | 0.2 | 2.01 | 2.53 | 0.91 | 0.79 |
| 01/31/14 | 6689.678 | TCO | 42507900 | 0.481 | 1.2 | 0.2 | 1.98 | 2.85 | 0.92 | 0.70 |
| 02/22/14 | 6711.623 | TCO | 42507900 | 0.640 | 2.4 | 0.1 | 1.94 | 2.91 | 0.86 | 0.67 |
| 02/27/14 | 6716.620 | TCO | 42507900 | 0.677 | 2.7 | 0.2 | 1.92 | 2.91 | 0.89 | 0.66 |
| 03/13/14 | 6730.572 | TCO | 42507900 | 0.778 | 4.3 | 0.2 | 2.00 | 2.84 | 0.89 | 0.70 |
| 03/20/14 | 6737.616 | TCO | 42507900 | 0.830 | 4.1 | 0.3 | 1.95 | 2.82 | 0.90 | 0.69 |
| 03/22/14 | 6739.551 | TCO | 42507900 | 0.844 | 4.3 | 0.2 | 1.95 | 2.81 | 0.95 | 0.69 |
| 03/25/14 | 6742.578 | TCO | 42507900 | 0.866 | 2.5 | 0.3 | 1.93 | 2.80 | 0.88 | 0.69 |
| 03/27/14 | 6744.555 | TCO | 42507900 | 0.880 | 3.8 | 0.2 | 1.92 | 2.86 | 0.87 | 0.67 |
| 04/01/14 | 6749.531 | TCO | 42507900 | 0.916 | 2.1 | 0.3 | 1.92 | 2.61 | 0.86 | 0.74 |
| 04/02/14 | 6750.540 | TCO | 42507900 | 0.924 | 2.0 | 0.3 | 1.92 | 2.75 | 0.83 | 0.70 |
| 04/10/14 | 6758.521 | TCO | 42507900 | 0.982 | 1.8 | 0.2 | 1.97 | 2.65 | 0.84 | 0.74 |
| 04/12/14 | 6760.520 | TCO | 42507900 | 0.996 | 7.1 | 0.2 | 1.95 | 2.67 | 0.82 | 0.73 |
| 04/17/14 | 6765.530 | TCO | 42507900 | 0.033 | 2.2 | 0.2 | 1.99 | 2.71 | 0.87 | 0.73 |
| 12/04/14b | 6996.918 | SPM | 38507270 | 0.717 | 1.91 | 2.75 | 0.94 | 0.70 | ||
| 01/18/15 | 7041.705 | TCO | 42507900 | 0.043 | 2.1 | 0.2 | 1.92 | 2.58 | 0.96 | 0.74 |
| 02/06/15 | 7060.649 | TCO | 42507900 | 0.180 | 7.8 | 0.3 | 1.97 | 2.72 | 0.97 | 0.72 |
| 02/07/15 | 7061.656 | TCO | 42507900 | 0.188 | 7.0 | 0.3 | 1.94 | 2.74 | 0.97 | 0.71 |
| 02/08/15 | 7062.654 | TCO | 42507900 | 0.195 | 7.0 | 0.3 | 1.93 | 2.72 | 0.96 | 0.71 |
| 03/06/15 | 7088.580 | TCO | 42507900 | 0.384 | 4.2 | 0.2 | 1.81 | 2.90 | 1.01 | 0.62 |
| 03/07/15 | 7089.568 | TCO | 42507900 | 0.391 | 8.5 | 0.2 | 1.80 | 2.87 | 1.02 | 0.63 |
| 03/15/15 | 7097.543 | TCO | 42507900 | 0.449 | 2.5 | 0.1 | 1.89 | 2.93 | 0.98 | 0.65 |
| 10/29/15 | 7324.608 | SAO | 39486982 | 0.101 | 4.0 | 0.2 | 2.13 | 2.71 | 0.81 | 0.79 |
| 01/05/16 | 7393.733 | TCO | 42507900 | 0.604 | 0.3 | 0.1 | 1.99 | 2.99 | 0.90 | 0.67 |
| 01/19/16 | 7407.700 | TCO | 42507900 | 0.706 | 4.4 | 0.2 | 1.90 | 2.87 | 0.87 | 0.66 |
| 01/29/16 | 7417.684 | TCO | 42507900 | 0.779 | 4.0 | 0.2 | 1.91 | 2.76 | 0.85 | 0.69 |
| 01/30/16 | 7418.669 | TCO | 42507900 | 0.786 | 2.6 | 0.2 | 1.91 | 2.81 | 0.86 | 0.68 |
| 02/05/16 | 7424.678 | TCO | 42507900 | 0.830 | 2.8 | 0.2 | 1.90 | 2.74 | 0.85 | 0.69 |
| 02/11/16 | 7430.658 | TCO | 42507900 | 0.873 | 3.7 | 0.2 | 1.88 | 2.75 | 0.83 | 0.68 |
| 02/18/16 | 7437.621 | TCO | 42507900 | 0.924 | 2.0 | 0.2 | 1.86 | 2.73 | 0.86 | 0.68 |
| 02/26/16 | 7445.601 | TCO | 42507900 | 0.982 | 1.2 | 0.2 | 1.94 | 2.68 | 0.84 | 0.72 |
| 02/27/16 | 7446.607 | TCO | 42507900 | 0.989 | 0.7 | 0.1 | 1.95 | 2.71 | 0.84 | 0.72 |
| 02/28/16 | 7447.606 | TCO | 42507900 | 0.996 | 0.7 | 0.2 | 1.95 | 2.63 | 0.82 | 0.74 |
| 03/04/16 | 7452.584 | TCO | 42507900 | 0.033 | 3.9 | 0.2 | 1.94 | 2.66 | 0.82 | 0.73 |
| 03/06/16 | 7454.576 | TCO | 42507900 | 0.047 | 3.8 | 0.2 | 1.98 | 2.66 | 0.85 | 0.74 |
| 03/15/16 | 7463.565 | TCO | 42507900 | 0.113 | 5.4 | 0.2 | 2.02 | 2.68 | 0.79 | 0.75 |
| 03/17/16 | 7465.568 | TCO | 42507900 | 0.127 | 6.7 | 0.2 | 2.07 | 2.71 | 0.81 | 0.76 |
| Date | HJD2450000 | Obs. | Range, Å | Phase | RV | (RV) | IV | IR | Id | |
|---|---|---|---|---|---|---|---|---|---|---|
| 03/18/16 | 7466.548 | TCO | 42507900 | 0.134 | 6.9 | 0.3 | 2.11 | 2.76 | 0.84 | 0.76 |
| 03/22/16 | 7470.546 | TCO | 42507900 | 0.163 | 5.5 | 0.3 | 2.18 | 2.83 | 0.85 | 0.77 |
| 03/28/16 | 7476.531 | TCO | 42507900 | 0.207 | 4.5 | 0.3 | 2.14 | 2.78 | 0.85 | 0.77 |
| 04/02/16b | 7481.515 | TCO | 42507900 | 0.243 | 1.94 | 2.73 | 0.99 | 0.71 | ||
| 12/14/16 | 7737.780 | TCO | 42507900 | 0.108 | 5.6 | 0.3 | 1.90 | 2.67 | 0.81 | 0.71 |
| 01/17/17a | 7771.422 | SAO | 46987782 | 0.353 | 1.82 | 3.12 | 0.73 | 0.58 | ||
| 01/18/17 | 7772.668 | TCO | 42507900 | 0.362 | 4.5 | 0.3 | 1.77 | 3.02 | 0.81 | 0.59 |
| 01/26/17 | 7780.681 | TCO | 42507900 | 0.420 | 2.5 | 0.3 | 1.77 | 3.13 | 0.80 | 0.57 |
| 01/28/17 | 7782.654 | TCO | 42507900 | 0.435 | 2.8 | 0.3 | 1.79 | 3.15 | 0.81 | 0.57 |
| 02/03/17 | 7788.671 | TCO | 42507900 | 0.478 | 3.2 | 0.2 | 1.83 | 3.21 | 0.81 | 0.57 |
| 02/04/17 | 7789.635 | TCO | 42507900 | 0.485 | 2.7 | 0.2 | 1.82 | 3.22 | 0.85 | 0.57 |
| 02/05/17 | 7790.640 | TCO | 42507900 | 0.493 | 2.4 | 0.2 | 1.83 | 3.30 | 0.83 | 0.56 |
| 02/17/17 | 7802.618 | TCO | 42507900 | 0.580 | 0.0 | 0.2 | 1.88 | 3.20 | 0.81 | 0.59 |
| 02/19/17 | 7804.620 | TCO | 42507900 | 0.594 | 0.6 | 0.1 | 1.90 | 3.29 | 0.81 | 0.58 |
| 02/23/17 | 7808.598 | TCO | 42507900 | 0.623 | 2.1 | 0.1 | 1.82 | 3.25 | 0.78 | 0.56 |
| 02/25/17 | 7810.609 | TCO | 42507900 | 0.638 | 2.8 | 0.1 | 1.84 | 3.25 | 0.83 | 0.57 |
| 02/26/17 | 7811.598 | TCO | 42507900 | 0.645 | 2.1 | 0.1 | 1.83 | 3.22 | 0.82 | 0.57 |
| 03/02/17 | 7815.589 | TCO | 42507900 | 0.674 | 3.2 | 0.2 | 1.85 | 3.21 | 0.85 | 0.58 |
| 03/03/17 | 7816.597 | TCO | 42507900 | 0.682 | 2.8 | 0.2 | 1.84 | 3.22 | 0.82 | 0.57 |
| 03/04/17 | 7817.587 | TCO | 42507900 | 0.689 | 2.9 | 0.2 | 1.82 | 3.15 | 0.83 | 0.58 |
| 03/05/17 | 7818.601 | TCO | 42507900 | 0.696 | 2.4 | 0.3 | 1.85 | 3.20 | 0.85 | 0.58 |
| 03/08/17 | 7821.612 | TCO | 42507900 | 0.718 | 3.6 | 0.3 | 1.79 | 3.19 | 0.81 | 0.56 |
| 03/09/17 | 7822.587 | TCO | 42507900 | 0.725 | 3.9 | 0.2 | 1.78 | 3.17 | 0.80 | 0.56 |
| 03/10/17 | 7823.586 | TCO | 42507900 | 0.732 | 3.8 | 0.2 | 1.77 | 3.17 | 0.83 | 0.56 |
| 03/12/17 | 7825.585 | TCO | 42507900 | 0.747 | 3.6 | 0.2 | 1.75 | 3.13 | 0.83 | 0.56 |
| 03/15/17 | 7828.567 | TCO | 42507900 | 0.769 | 2.7 | 0.2 | 1.74 | 3.14 | 0.83 | 0.55 |
| 03/16/17 | 7829.573 | TCO | 42507900 | 0.776 | 3.5 | 0.1 | 1.74 | 3.13 | 0.82 | 0.56 |
| 03/19/17 | 7832.558 | TCO | 42507900 | 0.798 | 2.7 | 0.1 | 1.74 | 3.09 | 0.81 | 0.56 |
| 03/22/17 | 7835.561 | TCO | 42507900 | 0.820 | 2.8 | 0.1 | 1.76 | 3.14 | 0.82 | 0.56 |
| 03/23/17 | 7836.582 | TCO | 42507900 | 0.827 | 2.6 | 0.2 | 1.74 | 3.11 | 0.79 | 0.56 |
| 04/01/17 | 7845.517 | TCO | 42507900 | 0.892 | 0.6 | 0.2 | 1.73 | 3.02 | 0.80 | 0.57 |
| 04/02/17 | 7846.509 | TCO | 42507900 | 0.899 | 1.4 | 0.2 | 1.75 | 3.00 | 0.79 | 0.58 |
| 04/04/17 | 7848.522 | TCO | 42507900 | 0.950 | 1.0 | 0.3 | 1.88 | 2.92 | 0.82 | 0.64 |
| 12/04/17b | 8092.939 | SPM | 36507315 | 0.693 | 1.80 | 2.76 | 0.95 | 0.65 | ||
| 12/15/17 | 8103.766 | TCO | 42507900 | 0.771 | 3.7 | 0.2 | 1.81 | 2.74 | 0.93 | 0.66 |
| 01/01/18 | 8120.734 | TCO | 42507900 | 0.895 | 0.9 | 0.2 | 1.81 | 2.76 | 0.94 | 0.66 |
| 01/04/18 | 8123.743 | TCO | 42507900 | 0.917 | 1.3 | 0.2 | 1.84 | 2.74 | 0.96 | 0.67 |
| 01/06/18 | 8125.752 | TCO | 42507900 | 0.931 | 0.3 | 0.2 | 1.83 | 2.72 | 0.97 | 0.67 |
| 01/15/18 | 8134.693 | TCO | 42507900 | 0.996 | 1.4 | 0.1 | 1.83 | 2.61 | 0.93 | 0.70 |
| 01/20/18 | 8139.711 | TCO | 42507900 | 0.033 | 2.9 | 0.1 | 1.82 | 2.63 | 0.93 | 0.69 |
| 01/23/18 | 8142.712 | TCO | 42507900 | 0.055 | 4.1 | 0.2 | 1.82 | 2.65 | 0.91 | 0.69 |
| 01/25/18 | 8144.714 | TCO | 42507900 | 0.069 | 1.7 | 0.2 | 1.85 | 2.70 | 0.94 | 0.69 |
| 01/30/18 | 8149.679 | TCO | 42507900 | 0.106 | 4.7 | 0.2 | 1.86 | 2.74 | 0.94 | 0.68 |
| 01/31/18 | 8150.664 | TCO | 42507900 | 0.113 | 4.1 | 0.2 | 1.89 | 2.80 | 0.97 | 0.68 |
| 02/05/18 | 8155.673 | TCO | 42507900 | 0.149 | 5.6 | 0.2 | 1.96 | 2.80 | 0.95 | 0.70 |
| 02/08/18 | 8158.653 | TCO | 42507900 | 0.171 | 7.0 | 0.2 | 1.95 | 2.89 | 0.92 | 0.68 |
| 02/18/18 | 8168.634 | TCO | 42507900 | 0.243 | 5.7 | 0.3 | 1.82 | 2.87 | 0.93 | 0.63 |
| 02/22/18 | 8172.617 | TCO | 42507900 | 0.272 | 6.7 | 0.3 | 1.74 | 2.49 | 0.90 | 0.70 |
| 02/23/18 | 8173.615 | TCO | 42507900 | 0.280 | 6.8 | 0.3 | 1.70 | 2.78 | 0.90 | 0.61 |
| 02/27/18 | 8177.595 | TCO | 42507900 | 0.309 | 7.1 | 0.3 | 1.70 | 2.80 | 0.93 | 0.61 |
| 03/02/18 | 8180.600 | TCO | 42507900 | 0.331 | 7.0 | 0.3 | 1.70 | 2.68 | 0.94 | 0.63 |
| 03/03/18 | 8181.615 | TCO | 42507900 | 0.338 | 6.6 | 0.3 | 1.73 | 2.85 | 0.96 | 0.61 |
| Date | HJD2450000 | Obs. | Range, Å | Phase | RV | (RV) | IV | IR | Id | |
|---|---|---|---|---|---|---|---|---|---|---|
| 03/04/18 | 8182.599 | TCO | 42507900 | 0.345 | 7.0 | 0.3 | 1.72 | 2.85 | 0.95 | 0.60 |
| 03/05/18 | 8183.594 | TCO | 42507900 | 0.352 | 6.8 | 0.3 | 1.72 | 2.84 | 0.94 | 0.61 |
| 03/07/18 | 8185.590 | TCO | 42507900 | 0.367 | 4.7 | 0.3 | 1.71 | 2.82 | 0.97 | 0.61 |
| 03/14/18 | 8192.577 | TCO | 42507900 | 0.418 | 4.1 | 0.3 | 1.72 | 2.81 | 0.96 | 0.61 |
| 03/15/18 | 8193.592 | TCO | 42507900 | 0.425 | 3.6 | 0.2 | 1.73 | 2.81 | 0.95 | 0.62 |
| 03/16/18 | 8194.580 | TCO | 42507900 | 0.432 | 4.2 | 0.2 | 1.72 | 2.79 | 0.98 | 0.62 |
| 03/18/18 | 8196.541 | TCO | 42507900 | 0.447 | 3.1 | 0.3 | 1.77 | 2.92 | 0.98 | 0.61 |
| 03/22/18 | 8200.556 | TCO | 42507900 | 0.476 | 2.8 | 0.2 | 1.74 | 2.89 | 0.94 | 0.60 |
| 03/23/18 | 8201.542 | TCO | 42507900 | 0.483 | 0.7 | 0.2 | 1.77 | 2.90 | 0.98 | 0.61 |
| 03/26/18 | 8204.548 | TCO | 42507900 | 0.505 | 2.8 | 0.2 | 1.71 | 2.74 | 0.97 | 0.62 |
| 04/04/18 | 8213.514 | TCO | 42507900 | 0.570 | 2.4 | 0.1 | 1.75 | 2.88 | 0.96 | 0.61 |
| 04/09/18a | 8218.183 | SAO | 46967780 | 0.604 | 1.77 | 2.98 | 0.88 | 0.59 | ||
| 04/13/18 | 8222.509 | TCO | 42507900 | 0.636 | 1.5 | 0.1 | 1.73 | 2.91 | 0.87 | 0.60 |
| 11/20/18 | 8443.848 | TCO | 38757912 | 0.246 | 6.5 | 0.2 | 2.00 | 2.54 | 1.01 | 0.79 |
| 12/17/18 | 8470.783 | TCO | 38607912 | 0.442 | 2.3 | 0.1 | 2.09 | 2.59 | 1.01 | 0.81 |
| 12/22/18 | 8475.780 | TCO | 38607912 | 0.479 | 1.4 | 0.1 | 2.12 | 2.71 | 1.02 | 0.78 |
| 12/24/18 | 8477.744 | TCO | 38607912 | 0.493 | 2.6 | 0.2 | 2.07 | 2.65 | 1.01 | 0.78 |
| 12/26/18 | 8479.755 | TCO | 38607912 | 0.508 | 1.3 | 0.4 | 2.08 | 2.72 | 0.99 | 0.77 |
| 01/05/19 | 8489.756 | TCO | 38607912 | 0.580 | 0.2 | 0.1 | 1.98 | 2.68 | 0.94 | 0.74 |
| 01/15/19 | 8499.723 | TCO | 38607912 | 0.653 | 0.2 | 0.1 | 1.96 | 2.69 | 0.95 | 0.73 |
| 01/25/19 | 8509.673 | TCO | 38607912 | 0.725 | 3.0 | 0.2 | 1.89 | 2.65 | 0.96 | 0.71 |
| 02/02/19 | 8517.664 | TCO | 38607912 | 0.783 | 3.1 | 0.2 | 1.85 | 2.67 | 0.95 | 0.69 |
| 02/24/19 | 8539.608 | TCO | 38607912 | 0.943 | 1.0 | 0.2 | 1.94 | 2.62 | 0.95 | 0.74 |
| 03/04/19 | 8547.584 | TCO | 38607912 | 0.001 | 2.2 | 0.1 | 1.92 | 2.61 | 0.95 | 0.74 |
| 03/12/19 | 8555.571 | TCO | 38607912 | 0.059 | 3.2 | 0.2 | 1.87 | 2.62 | 0.97 | 0.71 |
| 03/17/19 | 8560.552 | TCO | 38607912 | 0.096 | 5.4 | 0.3 | 1.84 | 2.65 | 0.96 | 0.69 |
| 03/19/19 | 8562.559 | TCO | 38607912 | 0.110 | 3.7 | 0.2 | 1.87 | 2.66 | 0.97 | 0.70 |
| 03/27/19 | 8570.524 | TCO | 38607912 | 0.168 | 5.8 | 0.2 | 1.87 | 2.73 | 0.97 | 0.69 |
| 03/28/19 | 8571.528 | TCO | 38607912 | 0.175 | 6.4 | 0.2 | 1.85 | 2.54 | 0.94 | 0.73 |
| 11/03/19 | 8791.839 | TCO | 38607912 | 0.779 | 3.7 | 0.2 | 1.50 | 2.52 | 1.02 | 0.60 |
| 12/05/19 | 8823.836 | TCO | 38607912 | 0.012 | 1.1 | 0.2 | 1.99 | 2.49 | 0.97 | 0.80 |
| 12/19/19 | 8837.774 | TCO | 38607912 | 0.113 | 3.1 | 0.2 | 2.11 | 2.48 | 1.00 | 0.85 |
| 01/21/20 | 8870.712 | TCO | 38607912 | 0.353 | 4.7 | 0.3 | 1.92 | 2.60 | 1.03 | 0.74 |
| 01/25/20 | 8874.690 | TCO | 38607912 | 0.382 | 5.4 | 0.3 | 1.91 | 2.64 | 0.99 | 0.72 |
| 02/02/20 | 8882.681 | TCO | 38607912 | 0.440 | 2.5 | 0.3 | 2.00 | 2.69 | 1.01 | 0.74 |
| 02/07/20 | 8887.653 | TCO | 38607912 | 0.476 | 2.3 | 0.3 | 2.03 | 2.79 | 1.03 | 0.73 |
| 02/22/20 | 8902.636 | TCO | 38607912 | 0.585 | 1.4 | 0.1 | 1.99 | 2.82 | 0.99 | 0.71 |
| 02/27/20 | 8907.612 | TCO | 38607912 | 0.621 | 3.4 | 0.1 | 1.99 | 2.80 | 1.00 | 0.71 |
| 02/29/20 | 8909.599 | TCO | 38607912 | 0.636 | 3.2 | 0.1 | 2.00 | 2.78 | 1.01 | 0.72 |
| 03/07/20 | 8916.577 | TCO | 38607912 | 0.686 | 3.7 | 0.1 | 1.99 | 2.77 | 0.99 | 0.72 |
| 03/25/20 | 8934.558 | TCO | 38607912 | 0.817 | 4.9 | 0.2 | 1.81 | 2.65 | 0.96 | 0.68 |
-
Log of spectroscopic observations of 3 Pup. Full Table is shown in the electronic version of the paper. Column information: (1) – Calendar date (MM/DD/YY), (2) – Julian Date (JD2450000), (3) - Observatory ID, (4) – spectral range observed, (5) – orbital phase according to the RV solution (see text), (6) – radial velocity in km s-1 derived by cross-correlation in the range 4460–4632 Å with respect to the template spectrum of 02/17/2017 (see Fig. 1), (7) uncertainty in the radial velocity determination in km s-1, (8–11) – parameters of the H lines profiles: blue peak intensity in continuum units (IV), red peak intensity (IR), intensity of the central depression (Id), and the peak intensity ratio ().
-
Comments on the spectra with no RV measurements: a – a large portion or the entire cross-correlation region was not observed; b – a systematic error in the wavelength calibration; c – region damaged by reflection on the CCD chip.