Resilience and elasticity of co-evolving information ecosystems
Abstract
Human perceptual and cognitive abilities are limited resources[1, 2, 3]. Today, in the age of cheap information –cheap to produce, to manipulate, to disseminate–, this cognitive bottleneck translates into hypercompetition[4] for visibility among actors[5, 6, 7, 8] (individuals, institutions, etc). The same social communication incentive –visibility– pushes actors to mutualistically interact with specific memes[9], seeking the virality of their messages. In turn, contents are driven by selective pressure, i.e. the chances to persist and reach widely are tightly subject to changes in the communication environment. In spite of all this complexity, here we show that the underlying architecture of the users-memes interaction in information ecosystems, apparently chaotic and noisy, actually evolves towards emergent patterns, reminiscent of those found in natural ecosystems[10, 11]. In particular we show, through the analysis of empirical, large data streams, that communication networks are structurally elastic, i.e. fluctuating from modular to nested architecture as a response to environmental perturbations (e.g. extraordinary events)[12]. We then propose an ecology-inspired modelling framework[13], bringing to light the precise mechanisms causing the observed dynamical reorganisation. Finally, from numerical simulations, the model predicts –and the data confirm– that the users’ struggle for visibility induces a re-equilibration of the network towards a very constrained organisation: the emergence of self-similar nested arrangements.
Introduction
Our current experience of the accelerated stream of digital content[14] has exposed, in full range, the tight bio-cognitive limitations that we are subject to[1, 2, 3]. Yet, their finiteness had not, in general, arisen in quotidian communication processes: not in the pre-industrial age, where physical (face to face) or low-bandwidth interaction governed the slow change of public opinion; and neither during the predominance of mass media, when the exposure to an oligopolistic media environment put little pressure to the attentional resources of the audience. In both cases, the public sphere was hierarchically structured and framed by the operations of few actors on a rather slow time scale. Contrarily, the paradigm of online communication is characterised by the fragmentation of the public sphere[15], in which elite and non-elite actors behave like information sources and receivers on the virtual stage. Only in this new scenario, attention, memory and processing time suddenly become critical assets to compete for[5, 6, 7, 8]: their scarcity has been exposed.
Complementary to direct competition (among actors), interaction with other units in the system is often mutualistic. For the same reason that two actors compete with each other, they establish cooperative relationships with the memes (keywords, hashtags). These “information chunks” may –if correctly chosen– optimally spread information and consolidate the visibility they strive for. Hence, for example, the (ab)use of hyper-emotional language that we suffer in nowadays politics, as an arms race to impact optimisation.
Of course, the choice of a meme is context-dependent (“past performance is no guarantee of future results”), and thus the interactions between actors and memes are co-evolving and extremely sensitive to changes in the communication environment –breaking news, fads and rumours, celebrity gatherings, etc–. In turn, changes in the surrounding conditions tend to be ephemeral although frequent, in the more open and fluid access to many digital sources.
Under the light of these four drivers –competition, mutualism, co-evolution, environment–, online communication systems become a special case of mutualistic ecosystems[10]. Our failure to realise this in the past (despite some clues[5, 6, 7, 8, 12]) is perhaps due to the extreme difference between the time scales that dominate the two relevant components at stake: the slow-changing social contacts (user-user) network, and the accelerated dynamics through which information is created and spread[14] –the former can be safely considered static if compared to the latter[16], completely missing the co-evolutive aspect of the system–. However, this picture changes dramatically if the focus is shifted from the relatively stable peer-to-peer network to the fluid information network, that is, ad hoc groups of users, which loosely gather around and engage in shared memes [17], operating in a hyper-competitive environment[4].
This revealing picture opens new promising possibilities to analyse and model online social networks, if we consider that Ecology is rich in theoretical frameworks where the co-evolutionary interplay between structure and dynamics is studied[13, 18, 19]. Moreover, while testing these theories empirically in natural ecosystems is difficult –mainly because of the resource-intensive demands to collect data[20]–, digital streams from social interactions are abundant on several spatial and temporal scales, and precise knowledge about the environmental (external) conditions –related to specific information flows– can also be collected.
The first problem to address under this information ecosystems framework is the network’s structural volatility, which is coupled to the fluctuating nature of the environment. Online communication is heavily driven by the events surrounding it, which constantly trigger attention shifts that modify the behaviour of otherwise loosely linked assemblages of individuals and groups[4]. It is precisely this hectic, information-dense environment that dictates the emergence and fall of ephemeral synchronised attention episodes, which translate in fast structural changes.
Here, we provide evidence that information ecosystems exhibit a remarkable structural elasticity to environmental changes. To do so, we first report on theory-free, empirical observations of the characteristic dynamical re-organisation in communication networks, as they react to environmental “shocks”. Analysing the response of the Twitter ecosystem to different types of external events, we quantify how collective attention episodes reshape the user-hashtag information network, from a modular[21, 22] to a nested[23, 24] architecture, and back. The emergence of these structural signatures is, remarkably, consistent across different topics and time scales. Next, we propose a theoretical framework that explains the emergence of the patterns observed in real data streams, as a result of an adaptive mechanism. The model builds on the idea that the user-meme network structure is effectively driven by an optimisation process[13], aiming at the maximisation of visibility, and that the nature of the user-meme interactions is mutualistic, i.e., beneficial for both. Furthermore, through our modelling framework we predict that the users’ struggle for visibility in any context facilitates the emergence of nested self-similar arrangements: either mesoscale (in-block) nestedness[25, 26] during the compartmentalised stages, or macroscale nestedness in exceptional global attention episodes. We finally show that these predictions are supported by the data.
Results
Structural elasticity in information systems
Biased as it may be[27], Twitter is without a doubt a sensitive platform that mirrors, practically without delay, exogenous events occurring in offline environments. In this sense, Twitter data constitute a rich stream, providing a public and machine-readable vision of the non-virtual world.
Despite the highly fluctuating nature of this endless communication stream, some reliable patterns emerge from its apparently hectic activity. We analyse these streams in a longitudinal manner, as a series of snapshots from time-resolved activity. Each slice is represented as a bipartite network with a fixed number of most active users (), and the corresponding hashtags created and/or cited by these users, see Methods Summary below. Such sequence of networks is studied monitoring different structural arrangements that are relevant to the dynamical stage in which the system is. For now, we focus on two of them: modularity[21, 22] () and nestedness[28, 29, 24] (), see the Methods Summary. High levels of modularity correspond to a fragmented attention scenario, and can be considered as the resting state of the system. In this stage, users mostly focus on their own topics of interest, i.e. a certain subset of memes, facilitating the emergence of identifiable blocks. High values of nestedness, on the other hand, reflect an extraordinary (and, thus, ephemeral) stage in which the system self-organises to attend one or few topics. In these cases, the discussion revolves around a small set of generalist memes (hashtags used virtually by everybody) and users (highly active individuals participating in many facets of the discussion).
(a)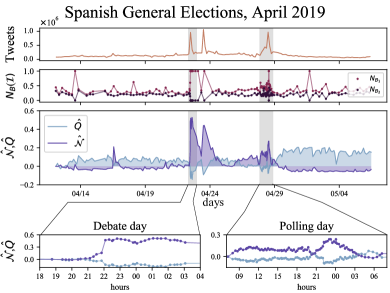 0.075in1.4in
\topinset(b)
0.075in1.4in
\topinset(b)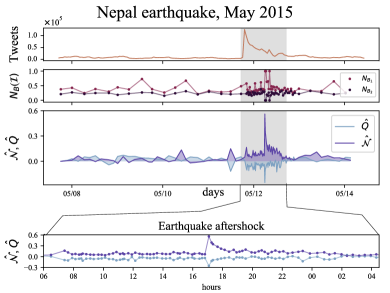 0.075in1.4in
Figure 1 presents the evolution of and on two different portions of Twitter activity (several more are shown in section 3.1 of the Supplementary Material, with similar insights). For example, Fig. 1a corresponds to a period of over 45 days around the local elections in Spain (April-May 2019) (see section 1.1 of the Supplementary Material for details). For this dataset, the evolution of and shows a perfectly anti-correlated behaviour. Such behaviour can be explained by the mutual structural constraints that these two arrangements impose on each other[30]. Remarkably, however, the significant growth of nestedness is not merely due to the fluctuating character of the system, but, on the contrary, tightly linked to external events: see for instance the sudden changes in the structure on specific dates, shadowed in grey in the figure (debate and polling day, respectively). These extraordinary events are accompanied, unsurprisingly, by an increased volume of messages (top panel). The figure, at the scale of days, is complemented with high-resolution monitoring of portions of these exceptional events (bottom panel), which confirm the general anti-correlated trend. Finally, the most outstanding feature highlighted by the figure is the elasticity of the network: no matter how abrupt and large the excursion to a nested arrangement is, the system bounces back to its “ground” –predominantly modular– state soon after, when the interest in the breaking news fades out. The observed elasticity can be considered as an aspect of the network’s structural resilience. System resilience or stability is defined in different ways in ecology and environmental science[31, 32, 33], but can generally be thought as the ability of the system to recover the original system’s state after a perturbation of the model state variables[34, 35] or parameters[36, 37]. Specifically, in the case of structural elasticity, the system state is not given by the nodes’ configuration (e.g. the abundance of each species), but by the overall network architecture (i.e. modular, nested), which is perturbed by the external event.
This behaviour is stable across different types of event. Figure 1b shows an equivalent behaviour for a completely different event. In this case, the dataset comprises the reaction after the Nepal earthquake in 2015[38], including a major aftershock on May 12th. Unlike a political debate or an election date, this example is inherently unexpected and unpredictable –an important fact, attending the taxonomy of collective attention described in Lehmann et al.[39]. As in Fig. 1a, the coarse grain scale of days and weeks in Fig. 1b is complemented with high-resolution monitoring a portion of exceptional events. See Supplementary Material for additional examples.
These analyses suggest that there is a tight logic underlying the structural fluctuations of the information network: the level of fragmentation of collective attention maps onto specific network arrangements, and is independent of the particular contents of the data stream. Online activity on different topics translates to comparable changes in the resulting patterns, no matter the semantics of the underlying discussion. The observed differences in the emergence, magnitude and persistence of structural changes are directly related to the predictability, intensity and duration of the exogenous events (i.e. related to the environmental conditions), and therefore cannot be explained as intrinsic to the communication system itself. The question remains, however, how a networked system can fluctuate so fast between two states which have often been considered incompatible[40, 41, 30].
Theoretical Framework
To understand the mechanisms that govern the observed elasticity, and, at the same time, to solve the puzzle around the network’s nested-modular oscillations, we propose a model founded on the ecological drivers introduced above: competition, mutualism, co-evolution and environment. The model builds on the simple idea that the network architecture between users and memes is the result of several local optimisation processes, i.e. each individual’s maximisation of visibility, and that such process operates on top of attentional dynamics. To do so, we generalise the ecological adaptive modelling proposed by Suweis et al.[13, 19], in which the system’s actors (plant and pollinator species) strive for larger individual abundance, rewiring their interactions accordingly.
The Model.
The synthetic information network model comprises a total of interacting “species” or nodes ( users and hashtags or memes), in which population dynamics –where population here quantifies the visibility of the users and/or of the memes– is driven by interspecific mutualistic interactions, following a Lotka-Volterra dynamics with Holling-Type II functional response [42, 13].
Each species has an associated niche[43] which, in the context of an information ecosystem, represents their topical domain (i.e. the topic to which a user attends preferentially, and, conversely, the semantic space where a meme belongs to). For the sake of simplicity, each species’ niche is represented as a Gaussian distribution with a given standard deviation [19]. Both users and memes niches are anchored around different points in the range , to express different topic preferences (users), and semantic domain (memes). To model the inherent diversity of users and memes within their topic, their position over the line is perturbed by a small amount, randomly sampled from a uniform distribution.
Competition occurs between species of the same class (or guild), whereas mutualistic interactions couple the dynamics of abundance of users and memes. Following the proposal of Cai et al.[19], the strength of the competitive interactions between a pair of users (memes) is tuned by a fixed parameter () scaled by a quantity that depends on the niche overlap between them. Similarly, the strength of the mutualistic interactions between a pair user-meme results from a fixed parameter () scaled by the niche overlap between the pair user-meme –i.e. the similarity between the user’s topic preference and the adequacy of the meme within this topic–, and constrained to the existence of a link between them. Figure 2a summarises the ingredients of the model. We note that, in contrast to natural ecosystems, memes are an infinite resource –which explains why user-user competition does not grow with the amount of shared memes.
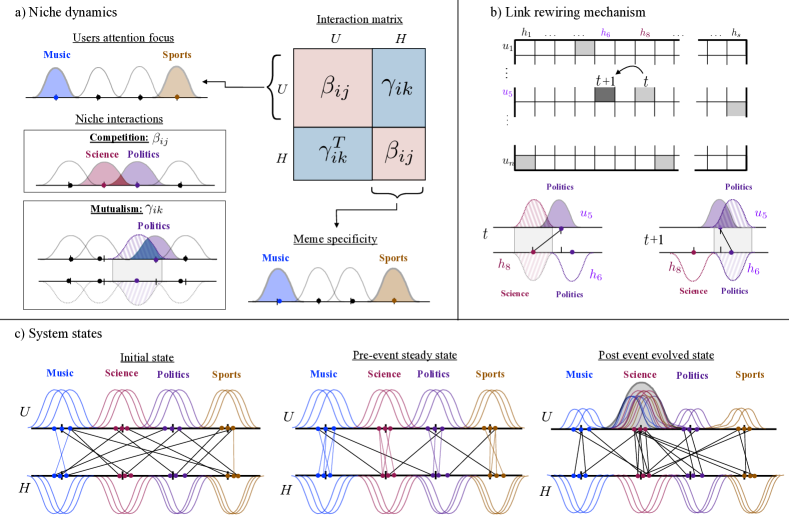
On the dynamical side, each user attempts to change its mutualistic partners (memes) in order to maximise the benefit obtained from their use (see Supplementary Material). This optimisation principle may then be interpreted within an adaptive framework, in which users incrementally enhance their visibility by choosing the appropriate memes, and memes are created so as to maximise their diffusive capacity, see Figure 2b. In summary, both classes optimise the efficiency of resource usage, decreasing their chances of becoming extinct due to stochastic perturbations[7]. Within the model, this translates into reiterative rewiring interactions of randomly drawn users so as to increase their visibility –“abundance” in the ecological jargon.
Since our primary objective is to reproduce structural changes under the irruption of external events, the dynamical model includes as well a mechanism to introduce exogenous events in the environment. These can be understood as transitory shifts in the users’ attentional niches, which are tantamount to (typically short-lived) changes in their interests (Figure 2c). In this altered environment, users temporarily engage with new kinds of hashtags, different from those they usually interact with (see the Methods Summary and Supplementary Material).
Structural evolution.
In an unperturbed simulated environment, the observed emergent structural arrangement mimics the prescribed organisation of niches in topical blocks. That is, a modular architecture arises from the random initial one, see Figure 3 for (note that the plot is shifted by , i.e. modularity at time , once the system has stabilised its architecture). This is in line with the resting state observed in the datasets (Figure 1), where users are focused on their own topics of interest. It is important to underline that the emergence of a modular architecture is not an artefact of the model: users (memes) do not rewire by similarity reasons; it is the search for an improvement in their individual visibility that naturally drives to the consolidation of those new connections. Also note that, in empirical settings, the random initial stage is impossible to observe since the network already has a modular organisation from the very beginning.
An abrupt change in the environment –e.g. breaking news– totally alters this scenario. The system reacts almost immediately with a sharp decrease in , and an increase in the amount of nestedness in the system, Figure 3a for . A similar phenomenon occurs if the simulation refers to a predictable event, Figure 3b, except that the collapse of is smoother, and the emergence of nestedness is slightly delayed. Indeed, in this situation we recover the results in Suweis et al.[13] –the emergence of global nestedness–, because the existence of attentional niches becomes irrelevant when all niches are equally centred, at least on the users’ side. In this sense, our niche-based population dynamics is a generalisation of Suweis and co-authors’ model. As the environmental shock fades out, the network architecture tends to recover the general layout present before the event was introduced, see . The elasticity of empirical information ecosystems is thus replicated here, and explained as a consequence of the adaptation to contextual changes –while the species’ local strategies remain constant.
(a)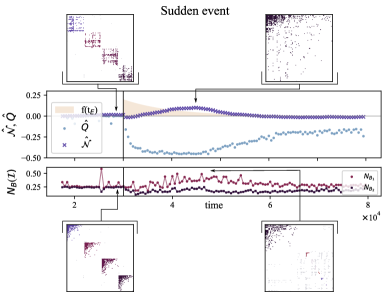 0.075in1.4in
\topinset(b)
0.075in1.4in
\topinset(b)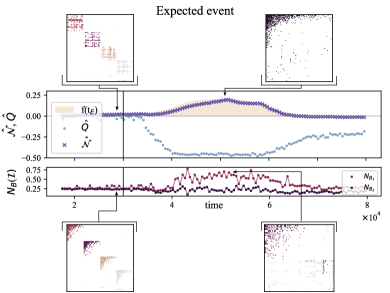 0.075in1.4in
Nestedness reframed: multi-scale analysis.
Beyond the examination of the evolution of and , we now take a closer look at the intra-modular organisation of connections during the fragmentary stage of the system (). For visualisation purposes, the rows and columns of the adjacency matrices in the top-left part of Figures 3a and 3b have been arranged to highlight the block structure that results from modularity optimisation. Additionally, rows and columns inside modules were sorted, in the bottom-left part, in order to highlight the possible nested structure within them[44, 45]. Clear to the naked eye, each compartment presents an internal nested architecture. This is a natural consequence of the node-level visibility-maximisation strategy as it adapts to system-wide environmental conditions: as long as these conditions are stable around weakly connected topics, nestedness emerges in those relatively isolated subsystems. Moreover, As soon as the boundaries across subsystems are blurred (, top-right of Figures 3a and 3b), global nestedness prevails.
This subtle insight, which stems from the model, reframes the empirical findings presented above. Indeed, the information network is not swapping between two radically different architectures –often even antagonistic[40, 30]–, but rather fluctuating across nested self-similar arrangements at different scales. To quantify them, is not a suitable tool, because it is designed to capture nestedness at the global scale only. For this reason, we resort to in-block nestedness [26, 30, 46], which generalises . On the one hand, when nestedness emerges at the global scale (one block, ), then we have that . On the other hand, when the network presents several blocks (), each one arranged in a nested manner, then .
It makes sense now to revisit the previous numerical and empirical results, now through the lens of in-block nestedness. Figure 1 (second panels in (a) and (b)), and Figure 3 (bottom panels in (a) and (b)) monitor the relative size of the largest () and second largest () nested blocks. In both empirical and numerical cases, we observe that nearly-perfect consensus is reached at different moments () during the exogenous events, while a fragmented public sphere dominates most of the time. The relative size of the second largest nested block () allows for an easier interpretation of the level of consensus reached at each time.
Our framework allows to explain the puzzling transition between partial and global consensus. A fast re-organisation from modular (nested) to nested (modular) architectures seems paradoxical and hard to achieve. Nevertheless, the system can swiftly adapt to any state of collective attention through an intermediary arrangement that combines the structural signature of visibility maximisation with the existence of a fragmented public sphere.
Discussion
The transit from a secular hierarchical management of public information to a decentralised and fragmentary scenario calls for a new vision in which the relevant drivers are identified: competition for cognitive resources, mutualistic exploitation of content, co-evolution of users’ and memes’ visibility, and environmental conditions. So far, incursions in such ecological mindset have been sparse[6, 7, 12, 14]. In this work, going beyond a simple metaphoric interpretation, we prove that an ecological framework –with explicit use of competitive and mutualistic interactions as drivers of information dynamics– is a powerful tool to describe the evolution of information ecosystems. Indeed, although simple neutral models may account for emergent patterns in the popularity distribution[6, 7], we show that our non-neutral, niche-based population dynamics model can successfully explain the complex interplay between users-memes interactions, attentional niches and environmental shocks.
Our results open an ambitious research alley. In the shorter term, future efforts should attempt to mimic the microscopic dynamics of users and memes abundances before and after breaking events. These cannot be explained without including death-birth and invasion processes[47], which are in turn necessary to understand how influential users and viral contents emerge. Similarly, this initial proposal rules out “cultural drift” –the slower changes in the users’ topical preferences–, which leads to persistent structures and shapes communication flows.
Reaching further, the tradition in theoretical ecology aimed at understanding and preventing the collapse of ecosystems can be adopted to decipher how social media and information bubbles shape our thinking[48], or, in the opposite direction to disrupt and break misinformation dynamics and polarisation. Related to this, we foresee as well a connection between the extensive research on stability and resilience in natural ecosystems, and their informational counterparts. In this sense, we are convinced that such interchange of techniques and models could be beneficial for theoretical ecology too as it will allow to test theories and methodologies in a more controlled, data-rich environment with faster time scale at play.
Methods Summary
Empirical and synthetic data.
Matrix generation.
For both synthetic and empirical cases, we represent a bipartite unweighted network as a matrix , where rows and columns refer to users and hashtags, respectively. Elements therefore represent links in the bipartite network, i.e. if the element has a value of , it represents that the user produced the hashtag at least once, otherwise is set to .
For the generation of synthetic data, we set up a small network of 100 users and 100 hashtags, and the interactions between users and hashtags are laid at random with a fixed connectance of . Then, for the empirical case, we build a sequence of snapshots by splitting the Twitter datasets into chunks containing the most active unique users, while the number of hashtags is variable (depending on the amount produced by those 2000 users). In this way, for each snapshot, a rectangular binary presence-absence matrix is created. See Figure S1 and surrounding text in the Supplementary Material for further details on the construction of networks.
Structural measures.
In this work, we explore the structural evolution of the network by means of three arrangements, one at the macroscale (nestedness[28, 29]), and two at the mesoscale (modularity[21], in-block nestedness[25, 26, 30]). We focus our attention on modular, nested and in-block nested patterns since all of them have been observed prominently in ecology[49, 41, 40, 44] and in information systems[12, 26]. We quantify the amount of nestedness by means of a global nestedness fitness , introduced by Solé-Ribalta et al.[26], an overlap measure[50] that includes a suitable null model. We follow this work as well for the definition and optimisation strategy of in-block nestedness . With respect to community analysis, we apply a variant of the extremal optimisation algorithm[51], adapted[30] to maximise Barber’s bipartite modularity[52].
Niche model and population dynamics.
To perform the numerical simulations, we employ a model that follows a Lotka-Volterra dynamics, with Holling-Type II mutualistic functional response[42, 13]:
| (1) | ||||
Here, the coupling matrices and define the competitive (within guild) and mutualistic (across guild) interactions, respectively. Both interaction matrices depend linearly on the niche overlap between pairs of species. Additionally, these matrices have a global factor, or , which tune the strength of competitive or mutualistic interaction, respectively. The niche profile for each species is modelled as a Gaussian function, and we assume that each user and hashtag is involved in niche relations according to assigned topics of their interest. In particular, a number of equidistant topics are created on the niche axis. Finally, is the adjacency matrix. , and is the handling time of the Holling-Type II mutualistic functional response. See the Supplementary Material for details.
In our information ecosystem, these equations represent a phenomenological way to describe the evolution of the nodes visibility as a function of their interaction. In particular, may represent the number of instances in which user is present in other users’ screens, while may quantify the popularity of a given hashtag . Assuming that preferential attachment mechanisms of various type affect the nodes visibility, and model the associated exponential growth (if they are positive). The handling time effectively models the constraint that users cannot interact with a very large number of hashtag s due both to time and character constraints. Due to these limitations, the benefit obtained through mutualistic interactions does not grow monotonically with the number of partners.
Simulations are performed by integrating the system of ordinary differential equations using a fourth-order Runge-Kutta method. Then, we start a rewiring process following the approaches in Suweis et al.[13] and Cai et al.[19]: at constant time intervals, species will rewire recurrently in order to maximise their individual abundances. We assign the same initial abundance and intrinsic growth rates to all users and hashtags. Species are considered to suffer extinction when their abundance density is lower than . Finally, the handling time , of the Holling-Type II mutualistic functional response is set to .
References
- [1] Simon, H. A. Theories of bounded rationality. \JournalTitleDecision and organization 1, 161–176 (1972).
- [2] Kahneman, D. Attention and effort (Prentice-Hall., Englewood Cliffs, N.J, 1973).
- [3] Posner, M. I. Cumulative development of attentional theory. \JournalTitleAmerican Psychologist 37, 168 (1982).
- [4] Chadwick, A. The political information cycle in a hybrid news system: The british prime minister and the “bullygate” affair. \JournalTitleThe International Journal of Press/Politics 16, 3–29 (2011).
- [5] Gonçalves, B., Perra, N. & Vespignani, A. Modeling users’ activity on twitter networks: Validation of dunbar’s number. \JournalTitlePloS One 6, e22656 (2011).
- [6] Weng, L., Flammini, A., Vespignani, A. & Menczer, F. Competition among memes in a world with limited attention. \JournalTitleScientific Reports 2, 335 (2012). DOI 10.1038/srep00335.
- [7] Gleeson, J. P., Ward, J. A., O’Sullivan, K. P. & Lee, W. T. Competition-induced criticality in a model of meme popularity. \JournalTitlePhysical Review Letters 112, 048701 (2014).
- [8] Gleeson, J. P., O’Sullivan, K. P., Baños, R. A. & Moreno, Y. Effects of network structure, competition and memory time on social spreading phenomena. \JournalTitlePhysical Review X 6, 021019 (2016).
- [9] Dawkins, R. The selfish gene (Oxford University Press, 2016), 4th edn.
- [10] Bascompte, J. & Jordano, P. Plant-animal mutualistic networks: the architecture of biodiversity. \JournalTitleAnnual Review of Ecology, Evolution, and Systematics 567–593 (2007).
- [11] Stouffer, D. B. & Bascompte, J. Compartmentalization increases food-web persistence. \JournalTitleProceedings of the National Academy of Sciences 108, 3648–3652 (2011). DOI 10.1073/pnas.1014353108.
- [12] Borge-Holthoefer, J., Baños, R. A., Gracia-Lázaro, C. & Moreno, Y. Emergence of consensus as a modular-to-nested transition in communication dynamics. \JournalTitleScientific Reports 7, 41673 (2017).
- [13] Suweis, S., Simini, F., Banavar, J. R. & Maritan, A. Emergence of structural and dynamical properties of ecological mutualistic networks. \JournalTitleNature 500, 449 (2013).
- [14] Lorenz-Spreen, P., Mønsted, B. M., Hövel, P. & Lehmann, S. Accelerating dynamics of collective attention. \JournalTitleNature Communications 10, 1759 (2019).
- [15] Bruns, A. & Highfield, T. Is Habermas on Twitter?: Social media and the public sphere. In The Routledge companion to social media and politics, 56–73 (Routledge, 2015).
- [16] Vespignani, A. Modelling dynamical processes in complex socio-technical systems. \JournalTitleNature Physics 8, 32–39 (2011).
- [17] Bruns, A. & Burgess, J. E. The use of Twitter hashtags in the formation of ad hoc publics. In Proceedings of the 6th European Consortium for Political Research General Conference (2011).
- [18] Guimarães Jr, P. R., Pires, M. M., Jordano, P., Bascompte, J. & Thompson, J. N. Indirect effects drive coevolution in mutualistic networks. \JournalTitleNature 550, 511–514 (2017).
- [19] Cai, W., Snyder, J., Hastings, A. & D’Souza, R. M. A dynamic niche model for the emergence and evolution of mutualistic network structures. \JournalTitlearXiv preprint (2018).
- [20] Pilosof, S., Porter, M. A., Pascual, M. & Kéfi, S. The multilayer nature of ecological networks. \JournalTitleNature Ecology & Evolution 1, 0101 (2017).
- [21] Newman, M. E. & Girvan, M. Finding and evaluating community structure in networks. \JournalTitlePhysical Review E 69, 026113 (2004).
- [22] Fortunato, S. Community detection in graphs. \JournalTitlePhysics Reports 486, 75–174 (2010).
- [23] Payrató-Borràs, C., Hernández, L. & Moreno, Y. Breaking the spell of nestedness: The entropic origin of nestedness in mutualistic systems. \JournalTitlePhysical Review X 9, 031024 (2019).
- [24] Bascompte, J., Jordano, P., Melián, C. J. & Olesen, J. M. The nested assembly of plant–animal mutualistic networks. \JournalTitleProceedings of the National Academy of Sciences 100, 9383–9387 (2003).
- [25] Lewinsohn, T. M., Inácio Prado, P., Jordano, P., Bascompte, J. & Olesen, J. M. Structure in plant–animal interaction assemblages. \JournalTitleOikos 113, 174–184 (2006).
- [26] Solé-Ribalta, A., Tessone, C. J., Mariani, M. S. & Borge-Holthoefer, J. Revealing in-block nestedness: detection and benchmarking. \JournalTitlePhysical Review E 96, 062302 (2018).
- [27] González-Bailón, S., Wang, N., Rivero, A., Borge-Holthoefer, J. & Moreno, Y. Assessing the bias in samples of large online networks. \JournalTitleSocial Networks 38, 16–27 (2014).
- [28] Patterson, B. D. & Atmar, W. Nested subsets and the structure of insular mammalian faunas and archipelagos. \JournalTitleBiological Journal of the Linnean Society 28, 65–82 (1986).
- [29] Atmar, W. & Patterson, B. D. The measure of order and disorder in the distribution of species in fragmented habitat. \JournalTitleOecologia 96, 373–382 (1993).
- [30] Palazzi, M., Borge-Holthoefer, J., Tessone, C. & Solé-Ribalta, A. Macro-and mesoscale pattern interdependencies in complex networks. \JournalTitleJournal of the Royal Society Interface 16, 20190553 (2019).
- [31] Holling, C. S. Engineering resilience versus ecological resilience. \JournalTitleEngineering within ecological constraints 31, 32 (1996).
- [32] Folke, C. et al. Resilience thinking: integrating resilience, adaptability and transformability. \JournalTitleEcology and society 15 (2010).
- [33] Ives, A. R. & Carpenter, S. R. Stability and diversity of ecosystems. \JournalTitlescience 317, 58–62 (2007).
- [34] Suweis, S., Grilli, J., Banavar, J. R., Allesina, S. & Maritan, A. Effect of localization on the stability of mutualistic ecological networks. \JournalTitleNature Communications 6, 10179 (2015).
- [35] Arnoldi, J.-F., Loreau, M. & Haegeman, B. Resilience, reactivity and variability: A mathematical comparison of ecological stability measures. \JournalTitleJournal of Theoretical Biology 389, 47–59 (2016).
- [36] Rohr, R. P., Saavedra, S. & Bascompte, J. On the structural stability of mutualistic systems. \JournalTitleScience 345, 1253497 (2014).
- [37] Grilli, J. et al. Feasibility and coexistence of large ecological communities. \JournalTitleNature Communications 8, 14389 (2017).
- [38] Zubiaga, A. A longitudinal assessment of the persistence of twitter datasets. \JournalTitleJournal of the Association for Information Science and Technology 69, 974–984 (2018).
- [39] Lehmann, J., Gonçalves, B., Ramasco, J. J. & Cattuto, C. Dynamical classes of collective attention in twitter. In Proceedings of the 21st international conference on World Wide Web, 251–260 (ACM, 2012).
- [40] Thébault, E. & Fontaine, C. Stability of ecological communities and the architecture of mutualistic and trophic networks. \JournalTitleScience 329, 853–856 (2010).
- [41] Fortuna, M. A. et al. Nestedness versus modularity in ecological networks: two sides of the same coin? \JournalTitleJournal of Animal Ecology 79, 811–817 (2010).
- [42] Bastolla, U. et al. The architecture of mutualistic networks minimizes competition and increases biodiversity. \JournalTitleNature 458, 1018–1020 (2009).
- [43] Williams, R. J. & Martinez, N. D. Simple rules yield complex food webs. \JournalTitleNature 404, 180 (2000).
- [44] Flores, C. O., Meyer, J. R., Valverde, S., Farr, L. & Weitz, J. S. Statistical structure of host–phage interactions. \JournalTitleProceedings of the National Academy of Sciences 108, E288–E297 (2011).
- [45] Flores, C. O., Valverde, S. & Weitz, J. S. Multi-scale structure and geographic drivers of cross-infection within marine bacteria and phages. \JournalTitleThe ISME Journal 7, 520–532 (2013).
- [46] Palazzi, M. J., Cabot, J., Izquierdo, J. L. C., Solé-Ribalta, A. & Borge-Holthoefer, J. Online division of labour: emergent structures in open source software. \JournalTitleScientific Reports 9, 1–11 (2019).
- [47] Hui, C. & Richardson, D. M. Invasion dynamics (Oxford University Press, 2017).
- [48] Rahwan, I. et al. Machine behaviour. \JournalTitleNature 568, 477–486 (2019).
- [49] Olesen, J. M., Bascompte, J., Dupont, Y. L. & Jordano, P. The modularity of pollination networks. \JournalTitleProceedings of the National Academy of Sciences 104, 19891–19896 (2007).
- [50] Almeida-Neto, M., Guimaraes, P., Guimarães, P. R., Loyola, R. D. & Ulrich, W. A consistent metric for nestedness analysis in ecological systems: reconciling concept and measurement. \JournalTitleOikos 117, 1227–1239 (2008).
- [51] Duch, J. & Arenas, A. Community detection in complex networks using extremal optimization. \JournalTitlePhysical Review E 72, 027104 (2005).
- [52] Barber, M. J. Modularity and community detection in bipartite networks. \JournalTitlePhysical Review E 76, 066102 (2007).
Acknowledgments
M.J.P, A.S-R. and J.B-H. acknowledge the support of the Spanish MICINN project PGC2018-096999-A-I00. M.J.P. acknowledges as well the support of a doctoral grant from the Universitat Oberta de Catalunya (UOC). S.S. thanks the support of UNIPD through ReACT Stars 2018 grant. S.M. and V.C. acknowledge partial financial support from the Agencia Estatal de Investigacion (AEI, Spain) and Fondo Europeo de Desarrollo Regional under Project PACSS Project No. RTI2018-093732-B-C22 (MCIU, AEI/FEDER,UE) and through the María de Maeztu Program for units of Excellence in R&D (MDM-2017-0711). All authors acknowledge the support to the TEAMS project of the Cariparo Visiting Program 2018 (Padova, Italy). We also thank Joan T. Matamalas from the Universitat Rovira i Virgili for the help with the acquisition of the Spanish elections dataset.
Author contributions statement
All authors designed research. A.S-R. and J.M. collected and curated the data. M.J.P., A.S-R. and J.B-H. and performed research. All authors analysed the results. J.B-H., S.S. and S.M. wrote the paper. All authors approved the final version.
Competing Interests The authors declare no competing interests.
Correspondence Correspondence and requests for materials should be addressed to J.B-H.
(email: jborgeh@uoc.edu).