Temperature dependence of the topological phase transition of BiTeI from first principles
Abstract
A topological phase transition from a trivial insulator to a topological insulator requires the bulk band gap to vanish. In the case of noncentrosymmetric materials, these phases are separated by a gapless Weyl semimetal phase. However, at finite temperature, the gap is affected by atomic motion, through electron-phonon interaction, and by thermal expansion of the lattice. As a consequence, the phase space of topologically nontrivial phases is affected by temperature. In this paper, the pressure and temperature dependence of the indirect band gap of BiTeI is investigated from first principles. We evaluate the contribution from both electron-phonon interaction and thermal expansion, and show that their combined effect drives the topological phase transition towards higher pressures with increasing temperature. Notably, we find that the sensitivity of both band extrema to pressure and topology for electron-phonon interaction differs significantly according to their leading orbital character. Our results indicate that the Weyl semimetal phase width is increased by temperature, having almost doubled by 100 K when compared to the static lattice results. Our findings thus provide a guideline for experimental detection of the nontrivial phases of BiTeI and illustrate how the phase space of the Weyl semimetal phase in noncentrosymmetric materials can be significantly affected by temperature.
I Introduction
Topological phases of matter have become a thriving field of condensed matter physics, for both fundamental and applied research Hasan and Kane (2010). In three-dimensional (3D) materials, these phases are characterized by the existence of metallic surface states with peculiar properties, such as protection against backscattering, spin-momentum locking and dissipationless spin-polarized currents, as well as inverted bulk band gaps Hasan and Kane (2010); Hasan et al. (2015). The discovery of experimentally tunable topological phases, whether through stoichiometric doping Xu et al. (2011); Wojek et al. (2014); Dziawa et al. (2012); Hsieh et al. (2008), hydrostatic pressure Xi et al. (2013); Bera et al. (2013), strain Li et al. (2016); Liu et al. (2014), external electric fields Liu et al. (2015); Zhang et al. (2013) or interaction with light Wang et al. (2013); Hübener et al. (2017), has led to a continually growing number of proposals for promising and innovative applications relying on the refined engineering of these robust states and their associated phase transitions Fleet (2015); Zhu et al. (2013); Zhou et al. (2014); Alicea (2010).
Another widely studied class of materials is the bulk Rashba semiconductors, in which a strong spin-orbit interaction combined with the absence of inversion symmetry leads to a splitting of electronic bands of opposite spin polarization Bychkov and Rashba (1984); Manchon et al. (2015). The band extrema are shifted away from the time-reversal invariant points in the Brillouin zone, both in energy and momentum, in the plane perpendicular to the potential gradient Bahramy and Ogawa (2017). This Rashba effect gives rise to many quantum phenomena, such as the Edelstein, spin Hall and spin galvanic effects, as well as noncentrosymmetric superconductivity [see, for example, Bahramy and Ogawa Bahramy and Ogawa (2017) and references therein]. Just like the topological surface states, the bulk Rashba split bands have their spin orientation locked perpendicular to their momentum, leading to a helical spin texture Murakawa et al. (2013). This feature makes these materials promising candidates for realizing devices involving the active manipulation of the spin degree of freedom, for both spintronics Žutić et al. (2004) and quantum computing Das Sarma et al. (2001).
Because it exhibits both of these phenomena, there is no wonder that BiTeI has attracted such a wide interest for the last decade, both from the experimental and first-principles communities. Besides displaying one of the largest Rashba splittings known so far Ishikaza et al. (2011); Crepaldi et al. (2012); Landolt et al. (2012); Sakano et al. (2013); Bahramy et al. (2011); Eremeev et al. (2012), it was predicted to turn into a strong topological insulator under hydrostatic pressure Bahramy et al. (2012). Following this prediction, BiTeI has been widely investigated through optical Xi et al. (2013); Tran et al. (2014); Makhnev et al. (2014), electrical transport Jin et al. (2017); Qi et al. (2017) and Shubnikov-de Haas oscillations experiments Ideue et al. (2014); Martin et al. (2013); Murakawa et al. (2013); Park et al. (2015); VanGennep et al. (2014). Many experiments revealed signatures supporting the existence of the topological phase transition (TPT) Xi et al. (2013); Jin et al. (2017); Park et al. (2015); Ponosov et al. (2014); Qi et al. (2017).
While at first it was thought that the TPT of BiTeI occurred at a single critical pressure , it was later demonstrated that the lack of inversion symmetry imposed the existence of an intermediate Weyl semimetal (WSM) phase Liu and Vanderbilt (2014) between the trivial band insulator and topological insulator phases, yielding two critical pressures. Tight-binding Liu and Vanderbilt (2014) and first-principles calculations Rusinov et al. (2016); Facio et al. (2018) predicted that this WSM phase could exist only within a narrow pressure range of 0.1-0.2 GPa, making its experimental detection technically challenging.
The precise value of the critical pressure of BiTeI is still elusive to this day. Experiments have located it between 2.0 and 3.5 GPa Xi et al. (2013); Jin et al. (2017); Park et al. (2015); Qi et al. (2017); Ideue et al. (2014), while first-principles calculations have predicted it in a slightly wider range of pressures, from 1.6 to 4.5 GPa Bahramy et al. (2012); Rusinov et al. (2016); Facio et al. (2018); Güler-Kılıç and Kılıç (2016). From a theoretical point of view, predicting the critical pressure comes down to finding the gap closing pressure, which is inherently dependent on the accuracy of the calculated band gap at ambient pressure, which can be biased by the well-established underestimation of the band gap by density functional theory (DFT) Martin (2004).
On the other hand, one should not forget that most first-principles calculations are done under the assumption of a static lattice, while experiments are inherently done at finite temperature. This completely overlooks the fact that electrons can interact with thermally activated phonons, resulting in a temperature-dependent shift in the electronic eigenenergies. Moreover, at K, it neglects the contribution of the zero-point renormalization (ZPR) to the eigenenergies, due to the zero-point motion of the ions. For narrow gap materials, this renormalization could, in principle, push the system towards a band inversion. In the case of BiTeI, this shift will directly affect both critical pressures at which the band gap will effectively close or reopen at a given temperature.
The ability of electron-phonon interaction (EPI) to induce a change in the bulk topology was first demonstrated with model Hamiltonians Garate (2013); Saha and Garate (2014); Li and Carbotte (2013), and later analyzed by first-principles calculations for BiTl(S1-xSex)2 Antonius and Louie (2016) and for the Bi2Se3 family Monserrat and Vanderbilt (2016). These studies were able to capture the whole complexity of the EPI, with fewer approximations. They demonstrated that, depending on the strength and sign of the different types of couplings, nontrivial topology could either be promoted or suppressed by temperature in real materials. The suppression of the topological surface state signatures at sufficiently high temperatures was observed experimentally in Pb1-xSnxSe Dziawa et al. (2012); Reijnders et al. (2014); Wojek et al. (2015). The temperature-dependent band structure of BiTeI was previously investigated by focusing on the variation of the Rashba splitting rather than on tracking the TPT Monserrat and Vanderbilt (2017).
In this paper, we study the temperature dependence of the topological phase transition in BiTeI using first-principles methods, assessing for both the EPI and thermal expansion (TE) contributions. We explicitly assess the temperature dependence of the band-gap renormalization as a function of pressure, both in the trivial and the topological phases. We observe that the EPI contribution changes sign as the system undergoes the TPT, and link this behavior to the band inversion phenomenon, showing that the band extrema exhibit a distinct pressure dependence related to their leading orbital character. In turn, the TE contribution is unaffected by the leading orbital character of the band extrema, but manifests sensitivity to the topological invariant by changing sign as the system undergoes the TPT. We finally evaluate how the pressure width of the WSM phase is affected by temperature by extrapolating the total renormalization trends of each band towards the TPT, and find that the stronger renormalization of the band gap in the TI phase widens the WSM with increasing temperature.
The remainder of this paper is organized as follows. After presenting the theoretical formalism used to obtain the EPI and TE contributions to the electronic structure in Sect. II, we summarize the computational details in Sect. III. Sect. IV.1 presents our analysis of the TPT and WSM phase for a static lattice at K, while Sect. IV.2 and IV.3 focus on the effects of temperature on both the band gap and the TPT. We finally discuss the implications and limitations of our results in Sect. IV.4 and summarize our findings.
II Methodology
The temperature dependence of the band-gap energy, , for a given constant pressure, can be approximated at first order by the sum of two distinct contributions Allen and Cardona (1983), namely the thermal expansion, , and the renormalization of the electronic eigenenergies by electron-phonon interactions at constant volume, :
| (1) |
II.1 Electron-phonon interaction
In many-body perturbation theory Mahan (1990), the temperature dependence of the electronic eigenenergies, , induced by electron-phonon interaction can be captured, under certain assumptions Antonius et al. (2015), by the real part of the electron-phonon self-energy, , evaluated at the quasiparticle energy:
| (2) |
where is the unperturbed eigenvalue of a Kohn-Sham (KS) eigenstate with wavevector and band index , computed at the fixed, relaxed geometry. The Hartree atomic unit system is used throughout this paper ().
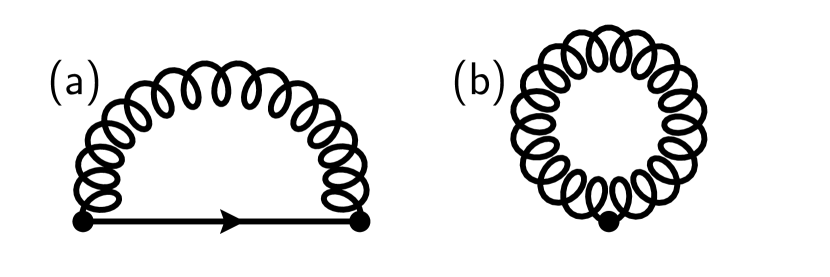
In the nonadiabatic Allen-Heine-Cardona (AHC) framework Allen and Heine (1976); Allen and Cardona (1981, 1983), the self-energy at the second-order of perturbation is the sum of the Fan and Debye-Waller (DW) contributions [Fig. 1]:
| (3) |
where the former captures a frequency-dependent interaction with two first-order EPI vertices, and the latter captures a static one with a single second-order vertex. Evaluating the previous equation at absolute zero temperature yields the ZPR, which arises from the zero-point motion of the ions. For a detailed review of the AHC methodology, we refer our readers to the works of Poncé et al. Poncé et al. (2014, 2015) and to the extensive review by Giustino Giustino (2017).
Assuming that the quasiparticle energy is close to the unperturbed electronic energy, one can apply the on-the-mass-shell approximation Marini et al. (2015), in which the Fan self-energy is evaluated at the poles of the Green’s function, namely at the frequency corresponding to the bare eigenvalue , yielding
| (4) |
Furthermore approximating the fully interacting electronic wavefunction by the noninteracting KS-DFT wavefunction, one obtains the standard result for the retarded Fan self-energy Poncé et al. (2014); Giustino (2017):
| (5) |
in which the contributions from all phonon modes with frequency are summed for all wavevectors and branches in the Brillouin zone (BZ). The whole temperature dependence of this expression is captured by the bosonic and fermionic occupation factors, respectively and . The parameter , where is real and positive, preserves causality by correctly shifting the poles of the Green’s function in the complex plane.
Equation (5) implies the limit of an infinite number of phonon wavevectors (), leading to a vanishingly small value of . is the first-order self-consistent change of the local KS potential induced by the collective atomic displacement along a given phonon mode Antonius et al. (2015); Poncé et al. (2014); Giustino (2017):
| (6) |
with
| (7) |
In these expressions, denotes the displacement of atom , located in unit cell with lattice vector , in cartesian direction ; therefore describes the collective atomic displacement of along the -phonon mode. refers to the contribution of a displacement of atom in direction to the full first-order potential . is the -phonon displacement vector, which is related to the phonon eigenvector, , through:
| (8) |
with being the mass of atom .
The static Debye-Waller self-energy is defined as the second derivative of the potential with respect to two atomic displacements, evaluated at the first order in perturbation theory Antonius et al. (2015) :
| (9) |
where the second-order perturbation potential is
| (10) |
with the derivatives defined as in Eq. (7). Only the phonon occupation factor contributes to the temperature dependence of this term since it does not involve any intermediate electronic state [as can be seen from Fig. 1(b)]. The constant term inside the brackets accounts for the ZPR contribution.
The numerical evaluation of this second-order derivative is a computational bottleneck of density-functional perturbation theory (DFPT) Poncé et al. (2015). It can, however, be circumvented by applying the rigid-ion approximation (RIA), which supposes that the potentials created by each nucleus are independent of each other. Within this approximation, thanks to the translational invariance of the lattice, can be expressed in terms of the first-order derivatives entering the Fan self-energy Poncé et al. (2014) [see Eq. (6)]. The consequences of this approximation on the ZPR of diamond have been discussed by Poncé et al. Poncé et al. (2014). In this framework, the Debye-Waller self-energy becomes Poncé et al. (2014); Antonius and Louie (2016):
| (11) |
with
| (12) |
and
| (13) |
We finally evaluate the sum on band index in Eq. (5) and (11) using the semi-static approach described in Poncé et al. Poncé et al. (2014) and Antonius et al. Antonius et al. (2015). We compute the full, nonadiabatic contribution for all bands up to a band index , which we choose to be well-separated in energy (i.e., more than 10 eV) from the first conduction band. For the high-energy bands with band index , the phonon frequencies in the denominators of Eq. (5) and (11) are negligible with respect to the electronic eigenenergy difference. These bands can, therefore, be treated within the adiabatic approximation, neglecting the phonon frequencies. Furthermore, this sum over an arbitrarily large number of empty states can be replaced by the solution of a linear Sternheimer equation for the subspace orthonormal to the low-energy states (), thus significantly reducing the numerical cost of the calculation Gonze et al. (2011). We estimate the relative error on the renormalization induced by this semi-static treatment of the high energy bands to be 1-2% at most.
II.2 Thermal expansion
The thermal expansion contribution was evaluated through the quasi-harmonic approximation (QHA) Grimvall (1986); Srivastava (1990). Within this framework, the only departure from harmonicity occurs through the explicit volume dependence acquired by the phonon frequencies. It should be understood that the purpose of the QHA is to deliver the leading order expression of the thermal expansion coefficient , rather than capturing the full anharmonic effects present in the crystal Allen (2019), as would do nonperturbative methods Antonius et al. (2015).
The thermal expansion coefficient, , is a rank 2 tensor that relates a small temperature increment to the strain, , it induces on the lattice:
| (14) |
where are cartesian directions. Hence, the most general definition of is
| (15) |
where the derivative is evaluated at constant stress , which is usually taken to be a constant pressure . The diagonal components of the strain tensor describe the relative change in the length of the lattice parameters: . The volumic expansion coefficient can therefore be obtained by taking the trace of :
| (16) |
In the most simple case of cubic symmetry, all are equal and can be expressed by Grimvall (1986)
| (17) |
where is the bulk compressibility at equilibrium volume, is the primitive cell equilibrium volume, is the number of phonons in the homogenous grid used to sample the BZ and is the specific heat of the -phonon mode at temperature . We have also introduced the volumic mode Grüneisen parameters, defined as Grimvall (1986)
| (18) |
The bulk Grüneisen parameter, often referred to in the literature, is defined as
| (19) |
Thus, for cubic systems, the linear thermal expansion coefficient, , Eq. (17), is simply proportional to two scalar parameters, and , the former governing the sign of the thermal expansion.
For materials belonging to noncubic symmetry groups, one must consider the most general case, in which the mode Grüneisen parameters take a tensor form and capture the variation of the phonon frequencies with respect to a given strain:
| (20) |
One can also define bulk Grüneisen parameters following the same procedure as in Eq. (19).
For axial crystals, which include the case of BiTeI’s trigonal symmetry, the thermal expansion coefficient tensor has two distinct nonvanishing components and . Because of this anisotropy, the resulting linear thermal expansion coefficients along crystallographic directions and capture a subtle interplay between the vibrational and elastic properties of the material Munn (1972); Ritz and Benedek (2018); Grimvall (1986):
| (21) |
where is the heat capacity at constant stress and is the -coefficient of the elastic compliance tensor. In these expressions, the subscripts and refer to the length of the unit cell along and . formally refers to a strain applied in only one direction perpendicular in the crystallographic axis.
From Eq. (20), the directional mode Grüneisen parameters and take the form
| (22) |
In the previous expressions, the phonon frequency derivatives are evaluated with respect to the variation of only one lattice parameter, the other one remaining fixed at its static equilibrium value. One should finally note that, in contrast to Eq. (20), the derivative entering is taken by changing the cell dimension, which affects both lattice vectors in the basal plane, hence the factor 1/2. We finally note that the derivation of the Grüneisen formalism Grimvall (1986) neglects the zero-point energy of the phonons, such that there is no thermal expansion at K.
III Computational details
III.1 First-principles calculations
All first-principles calculations were performed using the ABINIT software package Gonze et al. (2019). The bulk electronic structure was obtained within DFT, while response function and electron-phonon coupling calculations were performed within DFPT Gonze (1997); Gonze and Lee (1997). We used a maximum plane-wave energy of 35 hartree and sampled the BZ using a Monkhorst-Pack -point grid. Spin-orbit coupling was taken into account as it is necessary to obtain the Rashba effect and since it has been shown to strongly affect both electronic Bahramy et al. (2011) and vibrational Sklyadneva et al. (2012) properties of BiTeI. We used Hartwigsen-Goedecker-Hutter (HGH) fully relativistic norm-conserving pseudopotentials Hartwigsen et al. (1998), including explicitly the semi-core electrons for Bi. The electron-phonon self-energy was computed with the ElectronPhononCoupling module.
Throughout this paper, we rely on the generalized gradient approximation of the Perdew-Burke-Ernzerhof (PBE-GGA) functional Perdew et al. (1996), although it has been shown to overestimate the lattice parameters at ambient pressure for this particular material Güler-Kılıç and Kılıç (2015); Rusinov et al. (2016); Monserrat and Vanderbilt (2017). Since the purpose of this paper is to investigate the temperature dependence of the TPT, we chose the functional that gives us the best overall agreement with experiment for the bare band gap and the projected orbital character of the band extrema at ambient pressure, as well as for the predicted critical pressure . For detailed results and a complete discussion about our choice of PBE-GGA functional, see Appendix A.
III.2 Structural properties
The unit-cell geometry has been optimized until the resulting forces on all atoms were lower than hartree/bohr3. Due to the layered nature of BiTeI, the in-plane and normal lattice parameters of BiTeI do not vary isotropically under hydrostatic pressure Xi et al. (2013): decreases more rapidly than within the first GPa applied. In order to allow for this nonhomogenous variation of the lattice parameters, the external pressure was modelized by applying an isotropic stress tensor. The lattice was fully optimized for nine different pressures between 0 and 5 GPa. The resulting cell volumes were then fitted with a Murnaghan equation of state (EOS) Murnaghan (1944) in order to validate the theoretically applied pressure. For all pressures below 3.5 GPa, the discrepancy between the EOS pressure and the applied pressure was less than 0.1 GPa, and less than 0.06 GPa for pressures surrounding the TPT. The lattice structure at intermediate pressures was obtained by interpolating from the results of those nine calculations. The optimized lattice structure at all pressures considered in this paper can be found in Table 2 of Appendix A.
III.3 Lattice dynamics and electron-phonon coupling
Phonon frequencies and electron-phonon matrix elements were computed with a homogeneous, -centered Monkhorst-Pack -point grid. Explicit calculations were done at seven different pressures, spanning both the trivial (0.0, 0.5, 1.0, and 1.5 GPa) and topological (3.0, 3.5 and 5.0 GPa) phases. The pressure dependence of the phonon frequencies for the Raman-active modes is in good agreement with experimental data [see Tables 4 and 5 of Appendix A].
In a typical nonadiabatic AHC calculation, one aims for a value of smaller than the highest phonon energy (typically around eV, see, for example, Nery et al. Nery et al. (2018)). This however requires a very dense -point sampling. As discussed in the Appendix of Antonius et al. Antonius et al. (2015), when using a coarser -point grid, one risks artificially emphasizing the contribution of a discrete number of terms in Eq. (5) where, for a given -phonon, the value of gets vanishingly small, hence inducing rapid fluctuations of the self-energy Antonius et al. (2015). These peaks are a numerical artefact of the -point sampling, and the presence of such fluctuations in the vicinity of the bare electronic eigenvalue could lead to an overestimation of the renormalization. In contrast, increasing without caution can lead to an unphysical flattening of the self-energy, suppressing physically relevant features. We therefore chose =0.1 eV, which allows the self-energy to be a smooth function of frequency, without suppressing physically relevant features. We verified that this choice was suitable for the claims reported in this paper.
Lastly, our first-principles methodology relies on the assumption that the electron-phonon interaction can modify the electronic eigenenergies, but cannot by itself promote an electron to an excited state. Such a possibility would modify the resulting electronic density and would require one to evaluate the nondiagonal elements of the self-energy, [see Eq. (4) of Antonius et al. Antonius et al. (2015)], allowing . This procedure was, however, out of reach for the present work. Thus, we restricted our investigation of electron-phonon coupling to pressures where the predicted bare band gap was greater than the highest phonon energy (E meV).
III.4 Thermal expansion
The directional Grüneisen parameters and were evaluated using an -centered Monkhorst-Pack -point grid. Note that the Grüneisen parameters require a smaller -point grid than the EPI interaction since they only depend on the phonon frequencies, which converge faster with the -point sampling.
The derivatives in Eq. (22) were computed by central finite difference using three different volumes per direction, per pressure. For each calculation, the internal atomic coordinates in the direction were optimized at fixed volume, using the same convergence criterion as for the equilibrium structure. The compliance constants were obtained by computing the strain-strain derivatives of the total energy within DFPT Hamann et al. (2005). We used the so-called relaxed-ion compliance tensor, which takes into account the relaxation of the atomic coordinates within the unit cell. This typically lowers the components of the elastic stiffness tensor (usually referred to as the elastic constants), as the resulting stress on the atoms is reduced by the relaxation process. Since the compliance tensor is the inverse of the elastic stiffness tensor, it typically increases the elastic compliance when compared to the clamped-ion result Wu et al. (2005).
IV Results and discussion
IV.1 Topological phase transition in the static lattice
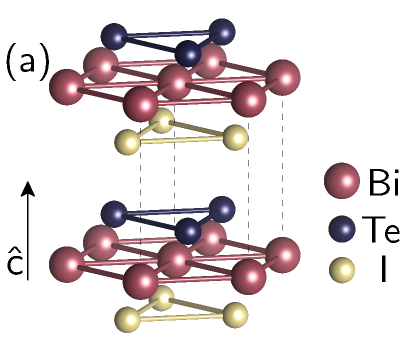

BiTeI is a layered material composed of alternating Bi, Te and I planes stacked along the high-symmetry crystallographic axis. This small band-gap semiconductor belongs to the noncentrosymmetric trigonal space group P3m1 (no. 156, mp-22965). The crystal structure and first BZ are shown in Fig. 2.
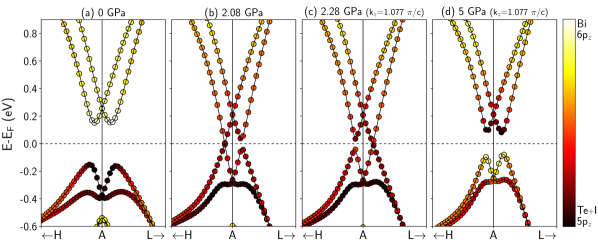
A common signature of a TPT is an inversion of the orbital character of the band structure in the vicinity of the band gap Hasan and Kane (2010). In the case of BiTeI, a schematic analysis of the band splitting showed that the inverted bands should be of character Bahramy et al. (2012). Fig. 3 displays the leading orbital character of the last valence and first conduction bands, for different pressures throughout the studied range. We computed the character by projecting the wavefunction on the spherical harmonic centered around the different atoms in the unit cell. To emphasize the band inversion, Fig. 3 shows the relative projected character on each band, namely the normalized difference between the Bi-6pz and Te/I-5pz projections.
At ambient pressure [Fig. 3(a)], the indirect gap is located in the plane, close to the A high-symmetry point, in the direction of H [on the red path of Fig. 2(b)]. In the H-A and A-L directions, which both exhibit Rashba splitting, the valence band maximum (VBM) is dominated by states of Te and I (dark brown), whereas the conduction band minimum (CBM) has Bi- (light yellow) character. It is a trivial band insulator, with topological index =(0;000). The topological index was computed by tracking the evolution of the hybrid Wannier charge centers, using the Z2Pack software package Gresch et al. (2017); Soluyanov and Vanderbilt (2011). For more information about the definition of the topological index for 3D topological insulators, we refer to Sections II-C and IV-A of the review by Hasan and Kane Hasan and Kane (2010).
As pressure is increased, the band gap progressively decreases until it closes at =2.08 GPa [Fig. 3(b)]. At this point, the BZ exhibits three pairs of Dirac cones, which are split into pairs of Weyl nodes upon further pressure increase; see Fig. 11 of Liu and Vanderbilt Liu and Vanderbilt (2014). These Weyl nodes migrate within the BZ until they annihilate each other, at =2.28 GPa [Fig. 3(c)].
Fortunately, from previous studies Liu and Vanderbilt (2014); Rusinov et al. (2016), it is known that the gap closing occurs along symmetry line H-A (with ), and that it will reopen along a symmetry line rotated by , without symmetry constraints in the direction (namely, in the A-L-M mirror plane). In the following, we define the plane as the plane parallel to the H-A-L plane, with , which is the coordinate of the second band touching point displayed in Fig. 3(c), where the Weyl nodes’ annihilation occurred. This plane corresponds to the shaded plane in Fig. 2(b). In a similar fashion, we identify the H-A-L plane as the plane.
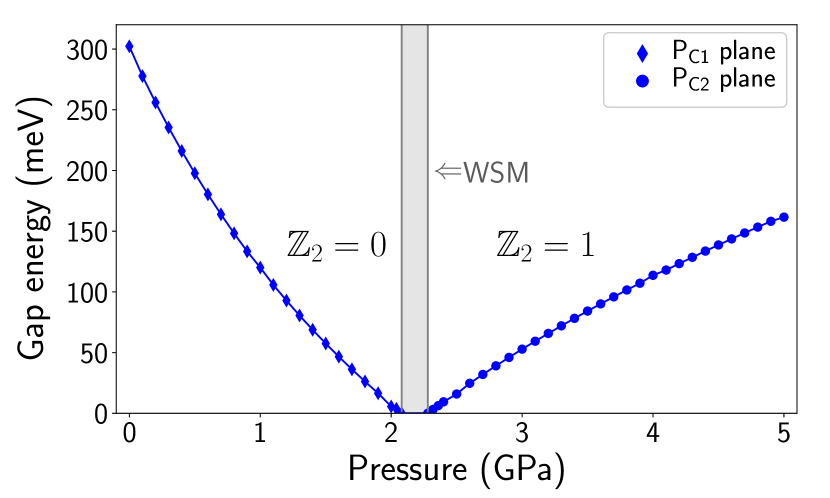
In the vicinity of the TPT, the valence and conduction band extrema show a mixed character, with an almost equal contribution of Bi-pz and Te/I-pz states [Fig.3(b-c)], foreshadowing the band inversion [Fig. 3(d)] which occurs for 2.28 GPa. The system is then a strong topological insulator, with =(1;001). In the TI phase, the minimal band gap is shifted from the H-A-L plane () to the plane (), where the Weyl nodes’ annihilation occurred. The full pressure dependence of the band gap for the static lattice is shown in Fig. 4.
For the static lattice at K, we thus obtain a WSM phase width of 0.2 GPa, in good agreement with previous calculations Rusinov et al. (2016); Facio et al. (2018); Liu and Vanderbilt (2014). Our value for the first gap closing =2.08 GPa agrees with many experimental estimations Jin et al. (2017); Xi et al. (2013); Park et al. (2015) but is slightly lower than those of other experimental Ideue et al. (2014); Qi et al. (2017) and computational works Rusinov et al. (2016); Chen et al. (2013); Facio et al. (2018). For comparison with experiments, one should note that, as the TPT of BiTeI occurs under hydrostatic pressure, direct observation of the topological surface states with angle-resolved photoemission spectroscopy (ARPES) would be challenging from an experimental point of view. As a consequence, experiments rather focused on indirect signatures of these states, for example, a broad minimum of resistivity Jin et al. (2017); Qi et al. (2017), which do not allow a precise estimation of . The difference with other computational works can be explained by the use of experimental pressure-dependent lattice parameters instead of the DFT-relaxed ones Facio et al. (2018), as well as by the choice of projector-augmented wave (PAW) pseudopotentials without semi-core states for Bi Rusinov et al. (2016); Chen et al. (2013) and the use of the Heyd-Scuseria-Ernzerhof (HSE) hybrid functional Chen et al. (2013) to compute the static gap at ambient pressure. Indeed, the calculated critical pressure is quite sensitive to the choice of functional, as it may significantly modify the starting gap at ambient pressure. One must also recall that the DFT gap has fundamentally no physical meaning; a proper, theoretically adequate calculation of the ambient pressure gap would require using a many-body methodology like GW. Nevertheless, for the scope of this paper, we are more interested in the relative variation of the critical pressures rather than in their absolute values. These slight discrepancies with other works do not, therefore, undermine our conclusions.
Our value of corresponds to a relative volume (/) compression of , in good agreement with other calculations relying on the PBE functional Bahramy et al. (2012). We also verified that the relative volume compression within the WSM phase was consistent with the original prediction of Liu and Vanderbilt Liu and Vanderbilt (2014).
IV.2 Temperature dependence of the topological phase transition
Within this paper, we track the temperature dependence of the critical pressures and by evaluating how the electron-phonon interaction and the thermal expansion will affect the indirect band-gap value. Our analysis is based on several assumptions. First, we suppose that the topological index computed at K for the static lattice remains unchanged unless the renormalization closes the gap. Second, since the system lacks inversion symmetry regardless of temperature, we assume that Liu and Vanderbilt’s argument Liu and Vanderbilt (2014) is still valid, such that a gapless WSM phase still separates the two insulating phases. We finally suppose that the value of the plane remains unchanged by temperature, as it is unlikely that the Weyl nodes’ annihilation point in the BZ changes significantly from the static result. We verified that the position of both band extrema along the A-L line in the TI phase does not change significantly over the range of temperatures and pressures studied, between the and planes. A more thorough analysis of the temperature dependence of the band-gap location within the and planes, as well as the pressure-temperature dependence of the Rashba splitting, can be found in Appendix B.
A more formal approach would also require one to redefine the topological invariant for finite temperatures, relying on the density matrix rather than on the static ground state wavefunction, since temperature modifies the occupation of the electronic eigenstates Budich and Diehl (2015); Huang and Arovas (2014); Viyuela et al. (2014). The question of the persistence of quantum topological order at finite temperatures, compared to a nonquantized “classical” topological order, is still under investigation Lu and Grover (2019).
When considering the effect of temperature on the TPT within our framework, there are thus two possible outcomes, which depend on the sign of the band-gap renormalization. In the first case, a negative correction implies that the band gap closes with increasing temperature, which can both drive a topologically trivial system towards a band inversion and stabilize an already inverted band structure, thus globally promoting the topological phase. On the other hand, a positive correction will favor the trivial phase: the band gap opens with increasing temperature, preventing the band inversion in a trivial system and destabilizing a TI band structure until the band inversion is reversed. A more detailed version of this argument can be found in our proceedings paper Brousseau-Couture and Côté (2019).
In the case of a pressure-induced TPT with an intermediate WSM phase, both critical pressures, and , will be modified by temperature: a negative renormalization favoring the topological phase will diminish the amount of pressure required to close the band gap, while a positive renormalization promoting the trivial phase will increase it. The WSM phase width will also be affected by the relative strength of the renormalization between the trivial and topological phases. The combined effect of the strength and sign of the renormalization will determine if the WSM phase is widened or narrowed by increasing temperature.
IV.2.1 Electron-phonon interaction
In a typical semiconductor, with a nearly parabolic dispersion near well-defined band extrema and a sufficiently wide band gap, the Fan contribution usually dominates the self-energy. One then expects from Eq. (5) to observe a decrease of the band-gap energy with increasing temperature: the VBM is repelled by neighboring occupied states with similar but lower energy, leading to a positive renormalization. Similarly, the CBM is repelled by neighboring unoccupied states with higher energy, yielding a negative renormalization. Couplings between states with different occupation factors are disadvantaged by the large energy difference in the denominator, due to the presence of the gap. This behavior is sometimes referred to in the literature as the Varshni effect Cardona and Thewalt (2005).
In BiTeI, the temperature dependence of the gap cannot be inferred by such a heuristic argument, since, on the one hand, the small band gap emphasizes the weight of couplings between the subsets of occupied and unoccupied bands compared to a typical semiconductor, and, on the other, the Rashba splitting creates regions in the BZ where a phonon with finite, nonvanishing wavevector can couple electronic states with very similar eigenenergies.
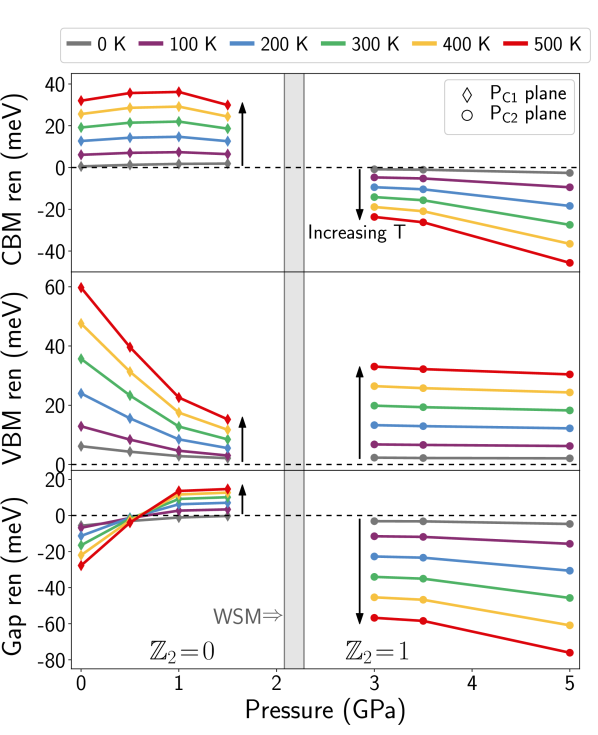
The EPI contribution to the VBM (center panel), CBM (top panel) and total band gap (bottom panel) is shown in Fig. 5. In order to track any temperature-induced change to the gap location and to accurately capture the renormalization for the minimal gap, the EPI was computed in the H-A-L plane for the trivial phase, and in the plane for the TI phase, for electronic states along the solid red and dashed blue paths shown in Fig. 2(b).
In the trivial insulator phase, both the VBM and the CBM are shifted towards higher energies. While the CBM renormalization is almost pressure independent for a given temperature, the VBM is strongly affected by pressure, its renormalization dropping by roughly a factor of 3 between 0 and 1 GPa. This behavior is most likely linked to the higher compressibility along the axis at lower pressures Xi et al. (2013). The strength of this variation could, however, be amplified by the overestimated compressibility predicted by the PBE functional for BiTeI Güler-Kılıç and Kılıç (2015). In our case, this results in a total gap renormalization that changes sign within the trivial phase, going from negative to positive shortly after 0.5 GPa. Nevertheless, the EPI contribution to the gap remains quite small compared to the bare gap energy at ambient pressure (at most 20 meV at all temperatures). As argued before, such an opening of the gap with temperature when approaching the TPT will delay the first gap closing, thus moving towards a slightly higher value.
In the TI phase, the renormalization displays a different behavior: the VBM and CBM renormalizations have opposite signs, both contributing to a decrease of the gap energy with increasing temperature. Again, this behavior is not favorable for the nontrivial case as it works to revert the already inverted gap, driving the system back to the trivial phase. One should also note that, in this phase, it is the VBM that exhibits a pressure-independent behavior, while, for the CBM, the negative renormalization increases steadily with increasing pressure. This seemingly distinct behavior is simply a signature of the band inversion: it can be understood by recalling that the orbital decomposition of the state being corrected at the VBM in the TI phase has the same character as the CBM in the trivial phase, as was emphasized in Fig. 3. Similarly, the CBM in the trivial phase has the same leading orbital character as the VBM in the TI phase. From this point of view, the band extremum dominated by Bi- character exhibits a quasi-pressure-independent renormalization, while the extremum with Te/I- character is gradually shifted towards lower energies throughout the studied pressure range. It is also rather peculiar that only the Te/I states are affected by the change of topology, which can be seen in the temperature-dependent renormalization at a given pressure going from positive to negative as the system goes through the phase transition. A more thorough explanation of this sign change would require one to probe the EPI in the gap-closing region, which was not possible in the scope of this paper. Nevertheless, if considering the gap behavior in both phases, we can infer that the EPI globally promotes the trivial phase, pushing the TPT towards higher pressures as temperature increases.
IV.2.2 Thermal expansion
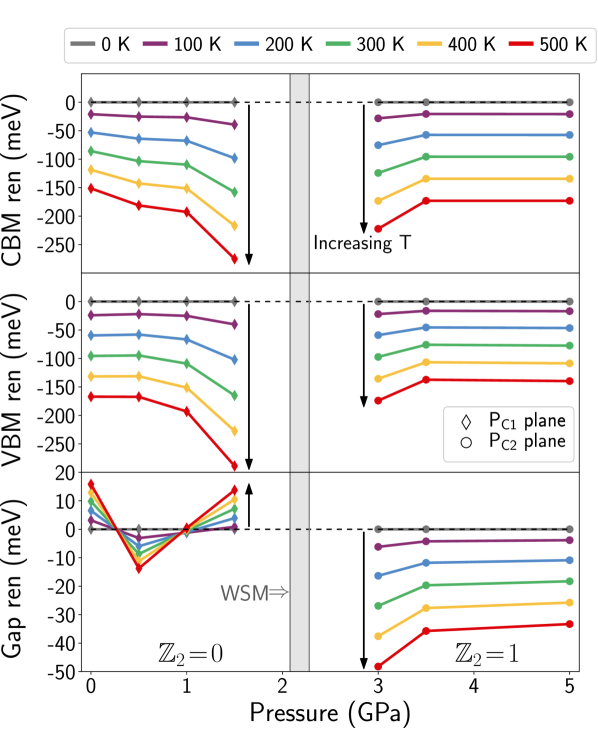
The TE contribution to the total renormalization is displayed in Fig. 6, for the CBM (top panel), VBM (center panel), and indirect band gap (bottom panel). When solely looking at the band renormalization, one finds a seemingly monotonic behavior, both bands being shifted towards lower absolute energies. The pressure-dependent renormalization at a given temperature does not seem affected by the leading orbital character of the band extrema, as was the case for EPI. In the TI phase, the renormalization rate at a given pressure is greater for the CBM than for the VBM, hence a global decrease of the gap energy with increasing temperature. In the trivial phase, the indirect band-gap renormalization shows a far more erratic behavior: while for most pressures the renormalization rate is greater for the VBM than for the CBM, hence a gap opening with increasing temperature, at 0.5 GPa we obtain the opposite trend. This is reminiscent of the sign change observed in this pressure range for the EPI contribution [see Fig. 5, lower panel], which we again attribute to an overestimated compressibility in the low-pressure regime. For a layered structure like BiTeI, a higher compressibility will mainly enhance the compliance constant entering the definition of (Eq. (21)), which will, in turn, modify the thermal expansion along this axis and the resulting gap renormalization. As discussed more thoroughly in Appendix A.1, the lattice structure is reasonably well described by PBE for GPa. Thus, in the following section, we only consider the normalization trends for pressures of 1 GPa and higher to evaluate the temperature-dependent critical pressures. One should finally note that the TE contribution has the same order of magnitude as the EPI contribution, such that it cannot be neglected when investigating the temperature dependence of the gap, as it is often done for materials with light ions.
We recall here that, as mentioned in Section II.2, the Grüneisen formalism neglects the zero-point phonon vibrational energy, such that the K lattice parameters are identical to the static ones. We estimated the missing zero-point thermal expansion contribution to the band-gap renormalization using the high-temperature extrapolation method displayed in Fig. 2 of Cardona and Thewalt Cardona and Thewalt (2005). In this method, the renormalized lattice parameters at K are evaluated by extrapolating the high-temperature slope of and to K. This led to a nearly constant contribution of meV in the trivial phase and meV in the topological phase. This missing contribution does not affect the qualitative trends previously described.
The renormalization trends observed when approaching the TPT in both insulating phases, a gap opening in the trivial phase and a gap closing in the topological phase, are precisely the trends observed for the EPI contribution. Consequently, just like EPI, TE delays the TPT, moving both critical pressures towards higher values with increasing temperature. Excluding GPa from the analysis for previously stated reasons, these trends agree qualitatively with Monserrat and Vanderbilt Monserrat and Vanderbilt (2017), despite being smaller in absolute value. This could partly be attributed to the fact that Monserrat and Vanderbilt minimized the Gibbs free energy independently for each lattice parameter, while our methodology [see Eq. (22], correlates the expansion along a given axis with the “thermal pressure” Munn (1972) induced on the lattice by varying both lattice parameters, through and .
This discrepancy could also be explained by anharmonic contributions to the phonon free energy, which our perturbative methodology does not capture. A more refined and numerically accurate calculation of the anisotropic thermal expansion coefficients would rely on the full temperature-dependent phonon-perturbed potential, taking into account all anharmonic interactions, as implemented in the Temperature Dependent Effective Potential method (TDEP) method Pike and Løvvik (2019).
IV.3 Weyl semimetal phase evolution

The temperature dependence of the WSM phase width was assessed by combining the results displayed in the two previous sections to evaluate the full gap energy renormalization at each pressure and temperature. For each point on the paths considered [see Fig. 2(b)], the EPI and TE corrections were added to the static band structure before computing the resulting temperature-dependent band gap.
Since, for technical reasons discussed in Section IV.1, we could not directly probe the EPI in the gap closing region, we tracked the temperature dependence of and by extrapolating the total renormalization behavior for each band extrema from neighboring pressures towards the TPT in the trivial and topological phases. This correction was then added to the bare gap energy computed with the static lattice (black markers with denser pressure sampling), as shown by the colored dashed lines in Fig 7.
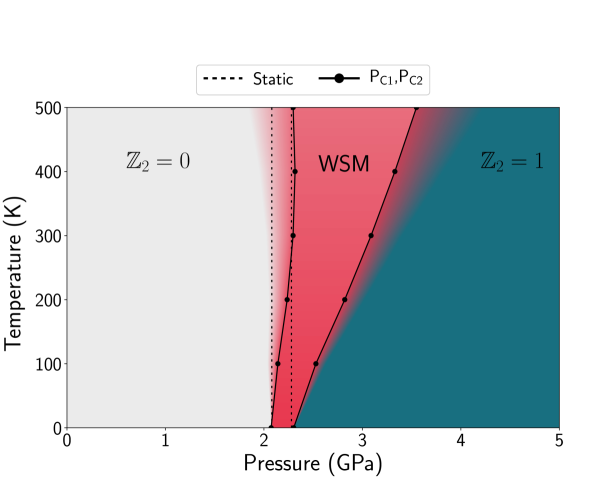
The temperature-dependent critical pressures extracted from Fig. 7 are explicitly shown in the pressure-temperature phase diagram of Fig. 8 (black markers). For visual reference, the critical pressures obtained with the static lattice are shown with dotted lines. The numerical values for and are detailed in Table 6 of Appendix C, as well as the WSM phase boundaries obtained by considering only the contribution from EPI or TE.
As discussed in the previous sections, both EPI and TE are unfavorable to the topological phase. We therefore observe without surprise that both and are shifted towards higher pressures. However, as the renormalization from both contributions is stronger in magnitude in the topological phase, the temperature-dependent variation is much weaker for than for . Thus, the WSM phase width increases with temperature. This effect is already sizable at K, where the zero-point motion of the ions induces a 15% increase in the WSM phase width, compared to the static lattice. It has almost doubled by K, despite the absolute WSM phase width remaining small at 0.39 GPa.
The only deviation to this behavior is the slight decrease of above room temperature. This can be explained by the fact that, for and 1.5 GPa, EPI and TE do not shift the band extrema in the same way in the BZ. Therefore, in this pressure range, the total renormalization does not sum up to the individual corrections.
One should also take into consideration the fact that, at finite temperature, thermal excitations do not allow one to physically distinguish between an insulating and a gapless phase, if the band-gap energy is smaller than . Thus, for each temperature, we defined a crossover region between topologically distinct phases by evaluating the pressure difference between a given static lattice critical pressure and the pressure at which in the appropriate insulating phase, using the data from Fig. 4. In Fig. 8, these regions identify the phase space where, within our methodology, the topological index cannot be properly assessed. Lastly, we also added to Fig. 8 a color intensity gradient in the high-temperature regime of the WSM phase, to emphasize the fact that our calculations did not explicitly treat the temperature dependence within this pressure region. Therefore, there remains some uncertainty about the topological nature of BiTeI in this region of the pressure-temperature phase space.
From these results, we can conclude that temperature effects do not restrain
the experimental detection of the WSM phase. In the low-temperature regime,
where quantum effects can more easily be observed thanks to the reduction of
thermal noise, the WSM phase widening remains however small, despite being
sizable when compared to the static lattice phase width. The experimental
signatures of the TI phase will be found at higher pressures with increasing
temperature. These qualitative temperature dependencies can assist the
experimental effort when designing experiments the purpose of which is to detect
signatures of a topologically nontrivial phase. Moreover, they shed some
light on the subtle interplay between EPI and TE and their effect on the phase
space of topological phases in noncentrosymmetric materials. Since the
presence of gapless modes characterizes both the WSM and TI
phases, additional experiments focusing on observables that can physically
distinguish between these two nontrivial phases, and that are feasible under
isotropic hydrostatic pressure, could provide more insight about this
phenomenon.
IV.4 Discussion
The purpose of this paper was to determine the qualitative trend of the temperature-dependent renormalization of and : the global behavior of the TPT, more than the precise numerical values of the critical pressures, was our main target. From this point of view, there are several limitations to our analysis, the first of them being the -point sampling for the EPI calculation. BiTeI is a polar material, i.e., has nonvanishing Born effective charges, with infrared-active phonon modes. At long wavelength, , atomic displacements along longitudinal optical (LO) modes generate a macroscopic electric field throughout the material, which can couple to the electrons through dielectric interaction. This particular type of EPI, known as the Fröhlich interaction Fröhlich (1954), has been shown to dominate the ZPR for polar materials Nery and Allen (2016); Miglio et al. (2019) and to cause an unphysical divergence of the ZPR within the adiabatic AHC framework Poncé et al. (2014), in which Eq. (5) is approximated by neglecting the phonon frequencies in the denominators.
Thus, for polar materials, evaluating the precise contribution of the long-range Fröhlich interaction to the ZPR within the nonadiabatic AHC framework requires a very dense -point grid, which for technical reasons was not available to us at the time of this study. The methodology developed by Nery and Allen Nery and Allen (2016) to estimate the polar contribution missing from a coarse -point grid calculation could also not be straightforwardly applied to BiTeI for two reasons. First, the band extrema are not located at the zone center and spin-orbit coupling is mandatory to describe Rashba splitting correctly. Second, the validity of the parabolic effective mass approximation near the band extrema is also questionable for this material, especially at higher pressures. Our results should consequently be understood as a lower bound to the full EPI contribution.
The extrapolation technique used to evaluate the temperature dependence of the critical pressures is also by itself limited by the assumption that the renormalization behavior we observe in both insulating phases varies monotonically towards the TPT. This assumption could only be validated by an explicit calculation of the EPI in the close vicinity of the TPT, which would require one to lift the diagonal self-energy approximation, as excitations across the gap will no longer be negligible. The addition of these nondiagonal coupling terms to the self-energy, which we conjecture will have a significant contribution, could alter the general trends observed in Fig. 7. These extra terms will also be crucial to fully characterize the effect of EPI on the Te/I- band extrema near the critical pressures (VBM for , CBM for ; see Fig. 5 and Section IV.2.1).
Lastly, our analysis supposed a perfect semiconductor crystal, while experimentally BiTeI has been shown to be naturally -doped due to small deviations in stoichiometry Makhnev et al. (2014). The presence of such doping charge could slightly affect the phonon-perturbed crystal potential, which could, in return, modify the matrix elements entering the EPI self-energy. We do not however expect this self-doping to have a strong impact on the qualitative trends observed throughout this paper, as long as the amount of defects remains small compared to substitutional doping.
V Conclusion
In the present paper, we have characterized the temperature dependence of the topological phase transition in BiTeI using first-principles methodologies based on DFPT. The electron-phonon interaction was obtained with the nonadiabatic AHC methodology, while the thermal expansion was computed using the Grüneisen parameters formalism.
The indirect band-gap renormalization induced by EPI changes sign as the system undergoes the phase transition, opening the gap in the trivial phase and closing it in the TI phase. The band extremum with leading Bi-6 character displays a quasi pressure-independent behavior, while the Te/I- extremum manifests a strong sensitivity to both pressure and topology.
The thermal expansion contribution to the band-gap renormalization has the same order of magnitude as the EPI contribution. At a given temperature, both band extrema are affected in a similar manner throughout the pressure range, regardless of their leading orbital character. The resulting band-gap renormalization nevertheless captures the change of topology: it mainly increases the indirect gap in the trivial phase and reduces it throughout the topological phase.
The combined effect of EPI and TE globally moves the TPT of BiTeI towards higher pressures. The resulting temperature-dependent renormalization is stronger in magnitude in the TI phase compared to the trivial phase, such that the intermediate WSM phase is widened by temperature. Clear signatures of the topological insulator phase should, therefore, appear at higher pressures as temperature is increased.
Overall, our results indicate that temperature effects are not negligible for
materials with heavy ions and must be accounted for when engineering devices
relying on topological properties. Our findings can also aid the search for
experimental evidence of the topologically nontrivial phases of BiTeI, and
more generally reveal how temperature can have a substantial influence on the
phase space of topological phases of noncentrosymmetric materials.
Note added. Recently, we learned of an article by Lihm and ParkLihm and Park (2020) which is relevant to this research field.
Acknowledgements.
This research was financially supported by the Natural Sciences and Engineering Research Council of Canada (NSERC), under the Discovery Grants program grant No. RGPIN-2016-06666. Computations were made on the supercomputers Beluga and Briaree managed by Calcul Québec and Compute Canada. The operation of these supercomputers is funded by the Canada Foundation for Innovation (CFI), the Ministère de l’Économie, de la Science et de l’Innovation du Québec (MESI) and the Fonds de recherche du Québec - Nature et technologies (FRQ-NT). V.B.-C. acknowledges support by the NSERC Alexander Graham Bell Canada Graduate Scholarship doctoral program.Appendix A Effect of Van der Waals dispersion correction
Since the first prediction of the TPT in BiTeI Bahramy et al. (2012), numerous studies of ground-state properties of bismuth tellurohalides (BiTeX, X=Cl, Br, I) have appeared in the first-principles literature Rusinov et al. (2013, 2015, 2016); Sklyadneva et al. (2012); Eremeev et al. (2017); Schwalbe et al. (2016). Many of them have discussed the fact that PBE-GGA does not capture the Van der Walls bonding properly along the normal axis for this class of materials, resulting in a general overestimation of the lattice parameters Rusinov et al. (2016); Güler-Kılıç and Kılıç (2015), up to 7% for the axis Rusinov et al. (2016). PBE-GGA was also criticized as yielding an unrealistic compressibility for BiTeI at low pressures Güler-Kılıç and Kılıç (2015). It has also been shown that dispersion-corrected DFT, which accounts for Van der Waals forces through a semi-empirical dispersion potential, reproduces more accurately the pressure dependence of the lattice structure for bismuth tellurohalides Güler-Kılıç and Kılıç (2016). These studies did not, however, investigate the impact of these corrections on the phonon frequencies, nor on the electron-phonon interaction. In the following, we include the Van der Waals interaction within the DFT framework, using dispersion-corrected DFT-D3BJ, where a semi-empirical dispersion potential is added Grimme et al. (2010) in conjunction with Becke-Jonhson damping Johnson and Becke (2006); Grimme et al. (2011) to avoid short-range diverging behavior. DFT-D3BJ was shown to be one of the most reliable dispersion-corrected methods to describe vibrational properties Van Troeye et al. (2016). Both the trivial (0, 1.5 GPa) and the topological (3.5, 5 GPa) phases are considered.
A.1 Structural properties
| 0 GPa | 5 GPa | |||||
|---|---|---|---|---|---|---|
| Exp. | PBE | DFT-D3BJ | Exp. | PBE | DFT-D3BJ | |
| a (Å) | 4.34 Shevelkov et al. (1995) | 4.44 | 4.36 | 4.15 Xi et al. (2013) | 4.23 | 4.12 |
| c (Å) | 6.85 Shevelkov et al. (1995) | 7.31 | 6.78 | 6.52 Xi et al. (2013) | 6.55 | 6.49 |
| c/a ratio | 1.58 Shevelkov et al. (1995) | 1.65 | 1.56 | 1.57 Xi et al. (2013) | 1.58 | 1.58 |
| gap (eV) | 0.38 Ishikaza et al. (2011), 0.36 Lee et al. (2011), 0.33 Makhnev et al. (2014) | 0.30 | 0.03 | 0.16 | 0.30 | |
| Bi-Te (Å) | 2.10 Shevelkov et al. (1995) | 1.70 | 1.73 | 1.75 | 1.78 | |
| Bi-I (Å) | 1.72 Shevelkov et al. (1995) | 2.11 | 2.15 | 2.16 | 2.17 | |
| 0 GPa | 0.5 GPa | 1 GPa | 1.5 GPa | 3 GPa | 3.5 GPa | 5 GPa | |
|---|---|---|---|---|---|---|---|
| a (Å) | 4.44 | 4.41 | 4.39 | 4.37 | 4.30 | 4.28 | 4.23 |
| c (Å) | 7.31 | 7.05 | 6.90 | 6.81 | 6.66 | 6.62 | 6.55 |
| Bi-Te (Å) | 1.70 | 1.71 | 1.71 | 1.72 | 1.74 | 1.75 | 1.75 |
| Bi-I (Å) | 2.11 | 2.12 | 2.13 | 2.14 | 2.15 | 2.15 | 2.16 |
| Exp. | PBE | DFT-D3BJ | |
|---|---|---|---|
| E (meV) | 100 Ishikaza et al. (2011) 108 Sakano et al. (2013) | 103 | 181 |
| (Å-1) | 0.052 Ishikaza et al. (2011), 0.046 Martin et al. (2013), 0.050 Sakano et al. (2013) | 0.050 | 0.053 |
| (eVÅ) | 3.85 Ishikaza et al. (2011) 4.3 Sakano et al. (2013) | 4.13 | 6.86 |
The lattice parameters, bare band gap energies and equilibrium distance between the Te/I and Bi planes for 0 and 5 GPa are shown in Tables 1 and 3, with comparison to available experimental data. In good agreement with previous works Monserrat and Vanderbilt (2017); Rusinov et al. (2016); Güler-Kılıç and Kılıç (2015), PBE-GGA overestimates the lattice parameters at ambient pressure more than what is typically expected from DFT calculations, at 2.3% for and 6.7% for , while the dispersion-corrected method reproduces more accurately the experimental structure. At 5 GPa, both methods agree within 2% of experimental value, for both and . The interplanar equilibrium distances at both pressures are in good agreement with experiment. Note that the positions of Te and I planes are inverted when compared to the experimental results Shevelkov et al. (1995); this effect has been attributed to the fact that x-ray diffraction measurements cannot establish a clear distinction between the Te and I planes, due to their very similar atomic radii and charge Bahramy et al. (2011). This inversion is systematic throughout the first-principles literature Monserrat and Vanderbilt (2017); Güler-Kılıç and Kılıç (2015); Sklyadneva et al. (2012); Bahramy et al. (2011).
Analyzing the full pressure dependence of the lattice parameters for PBE-GGA and DFT-D3BJ between 0 and 5 GPa (not included here) lead to similar results as those of Güler-Kiliç and Kiliç (see Figs. 3(g) and 3(h) of Güler-Kılıç and Kılıç (2015)), where the overestimation of remains around 2% throughout the whole pressure range, while for it drops rapidly under 2% after 1 GPa. Thus, for GPa, the lattice structure is similarly well described by both methods. The resulting lattice parameters and interatomic distances along obtained by the optimization procedure are presented in Table 2 for all pressures included in this work.
The bulk band gap of BiTeI has been measured at ambient pressure via ARPES Ishikaza et al. (2011), optical spectroscopy Lee et al. (2011) and optical spectral ellipsometry Makhnev et al. (2014), yielding respectively 0.38, 0.36 and 0.33 eV. Another soft x-ray ARPES experiment obtained a smaller value of 0.26 eV Sakano et al. (2012); they however argued that their measurement probes a region between the bulk and the subsurface, where some band bending effects could lower the measured band gap compared to the bulk value. Our results with PBE, 0.30 eV for the indirect gap and 0.33 eV for the direct gap, are in pleasantly good agreement with experiment, thanks to the overestimation of the lattice parameters counterbalancing PBE’s well-know gap underestimation Rusinov et al. (2016). For DFT-D3BJ, the band gap is strongly underestimated: the system is almost metallic, with a band gap of about 30 meV at ambient pressure. We are not aware of any reference for experimental gap measurements in the topological phase.
Beyond the crystal structure, the parameters characterizing the Rashba splitting can also be used to assess the level of agreement of the calculated electronic structure with experiment. The Rashba energy, , is defined as the energy difference between electronic states at the band extrema and at the time-reversal protected degeneracy point of spin-split bands, namely A for BiTeI [see Fig. 3]. The momentum offset between those two -points is captured by the Rashba wavevector, . The Rashba parameter,
| (23) |
is the strength of the spin-orbit interaction in the Rashba Hamiltonian. These parameters are clearly displayed in the left panel of Fig. 2a and Eq. (1) of Monserrat and Vanderbilt Monserrat and Vanderbilt (2017). Our calculations agree reasonably well with available experimental data [see Table 3], with a clear advantage for PBE-GGA.
A.2 Vibrational properties
| 0 GPa | 1.5 GPa | ||||||
|---|---|---|---|---|---|---|---|
| Mode | Exp.Sklyadneva et al. (2012);Gnezdilov et al. (2014); Ponosov et al. (2014);Tran et al. (2014) | Calc.Rusinov et al. (2015);Sklyadneva et al. (2012) | PBE | DFT-D3BJ | Exp.Ponosov et al. (2014);Tran et al. (2014) | PBE | DFT-D3BJ |
| E1 | 52.5; 55; 56; n/a | 59; 54 (73) | 53 (74) | 57 (77) | 60; n/a | 58 (77) | 62 (80) |
| A | 90.5; 93; 92; 92 | 92; 88 (94) | 90 (94) | 90 (100) | 96; 96 | 92 (100) | 95 (106) |
| E2 | 99; 102; 101; 101 | 101; 96 (115) | 97 (118) | 101 (117) | 106; 107 | 102 (119) | 106 (118) |
| A | 146.5; 150; 148; 146 | 152; 141 (142) | 141 (142) | 146 (148) | 152; 153 | 147 (148) | 151 (152) |
| 3.5 GPa | 5 GPa | |||||
| Mode | Exp.Ponosov et al. (2014);Tran et al. (2014) | PBE | DFT-D3BJ | Exp. Ponosov et al. (2014);Tran et al. (2014) | PBE | DFT-D3BJ |
| E1 | 66; n/a | 63 (81) | 67 (84) | 70a; n/a | 68 (84) | 71 (87) |
| A | 105; 104 | 99 (108) | 102 (111) | 107; 108 | 102 (114) | 109 (121) |
| E2 | 112; 112 | 108 (120) | 115 (120) | 115; 115 | 111 (122) | 115 (123) |
| A | 162; 162 | 154 (155) | 159 (151) | 165; 167 | 159 (160) | 164 (166) |
| aExtrapolated to 5 GPa from the referenced experimental data. | ||||||
At the zone center, , BiTeI has point group symmetry, yielding four Raman-active modes, whose irreducible representations are two doubly-degenerate modes and two modes Gnezdilov et al. (2014); Tran et al. (2014). Since BiTeI has no inversion center, all modes are both Raman and infrared active Tran et al. (2014). Phonon frequencies for these modes are compared to available experimental data and previous first-principles calculations in Tables 4 and 5. At ambient pressure, we obtain a relative mean deviation with experiment of 4.1% for PBE and 1.6% for D3BJ. At 5 GPa, these deviations drop to 3.8% for PBE and 0.8% for D3BJ. We verified that the general pressure dependence of the Raman-active frequencies agreed well with experiment in both cases. Our calculated values for LO-TO splitting are in excellent agreement with previous calculations Sklyadneva et al. (2012). A small feature measured at =118.5 cm-1 at ambient pressure Sklyadneva et al. (2012) can be associated with the LO-TO split E2 mode, thus validating our results.
A.3 Discussion
The purpose of this work is to analyze the temperature dependence of the TPT in BiTeI. The numerical value of the critical pressures is directly related to the bare band gap value, which will be corrected by electron-phonon interaction. From Eq. (5) and (11), we can see that the phonon frequencies and the bare electronic eigenvalues are key physical quantities in this correction. This dependence goes beyond the simple electronic dispersion: as discussed in the main text, the band gap also plays a crucial role. Indeed, the denominator captures the “unlikelyhood” of couplings between two eigenstates with a large energy difference, rooted in perturbation theory. Furthermore, considering the renormalization of both band extrema forming the fundamental band gap, the gap energy will act as a “barrier”, giving a lower bound on the smallest value of the denominator for couplings with eigenstates within the subset of bands located across the gap. Therefore, a significant underestimation of the bare band gap will artificially emphasize interband couplings and bias the resulting zero-point renormalization. While one could argue that this effect should be small at K, especially for a material with heavy atoms like BiTeI, it should not be forgotten that it will be amplified by the phonon occupation factor at higher temperatures, and thus could lead to significantly different conclusions. Lastly, since we are dealing with a TPT, the orbital character of the valence and conduction bands close to their extrema is subject to an inversion process. This phenomenon is captured by the wavefunction, such that a wrong band character could alter the different matrix elements entering the self-energy.
While DFT-D3BJ provides the most accurate descriptions of the cell geometry and Raman-active phonon frequencies, our results indicate that in our case, it is not a suitable choice to track the temperature dependence of the TPT. On the one hand, despite its accurate description of Van der Waals bonding between the atomic planes, DFT-D3BJ delivers a severe underestimation of the band gap at ambient pressure. This can be understood by considering the van der Waals correction as acting like an “effective pressure” along the axis. As previously argued, such a small value of the band gap would not only flaw our bare predictions (by the same arguments as Rusinov et al. Rusinov et al. (2016)) but could also artificially strengthen some interband couplings in the EPI self-energy.
One could easily argue that this band gap underestimation could be overturned simply by applying a scissor shift operator to the eigenvalues entering the self-energy, or be compensated by evaluating the pressure shift that would bring the gap to the experimental value. We considered both these approaches. For the latter, we estimate that one must shift towards a negative pressure GPa in order to bring the DFT-D3BJ gap close to the experimental value, thus bringing the lattice parameters very close to the PBE relaxed values at ambient pressure.
About the former, we have investigated the temperature-dependent renormalization at 0, 1.5, 3.5 and 5 GPa, with and without the scissor shift operator. The results for GPa shown in Fig. 9 are quite striking: PBE-GGA (red circles) and DFT-D3BJ with (green diamonds) and without (blue squares) the scissor shift disagree about the sign of the renormalization for the CBM. This sign disagreement is also reflected in the total gap renormalization.
This discrepancy brings to light a fundamental aspect of the calculation, namely the fact that the EPI renormalization is affected by the system’s topology. From topological invariant calculations, we found that at 1.5 GPa, the DFT-D3BJ wavefunction already is in the topological state (yielding a negative correction), while for PBE-GGA it is still in the trivial state (where the correction is positive). These are precisely the trends observed in Fig. 5. Moreover, if we compare the DFT-D3BJ without scissor shift (blue squares) to the PBE-GGA result at 3.5 GPa (dashed yellow line, triangle markers), which is roughly , we can see that those two calculations, with both wavefunctions in the topological state and with roughly the same lattice parameters and bare band gap, deliver almost identical results.
Thus, even if DFT-D3BJ delivers the most accurate lattice parameters and Raman-active phonon frequencies at 1.5 GPa when compared to experiment, it predicts a topological index that contradicts all experimental evidences of the phase transition. Therefore, computing the renormalization with DFT-D3BJ and a scissor shift operator for a given pressure would roughly result in applying the electron-phonon contribution from a PBE-GGA calculation at another pressure, shifted by . This is especially crucial when investigating pressures neighboring the TPT, as it can lead to wrongly assign a renormalization computed with a TI wavefunction to a shifted band structure intended to describe the trivial phase. For pressures sufficiently far from the transition in the TI phase, we expect the trend of a DFT-D3BJ with scissor shift calculation to be correct, despite a discrepancy in the numerical value of the renormalization. For the trivial phase, a calculation showed that GPa for DFT-D3BJ. Therefore, we cannot rely on such results to describe the ambient pressure renormalization since the resulting wavefunction does not predict the correct band character.
For these reasons, we chose to rely on PBE-GGA functional: despite a clear overestimation of the lattice parameters, it does deliver a band gap, Rashba splitting and Raman-active phonon frequencies that are in reasonable overall agreement with experiment. Moreover and most crucially, it exhibits the right band characters at ambient pressure and predicts a critical pressure in agreement with experimental evidence.
Appendix B Pressure and temperature-dependent Rashba Splitting
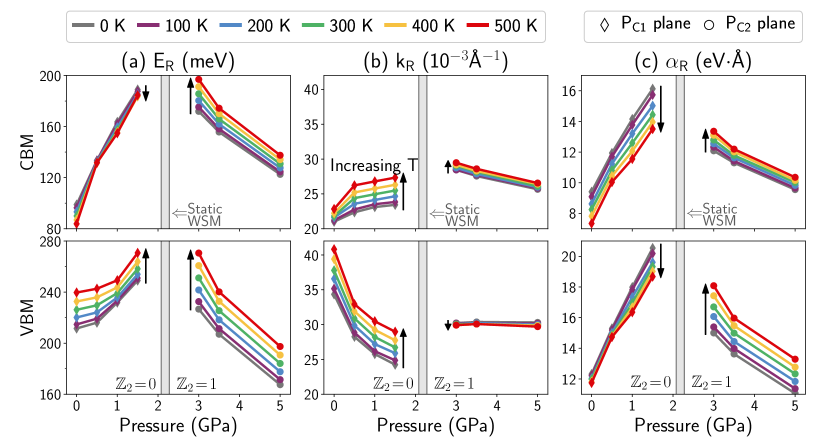
As discussed in the main text, one of the assumptions underlying our work is that the Weyl nodes trajectory throughout the WSM phase is not qualitatively affected by temperature. In other words, we suppose that the location of the and planes remains constant; hence we only investigated EPI and TE within these planes. Without having access to the pressure and temperature dependence of the band structure in the full BZ, we can nevertheless gain significant insight by tracking the pressure and temperature dependence of the different parameters characterizing Rashba splitting within these planes. The Rashba energy, , captures the steepness of the band’s slope in the vicinity of the band gap. The Rashba momentum, , tracks the distance between the band extrema and the degeneracy point at , that is, the temperature-dependent band gap location within a given plane. Finally, the Rashba parameter, , captures the strength of the Rashba interaction (Eq. (23)), which is related to the potential gradient along the axis Dyakonov (2017).
Fig. 10 presents the results for the Rashba energy (a), Rashba momentum (b) and Rashba parameter (c), for both the valence (bottom panels) and conduction bands (upper panels). We emphasize that these parameters were computed for the minimal band gap, namely on the (H-A, ) line for the trivial phase and on the (A-L, ) for the TI phase. Hence, the numerical values for ambient pressure in this figure should not be compared to experimental data, as available ARPES measurements were done on the (A-L, ) line. The trends reported here nevertheless agree with those of Monserrat and Vanderbilt Monserrat and Vanderbilt (2017) for the (A-L, direction.
As can be seen in Fig. 10, pressure has a stronger effect than temperature on the Rashba parameters. This behavior can be qualitatively understood as increasing temperature enhances atomic vibrations around their slightly shifted equilibrium positions, while pressure modifies more significantly these equilibrium positions by reducing the distance between the atomic planes. Hence, for a given temperature, increasing pressure enhances the potential gradient along the axis, thus increasing . On the contrary, for a given pressure, temperature increases the complex interplay between the electrons and the lattice, yielding a reduction of . These are the behaviors observed in the trivial phase [Fig. 10(c), diamond markers].
The TI phase displays the opposite behavior [Fig. 10(c), round markers]: is reduced by pressure and increased by temperature. To understand this behavior, we must analyze more carefully both the Rashba energy and momentum, as captures the interplay between those two quantities. On the one hand, for all pressures, the Rashba energy [Fig. 10(a)] almost steadily increases with temperature, except for the CB in the trivial phase, which shows a very weak decrease with temperature. On the other hand, the Rashba momentum is almost unaffected by pressure and temperature in the TI phase [Fig. 10(b), round markers], while it increases almost steadily with temperature for pressures below the TPT.
The opposite trends of between the trivial and TI phase can, therefore, be understood by two observations. On the one hand, in both phases, the pressure dependence of is governed by the Rashba energy, which increases in the trivial phase and decreases in the TI phase. On the other, their opposite temperature dependence is caused by the Rashba momentum. In the trivial phase, both and increase with temperature, the latter being more significant than the former, hence the decrease of . In the TI phase, the increase of captures the change of the Rashba energy, as is scarcely affected by temperature. We cannot, however, determine if this behavior is linked to the TPT or merely a consequence of an increased bonding along induced by increased pressure. This question could be addressed by investigating the temperature dependence of the high-pressure Rashba splitting in other bismuth tellurohalides, BiTeBr and BiTeCl, which are not known to exhibit a pressure-induced TPT Rusinov et al. (2016).
Lastly, we verified that the trends presented in Fig. 10 for the TI phase do not vary if the temperature-dependent band structure is evaluated in the plane rather than the plane, remaining in the A-L direction. Hence, it seems reasonable that these trends, including the quasi temperature-independence of the Rashba momentum, could be applied to any between those planes. We also verified that the temperature-dependent values of are not significantly altered if considering the EPI and TE corrections computed in the plane.
Appendix C Temperature-dependent Weyl semimetal phase width
| Temperature | EPI only | TE only | EPI+TE | ||||||
|---|---|---|---|---|---|---|---|---|---|
| (K) | (GPa) | (GPa) | width (GPa) | (GPa) | (GPa) | width (GPa) | (GPa) | (GPa) | width (GPa) |
| Static | 2.08 | 2.28 | 0.20 | 2.08 | 2.28 | 0.20 | 2.08 | 2.28 | 0.20 |
| 0 | 2.08 | 2.31 | 0.23 | 2.08 | 2.28 | 0.20 | 2.08 | 2.31 | 0.23 |
| 100 | 2.10 | 2.42 | 0.32 | 2.09 | 2.39 | 0.30 | 2.14 | 2.53 | 0.39 |
| 200 | 2.14 | 2.57 | 0.44 | 2.16 | 2.55 | 0.39 | 2.24 | 2.82 | 0.58 |
| 300 | 2.17 | 2.73 | 0.56 | 2.24 | 2.70 | 0.46 | 2.30 | 3.09 | 0.79 |
| 400 | 2.20 | 2.89 | 0.69 | 2.33 | 2.83 | 0.50 | 2.32 | 3.33 | 1.01 |
| 500 | 2.22 | 3.05 | 0.83 | 2.46 | 2.95 | 0.51 | 2.30 | 3.55 | 1.25 |
In Table 6, we report the numerical values for the temperature-dependent WSM phase boundaries, namely and . These values were extracted from Fig. 7 using the extrapolation procedure described in Sect. IV.3 and are explicitly plotted in Fig. 8. For comparison, we also include the temperature-dependent critical pressures obtained by considering the EPI and TE corrections independently.
References
- Hasan and Kane (2010) M. Z. Hasan and C. L. Kane, Rev. Mod. Phys. 82, 3045 (2010).
- Hasan et al. (2015) M. Z. Hasan, S.-Y. Xu, and G. Bian, Phys. Scr. T164, 014001 (2015).
- Xu et al. (2011) S.-Y. Xu, Y. Xia, L. A. Wray, S. Jia, F. Meier, J. H. Dil, J. Osterwalder, B. Slomski, A. Bansil, H. Lin, R. J. Cava, and M. Z. Hasan, Science 332, 560 (2011).
- Wojek et al. (2014) B. M. Wojek, P. Dziawa, B. J. Kowalski, A. Szczerbakow, A. M. Black-Schaffer, M. H. Berntsen, T. Balasubramanian, T. Story, and O. Tjernberg, Phys. Rev. B 90, 161202(R) (2014).
- Dziawa et al. (2012) P. Dziawa, B. J. Kowalski, K. Dybko, R. Buczko, A. Szczerbakow, M. Szot, E. Łusakowska, T. Balasubramanian, B. M. Wojek, M. H. Berntsen, O. Tjernberg, and T. Story, Nat. Mater. 11, 1023 (2012).
- Hsieh et al. (2008) D. Hsieh, D. Qian, L. Wray, Y. Xia, Y. S. Hor, R. J. Cava, and M. Z. Hasan, Nature 452, 970 (2008).
- Xi et al. (2013) X. Xi, C. Ma, Z. Liu, Z. Chen, W. Ku, H. Berger, C. Martin, D. B. Tanner, and G. L. Carr, Phys. Rev. Lett. 111, 155701 (2013).
- Bera et al. (2013) A. Bera, K. Pal, D. V. S. Muthu, S. Sen, P. Guptasarma, U. V. Waghmare, and A. K. Sood, Phys. Rev. Lett. 110, 107401 (2013).
- Li et al. (2016) S.-s. Li, W.-x. Ji, C.-w. Zhang, P. Li, and P.-j. Wang, J. Mater. Chem. C 4, 2243 (2016).
- Liu et al. (2014) Y. Liu, Y. Y. Li, S. Rajput, D. Gilks, L. Lari, P. L. Galindo, M. Weinert, V. K. Lazarov, and L. Li, Nat. Phys. 10, 294 (2014).
- Liu et al. (2015) Q. Liu, X. Zhang, L. B. Abdalla, A. Fazzio, and A. Zunger, Nano Lett. 15, 1222 (2015).
- Zhang et al. (2013) T. Zhang, J. Ha, N. Levy, Y. Kuk, and J. Stroscio, Phys. Rev. Lett. 111, 056803 (2013).
- Wang et al. (2013) Y. H. Wang, H. Steinberg, P. Jarillo-Herrero, and N. Gedik, Science 342, 453 (2013).
- Hübener et al. (2017) H. Hübener, M. A. Sentef, U. D. Giovannini, A. F. Kemper, and A. Rubio, Nat. Commun. 8, 13940 (2017).
- Fleet (2015) L. Fleet, Nat Phys 11, 5 (2015).
- Zhu et al. (2013) H. Zhu, C. A. Richter, E. Zhao, J. E. Bonevich, W. A. Kimes, H.-J. Jang, H. Yuan, H. Li, A. Arab, O. Kirillov, J. E. Maslar, D. E. Ioannou, and Q. Li, Sci. Rep. 3, 1757 (2013).
- Zhou et al. (2014) J.-J. Zhou, W. Feng, Y. Zhang, S. A. Yang, and Y. Yao, Sci. Rep. 4, 3841 (2014).
- Alicea (2010) J. Alicea, Phys. Rev. B 81, 125318 (2010).
- Bychkov and Rashba (1984) Y. A. Bychkov and E. I. Rashba, JETP Lett. 39, 78-81 (1984).
- Manchon et al. (2015) A. Manchon, H. C. Koo, J. Nitta, S. M. Frolov, and R. A. Duine, Nat. Mater. 14, 871 (2015).
- Bahramy and Ogawa (2017) M. S. Bahramy and N. Ogawa, Adv. Mater. 29, 1605911 (2017).
- Murakawa et al. (2013) H. Murakawa, M. S. Bahramy, M. Tokunaga, Y. Kohama, C. Bell, Y. Kaneko, N. Nagaosa, H. Y. Hwang, and Y. Tokura, Science 342, 1490 (2013).
- Žutić et al. (2004) I. Žutić, J. Fabian, and S. Das Sarma, Rev. Mod. Phys. 76, 323 (2004).
- Das Sarma et al. (2001) S. Das Sarma, J. Fabian, X. Hu, and I. Žutić, Solid State Commun. 119, 207 (2001).
- Ishikaza et al. (2011) K. Ishikaza, M. Bahramy, S. Murakawa, M. Sakano, S. Shimojima, and T. Sonobe, Nat. Mater. 10, 521-526 (2011).
- Crepaldi et al. (2012) A. Crepaldi, L. Moreschini, G. Autès, C. Tournier-Colletta, S. Moser, N. Virk, H. Berger, P. Bugnon, Y. J. Chang, K. Kern, A. Bostwick, E. Rotenberg, O. V. Yazyev, and M. Grioni, Phys. Rev. Lett. 109, 096803 (2012).
- Landolt et al. (2012) G. Landolt, S. V. Eremeev, Y. M. Koroteev, B. Slomski, S. Muff, T. Neupert, M. Kobayashi, V. N. Strocov, T. Schmitt, Z. S. Aliev, M. B. Babanly, I. R. Amiraslanov, E. V. Chulkov, J. Osterwalder, and J. H. Dil, Phys. Rev. Lett. 109, 116403 (2012).
- Sakano et al. (2013) M. Sakano, M. S. Bahramy, A. Katayama, T. Shimojima, H. Murakawa, Y. Kaneko, W. Malaeb, S. Shin, K. Ono, H. Kumigashira, R. Arita, N. Nagaosa, H. Y. Hwang, Y. Tokura, and K. Ishizaka, Phys. Rev. Lett. 110, 107204 (2013).
- Bahramy et al. (2011) M. S. Bahramy, R. Arita, and N. Nagaosa, Phys. Rev. B 84, 041202(R) (2011).
- Eremeev et al. (2012) S. V. Eremeev, I. A. Nechaev, Y. M. Koroteev, P. M. Echenique, and E. V. Chulkov, Phys. Rev. Lett. 108, 246802 (2012).
- Bahramy et al. (2012) M. Bahramy, B. Yang, R. Arita, and N. Nagaosa, Nat. Commun. 3, 679 (2012).
- Tran et al. (2014) M. K. Tran, J. Levallois, P. Lerch, J. Teyssier, A. B. Kuzmenko, G. Autès, O. V. Yazyev, A. Ubaldini, E. Giannini, D. van der Marel, and A. Akrap, Phys. Rev. Lett. 112, 047402(R) (2014).
- Makhnev et al. (2014) A. A. Makhnev, L. V. Nomerovannaya, T. V. Kuznetsova, O. E. Tereshchenko, and K. A. Kokh, Opt. Spectrosc. 117, 764 (2014).
- Jin et al. (2017) M. L. Jin, F. Sun, L. Y. Xing, S. J. Zhang, S. M. Feng, P. P. Kong, W. M. Li, X. C. Wang, J. L. Zhu, Y. W. Long, H. Y. Bai, C. Z. Gu, R. C. Yu, W. G. Yang, G. Y. Shen, Y. S. Zhao, H. K. Mao, and C. Q. Jin, Sci. Rep. 7, 39699 (2017).
- Qi et al. (2017) Y. Qi, W. Shi, P. G. Naumov, N. Kumar, R. Sankar, W. Schnelle, C. Shekhar, F.-C. Chou, C. Felser, B. Yan, and S. A. Medvedev, Adv. Mater. 29, 1605965 (2017).
- Ideue et al. (2014) T. Ideue, J. G. Checkelsky, M. S. Bahramy, H. Murakawa, Y. Kaneko, N. Nagaosa, and Y. Tokura, Phys. Rev. B 90, 161107(R) (2014).
- Martin et al. (2013) C. Martin, E. D. Mun, H. Berger, V. S. Zapf, and D. B. Tanner, Phys. Rev. B 87, 041104(R) (2013).
- Park et al. (2015) J. Park, K.-H. Jin, Y. J. Jo, E. S. Choi, W. Kang, E. Kampert, J.-S. Rhyee, S.-H. Jhi, and J. S. Kim, Sci. Rep. 5, 15973 (2015).
- VanGennep et al. (2014) D. VanGennep, S. Maiti, D. Graf, S. W. Tozer, C. Martin, H. Berger, D. L. Maslov, and J. J. Hamlin, J. Phys.: Condens. Matter 26, 342202 (2014).
- Ponosov et al. (2014) Y. S. Ponosov, T. V. Kuznetsova, O. E. Tereshchenko, K. A. Kokh, and E. V. Chulkov, JETP Lett. 98, 557 (2014).
- Liu and Vanderbilt (2014) J. Liu and D. Vanderbilt, Phys. Rev. B 90, 155316 (2014).
- Rusinov et al. (2016) I. P. Rusinov, T. V. Menshchikova, I. Y. Sklyadneva, R. Heid, K.-P. Bohnen, and E. V. Chulkov, New J. Phys. 18, 113003 (2016).
- Facio et al. (2018) J. I. Facio, D. Efremov, K. Koepernik, J.-S. You, I. Sodemann, and J. van den Brink, Phys. Rev. Lett. 121, 246403 (2018).
- Güler-Kılıç and Kılıç (2016) S. Güler-Kılıç and C. Kılıç, Phys. Rev. B 94, 165203 (2016).
- Martin (2004) R. M. Martin, Electronic Structure: Basic Theory and Practical Methods (Cambridge University Press, Cambridge, 2004).
- Garate (2013) I. Garate, Phys. Rev. Lett. 110, 046402 (2013).
- Saha and Garate (2014) K. Saha and I. Garate, Phys. Rev. B 89, 205103 (2014).
- Li and Carbotte (2013) Z. Li and J. P. Carbotte, Phys. Rev. B 88, 195133 (2013).
- Antonius and Louie (2016) G. Antonius and S. G. Louie, Phys. Rev. Lett. 117, 246401 (2016).
- Monserrat and Vanderbilt (2016) B. Monserrat and D. Vanderbilt, Phys. Rev. Lett. 117, 226801 (2016).
- Reijnders et al. (2014) A. A. Reijnders, Y. Tian, L. J. Sandilands, G. Pohl, I. D. Kivlichan, S. Y. Frank Zhao, S. Jia, M. E. Charles, R. J. Cava, N. Alidoust, S. Xu, M. Neupane, M. Z. Hasan, X. Wang, S. W. Cheong, and K. S. Burch, Phys. Rev. B 89, 075138 (2014).
- Wojek et al. (2015) B. M. Wojek, M. H. Berntsen, V. Jonsson, A. Szczerbakow, P. Dziawa, B. J. Kowalski, T. Story, and O. Tjernberg, Nat. Commun. 6, 8463 (2015).
- Monserrat and Vanderbilt (2017) B. Monserrat and D. Vanderbilt, Phys. Rev. Mater. 1, 054201 (2017).
- Allen and Cardona (1983) P. B. Allen and M. Cardona, Phys. Rev. B 27, 4760 (1983).
- Mahan (1990) G. Mahan, Many-Particle Physics, 2nd ed. (Plenum Press, 1990).
- Antonius et al. (2015) G. Antonius, S. Poncé, E. Lantagne-Hurtubise, G. Auclair, X. Gonze, and M. Côté, Phys. Rev. B 92, 085137 (2015).
- Allen and Heine (1976) P. B. Allen and V. Heine, J. Phys. C: Solid State Phys. 9, 2305 (1976).
- Allen and Cardona (1981) P. B. Allen and M. Cardona, Phys. Rev. B 23, 1495 (1981).
- Poncé et al. (2014) S. Poncé, G. Antonius, Y. Gillet, P. Boulanger, J. Laflamme Janssen, A. Marini, M. Côté, and X. Gonze, Phys. Rev. B 90, 214304 (2014).
- Poncé et al. (2015) S. Poncé, Y. Gillet, J. L. Janssen, A. Marini, M. Verstraete, and X. Gonze, J. Chem. Phys. 143, 102813 (2015).
- Giustino (2017) F. Giustino, Rev. Mod. Phys. 89, 015003 (2017).
- Marini et al. (2015) A. Marini, S. Poncé, and X. Gonze, Phys. Rev. B 91, 224310 (2015).
- Gonze et al. (2011) X. Gonze, P. Boulanger, and M. Côté, Ann. Phys. 523, 168 (2011).
- Grimvall (1986) G. Grimvall, Thermophysical properties of materials, Selected topics in solid state physics No. XVIII (North-Holland Physics Publishing, Amsterdam, 1986).
- Srivastava (1990) G. Srivastava, The Physics of Phonons (A. Hilger, New York, NY, USA, 1990).
- Allen (2019) P. B. Allen, Mod. Phys. Lett. B 34 No. 2, 2050025 (2020) .
- Munn (1972) R. W. Munn, J. Phys. C: Solid State Phys. 5, 535 (1972).
- Ritz and Benedek (2018) E. T. Ritz and N. A. Benedek, Phys. Rev. Lett. 121, 255901 (2018).
- Gonze et al. (2019) X. Gonze, B. Amadon, G. Antonius, F. Arnardi, L. Baguet, J.-M. Beuken, J. Bieder, F. Bottin, J. Bouchet, E. Bousquet, N. Brouwer, F. Bruneval, G. Brunin, T. Cavignac, J.-B. Charraud, W. Chen, M. Côté, S. Cottenier, J. Denier, G. Geneste, P. Ghosez, M. Giantomassi, Y. Gillet, O. Gingras, D. R. Hamann, G. Hautier, X. He, N. Helbig, N. Holzwarth, Y. Jia, F. Jollet, W. Lafargue-Dit-Hauret, K. Lejaeghere, M. A. L. Marques, A. Martin, C. Martins, H. P. C. Miranda, F. Naccarato, K. Persson, G. Petretto, V. Planes, Y. Pouillon, S. Prokhorenko, F. Ricci, G.-M. Rignanese, A. H. Romero, M. M. Schmitt, M. Torrent, M. J. van Setten, B. Van Troeye, M. J. Verstraete, G. Zérah, and J. W. Zwanziger, Comput. Phys. Commun. 248, 107042 (2019).
- Gonze (1997) X. Gonze, Phys. Rev. B 55, 10337 (1997).
- Gonze and Lee (1997) X. Gonze and C. Lee, Phys. Rev. B 55, 10355 (1997).
- Sklyadneva et al. (2012) I. Y. Sklyadneva, R. Heid, K.-P. Bohnen, V. Chis, V. A. Volodin, K. A. Kokh, O. E. Tereshchenko, P. M. Echenique, and E. V. Chulkov, Phys. Rev. B 86, 094302 (2012).
- Hartwigsen et al. (1998) C. Hartwigsen, S. Goedecker, and J. Hutter, Phys. Rev. B 58, 3641 (1998).
- Perdew et al. (1996) J. P. Perdew, K. Burke, and M. Ernzerhof, Phys. Rev. Lett. 77, 3865 (1996).
- Güler-Kılıç and Kılıç (2015) S. Güler-Kılıç and C. Kılıç, Phys. Rev. B 91, 245204 (2015).
- Murnaghan (1944) F. D. Murnaghan, PNAS 30, 244 (1944).
- Nery et al. (2018) J. P. Nery, P. B. Allen, G. Antonius, L. Reining, A. Miglio, and X. Gonze, Phys. Rev. B 97, 115145 (2018).
- Hamann et al. (2005) D. R. Hamann, X. Wu, K. M. Rabe, and D. Vanderbilt, Phys. Rev. B 71, 035117 (2005).
- Wu et al. (2005) X. Wu, D. Vanderbilt, and D. R. Hamann, Phys. Rev. B 72, 035105 (2005).
- Gresch et al. (2017) D. Gresch, G. Autès, O. V. Yazyev, M. Troyer, D. Vanderbilt, B. A. Bernevig, and A. A. Soluyanov, Phys. Rev. B 95, 075146 (2017).
- Soluyanov and Vanderbilt (2011) A. A. Soluyanov and D. Vanderbilt, Phys. Rev. B 83, 235401 (2011).
- Chen et al. (2013) Y. Chen, X. Xi, W.-L. Yim, F. Peng, Y. Wang, H. Wang, Y. Ma, G. Liu, C. Sun, C. Ma, Z. Chen, and H. Berger, J. Phys. Chem. C 117, 25677 (2013).
- Budich and Diehl (2015) J. C. Budich and S. Diehl, Phys. Rev. B 91, 165140 (2015).
- Huang and Arovas (2014) Z. Huang and D. P. Arovas, Phys. Rev. Lett. 113, 076407 (2014).
- Viyuela et al. (2014) O. Viyuela, A. Rivas, and M.A. Martin-Delgado, Phys. Rev. Lett. 113, 076408 (2014).
- Lu and Grover (2019) T.-C. Lu and T. Grover, Phys. Rev. B 99, 075157 (2019).
- Brousseau-Couture and Côté (2019) V. Brousseau-Couture and M. Côté, “Influence of the electron-phonon interaction on the topological phase transition in BiTeI,” (2020), Accepted for publication in Proc. of XI International Symposium Quantum Theory and Symmetries, CRM Series on Mathematical Physics (Springer).
- Cardona and Thewalt (2005) M. Cardona and M. L. W. Thewalt, Rev. Mod. Phys. 77, 1173 (2005).
- Pike and Løvvik (2019) N. A. Pike and O. M. Løvvik, Comput. Mater. Sci. 167, 257 (2019).
- Fröhlich (1954) H. Fröhlich, Adv. Phys. 3, 325 (1954).
- Nery and Allen (2016) J. P. Nery and P. B. Allen, Phys. Rev. B 94, 115135 (2016).
- Miglio et al. (2019) A. Miglio, V. Brousseau-Couture, M. Côté, G. Antonius, Y.-H. Chan, S. G. Louie, M. Giantomassi, and X. Gonze, “Generalized Fröhlich model for real materials: predominance of non-adiabatic effects in zero-point renormalization of electronic energies,” (2019), Unpublished.
- Rusinov et al. (2013) I. P. Rusinov, I. A. Nechaev, S. V. Eremeev, C. Friedrich, S. Blügel, and E. V. Chulkov, Phys. Rev. B 87, 205103 (2013).
- Rusinov et al. (2015) I. P. Rusinov, O. E. Tereshchenko, K. A. Kokh, A. R. Shakhmametova, I. A. Azarov, and E. V. Chulkov, JETP Lett. 101, 507 (2015).
- Eremeev et al. (2017) S. V. Eremeev, I. A. Nechaev, and E. V. Chulkov, Phys. Rev. B 96, 155309 (2017).
- Schwalbe et al. (2016) S. Schwalbe, R. Wirnata, R. Starke, G. A. H. Schober, and J. Kortus, Phys. Rev. B 94, 205130 (2016).
- Grimme et al. (2010) S. Grimme, J. Antony, S. Ehrlich, and H. Krieg, J. Chem. Phys. 132, 154104 (2010).
- Johnson and Becke (2006) E. R. Johnson and A. D. Becke, J. Chem. Phys. 124, 174104 (2006).
- Grimme et al. (2011) S. Grimme, S. Ehrlich, and L. Goerigk, J. Comput. Chem. 32, 1456 (2011).
- Van Troeye et al. (2016) B. Van Troeye, M. Torrent, and X. Gonze, Phys. Rev. B 93, 144304 (2016).
- Shevelkov et al. (1995) A. Shevelkov, E. Dikarev, R. Shpanchenko, and B. Popovkin, J. Solid State Chem. 114, 379 (1995).
- Lee et al. (2011) J. S. Lee, G. A. H. Schober, M. S. Bahramy, H. Murakawa, Y. Onose, R. Arita, N. Nagaosa, and Y. Tokura, Phys. Rev. Lett. 107, 117401 (2011).
- Sakano et al. (2012) M. Sakano, J. Miyawaki, A. Chainani, Y. Takata, T. Sonobe, T. Shimojima, M. Oura, S. Shin, M. S. Bahramy, R. Arita, N. Nagaosa, H. Murakawa, Y. Kaneko, Y. Tokura, and K. Ishizaka, Phys. Rev. B 86, 085204 (2012).
- Gnezdilov et al. (2014) V. Gnezdilov, P. Lemmens, D. Wulferding, A. Möller, P. Recher, H. Berger, R. Sankar, and F. C. Chou, Phys. Rev. B 89, 195117 (2014).
- Dyakonov (2017) M. I. Dyakonov, ed., Spin physics in semiconductors, 2nd ed., Springer series in solid-state sciences ; 157 (Springer, Berlin, 2017).
- Lihm and Park (2020) J.-M. Lihm and C.-H. Park, Phys. Rev. B 101, 121102(R) (2020) .