Impact of the lattice on magnetic properties and possible spin nematicity in the S=1 triangular antiferromagnet NiGa2S4.
Abstract
NiGa2S4 is a triangular lattice S=1 system with strong two-dimensionality of the lattice, actively discussed as a candidate to host spin-nematic order brought about by strong quadrupole coupling. Using Raman scattering spectroscopy we identify a phonon of Eg symmetry which can modulate magnetic exchange and produce quadrupole coupling. Additionally, our Raman scattering results demonstrate a loss of local inversion symmetry on cooling, which we associate with sulfur vacancies. This will lead to disordered Dzyaloshinskii-Moriya interactions, which can prevent long range magnetic order. Using magnetic Raman scattering response we identify 160 K as a temperature of an upturn of magnetic correlations. The temperature below 160 K, but above 50 K where antiferromagnetic magnetic start to increase, is a candidate for spin-nematic regime.
Magnetic frustration is an active area of research that drives discoveries of new quantum phenomena Savary and Balents (2017); Starykh (2015). While much of this work is motivated by the search for a quantum spin liquid, various novel types of spin order have been predicted and discovered experimentally. Exotic spin states or unsolved problems can be found even for a simplest example of a frustrated system, a triangular lattice. Nearest neighbor Hiesenberg antiferromagnetic interactions in such a system with S=1/2 result in 120∘ spin order. This order can be prevented by a presence of magnetic interactions beyond nearest neighbor ones. For example, in organic molecular Mott insulators, a presence of a ring exchange results in a spin liquid state Holt et al. (2014). In this work we address one example of a triangular lattice system, where the absence of long range magnetic order is not yet understood, despite much effort. This system is NiGa2S4. It was actively discussed in a context of nematic order, originating from large bi-quadratic magnetic exchange. Stoudenmire et al. (2009); Takano and Tsunetsugu (2011); Bhattacharjee et al. (2006); Läuchli et al. (2006).
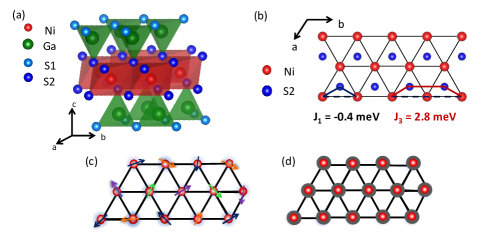
In NiGa2S4 structure, an undistorted 2D triangular lattice of Ni2+ () is formed in the plane from edge-sharing NiS6 octahedra Nakatsuji et al. (2005) (Fig. 1a). Additional layers of non-magnetic GaS4 tetrahedra are positioned between Ni layers along axis. This results in a highly two-dimensional structure, with negligibly small magnetic interactions between Ni planes.
Neutron scattering Nakatsuji et al. (2005); Stock et al. (2010) results have been explained in terms of antiferromagnetic correlations with the wave vector near (1/6,1/6,0), appearing on a triangular lattice with a ferromagnetic nearest-neighbor superexchange = -0.4 meV, and an antiferromagnetic third nearest exchange = 2.8 meV Stock et al. (2010) (see Fig. 1c). Values of exchange interactions obtained by other methods and calculations vary a lot Pradines et al. (2018), but agree on an importance of both exchanges. Both competing interactions and low dimensionality of the system can lead to the observed suppression of long range magnetic order for this system where K Nakatsuji et al. (2005). On lowering the temperature below 8 K the system undergoes a gradual spin freezing Nambu et al. (2015).
The absence of spin order, with spin dynamics slowing down from about 50 K Stock et al. (2010) has led to various theoretical proposals of a spin-nematic state in NiGa2S4Stoudenmire et al. (2009); Takano and Tsunetsugu (2011); Bhattacharjee et al. (2006); Läuchli et al. (2006). Most models suggest ferronematic order, where full rotational symmetry of spin is broken, and it is confined to a certain plane defined by a “director” that characterizes the order (Fig. 1 c) 111It is useful to mention, that this state is different from what is called ”nematic order” found, for example, in FeAs.. Spin-nematic state is also an important starting point in the theoretical explanation for the spin freezing at 8 K, which occurs in NiGa2S4 in the presence of only few per cent of sulfur vacancies Stoudenmire et al. (2009); Nambu et al. (2009).
Spin-nematic order is difficult to confirm experimentally. An important step is to identify an origin of a large bi-quadratic exchange necessary to establish spin-nematic order Stoudenmire et al. (2009); Takano and Tsunetsugu (2011); Bhattacharjee et al. (2006); Läuchli et al. (2006). As shown in Ref. Barma (1975); Tchernyshyov and Chern (2011), Kq can naturally arise from a second term of an expression for magnetoelastic coupling ++…. and elastic response of the lattice, when a phonon with a displacement modulates magnetic exchange or superexchange . A bi-quadratic term Kq which could arise from a phonon modulating can be enhanced in NiGa2S4 due to the unique near-90∘ Ni-S-Ni bond angle, as proposed in Ref. Stoudenmire et al. (2009). Here we use Raman scattering spectroscopy and Density Functional Theory (DFT) phonons calculations to identify such a phonon. In addition, Raman scattering has been theoretically suggested to be a probe of spin quadrupole excitations Michaud et al. (2011). To identify magnetic excitations in Raman spectra we provide a comparison to inelastic neutron scattering data.
Besides these effects directly related to the magnetism in NiGa2S4, we present evidence for previously undetected local inversion symmetry breaking. The effect develops independently from magneto-elastic (ME) coupling, and the amplitude of the corresponding signal increases on cooling. We associate this lattice deformation with sulfur vacancies Nambu et al. (2009) that by symmetry enable random Dzyaloshinskii-Moriya (DM) interactions.
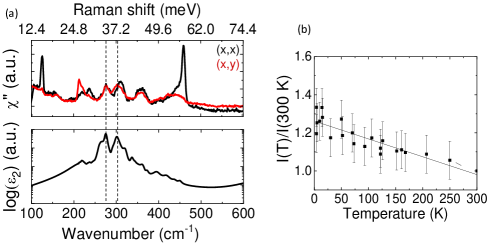
The magnetic susceptibility of NiGa2S4 increases on cooling, and shows flattening associated with spin freezing at temperatures below 8 K Nakatsuji et al. (2007). Here we focus on the uniaxial anisotropy of the magnetic susceptibility in magnetic field from 0.01 T to 5 T at temperatures between 2 K and 300 K, measured using a commercial SQUID magnetometer (MPMS, Quantum Design). Magnetic field H was directed parallel to the crystallographic axis () and parallel to the plane (). In the temperature range from 200 K to 50 K, no considerable anisotropy is observed. Below 50 K, for all measured magnetic fields anisotropy of susceptibility increases on cooling, reaching a maximum at spin freezing temperature around 8 K (Fig. 2a). This anisotropy indicates a development of in-(ab)-plane magnetic correlations. When the material enters a frozen spin state, decreases again. The maximum of the anisotropy at low temperatures is suppressed by magnetic fields above 0.025 T; a weaker magnetic anisotropy with (12 K) = 1.2 at 8 K is preserved up to the highest measured field of 5 T (Fig. 2b).
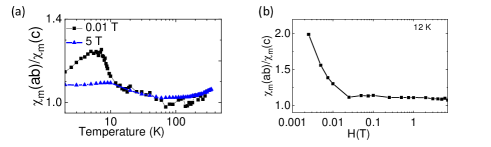
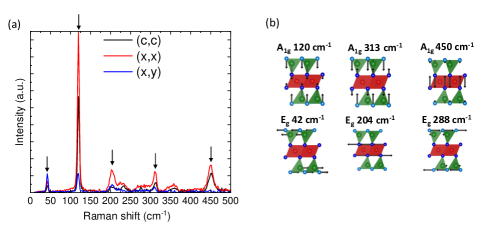
Fig. 3a shows the Raman scattering spectra of NiGa2S4 for temperatures between 300 K and 8 K. Raman scattering was excited by 514.5 nm (2.4 eV) line of Coherent Ar+ laser, and measured using T64000 Horiba Jobin-Yvon spectrometer. Spectra were measured from the plane of the crystals, in and geometries (), which correspond to the A1g and Eg scattering channels for the point group associated with trigonal space group of NiGa2S4. Raman spectra of NiGa2S4 comprise of a superposition of forbidden modes and magnetic excitations, in addition to Raman-active phonons. Five of six (= 3A1g + 3 Eg) Raman-active phonons appear in the spectra as sharp intense peaks (see Supplemental Information (SI)). Here we focus on the two phonons at 206 and 450 cm-1 that involve movement of sulfur atoms S2 that form NiS6 octahedra (see Fig. 3). These are of a special interest, since S2 mediate all magnetic interactions in NiGa2S4 (see Fig. 1 b). The sulfur S2 motion associated with these two phonons modulates the nearest neigbor exchange interactions (, where is a change of S2 coordinate) in two different ways (see Fig. 3). The A1g phonon at 450 cm-1corresponds to the out-of-plane movement of S2 atoms, which modulates the sign of , but preserves the symmetry of triangular lattice. The Eg phonon at 206 cm-1 on the other hand maintains the sign of , while dynamically breaking symmetry of the Ni-S2-Ni bonds.
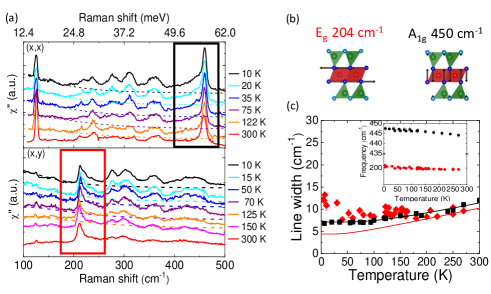
Experimentally, we find an essential difference in the magneto-elastic coupling for these two phonons, demonstrated by the temperature dependence of their line widths (Fig. 3 c). In the absence of magneto-elastic coupling, a phonon line width is determined by phonon-phonon scattering Kim et al. (2012). It follows the general formula , where is a temperature independent term defined by disorder. This formula describes well the temperature dependence of the width of the mode at 450 cm-1(Fig. 3c, black squares are experimental points, a solid line is the fitting curve). In contrast, the width of the phonon at 206 cm-1 starts to deviate from the conventional behavior at about 150 K, and increases below 50 K. Moreover, the Eg phonon at 206 cm-1 shows a characteristic asymmetric Fano line shape, which is typically a result of an interaction between a single level of a phonon mode and an underlying continuum. The line shape is described by where , and is a parameter that describes the coupling to the continuum Zhang et al. (2015); Fano (1961). A positive coupling parameter 4 indicates that the continuum of excitations lies above the phonon frequency (see more details in SI).
The development of spin correlations in NiGa2S4 on cooling is reflected in the temperature dependence of the magnetic Raman scattering. For an ordered antiferromagnet (AF), exchange magnetic Raman scattering, realized through the light-induced exchange of electrons between neighboring sites of different sublattices, leads to the creation of pairs of magnons with momenta and Fleury and Loudon (1968); Perkins and Brenig (2008). In a state with AF fluctuations above the ordering temperature, Raman scattering on pairs of fluctuations with opposite momenta Kampf and Brenig (1992) is observed in the spectra as an asymmetric maximum. This allows us to follow magnetic excitations up to high temperatures, where the Raman response of AF fluctuations will be a result of a convolution of the density of states and a line width defined by a correlation length of AF fluctuations Caprara et al. (2005).
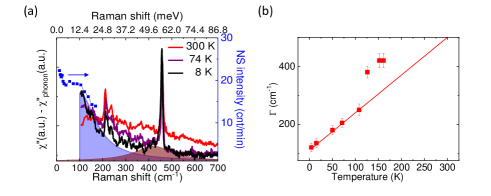
In Fig 4a we present non-polarized Raman spectra + continuum and S2 phonons, which have been isolated by subtracting other contributions (see SI). In Fig.3a the continuum is shown by dashed lines in the and spectra. A low anisotropy of Raman magnetic spectra is expected for non-collinear AF order on a triangular lattice Vernay et al. (2007); Perkins and Brenig (2008).
Fig. 4a compares the low temperature Raman continuum (black line) to the low temperature (2 K) magnetic density of states (blue points) inferred from neutron scattering and plotted as where is the Raman shift. In combination these data indicate that two-magnon excitations produce a broad maximum around 100 cm-1(12 meV). According to Raman spectra, it extends to frequencies above 500 cm-1(60 meV).
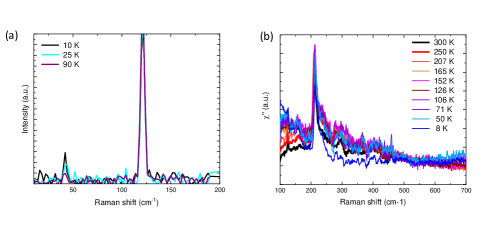
Upon heating, the low-frequency continuum starts to broaden, while the maximum does not change its position considerably. We estimate the scattering rate by a Lorenzian fit of the low-frequency maximum as indicated in Fig 4a as indicated by the hatched area at 10 K. Scattering rate shows linear increase with temperature up to 120 K (red curve in Fig 4b). This behaviour, , where is a correlation length is expected for critical fluctuations close to an AF transition for a simple mean field dependence of correlation length on temperature: Brenig and Monien (1992); Caprara et al. (2005). Above 120 K starts to grow faster than linear dependence, and at temperatures above 160 K (Fig 4b, red curve) the shape of the continuum changes. It becomes incoherent, with a much broader maximum at somewhat higher frequencies around 200 cm-1(see SI for a more detailed temperature dependence). This change of the shape of the Raman continuum from “critical” fluctuations observed below approximately 160 K into a ”diffusive” Brenig and Monien (1992) background typical for any paramagnet at higher temperatures shows a change of the nature of spin-spin correlations in NiGa2S4.
The temperature of 160 K up to which Raman scattering can trace AF fluctuations is considerably higher than 50 K, up to which NS could detect short range AF correlations in NiGa2S4 Stock et al. (2010); Nambu et al. (2008a). Interestingly, anisotropy of the magnetic susceptibility (see Fig. 4, black points) starts to increase for T 50 K, when AF spin correlations start to develop.
Calculations for the -- model Stoudenmire et al. (2009) suggest a lower-temperature regime where AF spin correlations are present, while at higher temperatures spin-nematic interactions prevail. Theoretical calculations for spin-nematic order of a S=1 system on a square lattice with bi-quadratic interactions Michaud et al. (2011) suggested that Raman spectra of a quadrupole ordered state would consist of a band at about 5, and an order of magnitude weaker excitations bands in the region of 10 - 12, twice the energy of the low-frequency continuum. Spectra at temperatures between 50 and 160 K (Fig. 4a) demonstrate a very broad continuum extending all the way to 60 meV. At 10 K we can separate a low-frequency part of the continuum with a maximum at 12 meV, and a much lower intensity continuum at frequency around 50 meV. The asymmetric shape of the Eg phonon at 206 cm-1, as well as slight asymmetry of Ag phonon at 450 cm-1 suggest that they couple to the continuum states in the range of 25 to 50 meV. While these higher-frequency excitations may be the candidate for quadrupole excitations, suggested in Ref. Michaud et al. (2011), measurements with a higher excitation beam frequency is needed for conclusive results.
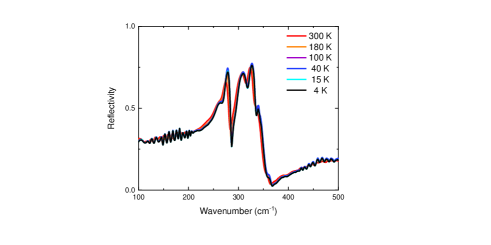
Unexpectedly, and seemingly unrelated to the magnetic properties NiGa2S4, our Raman study finds changes of the lattice symmetry on cooling. In addition to the narrow bands of Raman-active phonons, and the continuum of magnetic excitations, we observe broad features which do not show distinct polarization dependence (Fig. 5a, upper panel). Their intensity increases linearly on cooling, as demonstrated in Fig 5b for the features at 270 and 296 cm-1. Comparison to spectra obtained from our IR reflectance measurements at T=4 K-300 K (see SI) shows, that these bands correspond to infrared-active phonons, as easily recognized for the most intense lines of Eu phonons at 270 and 296 cm-1 marked on the Fig. 5a, lower panel, with dashed lines. symmetry of the unit cell of NiGa2S4 restricts phonon modes to being either Raman or IR active 222In all inversion symmetric crystals, gerade phonons are Raman-active, and ungerade phonons are IR-active. The appearance of Eu and A2u IR modes in the Raman spectrum is an indication of a loss of inversion symmetry. The absence of anomalous broadening or splitting of all Eu and Eg phonons (for details see SI) indicates that in-plane symmetry is unperturbed. To the best of our knowledge, no structural transition or crossover in NiGa2S4 was previously reported. However, sulfur vacancies, which are present in NiGa2S4 Nambu et al. (2009) can break local symmetry. Local point group symmetries consistent with our observations are and . This means, that local deformation of the lattice around a vacancy has a dominant component parallel to the -axis, while preserving isotropic triangular lattice of Ni atoms in the plane.
The increase of the intensity of the IR modes in the Raman spectrum upon cooling suggests that the amplitude of these local deformations of the lattice increases, possibly due to anisotropic thermal contraction. At low temperatures the intensity of the IR lines becomes comparable to that of the Raman-active modes. For local symmetry breaking confined to unit cells with a vacancy, the estimated less than 2 % of sulfur vacancies Nambu et al. (2009) cannot produce such a large effect. This suggests that the symmetry breaking impact of each vacancy goes beyond a single unit cell, but does not lead to a global long range order.
To summarize, we observe two different lattice-related effects in NiGa2S4. One is magneto-elastic coupling, the other is local loss of inversion symmetry. Both can produce considerable effects on the magnetic properties of NiGa2S4.
The phonon at 206 cm-1 shows evidence of magneto-elastic coupling. It can modulate , and lead to a bi-quadratic exchange . DFT calculations calculation are needed to estimate the size of the effect.
The local loss of inversion symmetry due to vacancies can be an additional factor preventing magnetic ordering. According to Ref. Nambu et al. (2009), S1 sites, which are not directly involved in superexchange, are more suspectable to sulfur loss. The distortion of the lattice around a vacancy can randomly change chemical bonds that determine and . Additionally, the loss of inversion symmetry allows for Dzyaloshinskii–Moriya interactions, which were not previously discussed for NiGa2S4, but which can also affect magnetic ordering. Besides, we observed a reduction of in-plane anisotropy below the spin freezing temperature. Deformation of the lattice along the -axis could lie behind this effect.
In agreement with heat capacity, Raman scattering distinguishes three distinct temperature regimes for NiGa2S4:
In the temperature range between 300 and 160 K, no magneto-elastic coupling or antiferromagnetic fluctuations related to low-temperature magnetic state are observed in the Raman scattering. Between approximately 160 and 50 K, the magnetic susceptibility is isotropic, but magnetic Raman scattering identifies the development of local spin correlations. Magneto-elastic coupling is observed for Eg phonon. This points on a spin-nematic regime, but with director that is not pinned to the -axis.
Below 50 K, short range dynamic spin correlations are identified by neutron scattering Stock et al. (2010), with correlation length that increases on cooling, in agreement with further narrowing of the Raman low-frequency magnetic continuum. In this regime the easy-plane anisotropy of the magnetic susceptibility increases as well. Interestingly, magneto-elastic coupling for the Eg phonon which modulates also increases in this regime. Our measurements of the field dependence of magnetic anisotropy show that application of only 0.025 T is enough to suppress the easy plane anisotropy, while according to NS experiments Stock et al. (2010) a much higher field of 5 T is needed to suppress interplane AF correlations.
The authors are thankful to L. Balents, F. Vernay, O. Tchernyshev, and H. Chen useful discussions, and to N. P. Armitage for a possibility of IR measurements in his lab and useful discussions. This work was supported as part of the Institute for Quantum Matter, an Energy Frontier Research Center funded by the U.S. Department of Energy, Office of Science, Basic Energy Sciences under Award No. DE-SC0019331. Work in Japan was supported by Grants-in-Aids for Scientific Research on Innovative Areas (15H05882 and 15H05883) from the Ministry of Education, Culture, Sports, Science, and Technology of Japan, by CREST(JPMJCR18T3), Japan Science and Technology Agency, and by Grants-in-Aid for Scientific Research (16H02209, 17H06137) from the Japanese Society for the Promotion of Science (JSPS). ND thanks ISSP for hospitality.
References
- Savary and Balents (2017) L. Savary and L. Balents, Reports on Progress in Physics 80, 016502 (2017).
- Starykh (2015) O. A. Starykh, Reports on Progress in Physics 78, 052502 (2015).
- Holt et al. (2014) M. Holt, B. J. Powell, and J. Merino, Phys. Rev. B 89, 174415 (2014).
- Stoudenmire et al. (2009) E. M. Stoudenmire, S. Trebst, and L. Balents, Phys. Rev. B 79, 214436 (2009).
- Takano and Tsunetsugu (2011) J. Takano and H. Tsunetsugu, Journal of the Physical Society of Japan 80, 094707 (2011).
- Bhattacharjee et al. (2006) S. Bhattacharjee, V. B. Shenoy, and T. Senthil, Phys. Rev. B 74, 092406 (2006).
- Läuchli et al. (2006) A. Läuchli, F. Mila, and K. Penc, Physical review letters 97, 087205 (2006).
- Nakatsuji et al. (2005) S. Nakatsuji, Y. Nambu, H. Tonomura, O. Sakai, S. Jonas, C. Broholm, H. Tsunetsugu, Y. Qiu, and Y. Maeno, 309, 1697 (2005).
- Stock et al. (2010) C. Stock, S. Jonas, C. Broholm, S. Nakatsuji, Y. Nambu, K. Onuma, Y. Maeno, and J.-H. Chung, Phys. Rev. Lett. 105, 037402 (2010).
- Pradines et al. (2018) B. Pradines, L. Lacombe, N. Guihéry, and N. Suaud, European Journal of Inorganic Chemistry 2018, 503 (2018).
- Nambu et al. (2015) Y. Nambu, J. S. Gardner, D. E. MacLaughlin, C. Stock, H. Endo, S. Jonas, T. J. Sato, S. Nakatsuji, and C. Broholm, Phys. Rev. Lett. 115, 127202 (2015).
- Note (1) It is useful to mention, that this state is different from what is called ”nematic order” found, for example, in FeAs.
- Nambu et al. (2009) Y. Nambu, R. T. Macaluso, T. Higo, K. Ishida, and S. Nakatsuji, Phys. Rev. B 79, 214108 (2009).
- Barma (1975) M. Barma, Physical Review B 12, 2710 (1975).
- Tchernyshyov and Chern (2011) O. Tchernyshyov and G.-W. Chern, in Introduction to Frustrated Magnetism (Springer, 2011) pp. 269–291.
- Michaud et al. (2011) F. Michaud, F. Vernay, and F. Mila, Physical Review B 84, 184424 (2011).
- Nakatsuji et al. (2007) S. Nakatsuji, H. Tonomura, K. Onuma, Y. Nambu, O. Sakai, Y. Maeno, R. T. Macaluso, and J. Y. Chan, Phys. Rev. Lett. 99, 157203 (2007).
- Kim et al. (2012) Y. Kim, X. Chen, Z. Wang, J. Shi, I. Miotkowski, Y. Chen, P. Sharma, A. Lima Sharma, M. Hekmaty, Z. Jiang, et al., Applied Physics Letters 100, 071907 (2012).
- Zhang et al. (2015) W.-L. Zhang, H. Li, D. Xia, H. Liu, Y.-G. Shi, J. Luo, J. Hu, P. Richard, and H. Ding, Physical Review B 92, 060502 (2015).
- Fano (1961) U. Fano, Phys. Rev. 124, 1866 (1961).
- Fleury and Loudon (1968) P. Fleury and R. Loudon, Physical Review 166, 514 (1968).
- Perkins and Brenig (2008) N. Perkins and W. Brenig, Phys. Rev. B 77, 174412 (2008).
- Kampf and Brenig (1992) A. P. Kampf and W. Brenig, Zeitschrift für Physik B Condensed Matter 89, 313 (1992).
- Caprara et al. (2005) S. Caprara, C. Di Castro, M. Grilli, and D. Suppa, Physical review letters 95, 117004 (2005).
- Vernay et al. (2007) F. Vernay, T. P. Devereaux, and M. J. P. Gingras, Journal of Physics: Condensed Matter 19, 145243 (2007).
- Brenig and Monien (1992) W. Brenig and H. Monien, Solid state communications 83, 1009 (1992).
- Nambu et al. (2008a) Y. Nambu, S. Nakatsuji, Y. Maeno, E. K. Okudzeto, and J. Y. Chan, Phys. Rev. Lett. 101, 207204 (2008a).
- Note (2) In all inversion symmetric crystals, gerade phonons are Raman-active, and ungerade phonons are IR-active.
- Yamaguchi et al. (2010) H. Yamaguchi, S. Kimura, M. Hagiwara, Y. Nambu, S. Nakatsuji, Y. Maeno, A. Matsuo, and K. Kindo, Journal of the Physical Society of Japan 79, 054710 (2010), https://doi.org/10.1143/JPSJ.79.054710 .
- Nambu et al. (2008b) Y. Nambu, M. Ichihara, Y. Kiuchi, S. Nakatsuji, and Y. Maeno, Journal of Crystal Growth 310, 1881 (2008b).
- Giannozzi et al. (2009) P. Giannozzi, S. Baroni, N. Bonini, M. Calandra, R. Car, C. Cavazzoni, D. Ceresoli, G. L. Chiarotti, M. Cococcioni, I. Dabo, A. Dal Corso, S. de Gironcoli, S. Fabris, G. Fratesi, R. Gebauer, U. Gerstmann, C. Gougoussis, A. Kokalj, M. Lazzeri, L. Martin-Samos, N. Marzari, F. Mauri, R. Mazzarello, S. Paolini, A. Pasquarello, L. Paulatto, C. Sbraccia, S. Scandolo, G. Sclauzero, A. P. Seitsonen, A. Smogunov, P. Umari, and R. M. Wentzcovitch, Journal of Physics: Condensed Matter 21, 395502 (19pp) (2009).
- Lutz et al. (1986) H. D. Lutz, W. Buchmeier, and H. Siwert, Zeitschrift für anorganische und allgemeine Chemie 533, 118 (1986).
I Supplemental Material
I.1 Crystal growth and preparation for measurements
NiGa2S4 single crystals were grown using the method outlined in Ref. Nambu et al., 2008b. The resulting crystals are thin plates with the most developed surface parallel to plane measuring up to 3 mm by 3 mm and thickness 10 m.
In preparation for measurements, the samples were cleaved to ensure optimum concentration of sulfur in the probed samle. Raman scattering showed reproducible data for spectra measured from cleaved surfaces of different crystals. Magnetic susceptibility measurements showed the transition into the spin frozen state at 8 K, which corresponds to the best quality crystals with less than 4 % sulfur vacancies Nambu et al. (2009).
I.2 Neutron scattering measurements
The neutron scattering experiment was carried out on the MACS instrument at the NIST Center for Neutron Research. 19 single crystals of with total mass g were co-aligned in the plane for the measurement. A final neutron energy of meV was used for measurements with energy transfer meV, while meV was employed for measurement with meV. All measurements were normalized to the monitor counts that corresponds to 1 minute counting with incident neutron energy meV. An aluminum sample with similar mass to the sample holder as well as the empty cryostat were measured separately at all experimental settings for background subtraction. The one-magnon density of states is calculated by integrating the neutron scattering intensities measured at K over a common region in the second Brillouin zone, which is accessible for all energy transfer. Under the assumption that the crystal momentum remains a good quantum number, the two-magnon density of states probed by Raman scattering is related to the one-magnon density of states by , which is found to agree well with the Raman measurements.
I.3 Raman scattering spectroscopy
The crystals of NiGa2S4 are shaped as thin plates, thus spectra in polarization ( scattering channel) were measured only at room temperature using a micro-Raman setup, while spectra in the plane were measured down to 4 K using a combination of macro and micro-Raman setups. Spectra in the plane were measured from freshly cleaved surfaces.
The main Raman scattering data were obtained using a macro-Raman setup based on a Jobin-Yvon T64000 Raman spectrometer in a single monochromator configuration in a pseudo-Brewster’s angle scattering geometry. Measurements at temperatures from 300 K to 4 K in the frequency range between 100 cm-1 and 600 cm-1 were performed using a 514.5 nm line of an Ar+-Kr+ Coherent laser for excitation. Laser power did not exceeding 4 mW for a laser probe of m to avoid overheating of the sample. The sample was attached to the cold finger of Janis ST500 cryostat. Additional room temperature measurements of NiGa2S4 crystals in polarization in the 100 cm-1 to 600 cm-1 spectral range were obtained using the Jobin-Yvon T64000 Raman spectrometer equipped with Olympus microscope with the spot diameter of 2 m. Phonon spectra in the frequency range from 10 cm-1 to 600 cm-1 with resolution 5 cm-1 were obtained using a Jobin-Yvon U1000 spectrometer equipped with a photomultiplier detector, in a pseudo-Brewster’s angle scattering geometry. 514.5 nm line of an Ar+ laser was used as excitation light with a beam size on the sample of m m. Low temperature measurements were performed using a custom built Janis cold finger cryostat.
All presented spectra are normalized by a first-order Bose-Einstein thermal factor .
The NiGa2S4 structure is described by the trigonal space group, which corresponds to the point group symmetry with the following Raman tensors:
Based on these Raman tensors, the intensities for the different measured polarizations of electrical vector of the excitation light and of the Raman scattered light can be decomposed as
where denote and lying in the plane, and -polarized light is parallel to the out of plane axis. Discrepancies between the theoretical and the observed polarization dependence can be attributed to the depolarization that occurs at the crystal surface in all non-backscattering geometries.
Raman data and data analysis:
DFT calculations The frequencies of the phonons at the point of the BZ and the respective atomic displacements were calculated using density functional theory (DFT) calculations with Quantum Espresso software with the PHonon package Giannozzi et al. (2009) based on the average structure determined by x-ray diffraction measurements Nambu et al. (2009). A generalized gradient approximation was used for the exchange-correlation in the energy functional.
Assignment of pohonons in experimental spectra The observed phonon frequency assignment is based on our DFT calculations. Of six Raman-active (A1g and Eg) NiGa2S4 phonons (Table 1) we observe five (Fig. 6). Another mode expected at 285 cm-1 is observed as a very weak band in spectra. Likely it is more intense for , ( in the above Raman tensors), for which no measurements were performed. Frequencies of all the phonons observed in IR and Raman spectra and their assignment based on our DFT calculations are listed in Table 2. Calculated frequencies show a good agreement with the experiments exept for the highest frequency A1g phonon, which is observed at frequencies significantly higher than the calculation suggests.
| Element | Wyckoff position | representation |
|---|---|---|
| Ni | 1b | |
| Ga | 2d | |
| S1 | 2d | |
| S2 | 2d |
Phonon Raman spectra in the frequency range between 10 and 200 cm-1 are presented in Fig. 8a. They show two lowest lying phonons, Eg at about 42 cm-1, and A1g at about 120 cm-1. Note that Eg phonon is not broadened on cooling, in contrast to the at 206 cm-1.
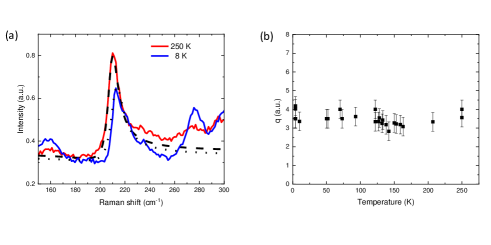
Magneto-elastic coupling Coupling of the Eg phonon at 206 cm-1 to a continuum of excitations is described by the Fano formula Zhang et al. (2015). We show in the main part of the text, that upon cooling, the width of the phonon obtained by least squares fitting of the spectrum increases. The temperature dependence of the width follows the growth of intensity of the continuum of magnetic excitations. In this formula, is an empirical coupling parameter, the value of which describes the strength of coupling, that depends on the spectral position of the continuum relative to the phonon Fano (1961). The positive value of suggests that the continuum with which the Eg phonon is interacting lies at frequencies above that of the phonon. The parameter has a very weak temperature dependence (Fig. 7 b), which indicates that continuum stays at constant frequencies in the whole measured temperature range.
Raman-forbidden phonons subtraction
To analyse the continuum of magnetic excitations detected in Raman scattering spectra, we subtracted a contribution of the spectra related to Raman-forbidden phonons (), which appear in the spectra due to local symmetry breaking, from the total experimentally measured Raman scattering . As clearly observed in Fig. 4a, upper panel, this contribution is isotropic, in contrast to the narrow bands of Raman-active phonons. This isotropic contribution was fitted with a sum or Lorenzian spectral shape, and subtracted from the spectra at each temperature: = -.
I.4 Low temperature IR spectra
IR spectroscopy A Bruker Fourier transform infrared (FTIR) spectrometer with a bolometer detector was used to obtain the reflection infrared spectrum across an energy range from 150 cm-1 to 600 cm-1 with a resolution of 2 cm-1. Spectra were measured with polarization of light , where only modes with symmetry are observed. The absolute reflectance values were obtained by referencing the sample spectra to that of a sample with a gold film evaporated on its surface. Absorbance spectra were obtained from reflectance using Kramers-Kronig transformation. For measurements from 4 K to 300 K a cold finger cryostat Janis ST300 was used. The results are in general agreement with infrared measurements on powder NiGa2S4 samples Lutz et al. (1986).
| Observed Raman bands | Observed IR | DFT calculations | ||||||||
|---|---|---|---|---|---|---|---|---|---|---|
| Sym (pol) | Observed Pol. | Pol. | Ni | Ga | S1 | S2 | ||||
| 9 | 0.38 | 0.38 | 0.38 | 0.38 | ||||||
| 18 | 0.38 | 0.38 | 0.38 | 0.38 | ||||||
| 42 | 5 | 40 | 0.00 | 0.50 | 0.49 | 0.10 | ||||
| 62 | 0.54 | 0.30 | 0.28 | 0.44 | ||||||
| 120 | 5 | 118 | 0.00 | 0.44 | 0.50 | 0.24 | ||||
| 123 | 0.86 | 0.19 | 0.30 | 0.07 | ||||||
| 206 | 19 | 187* | 198 | 0.00 | 0.06 | 0.00 | 0.70 | |||
| none | 233 | |||||||||
| 276 | xx,xy | 271 | 261 | 0.54 | 0.11 | 0.16 | 0.56 | |||
| 276 | xx,xy | 280 | 0.12 | 0.08 | 0.52 | 0.46 | ||||
| wing 290 | xy | 284 | 0.00 | 0.28 | 0.65 | 0.05 | ||||
| 312 | xx,xy | 298 | 284 | 0.14 | 0.27 | 0.62 | 0.17 | |||
| 313 | 10 | 316 | 316 | 0.00 | 0.21 | 0.57 | 0.34 | |||
| none | 335 | |||||||||
| 357 | 356w | unpol. | 354 | 0.03 | 0.37 | 0.33 | 0.50 | |||
| 450 | 14 | 408 | 0.00 | 0.25 | 0.18 | 0.63 | ||||
I.5 Magnetic susceptibility
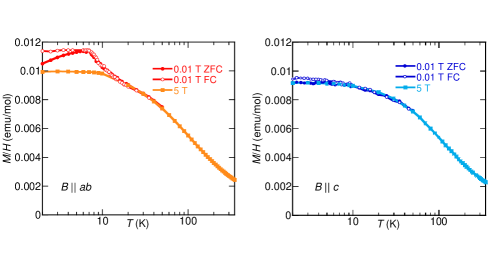
The temperature dependence of the susceptibility at H = 0.01 and 5 T for the in plane ()) and out-of-plane () direction is presented in Fig. 10 (a) and (b), respectively. Hysteresis between the field-cooled (FC) and zero-field-cooled (ZFC) data under 0.01 T is seen below a freezing temperature = 7 K. The Weiss temperature = −83(1) K and the effective moments = 2.81 /Ni are estimated by the Curie-Weiss law, for temperatures 150 K T 350 K under 5T.