Android Malware Clustering using Community Detection on Android Packages Similarity Network
Abstract
The daily amount of Android malicious applications (apps) targeting the app repositories is increasing, and their number is overwhelming the process of fingerprinting. To address this issue, we propose an enhanced Cypider framework, a set of techniques and tools aiming to perform a systematic detection of mobile malware by building a scalable and obfuscation resilient similarity network infrastructure of malicious apps. Our approach is based on our proposed concept, namely malicious community, in which we consider malicious instances that share common features are the most likely part of the same malware family. Using this concept, we presumably assume that multiple similar Android apps with different authors are most likely to be malicious. Specifically, Cypider leverages this assumption for the detection of variants of known malware families and zero-day malicious apps. Cypider applies community detection algorithms on the similarity network, which extracts sub-graphs considered as suspicious and possibly malicious communities. Furthermore, we propose a novel fingerprinting technique, namely community fingerprint, based on a one-class machine learning model for each malicious community. Besides, we proposed an enhanced Cypider framework, which requires less memory, , and less time to build the similarity network, , compared to the original version, without affecting the fingerprinting performance of the framework. We introduce a systematic approach to locate the best threshold on different feature content vectors, which simplifies the overall detection process. Cypider shows excellent results by detecting coverage of the malware dataset in one detection iteration with higher precision in the detected malicious communities. On the other hand, the community fingerprints are promising as we achieved , , and in the detection of the malware family, general malware, and benign apps respectively.
1 Introduction
Mobile devices and their applications have become an integrated part of our everyday life. People nowadays are using mobile devices to store and send their personal and sensitive data, which makes them attractive targets to cyber criminals. Android [1] is the most popular and dominant operating system among mobile users. In September 2019, Android had 76% of the market share worldwide [2], as it is deployed on different devices such as smartphones and tablets. It also succeeded in reaching other smart devices such as TVs [3], watches [4], and cars [5]. Moreover, Android OS is increasingly integrated into IoT systems, especially with the appearance of Google’s Android Things [6], an embedded operating system that is designed for low-power and resource-constrained IoT devices.
Android OS implements some mechanisms such as sandboxing, to provide security for smart devices. However, the Android security mechanisms failed to defend against the different threats. Due to its popularity, Android is increasingly targeted by malware developers. According to G DATA [7], there is an average of more than new malware that appeared per day in the first half of 2019, which corresponds to a new malicious app every 8 seconds.
Malware could be divided into two main classes: i) malware variant, which is a new version of known malware, and ii) unseen malware or zero-day malware, which is a new malicious app, which is unknown and not discovered by security investigators and anti-malware vendors. Due to a large number of released Android apps along with the daily emergence of malicious apps, the manual investigation, and analysis of new apps have become a cumbersome task. The conventional approaches rely on matching signature-based patterns with known malware families. However, these approaches are not practical and not effective, as they rely on cryptographic hashes. As a result, malware developers could easily evade detection by employing minor modifications in the original malware app. Furthermore, signature-based approaches are not capable of detecting new malware families, which raises serious concerns about the systematic detection of new malware without or with minimum human intervention. Other approaches are based heuristic-based or machine-learning techniques to produce learning-based patterns, which aim to detect known and new malware. They are more effective than the signature-based ones at detecting zero-day malware. Still, their detection accuracy essentially depends on the training set and the used features to generate the detection model.
In this context, we aim at dealing with large-scale Android malware by reducing the length of the analysis window of newly detected malware. This time window ranges from malware detection to signature generation by security vendors. When the analysis window is long, the malicious apps are given more time to infect the users’ devices. The existing techniques incur a large window due to the overwhelming number of Android apps that appear daily . Besides, they employ a manual investigation to analyze malware. Thus, there is a need to reduce reliance on manual analysis to reduce the length of the analysis window. To achieve this objective, we propose systematic tools, techniques, and approaches for the detection of both known and unseen malware (i.e., malware variants and zero-day malware). We assume that two Android apps, each of which has a different author and certificate, are most likely to be malicious if they are highly similar. This assumption relies on the fact that the malware developer usually injects the same malicious payload into multiple repackaged applications to hide it. Thus, it is unlikely to find such a malicious payload in a benign Android app. Consequently, two Android apps should not be highly similar with respect to their components, except for known libraries. This observation could be used as a basis to design and develop a security framework for Android malware detection.
In this paper, we are motivated by the earlier-mentioned to propose a cyber-security framework, called Cypider (Cyber-Spider For Android Malware Detection), to identify and cluster Android malware without the need of any prior knowledge about the signature-based or learning-based patterns of Android malware apps. Cypider is a novel framework, which combines techniques and methods to deal with the issue of Android malware clustering and fingerprinting. Cypider, and automatic framework that adopts an unsupervised approach, is designed (1) to detect repackaged malware (or malware families), which represent most of the Android malicious apps [8], and (2) to detect new malware apps. The principal idea of Cypider is based on building a similarity network that connects the input apps. After that, sub-graphs with high connectivity, called communities, are extracted from the similarity network. These communities are most likely composed of malicious apps. This step is followed by generating a novel fingerprint for each extracted community, called community fingerprinting. Instead of employing a hash or fuzzy hash-based signature of the app, the One-Class Support Vector Machine learning model (OC-SVM) [9] is used to compute the community fingerprint of the Android malware family or sub-family. OC-SVM is a machine learning technique, which is trained by using the features of one class to generate the learning model, i.e., community fingerprint, to decide whether a given unseen Android app belongs to the community or not. After constructing the communities of malicious apps, Cypider framework triggers a periodic process, which aims to build new communities from the remaining apps (i.e., apps that do not belong to any community) and the new arrival apps to Cypider, which together form what we call the active dataset.
The scalability issue of Cypider is addressed through three main techniques: (1) the performance of Cypider is negatively impacted by the high dimensionality of the statistical features that are extracted from the Apk file. For this purpose, feature hashing [10] technique is employed to reduce the high dimensional vector to a fixed-size vector without affecting the detection rate. (2) Dimensionality reduction is applied to reduce to compress the feature hashing vectors. (3) FAISS 111https://github.com/facebookresearch/faiss, which is a similarity computation technique, is used to compute the similarity among the apps’ vectors, (4) a scalable community detection algorithm [11] is used to extract the malicious communities. To sum up, Cypider framework is a set of algorithms, mechanisms, and techniques, which are integrated into one approach to detect Android malicious app without requiring to any pre-knowledge about the malware and their families. Besides, Cypider is designed to generate the unsupervised fingerprints of the possible malware threats by leveraging the proposed community fingerprint concept.
In the Original Cypider, we made the following contributions:
-
1.
We designed and implemented an unsupervised-based Android malware detection and family attribution framework. The proposed framework has shown to be effective and efficient by applying a clustering approach, which leverages the community concept and graph partition techniques.
-
2.
We proposed a community fingerprint, a novel detection model to represent the pattern of a given community, which could be an Android malware family or subfamily.
In this paper, the main contributions of the enhanced Cypider are:
-
1.
We propose an enhanced design for Cypider by applying dimensionality reduction on feature hashing vectors to produce a short dense vector for android malware (see Section 5). This enhancement increases the efficiency of the similarity computation to times (see Section 10.4) compared to the original design [12].
-
2.
We propose a systematic mechanism to determine the best threshold trade-off for the different contents of the APK file. This proposed heuristic solves the issue of manual threshold search for each content type as in the original design [12]. Furthermore, it provides the security practitioner with a simple mechanism to customize Cypider between the recall and precision settings (see Section 6).
-
3.
We conduct detailed evaluations that assess the effect of our solution hyper-parameters on the performance of the framework. We also assess the scalability and the effectiveness of Cypider on large-scale datasets namely: (1) Genome malware dataset [8], (2) Drebin malware dataset [13, 14], (3) AndroZoo (66k) malware dataset, and (4) the combined previous datasets with benign (50k) dataset. The evaluation experiments show good results in the context of unsupervised malware detection (see Section 9, 10, and 11).
-
4.
We conduct extensive experiments to measure the effect of different obfuscation techniques on our framework using different obfuscated datasets, PRAGuard [15] and Obfuscated Drebin (using DroidChameleon [16]) and non-obfuscated datasets (MalGenome). Cypider shows high resiliency against common obfuscation and code transformation techniques (see Section 12).
2 Overview
2.1 Threat Model
The main objective of Cypider is to detect Android malicious apps without the need for any prior knowledge about these malware samples and their patterns. More precisely, Cypider focuses mainly on the bulk detection of malware families and malware variants rather than the detection of an individual malicious app by extracting the malicious communities from the similarity network of the apps dataset. The second objective of Cypider is to provide a scalable yet accurate solution that can process the overwhelming number of malware that appear daily, and which could compromise the users’ smart devices. Cypider is robust (Section 12) but not immune against obfuscated apps contents. Cypider could resist against some types of obfuscations as it analyzes different static contents of the Android package. Cypider could be more resilient to obfuscation as it could fingerprint malware apps with other static contents that are not obfuscated, such as app permissions. It is important to mention that static contents could be obfuscated in one app and not in another, which is related mostly to how the malware developer writes the malware code.
Cypider is evaluated under real malware datasets along with random Android apps chosen from Google Play, where the apps are assumed to be obfuscated through ProGuard, to test the effectiveness and efficiency of Cypider in real word obfuscation scenarios. Cypider could not detect dynamic transform attacks, e.g., when the malicious payload does not exist in APK static file and is downloaded at runtime. The aim of Cypider is to detect homogeneous and pure malicious communities, where each community corresponds to one malware family and hence makes the malware analysis process easier. Besides, Cypider aims to provide a high detection accuracy along with a low false-positive rate.
2.2 Usage Scenarios
Cypider is a generic approach that is used to investigate the existence of similarity among apps and could be applied to various usage scenarios. The first usage scenario is about the comparison of software programs, where the input is a set of software programs, and the output is the set of programs that have similar features. The possible application of this scenario is the authorship attribution, where the obtained communities represent the binary programs that are written by the same author. The second scenario is about detecting plagiarized software, a community of binary programs with different authors, but similar to a given copyrighted software. The third and fourth usage scenarios are malware detection and family attribution, respectively, i.e., performing bulk detection by identifying communities of similar malicious apps, and consequently infer their respective families. In this paper, our focus is on Android malware detection.
Cypider is evaluated using two types of experimental scenarios. In the first experiment, we only consider malicious Android apps. This experiment aims to speed up the analysis process by performing bulk detection and attribute the detected malware to their corresponding families. This is also achieved by performing automatic analysis with minimal human intervention. The family could be attributed to a community by starting with a small set of apps, i.e., one app in most cases. On the other hand, unassigned apps are considered suspicious and require manual investigation. The malware analysis approaches could be divided into:
-
1.
Semi-supervised Approach: We use a dataset of known malicious apps and their families, in addition to unknown malicious apps. The dataset is fed to Cypider to generate malicious communities. First, known malicious apps from the same family are grouped (i.e., strongly-connected graph), and assigned to the same community. Second, the unknown malicious apps, which have similar features as an existing community, will most likely join that community. Analogically, the communities of known malicious apps could play the role of a magnet for unknown ones, if known and unknown apps share the same features, which implies the same malware family.
-
2.
Unsupervised Approach: We use a dataset that does not have any information about the tested apps that are fed to Cypider. The aim is to find communities instead of a single malicious app. By focusing on finding communities (i.e., bulk detection), security investigators could drastically increase their productivity. In this paper, we consider the unsupervised approach.
In the second experimental scenario, we consider a mixed dataset of Android apps (i.e., malicious and benign). Such a dataset could be the result of a preliminary suspiciousness app filtering, which might lead to high false positives. Let us suppose that benign apps (i.e., false positives) represent of the size of suspicious apps; we could identify malicious apps by detecting the communities that have a common payload, as we assume that highly similar apps are likely to be malicious. In other words, malicious apps from the same family tend to be very similar due to the shared malicious payload. This assumption could be extended to benign apps. Benign apps from the same category such as games tend to be similar due to the shared features. The similarity between apps helps group malware into malicious communities, but also helps group benign apps into benign communities. In addition, Cypider could filter benign apps (i.e., less suspicious apps) that are not similar to the suspicious apps in the active dataset. The previously described approaches, i.e., Semi-supervised and Unsupervised, could be applied to the mixed dataset to target Android malware detection and family attribution. More specifically, we adopt the target of the unsupervised approach, which detects malicious apps without any prior-knowledge about malware.
3 Methodology
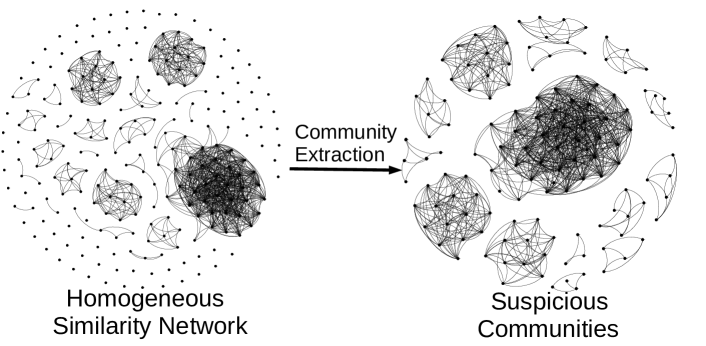
Cypider framework is applied to a dataset of unlabeled apps (malicious or mixed dataset), aiming to generate community fingerprints for the processed apps. The overall architecture of Cypider is shown in Figure 1, and is comprised of the following steps:
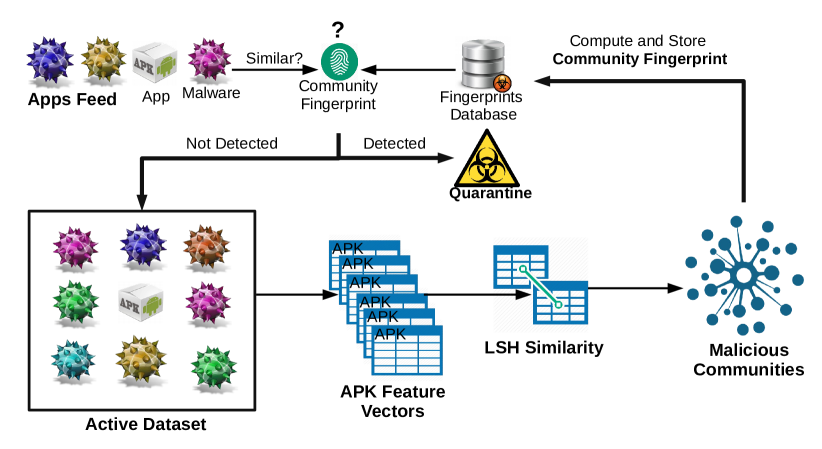
In the first step, the apps that are developed by the same author, also known as sibling apps, are filtered out. The main reason is to remove the noise that could be produced by having sibling apps in the app communities, as the authors tend to use the same components in their different apps. Sibling apps could be identified through the information that is available in the META-INF directory in the APK file, such as app version, app hash, and author signature. Thus, only apps with different authors are kept as adversaries prefer to use different fake author identities to evade detection in case one of their apps is caught. To deal with many apps having the same author, Cypider randomly chooses one app, and if it is found malicious after analysis, all its sibling apps are considered malicious.
After filtering out the sibling apps, we extract meaningful information (i.e., features) from the apps, to identify these apps and compute the similarity among them. To this end, Cypider extracts statistical features from all the apps. It is worth noting that the selected features must be resilient against the attacker’s evasion detection techniques. To achieve this aim, we choose features that are broad enough to cover most of the static characteristics of an Android app. The more extensive the features are, the more resilient they are. To this end, we extract from the APK file, its static contents such as dex, resources, assembly, etc., as explained in Section 4.
Cypider uses the extracted features from each content to computes a fixed-length feature vector for each content features. Cypider leverages a machine learning pre-processing technique, named feature hashing [10] to normalize and reduce the size of the feature vectors, as described in Section 5. Based on the extracted features of the previous stage, Cypider generates multiple small and fixed-size feature vectors. The number of the generated feature vectors depends on the number of APK contents that are considered during feature extraction, i.e., each content type corresponds to one feature vector.
Afterward, Cypider performs a dimensionality reduction technique, specifically by applying Principle Component Analysis (PCA), to reduce the size of the feature vector from to compressed embedding . The feature vector size and its compression are hyperparameters, which are set to and in all the experiments. To ensure the efficient comparison between the apps, Cypider is empowered with a highly scalable similarity computation technique, based on FAISS 222https://github.com/facebookresearch/faiss, which computes the similarities between apps, as described in Section 6.
Then, we compute the similarity between a pair of apps with respect to content feature vectors, to decide if the two apps are connected or not in the similarity network. The result of this similarity computation is an undirected network (or similarity network), where the nodes are Android apps, and the edges represent the high similarity between two apps for one content. For highly similar apps, multiple edges are expected to be formed between two apps. Besides, the more edges are formed, the more likely the apps malicious.
Cypider takes similarity network as input in order to detect communities of malicious apps. However, this step mainly depends on the usage scenario (Section 2.2). In the case of a malicious dataset, Cypider extracts communities of highly connected apps and removes them out from the dataset. The rest of the apps, i.e., apps that do not belong to any community, will be considered in another Cypider malware detection iteration. We expect to get a pure or near-pure community if its apps belong to the same or almost the same Android malware family. In the case of a mixed dataset, Cypider first excludes all the nodes with degree from the similarity network, (i.e., the app is only self-similar), which are most likely to be benign apps. Afterward, Cypider extracts the communities of malicious apps.
The rest of the apps, which are not part of any community, will be processed in future Cypider iterations. At this point, we expect to get some communities of benign apps as false positives. However, Cypider’s decision is explainable because, based on the similarity network, the security investigators can track for which contents the apps are similar. The previous option could also be used to help in narrowing down the statistical features to prevent benign apps from being considered in malicious communities. As for community detection (Section 7), a highly scalable algorithm [11] is adopted to improve Cypider’s community detection module. At this stage, we get a set of malicious communities, which are most likely to be a malware family or a subfamily. Cypider applies a one-class classifier [9] on the malicious communities to produce a detection model, also called community fingerprint (Section 8). Instead of employing traditional crypto-hashing or fuzzy hashing of one malware instance, this fingerprint represents the pattern of a given detected community and captures the features of their apps. It is also used to decide if new malware apps are part of a family or not. The result is multiple community fingerprints, each of which corresponds to a detected community. The generated fingerprints are stored in the signature database, to be used later in analyzing new malware.
At this stage, Cypider will execute another detection iteration using a new dataset that also comprises the rest of the apps from the previous iteration, which has not been assigned to any community. The same previous steps will be followed in the new iteration. However, we need first to compare the feature vectors of the new apps with the known malware communities fingerprint that are stored in the database. The apps that are matched to a community fingerprint are labeled as malicious without adding them to the active dataset. The unmatched apps are added to the active dataset and are considered in the next iteration of the detection process.
Cypider approach can be considered as an iterative process. In each iteration, Cypider detects and extracts communities from the active dataset that continuously gets new apps (malware only or mixed) daily, in addition to the unassigned apps from the previous iterations.
4 Statistical Features
In this section, we present the statistical features that are extracted from Android packaging (APK) files, and which will be the input to the similarity computation process. As mentioned earlier, the features need to be broad enough to cover most of the static content of the APK file. The features could be classified according to the following APK content categories: (1) Binary features, which are derived from the byte-code (Dex file) of the Dalvik virtual machine. The Dex file and its hex dump file are also considered. (2) Assembly features, which are computed from the assembly of classes.dex. (3) Manifest features, which are extracted from the Manifest file. (4) APK features, which represent the rest of APK file contents, such as resources and assets. In this section, we present the statistical features, which are based on the N-gram concept. For more clarification, we first present the structure of Android packaging.
4.1 Android APK Format
Android Application Package (APK) is the official format for Android packaging, which is used to distribute and install Android apps. It is similar to EXE file in Windows and DEB/RPM file in Linux. More specifically, APK is a ZIP file that includes the required components to run the app. APK is structured into a set of directories, namely: lib, res, assets and files namely: AndroidManifest.xml and classes.dex. The purpose of these items is the following: i) AndroidManifest.xml includes the app meta-data, e.g., name, version, required permissions, and used libraries. ii) classes.dex includes the compiled classes of the Java code. iii) The lib directory includes C/C++ native libraries [17]. iv) The resources directory includes the non-source code files that are packaged into the APK file during compilation. It mostly includes media files such as audio, image, and video files.
4.2 N-grams
The N-gram is a technique found in Natural Language Processing (NLP), and is defined as the sequence of N adjacent items that are extracted from a larger sequence. In this work, we use N-gram to extract the sequences that exist in Android malware to differentiate between the malware samples. We apply the N-gram technique on different contents of Android app package, such as classes.dex, which captures the semantic pattern of the APK. For each APK content, we compute multiple feature vectors. Each vector V ( where represents all the possible N-grams of a given APK content). Each element from the vector V represents the number of occurrences of a particular N-gram in APK content.
4.3 The classes.dex Bytes N-grams
To increase the amount of extracted information form classes.dex file, we employ two types of N-gram: opcodes N-grams and bytes N-grams, which are computed from Dex file and its assembly respectively. In addition, we compute Byted N-grams from the hexdump of the classes.dex file, by sliding a window of the hex string, where one field in that string is a byte, as depicted in Figure 2.
4.4 Assembly opcodes N-grams
The opcode N-grams are the only sequences in the disassembly of classes.dex file, where we can separate the instructions from their operands. Figure 2 shows an example of this N-gram. We choose opcodes instead of the complete instruction for many reasons: i) The opcodes are more resilient to simple obfuscations that change some operands such as hard-coded IPs or URLs. ii) The opcodes could be more robust to changes made by malware writers who only modify or rename some operands when repackaging the Android app. iii) Also, the extracted opcodes incur low computational cost compared to the complete instruction.
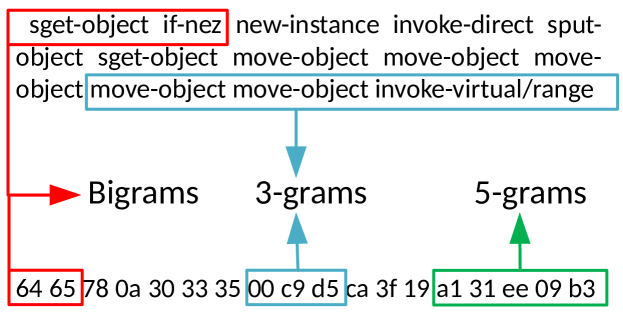
The information obtained from the opcode N-gram could be more meaningful by only considering functions that use sensitive APIs such as SMS API. We can also decrease the noise from the N-gram information by excluding the most common opcode sequence. The N-gram extraction process will result in a list of unique N-grams along with their number of occurrence for each content category, i.e., opcode instructions, classes.dex. Figure 2 depicts the extracted N-grams from the instructions and the bytes of the first portion of the AnserverBot malware. Besides, we consider the names of classes and methods as assembly features.
4.5 Native Library N-grams
The Native Library identifies the C/C++ shared libraries [17] that are used by malware. Native library is important in some cases to differentiate between two Android malware samples. For instance, in case of DroidKungFu malware family, the malware is more likely to be DroidKungFu2 and not DroidKungFu1, as DroidKungFu2 uses C/C++ library and DroidKungFu1 only uses Java byte code.
4.6 APK N-grams
The N-gram of the APK file allows us to get an overview of the APK file semantics. For instance, most of the repackaged apps are built by making minor modifications to original apps [18]. Therefore, by applying N-gram computation on the APK file, we can detect a high similarity between the original app and the repackaged one. Besides, adversaries preserve some components in the APK file, e.g., images and GUI layout structures, primarily if they aim to build a phishing malware. In this case, both apps are visually similar, and consequently, their N-gram sequences are similar with respect to the resource directory.
4.7 Manifest File Features
AndroidManifest.xml file, which contains the permissions that are requested by apps provides important features that could help in detecting malicious apps. For example, apps that request SMS send permission are more suspicious, as an important percentage of Android malware apps sends SMS to premium phone numbers. In addition, other features from AndroidManifest.xml are extracted namely, services, activities, and receivers.
4.8 Android API Calls
The request permissions give a global view of the possible behavior of an app. However, a more granular view could be obtained by tracking the Android API calls, as single permission allows access to multiple API calls. Therefore, we add the list of API calls list, which is used by the apps, to the feature list. In addition, we focus more on the suspicious APIs, such as sendTextMessage() and orphan APIs, which correspond to undeclared permissions. We also extract the list of permissions that have no used APIs in the app.
4.9 Resources
In this category, we extract features that are related to the APK resources, such as text string, file names, and their content. We mainly extract the files that do not include the names of standard files, e.g., String.xml. Also, we consider the contents of files by computing md4 hashes on each resource file, as it incurs low computation cost compared to more modern cryptographic hashing algorithms such as MD5 and SHA1. Therefore, the scalability of the system is enhanced. Finally, we apply text string selection on the text resources by leveraging tf-idf (term frequency-inverse document frequency) [19] technique for this purpose.
4.10 APK Content Types
Table 1 summarizes the categories of the proposed features based on APK contents of the app. It also shows the features that are considered in the current implementation of Cypider. We believe that the used features give a more accurate representation of Android packages as shown in previous work [20]. In the other hands, The features that we excluded such as Text Strings and Assembly Class Names are highly vulnerable to common obfuscation techniques. Also, excluded features such as Manifest Receivers generate very sparse features vectors which effect the overall accuracy.
| # | Content Type Features | Implemented Feature |
|---|---|---|
| 0 | APK Byte N-grams | X |
| 1 | Classes.dex Byte N-grams | X |
| 2 | Native Library Bytes N-grams | X |
| 3 | Assembly Opcodes Ngrams | X |
| 4 | Assembly Class Names | |
| 5 | Assembly Method Names | |
| 6 | Android API | X |
| 7 | Orphan Android API | |
| 8 | Manifest Permissions | X |
| 9 | Manifest Activities | X |
| 10 | Manifest Services | X |
| 11 | Manifest Receivers | |
| 12 | IPs and URLs | X |
| 13 | APK Files names | X |
| 14 | APK File light hashes (md4) | |
| 15 | Text Strings |
5 Feature Preprocessing
The proposed framework is based mainly on two atomic operations, which are Feature extraction and similarity computation. Hence, it is of paramount importance to optimize both their design and implementation to achieve the intended scalability. The feature processing operation is expected to output a feature vector, which can be used to compute the similarity between apps in a straightforward manner. The produced vectors will be used as input to the Cypider community detection system. One of the drawbacks of the N-gram technique (Section 4.2) is its very high dimensionality . The computation and the memory needed by Cypider for Android malware detection depend dramatically on the dimension number . Moreover, the complexity of computing the extracted N-grams features increases exponentially with . For example, for the opcodes N-grams, described in Section 4.2, the dimension equals to for bi-grams, where , the number of possible opcodes in Dalvik VM. Similarly, for 3-grams, the dimension ; for 4-grams, . Furthermore, has to be at least 3 or 5 to capture the semantics of some Android APK content.
To reduce the high dimensionality of an arbitrary vector, we leverage the hashing trick technique [10], to output a fixed-size feature vector. More formally, hashing trick reduces a vector with to a compressed version with , where . The compressed vector allows Cypider’s clustering system to handle a large volume of Android apps, which boosts Cypider in terms of both computation and memory. As shown in previous work, [21, 10], the hash kernel approximately preserves the vector distance. Moreover, the hashing technique used to reduce dimensionality affects the computational cost, which linearly increases with the number of samples and groups. Algorithm 1 illustrates the overall process of computing the compacted feature vector from an N-grams set. Furthermore, it helps to control the length of the compressed vector in an associated feature space.
Despite getting a fixed-length vector using the feature hashing technique, the vector size is still significant (size=) to leverage very fast approximate similarity computation [22]. To overcome this issue, one could suggest decreasing the size of the feature hashing vector. However, due to hashing collision, this will drastically reduce the quality of the produced vector [22], which is not useful for malware fingerprinting [23]. Therefore, we resort to dimensionality reduction techniques to compress the feature hashing vectors while keeping the maximum of information. To this end, we aim to reduce the size of the feature hashing vector from to only compressed embedding of size .
To this point, we have a sizeable discrete vector obtained from one of the previous setups, mainly using feature hashing. The aim is to decrease its dimensionality by using dimensionality reduction techniques. To this end, we choose the used PCA (principal component analysis) in the current implementation of feature hashing due to its simplicity. We could also leverage other techniques, and consider the comparison between them regarding information preservation as future work. We apply PCA to choose the top important PCA components which render our digest. We use PCA on the matrix, where rows are the discrete vectors of the samples.
Compressing the feature hashing vector using dimensionality reduction (PCA) will economize the space ( times less memory and disk space) and boost the similarity computation time ( as will be presented in the next sections). However, this raises two concerns, namely portability and computation time. Regarding portability, the question is whether the produced digest for a given sample is reusable. This means that we could compute the digest using a matrix from dataset from epoch and use it to calculate the similarity with another digest generated using a matrix from dataset from epoch . Our experiments confirm the portability of our digest across different datasets’ epochs.
As for the computation concern, we question the scalability of PCA (using SVD implementation) to large datasets since the asymptotic complexity exceeds cubic in the best cases. To solve this issue, we compute the principal components of PCA, using only a fraction of the dataset. Afterward, we employ those components to compress the feature hashing of the dataset. It is essential to mention that the asymptotic complexity is constant for the computation of the components in fixed-size sampled datasets ( records from the input dataset) because of the fixed size. Also, using the computed principal components on the whole input dataset has linear growth with the size of the input dataset; also, it is speedy (matrix multiplication). As such, we employ this technique in all our operations. To this end, we have a set of compressed digests for each content type, i.e., a digest for each malware sample.
6 Similarity Computation
The backbone of Cypider is the similarity network, which is obtained by computing the pair-wise similarity between each feature vector of the apps APKs. Based on the number of these content vectors, we collect multiple similarities, which gives flexibility and modularity to Cypider. Any new feature vector could be added to the similarity network without disturbing the Cypider process. Moreover, the features could be smoothly removed, making the process of selecting the best features more convenient. This is of crucial importance to investigators. Having multiple similarities between apps static contents in the similarity network allows them to make explainable decisions since they can track contents leading to apps similarity in the final similarity network.
It is important to conduct similarity computation in an efficient way that is much faster than brute-force computation. To this end, in the original Cypider design, we leverage Locality Sensitive Hashing (LSH) techniques, in particular LSH Forest [24]. The latter is a tunable high-performance algorithm used in similarity computation of Cypider. In LSH Forest, similar items hashed using LSH are most likely to be in the same bucket (collide) and dissimilar items in different ones. This property of LSH function could be achieved using many similarity measures. In our case, this is achieved using the well-known Euclidean distance.
| (1) |
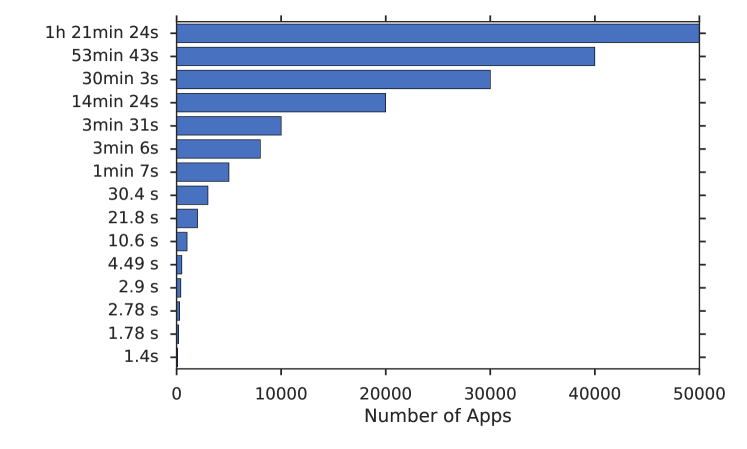
As depicted in Formula 1, after extracting the content feature vectors m and n of one APK content from a given pair of Android apps, we use the Euclidean distance to compute the distance between the two feature vectors m and n. Figure 3 depicts the LSH computational time with respect to the number of apps using one CPU core and one thread for the permission feature vector. It is worth noticing that the current performance using LSH Forest is acceptable even for a large number of daily malware samples (reaching apps per hour). In the enhanced Cypider, these results are drastically improved thanks to using compressed embedding (size=) instead of feature hashing vectors (size=).
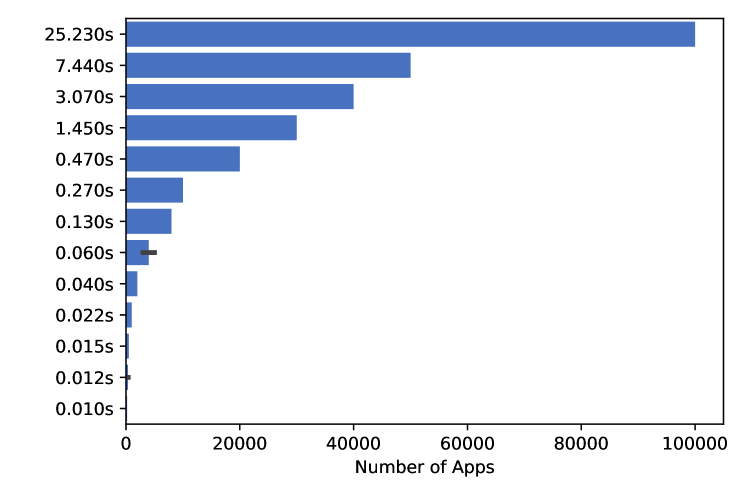
Furthermore, instead of LSH Forest, we could use fuzzy similarity techniques, such as FAISS 333https://github.com/facebookresearch/faiss implementation, which exploits all the CPU cores in addition to multi-threading. Figure 4 presents the new similarity computation time (in seconds) after using the compressed embedding and FAISS library. Cypider is times faster compared to the previous setup on commodity hardware (Intel(R) Xeon(R) CPU E5-2630 v3 @ 2.40GHz). In the previous setup, Cypider took minutes to compute the similarity between apps on the permission content vectors. In contrast, Cypider takes only seconds to compute the similarity in the current setup.
Afterward, we build the similarity connections between the app feature vectors if the pairwise similarity exceeds a certain threshold, named similarity threshold. We propose a systematic mechanism to choose the similarity threshold for different content vectors (opcodes, functions, and binary bytes), which have different search spaces. The process of choosing the threshold is: (1) For a given vector content, we compute the similarity between all the dataset digests. (2) We calculate the average of the similarity values for this content vector. (3) To this point, we use a percentage from the computed average as the threshold. The threshold percentage is fixed and applied to the different averages of content types. Therefore, exploring and searching for a suitable threshold needs only to tune the value of the threshold percentage to fulfill the security practitioner requirements toward the trade-off between purity and coverage.
In summary, the similarity threshold is the percentage of the average similarity of a given content. In other words, we compute the average value of all the pairwise similarities for each feature content. Then, we fix a percentage from this average to be the final threshold. Finally, we use the same percentage of similarity threshold for all the feature contents despite having different average values. The similarity threshold is manually fixed based on our evaluation, and the same threshold is used in all experiments. We investigate the effect of the similarity threshold on Cypider performance in the evaluation section (Section 9). The final result of the similarity computation is a heterogeneous network, where the nodes are the apps, and the edges represent the similarity between apps if it exceeds a certain threshold.
7 Community Detection
A scalable community detection algorithm is essential to extract suspicious communities. As such, we resort to the Fast unfolding community detection algorithm [11], which can scale to billions of network links. The algorithm yields excellent results by measuring the modularity of communities. The latter is a scalar value that measures the density of edges inside a given community compared to the edges between communities. The algorithm uses an approximation of the modularity since finding the exact value is computationally hard [11]. The previous algorithm requires a homogeneous network as input to work properly.
Accordingly, we leverage a majority-voting mechanism to homogenize the heterogeneous network generated by the similarity computation. Given the number of content similarity links , the majority-voting method decides whether a pair of apps are similar or not by computing the ratio , where is the number of all contents used in the current Cypider configuration. If the ratio is above the average, the apps will only have one link in the similarity network. Otherwise, all the links will be removed.
It is important to mention that content similarity links could be kept for later use, such as to conduct thorough investigations about given apps. Investigators could use them, for example, to figure out how similar the apps are, and in which content they are similar. The prior use case could be of great importance to security analysts.
To prevent getting inaccurate suspicious communities, we propose to leverage the majority-voting mechanism by filtering the links that exist between the nodes (apps). More precisely, we filter all links with a degree that is less than a degree filtering parameter. This hyperparameter keeps only edges of a given node whose number is above the threshold. We name this hyperparameter a content threshold and is defined as the minimum number of similar contents needed to keep a link in the final similarity network.
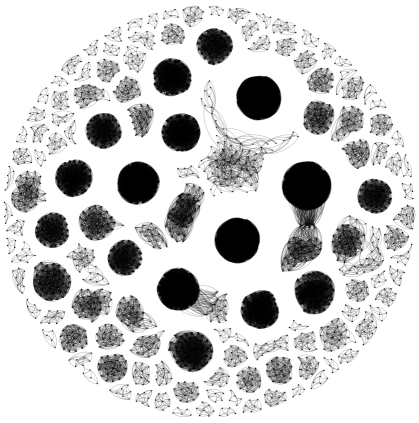
As mentioned above, only nodes with high connectivity maintain their edges, which are supposedly like similar malicious apps. Notice that all the parameters have been fixed in our evaluations. In a mixed dataset scenario, we use the degree to filter all apps having a similarity link to themselves since they are not similar to any other app in the active dataset. Cypider filters these apps and consider them as benign. Cypider also extracts a set of communities with different sizes using the community detection algorithm [11]. Afterward, Cypider filters all communities whose community cardinal is less than the minimum community size parameter (fixed for all the evaluations). As previously mentioned, the purpose of filtration is to discard inaccurate communities. This is illustrated in Figure 1 on a small Android dataset (250 malware apps), where the process of the community detection starts with a homogeneous network and ends up with suspicious communities. The content threshold and community size hyper parameters are thoroughly investigated in the evaluation section (Section 9).
8 Community Fingerprint
In addition to detecting malicious communities, Cypider also aims at generating fingerprints from the extracted communities. This could be done automatically since Cypider tends to be completely unsupervised. Therefore, in the following iteration, Cypider filters the known apps without adding them to the active dataset. In particular, Cypider aims to generate a fuzzy fingerprint, not only for one app but also for the whole malicious community that represents malware family or subfamily. Unfortunately, traditional cryptography fingerprints or fuzzy hashing techniques are not suitable for this purpose. Therefore, we propose a novel fingerprinting technique based on the One-Class Support Vector Machine learning model (OC-SVM) [9]. The latter could be fuzzy enough to be able to detect a set of malicious apps, in particular, the soft boundary model, of a given community. Thanks to the one-class model, Cypider can classify new apps as belonging to a community or not.
It is also important to mention that the signature database generated by Cypider is much more compressed compared to the traditional methods, where the signature is only for one malicious app. Besides, the computation of the signature is highly reduced since we check only with the community fingerprints instead of checking with each single malware hash signature.
Cypider generates a community fingerprint from a set of malicious apps as follows. First, Cypider extracts the features, as presented in Section 4. Afterwards, it trains the one-class model using the statistical features of the malicious community apps. In order to improve the accuracy of the community fingerprint (model), Cypider applies feature selection techniques , as described in the following sub-section.
A large number of Android APK features may potentially impact the accuracy of the generated community fingerprint. To overcome this issue, Cypider only uses the best features with the highest information gains and discards irrelevant ones to reduce the overhead of unnecessary computational complexity. The selection of these valuable features is based on two metrics, namely variance threshold and inverse document frequency (IDF). After computing the variance of the Android apps features, we use a fixed threshold of to filter the features with a variance that is lower than . Notice that a threshold results in discarding all the features with the same value for all Android apps, which makes sense because the information gain from a fixed number for all the community apps is zero.
| (2) |
Furthermore, we compute the inverse document frequency (IDF) on the list , where is the set of Android APK features and is the number of input APKs. The idf(t) is calculated using Formula 2, where is the number of Android APKs having a feature value . Notice that the number 1 in the formula is added to avoid zero-division. The computed is used as an alternative to frequencies, which exhibit less effectiveness in similar solutions.
9 Experimental Results
In this section, we start with an overview of the implementation and testing setup, including the dataset and the performance measurement techniques. Afterward, we present the achieved results regarding the defined metrics for both usage scenarios that are adopted in Cypider framework, namely malware only and mixed datasets.
9.1 Implementation
Cypider is implemented using Python programming language and bash command-line tools. The generation of binary N-grams is performed using xxd tool to convert the content of the package to a sequence of bytes, in addition to a set of command tools such as awk and grep to filter the results. To apply reverse engineering on the Dex byte-code, we use dexdump, a tool that is provided by Android SDK. We filter the generated assembly using the standard Unix tools. To extract the permissions from AndroidManifest.xml, we use aapt, an Android SDK tool, to convert the binary XML to a readable format. Then, we parse the produced XML file using the standard Python XML parsing library. The efficiency of Cypider is evaluated under a commodity hardware server (Intel(R) Xeon(R) CPU E5-2630, 2.6GHz).
9.2 Dataset and Test Setup
In order to evaluate Cypider, three well-known Android datasets are used, namely, (i) MalGenome malware dataset [25] [8], (ii) Drebin malware dataset [13] [14, 26], and AndroZoo public Android app repository. As presented in Table 2, two additional datasets are built based on the previous ones by adding Android apps, which were randomly downloaded from Google Play between late 2014 and beginning of 2015. In order to build Drebin Mixed and AndroZoo Mixed datasets, benign apps are added to the original Drebin dataset, which results is a mixed dataset (malware & benign) with of apps in each category. In the same way, Genome Mixed dataset is built with of benign apps (the mixed dataset will be publicly available for the research community).
| Drebin | Genome | AndroZoo | |
|---|---|---|---|
| Size | 8733 | 4239 | 110k |
| Malware | 4330 | 1168 | 66k |
| Benign | 4403 | 3071 | 44k |
| Families | 46 | 14 | / |
The three datasets mentioned above are used to evaluate Cypider in the unsupervised usage evaluation scenarios and by considering two cases: with and without benign apps, as shown in Section 2.2. First, Cypider is evaluated against malware samples only. To this end, Drebin, AndroZoo, and Genome datasets were used. This use case is the most attractive one in bulk malware analysis since it decreases the cost and detection time of malware by considering only a sample from each detected community. Second, Cypider is evaluated against mixed datasets. The second scenario is more challenging as we might not only get the suspicious communities as output but also benign communities (false positives) are expected along with filtered benign apps.
To asses Cypider obfuscation resiliency, we conduct the evaluation on PRAGuard obfuscation dataset444http://pralab.diee.unica.it/en/AndroidPRAGuardDataset, which contains obfuscated malicious apps, generated using common obfuscation techniques [15]. Besides, we generate benign and malware obfuscated apps using the DroidChameleon obfuscation tool [16], which employs common and combinations of obfuscations techniques.
We define various metrics to measure Cypider performance under each dataset. The used metrics are the following:
Apps Detection Metrics
-
A1:
True Malware: It measures the number of malicious apps that are detected by Cypider. It is applied to both usage evaluation scenarios.
-
A2:
False Malware: It measures the number of benign apps that are falsely detected as malware apps. It is applied only on the mixed dataset as there are no benign apps in the other datasets.
-
A3:
True Benign: It measures the number of filtered benign apps. It is only applied on mixed datasets.
-
A4:
False Benign: It measures the number of malware apps that are incorrectly considered as benign in the mixed dataset.
-
A5:
Detection Coverage: It measures the percentage of detected malware from the overall dataset, i.e., it represents the number of Android apps, which are assigned to communities, divided by the total number of apps in the input dataset.
Community Detection Metrics
-
C1:
Detected Communities: It measures the number of suspicious communities that are extracted by Cypider.
-
C2:
Pure Detected Communities: It measures the number of communities, which only contain instances of the same Android malware family. To check the purity of a given community, we refer to the labels of the used datasets. This metric is applied in both usage evaluation scenarios.
-
C3:
K-Mixed Communities: It measures the number of communities with K-mixed malware families, where is the number of families in a detected community. This metric is applied in both usage evaluation scenarios.
-
C4:
Benign Communities: It measures the number of benign communities that are falsely detected as suspicious. This metric is used in the mixed dataset evaluation.
9.3 Mixed Dataset Results
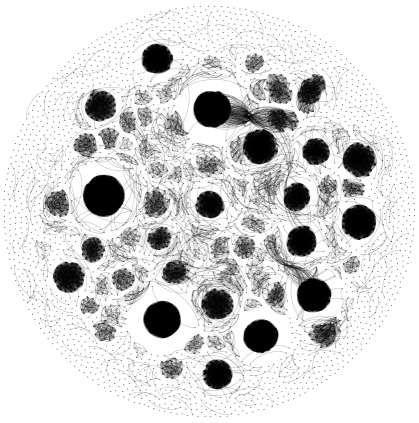
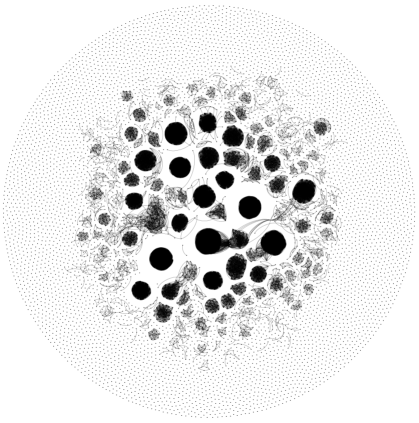
The evaluation results of applying Cypider on Drebin Mixed and Genome Mixed datasets are presented in Table 3. We can notice that Cypider succeeded in detecting half of the actual malware in one single iteration and under both datasets, although the noise of benign apps is about of the actual dataset. Also, Cypider was able to filter out a large number of benign apps from the dataset. However, in both datasets, we got a false malware of and apps under Drebin Mixed and Genome Mixed datasets respectively. We also obtained a false benign of and apps under the two above-mentioned datasets respectively. We can observe that the false positives, and false negatives appear, in most cases, in communities of apps with the same category (malware or benign). Therefore, it is possible to carry out a straightforward investigation by analyzing some samples from a given suspicious community. Figure 7(a) and Figure 7(b) show the similarity network and the generated communities respectively.
| Community Metrics | Drebin Mixed | Genome Mixed |
|---|---|---|
| True Malware A1 | 2413 | 449 |
| False Malware A2 | 190 | 103 |
| True Benign A3 | 257 | 171 |
| False Benign A4 | 38 | 10 |
Table 4 shows the evaluation results of Cypider in terms of community metrics. The main result is that Cypider succeeds in extracting (resp., ) pure detected communities out of (resp., ) in case of Mixed Drebin (resp., Mixed Genome). As a consequence, almost all the detected communities are composed of instances from the same family, whether malware or benign. Even the detected mixed communities are only composed of two labels (2-mixed). It is worth mentioning that all the detected benign communities are pure, i.e., there is no malware instance, which makes the investigation easier for security analysts. Also, according to our analysis, most malware labels in the 2-mixed malicious communities refer to the same malware but with different names, which is due to the naming convention that is made by each security vendor. For example, in one of the 2-mixed communities, we found instances of two types of malware: FakeInstaller and Opfake. These two names refer to the same malware family [27], which is FakeInstaller. Also, we found that FakeInstaller and TrojanSMS.Boxer.AQ refer to the same malware [28], although they have different vendor names.
| Apps Metrics | Drebin Mixed | Genome Mixed |
|---|---|---|
| Detected C1 | 188 | 61 |
| Pure Detected C2 | 179 | 61 |
| 2-Mixed C3 | 9 | 0 |
| Benign C4 | 18 | 16 |
| Community Metrics | Drebin | Genome |
|---|---|---|
| True Malware A1 | 2223 | 449 |
| Apps Metrics | Drebin | Genome |
|---|---|---|
| Detected C1 | 170 | 45 |
| Pure Detected C2 | 161 | 45 |
| 2-Mixed C3 | 9 | 0 |
9.4 Results of Malware-only Datasets
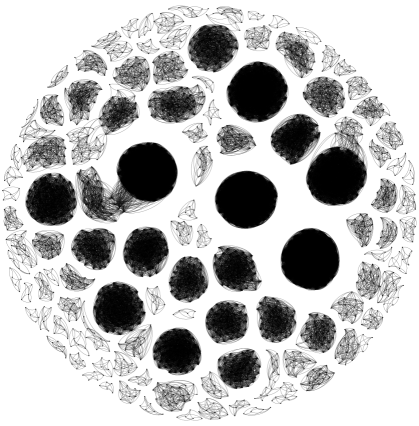
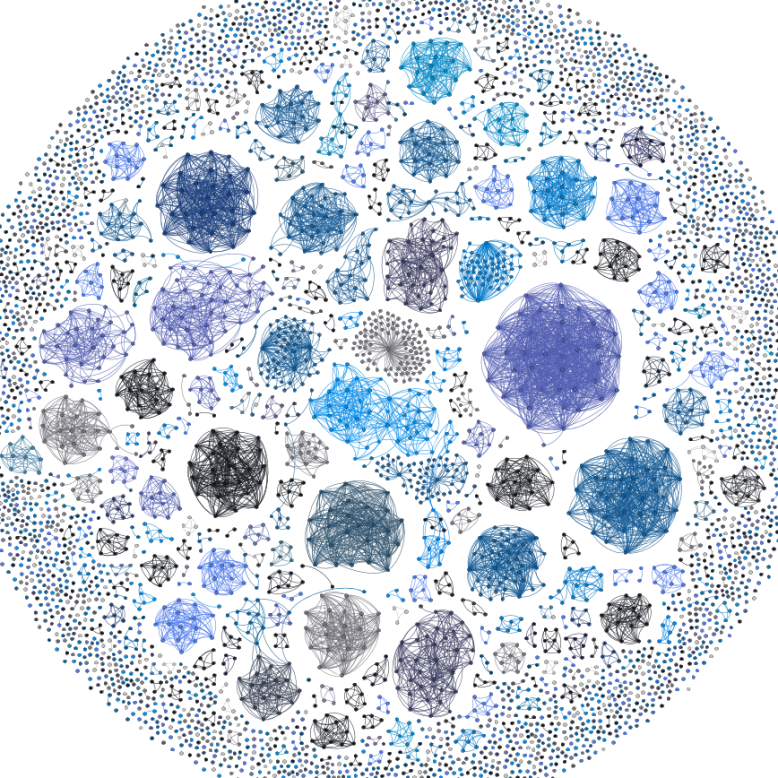
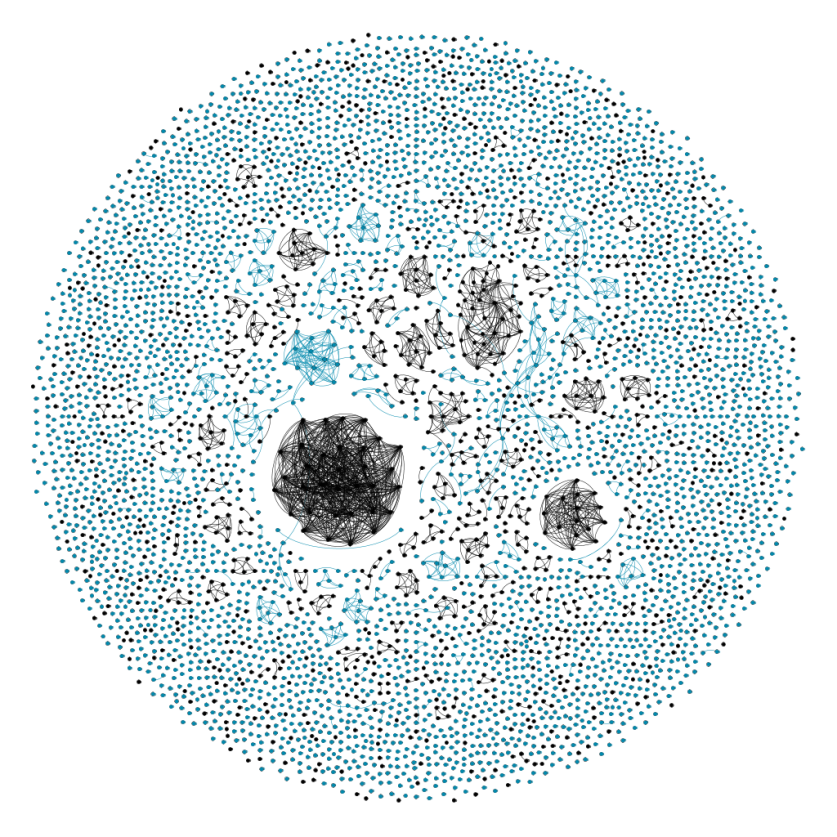
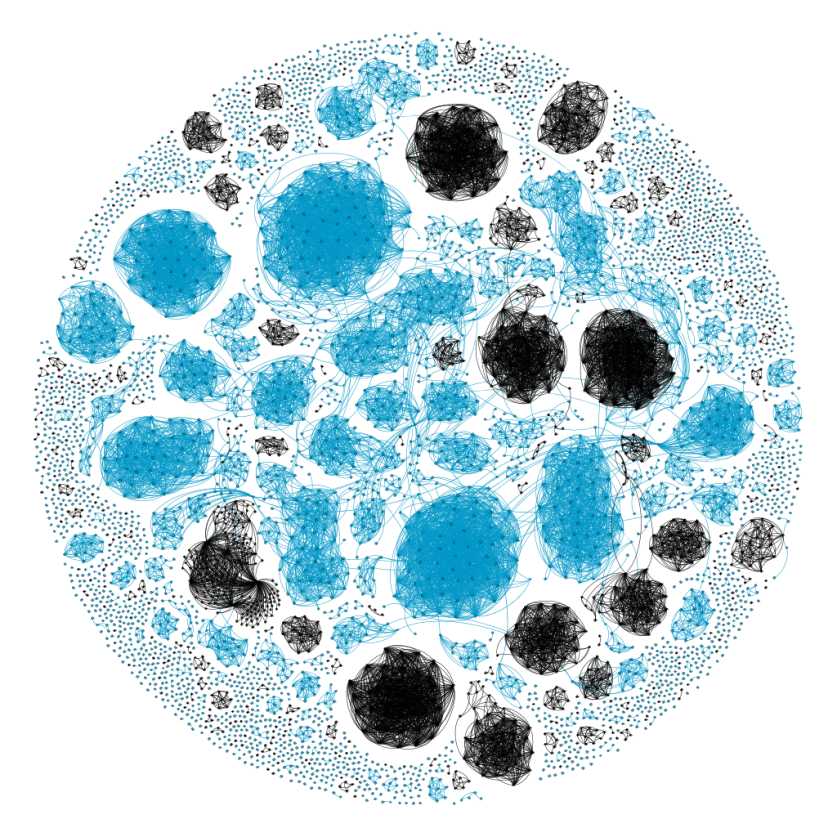
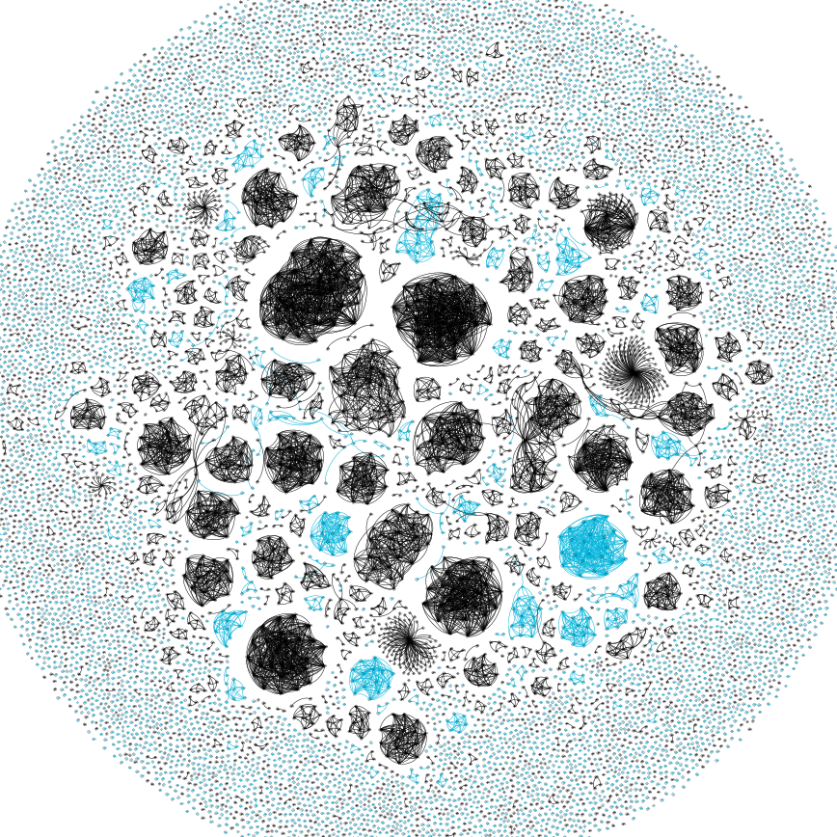
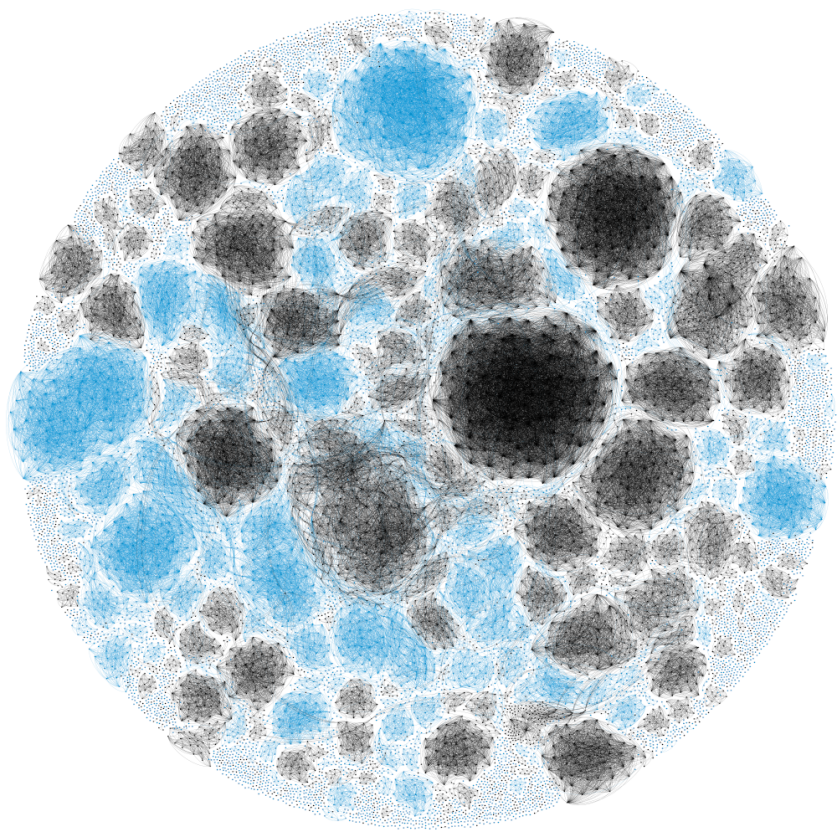
Tables 5 and 6 show the results of Cypider in terms of the app metrics and community metrics, and under malware only datasets. As the mixed dataset is used, i.e., by only filtering out the benign apps, we achieved almost similar results. Cypider succeeds in detecting about of all malware in one iteration. Besides, nearly all the obtained communities are pure. This result shows that Cypider can provide the security analyst with the necessary tool that can analyze the maliciousness of a given suspicious community by only matching one or two samples. Moreover, the analysis process complexity is significantly reduced from detected malware to only found communities. Based on this result, we believe that the analysis window could be reduced, and it is possible to overcome the overwhelming number of detected Android malware daily. We can also observe that nine 2-mixed communities are extracted from the Drebin dataset, which contain malware with different names but refer to the same family, as obtained previously. The similarity network of the Drebin malware dataset is shown in Figure 6(a). After executing the community detection algorithm, a set of malicious communities are identified, as depicted in Figure 6(b).
9.5 Community Fingerprint Results
Table 7 shows the evaluation results for the community fingerprint, which is applied to different detected communities with various Android malware families. The community fingerprint model (One-Class SVM) achieves f1-score in detecting malware from the same malware family that is used in the training phase. In the signature database, these new malware samples share the same family with a given community fingerprint. Furthermore, the compressed format of this fingerprint, i.e., learning model in a binary format, could fingerprint an entire Android family, which results in a far more compacted signature database.
| Family | Community Size | Family Detection (Acc) | Malware (Acc) | Benign (Acc) | General (F1) |
|---|---|---|---|---|---|
| HiddenAds | 1774 | 77.43 | 93.40 | 94.93 | 87.83 |
| BridgeMaster | 1041 | 76.99 | 93.08 | 93.22 | 87.05 |
| InfoStealer | 2973 | 86.60 | 88.37 | 91.26 | 75.50 |
| Plankton | 495 | 77.76 | 100.0 | 100.0 | 75.10 |
| BaseBrigge | 1499 | 76.76 | 88.51 | 92.47 | 73.28 |
| Utchi | 973 | 76.19 | 99.98 | 100.0 | 72.02 |
The performance of the community fingerprint mainly depends on the number of malware in the detected community. A higher detection performance is achieved when more malware instances exist in the community. To achieve this aim, we plan to determine a threshold for the community cardinal, which is required to compute the fingerprint and store it in the signature database.
As shown in Table 7, one of the main characteristics that are provided by the community fingerprint, is its ability to differentiate between general malware apps and benign apps with high accuracy. The reason behind this high accuracy is the high similarity between general malware and the trained family. Notice that the one-class SVM model is trained on samples from only one malware family. In other words, malicious apps tend to have similar features, although they do not belong to the same malware family. Thus, benign samples and general malware are highly dissimilar; hence, benign samples cannot match the community fingerprint.
10 Hyper-parameters Analyses
In this section, we analyze the effect of Cypider hyper-parameters on the overall performance measured using Purity, Coverage, and Community Numbers metrics. Specifically, we investigate the similarity threshold, the content threshold, and the community size, as presented in Section 6 and Section 7.
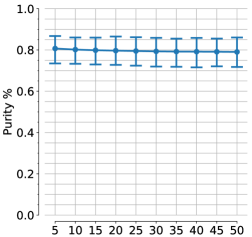
10.1 Purity Analysis
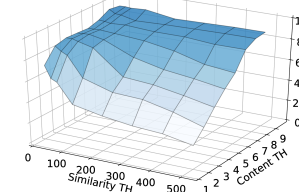
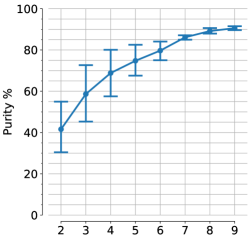
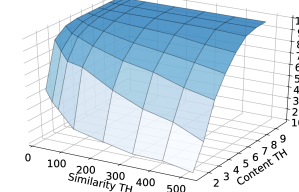
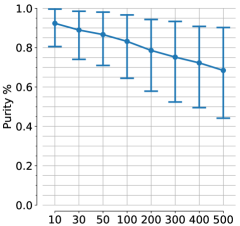
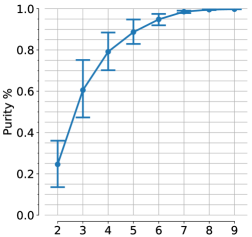
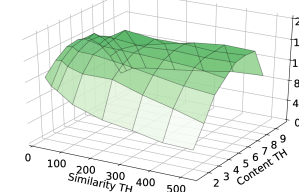
In the purity analysis, we compute the overall percentage of clustered malware samples of the groups belonging to the same Android malware family. A perfect purity metric means that each detected community (cluster) contains samples from the same Android malware family. Figure 8 and 9 show the effect of Cypider hyper-parameters on the purity of the detected malware communities in the similarity network of Drebin and AndroZoo datasets respectively. It is worth noting that the content threshold is the most affecting hyper-parameter on the overall purity. A small content threshold results in a lower purity percentage, as shown in the evaluation of both Drebin and AndroZoo datasets. This finding is intuitive because the outcome of Cypider grouping is more accurate when using more content types threshold in the majority voting similarity computation.
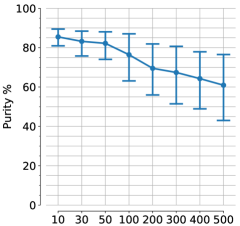
On the other hand, the similarity threshold has a secondary effect compared to the content threshold. This means that a tight distant threshold outputs less false (malware family) samples in the detected communities. Finally, we notice a very minor effect of the community size on the overall purity metric for both Drebin and AndroZoo evaluations, as shown in Figure 8 and Figure 9 respectively.
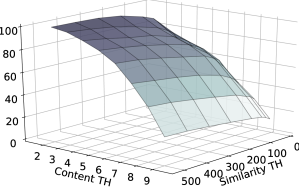
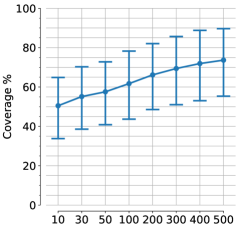
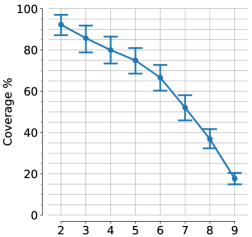
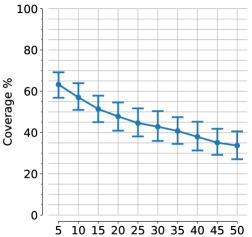
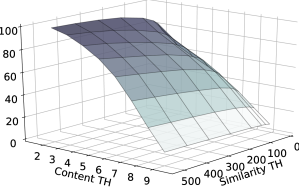
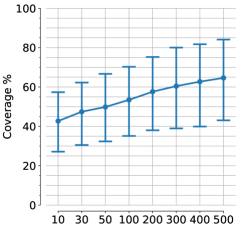
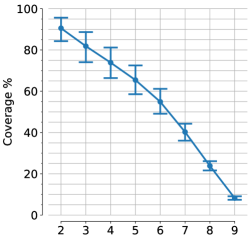
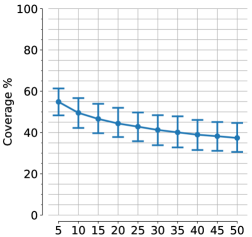
10.2 Coverage Analysis
In the coverage analysis, we assess the percentage of the detected malware from the overall input dataset. A perfect coverage means that Cypider detects the malware samples in the produced malware communities. Figure 10 and Figure 11 depict the change in the coverage percentage with Cypider hyper-parameters for Drebin and AndroZoo datasets respectively. We notice that the content threshold is the most affecting hyper-parameter on the overall coverage metric. This means that a high content threshold in the majority voting (Section 6) detects fewer malware samples in the produced malware communities. Therefore, the coverage metric decreases drastically with a high content threshold, as shown in Figure 10 and Figure 11.
The similarity threshold and the community size have a secondary effect on the coverage metric. For the similarity threshold, a wide distance threshold yields a higher detection rate, and therefore a high coverage metric. For the community size threshold, a large community size threshold ignores many small malware communities, which affects the detection coverage metric negatively.
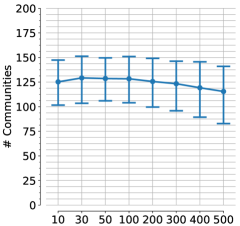
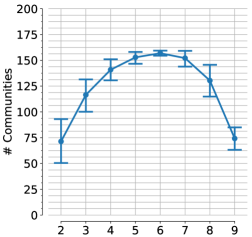
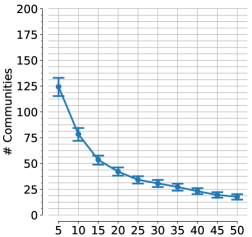
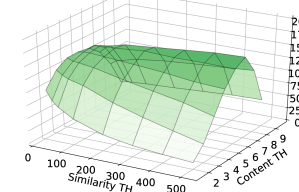
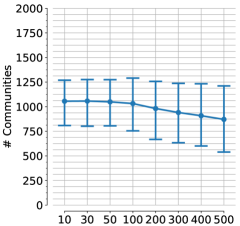
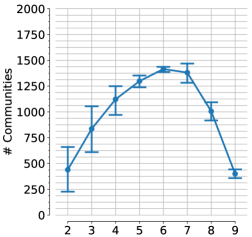
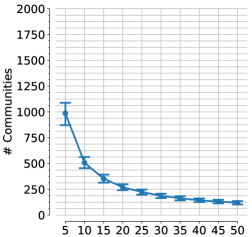
10.3 Number of Communities Analysis
In this section, we analyze the total number of the detected communities produced by Cypider. A perfect Cypider clustering yields a result in which the number of communities is equal to the actual number of malware families in the input dataset. Figure 12 and Figure 13 depict the effect of Cypider hyper-parameters on the number of the detected communities on Drebin and AndroZoo datasets respectively. It is important to mention that the community size has a strong influence on the number of communities. A significant community size threshold will filter many small malware communities, which influences the number of detected communities.
For the content threshold, the majority voting with a small content threshold causes many communities to merge. This is because the samples have to be similar in only two content thresholds to maintain a similarity link in the similarity network. On the other hand, the majority voting with a high content threshold will detect fewer malware samples and, therefore, less overall malicious communities. Finally, we notice a minor effect of the similarity threshold on the overall number of the detected communities, as depicted in Figure 12 and Figure 13 for Drebin and AndroZoo datasets respectively.
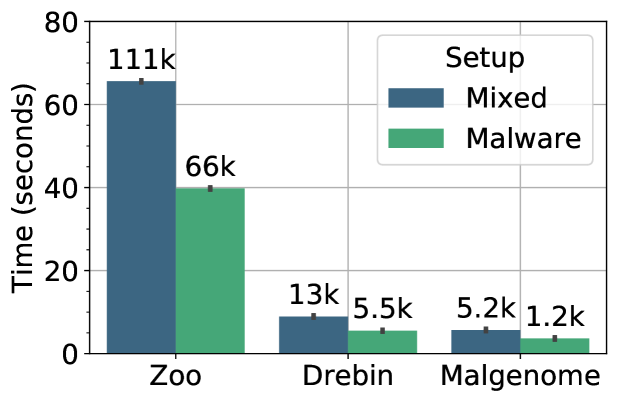
10.4 Efficiency
In this section, we investigate the overall efficiency of Cypider framework. Specifically, we present the runtime in seconds on the core computation of our framework: (i) the similarity computation to build the similarity network, (ii) the community detection to partition the similarity network into a set of malicious communities.
Efficiency Metrics
The following metrics aim to answer the following questions: How much time is needed to build the similarity network? How much time is required to extract malicious communities?
-
•
Similarity Network Building Time: It is the amount of time needed to build the malware similarity network using an approximate similarity computation on the malware FH digests.
-
•
Community Detection Time: It is the amount of time needed to detect and extract malicious communities from the malware similarity network.
-
•
Total Time: It is the sum of the times given by the previous metrics.
Similarity Computation
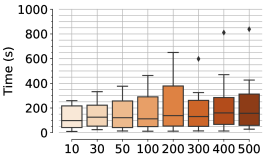
Figure 14 depicts the similarity computation time in seconds to build Cypider similarity network. We notice that Cypider framework is very efficient in producing the similarity network because we employ locality sensitive hashing techniques to speed up the pairwise similarity computation between the feature hashing vectors. For example, Cypider took only few seconds to compute the similarity between samples feature hashing vectors.
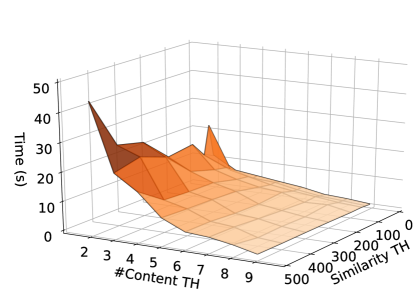
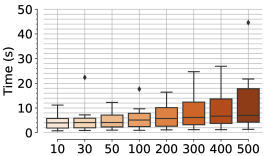
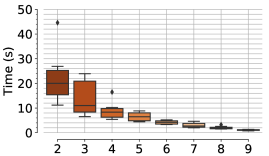
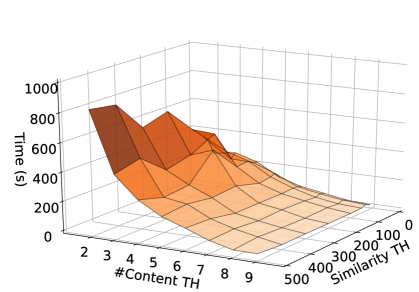
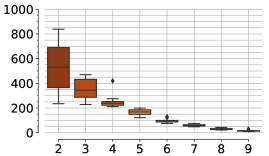
Community Detection
Figures 15 and 16 present the community detection time in seconds on Drebin and AndroZoo datasets respectively. We analyze the effect of similarity and content thresholds on the overall community detection time. In Figures 15 and 16, we notice that Cypider spends more time by decreasing the content threshold and decreasing the similarity threshold in Drebin and AndroZoo experiments. The previous thresholds setup increases the density of Cypider similarity network, and therefore the community detection processing takes more time in the partition process of the network. On the other hand, increasing the content threshold while decreasing the similarity threshold produces a very sparse similarity network. The latter takes a negligible time in the partition process.
11 Case Study: Recall and Precision Settings
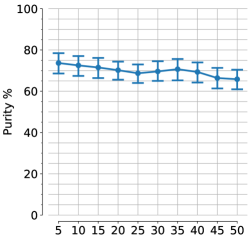
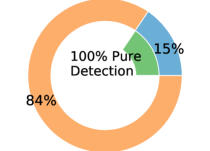
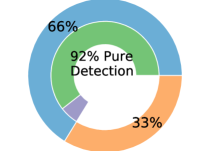
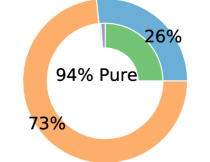
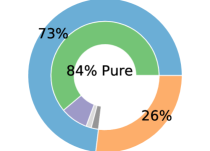
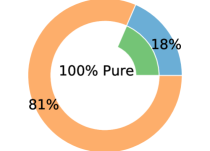
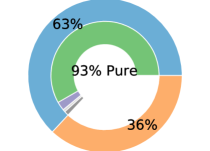
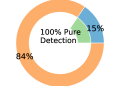
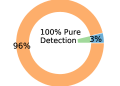
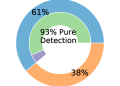
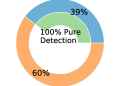
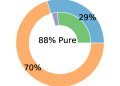
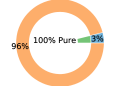
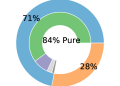
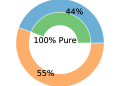
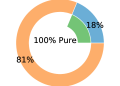
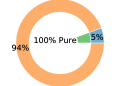
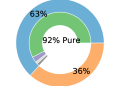
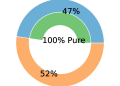
In this section, we evaluate Cypider framework under recall and precision settings. We aim to assess Cypider performance in terms of purity and coverage in case the security practitioner focuses on having: (i) maximum recall (a minimum false detection), or (ii) maximum precision (maximum coverage). Both recall and precision settings are common in real deployments. We achieved the recall and precision settings by adjusting Cypider hyperparameters to reach the set goal. Figure 17 presents Cypider malware only performance on different datasets (MalGenome, Drebin, AndroZoo) under recall and precision settings. In the recall setting, Cypider achieved purity while maintaining malware coverage. Therefore, we detect about (on average) of the input malware in the form of communities with purity (Figure 17, recall charts). On the other hand, Cypider achieved malware coverage while maintaining purity, as shown in Figure 17 (precision charts).
MalGenome Dataset
Drebin Dataset
AndroZoo Dataset
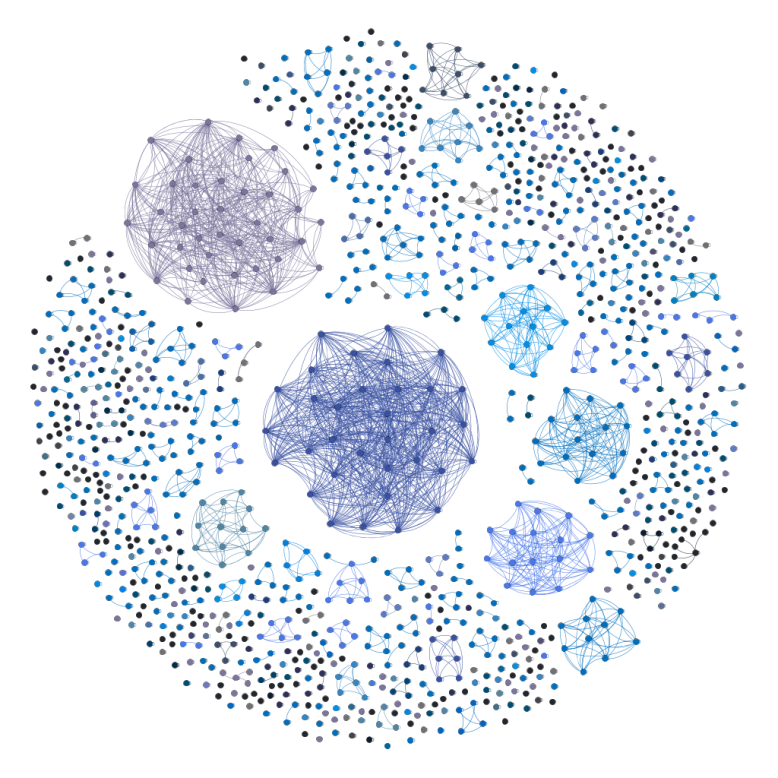
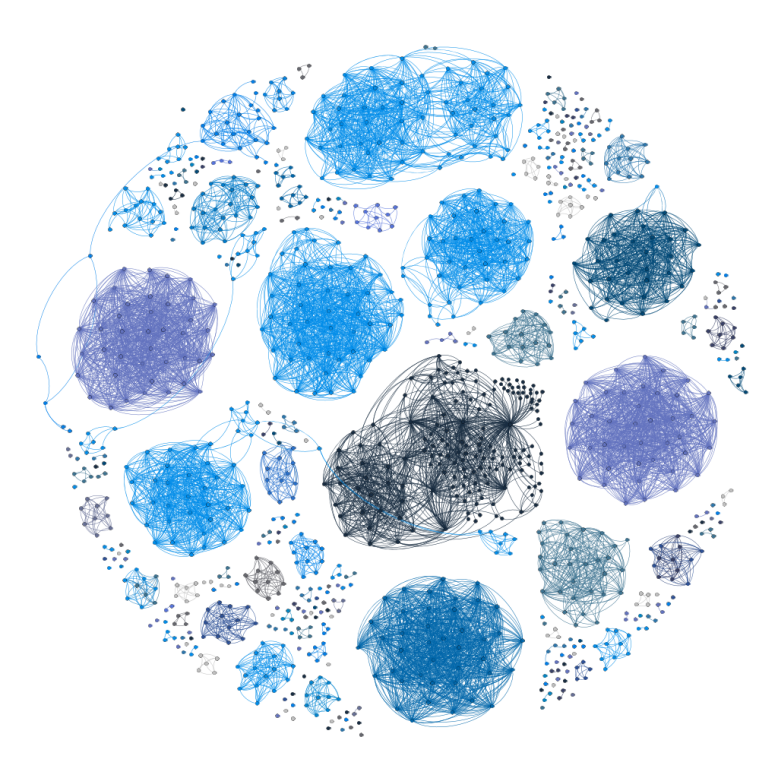
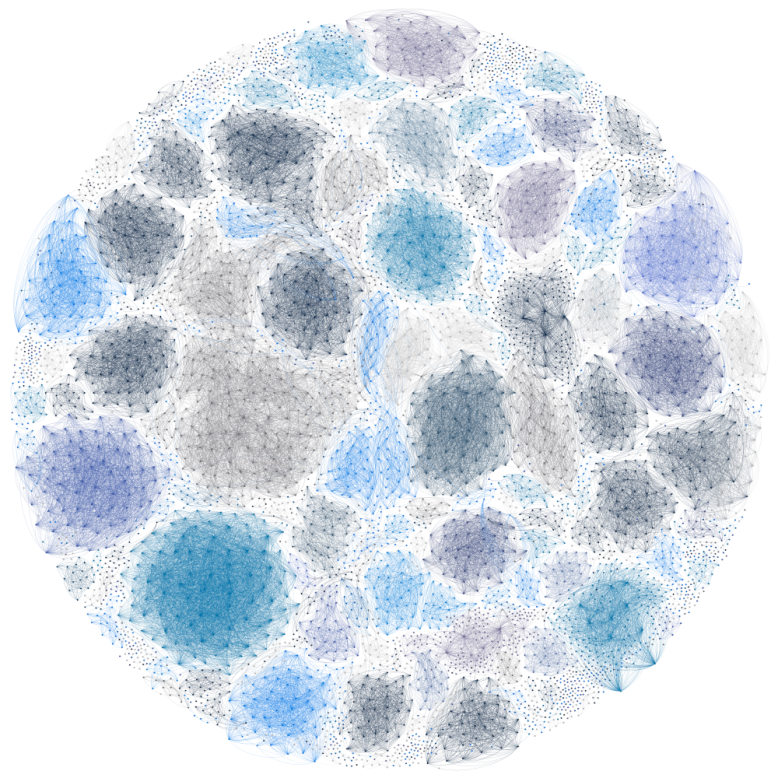
The contrast between the recall and precision settings is more clear visually in the similarity network, as shown in Figures 18 and 19 for MalGenome and Drebin datasets respectively. Figure 18 and Figure 19 present each malware family in a different color. Malware communities depicted with more than one color contain more than one malware family. Pure malware communities have only one color in the edges and nodes. We notice more detected malware communities in the similarity network in the precision settings. In contrast, in the recall similarity network, we notice fewer malware communities, and most of the nodes are part of any not-detected community.
Figure 20 depicts Cypider mixed performance under recall and precision settings for MalGenome, Drebin and AndroZoo datasets. The most noticeable result is that all the detected benign communities have perfect purity metrics under both recall and precision settings. Moreover, benign coverage is less than the malware coverage under all settings. In other words, Cypider could result in benign samples in the clustering but gathered in pure communities, which is very helpful in case of manual investigations.
MalGenome Dataset
Drebin Dataset
AndroZoo Dataset
The difference between recall and precision settings in the mixed scenario is more clear visually in the similarity networks. Figures 21 and 22 show the recall and precision similarity network of MalGenome and Drebin datasets respectively. Darker color communities contain malware samples, and lighter ones contain benign samples. We notice a clear separation between the malicious communities and the benign ones. Also, more and bigger communities have been detected under the precision setting compared to the recall setting. Tables 8 and 9 detail Cypider performance under the recall and the precision settings in terms of coverage/purity and number of detected/pure communities respectively.
| Evaluation Setup | Dataset Size | Coverage/Purity % | ||||||
|---|---|---|---|---|---|---|---|---|
| Dataset | Scenario | Settings | #Benign | #Malware | #Total | |||
| Malgenome | Malware | Recall | / | 1.23k | 1.23k | / | 15.56%/99.0% | 15.56%/99.0% |
| Precision | / | 1.23k | 1.23k | / | 66.21%/91.0% | 66.21%/91.0% | ||
| Mixed | Recall | 4.03k | 1.23k | 5.26k | 3.7%/100.0% | 15.48%/99.0% | 6.46%/100.0% | |
| Precision | 4.03k | 1.23k | 5.26k | 39.66%/100.0% | 61.02%/92.0% | 44.68%/98.0% | ||
| Drebin | Malware | Recall | / | 5.55k | 5.55k | / | 26.69%/93.0% | 26.69%/93.0% |
| Precision | / | 5.55k | 5.55k | / | 73.08%/84.0% | 73.08%/84.0% | ||
| Mixed | Recall | 7.64k | 5.55k | 13.19k | 3.85%/100.0% | 29.77%/88.0% | 14.74%/90.0% | |
| Precision | 7.64k | 5.55k | 13.19k | 44.27%/100.0% | 72.0%/83.0% | 55.93%/91.0% | ||
| AndroZoo | Malware | Recall | / | 66.76k | 66.76k | 0.0%/0.0% | 18.48%/100.0% | 18.48%/100.0% |
| Precision | / | 66.76k | 66.76k | 0.0%/0.0% | 63.03%/92.0% | 63.03%/92.0% | ||
| Mixed | Recall | 44.18k | 66.76k | 110.94k | 5.52%/100.0% | 18.7%/100.0% | 13.45%/100.0% | |
| Precision | 44.18k | 66.76k | 110.94k | 47.63%/100.0% | 63.19%/91.0% | 56.99%/94.0% | ||
| Evaluation Setup | Dataset Size | #Communities/#Pure | ||||||
|---|---|---|---|---|---|---|---|---|
| Dataset | Scenario | Settings | #Benign | #Malware | #Total | Bengin | Malware | Overall |
| Malgenome | Malware | Recall | / | 1.23k | 1.23k | / | 15/15 | 15/15 |
| Precision | / | 1.23k | 1.23k | / | 35/31 | 35/31 | ||
| Mixed | Recall | 4.03k | 1.23k | 5.26k | 18/18 | 17/17 | 35/35 | |
| Precision | 4.03k | 1.23k | 5.26k | 71/71 | 34/31 | 105/102 | ||
| Drebin | Malware | Recall | / | 5.55k | 5.55k | / | 95/89 | 95/89 |
| Precision | / | 5.55k | 5.55k | / | 155/136 | 155/136 | ||
| Mixed | Recall | 7.64k | 5.55k | 13.19k | 30/30 | 109/102 | 139/132 | |
| Precision | 7.64k | 5.55k | 13.19k | 125/125 | 152/132 | 277/257 | ||
| AndroZoo | Malware | Recall | / | 66.76k | 66.76k | / | 800/798 | 800/798 |
| Precision | / | 66.76k | 66.76k | / | 1355/1291 | 1355/1291 | ||
| Mixed | Recall | 44.18k | 66.76k | 110.94k | 176/176 | 828/826 | 1004/1002 | |
| Precision | 44.18k | 66.76k | 110.94k | 586/586 | 1321/1250 | 1907/1836 | ||
12 Case Study: Obfuscation Resiliency Analyses
In this section, we investigate the robustness of Cypider framework against common obfuscation techniques and code transformation in general. We employ PRAGuard obfuscated Android malware, which contains samples, along with benign samples from AndroZoo dataset. Table 10 details Cypider performance on the malware and the mixed scenarios. We compare Cypider performance before and after applying one or a combination of obfuscation techniques, as shown in Table 10.
| Evaluation Setup | Coverage/Purity % | #Communities/#Pure | |||||
|---|---|---|---|---|---|---|---|
| Scenario | Obfuscation | Bengin | Malware | Overall | Bengin | Malware | Overall |
| Malware | Malgenome (Orignal) | / | 66.2%/92.3% | 66.2%/92.3% | / | 35/31 | 17/17 |
| (1) TRIVIAL | / | 60.3%/99.8% | 60.3%/99.8% | / | 34/34 | 35/31 | |
| (2) STRING ENCRYPTION | / | 63.5%/96.7% | 63.5%/96.7% | / | 34/32 | 35/31 | |
| (3) REFLECTION | / | 70.8%/71.9% | 70.8%/71.9% | / | 30/27 | 35/31 | |
| (4) CLASS ENCRYPTION | / | 38.3%/98.5% | 38.3%/98.5% | / | 27/26 | 35/31 | |
| (1) + (2) | / | 52.4%/99.8% | 52.4%/99.8% | / | 42/42 | 35/31 | |
| (1) + (2) + (3) | / | 65.1%/67.5% | 65.1%/67.5% | / | 38/34 | 35/31 | |
| (1) + (2) + (3) + (4) | / | 36.3%/99.7% | 36.3%/99.7% | / | 39/39 | 35/31 | |
| Mixed | Malgenome (Orignal) | 52.84%/100.0% | 45.44%/95.0% | 51.1%/99.0% | 63/63 | 36/32 | 99/95 |
| (1) TRIVIAL | 50.98%/100.0% | 65.72%/90.0% | 54.3%/97.0% | 66/66 | 38/32 | 104/98 | |
| (2) STRING ENCRYPTION | 52.47%/100.0% | 68.41%/93.0% | 56.06%/98.0% | 66/66 | 33/30 | 99/96 | |
| (3) REFLECTION | 51.45%/100.0% | 77.23%/63.0% | 57.21%/89.0% | 65/65 | 29/21 | 94/86 | |
| (4) CLASS ENCRYPTION | 52.84%/100.0% | 45.44%/95.0% | 51.10%/99.0% | 63/63 | 36/32 | 99/95 | |
| (1) + (2) | 52.47%/100.0% | 68.41%/93.0% | 56.06%/98.0% | 66/66 | 33/30 | 99/96 | |
| (1) + (2) + (3) | 53.66%/100.0% | 67.91%/91.0% | 57.01%/97.0% | 64/64 | 34/29 | 98/93 | |
| (1) + (2) + (3) + (4) | 49.04%/100.0% | 44.64%/94.0% | 48.01%/99.0% | 66/66 | 39/37 | 105/103 | |
The evaluation results show that common obfuscation techniques have a limited effect on Cypider performance in general ( coverage and purity). Class encryption obfuscation decreased the coverage from in the non-obfuscated dataset to . However, Class encryption did not affect the purity performance. Similarly, Reflection obfuscation technique dropped down the purity to compared to the original dataset but did not affect the coverage performance. To strengthen our findings (Table 10) on PRAGuard obfuscation dataset, we build our obfuscation dataset using Droid Chameleon obfuscation tool. We obfuscated Drebin malware dataset ( malware samples) and benign samples from AndroZoo dataset ( malware samples). The result is samples ( malware and benign) from different obfuscation settings, as shown in Table 11. Similar to PRAGuard experiment, we compare Cypider performance before obfuscation (original Drebin dataset) and after obfuscation. However, this experiment is different from the PRAGuard one because both benign and malicious samples are obfuscated.
| Evaluation Setup | Coverage/Purity % | #Communities/#Pure | |||||
|---|---|---|---|---|---|---|---|
| Scenario | Obfuscation | Bengin | Malware | Overall | Bengin | Malware | Overall |
| Mixed | Drebin (Original) | 44.27%/100.0% | 72.0%/83.0% | 55.93%/91.0% | 125/125 | 152/132 | 277/257 |
| Class Renaming | 41.71%/100.0% | 72.61%/83.0% | 54.64%/91.0% | 129/129 | 156/135 | 285/264 | |
| Method Renaming | 42.02%/100.0% | 71.08%/83.0% | 54.19%/91.0% | 121/121 | 149/129 | 270/250 | |
| Field Renaming | 43.59%/100.0% | 72.01%/83.0% | 55.49%/91.0% | 128/128 | 148/127 | 276/255 | |
| Code Reordering | 43.43%/100.0% | 71.49%/83.0% | 55.19%/91.0% | 127/127 | 155/135 | 282/262 | |
| Debug Information Removing | 44.34%/100.0% | 72.09%/83.0% | 55.96%/91.0% | 117/117 | 151/130 | 268/247 | |
| Junk Code Insertion | 40.71%/100.0% | 71.81%/83.0% | 53.73%/90.0% | 124/124 | 153/132 | 277/256 | |
| Instruction Insertion | 42.65%/100.0% | 71.25%/83.0% | 54.63%/91.0% | 120/120 | 156/136 | 276/256 | |
| String Encryption | 43.2%/100.0% | 72.16%/83.0% | 55.32%/91.0% | 133/133 | 147/127 | 280/260 | |
| Array Encryption | 43.55%/100.0% | 71.93%/83.0% | 55.42%/91.0% | 125/125 | 152/131 | 277/256 | |
| Malware | Drebin (Original) | / | 73.08%/84.0% | 73.08%/84.0% | / | 155/136 | 155/136 |
| Class Renaming | / | 74.14%/84.0% | 74.14%/84.0% | / | 160/137 | 160/137 | |
| Method Renaming | / | 72.66%/83.0% | 72.66%/83.0% | / | 159/136 | 159/136 | |
| Field Renaming | / | 73.75%/83.0% | 73.75%/83.0% | / | 155/132 | 155/132 | |
| Code Reordering | / | 74.07%/83.0% | 74.07%/83.0% | / | 158/135 | 158/135 | |
| Debug Information Removing | / | 72.92%/83.0% | 72.92%/83.0% | / | 155/132 | 155/132 | |
| Junk Code Insertion | / | 73.86%/83.0% | 73.86%/83.0% | / | 157/135 | 157/135 | |
| Instruction Insertion | / | 73.96%/85.0% | 73.96%/85.0% | / | 160/137 | 160/137 | |
| String Encryption | / | 73.8%/83.0% | 73.8%/83.0% | / | 155/132 | 155/132 | |
| Array Encryption | / | 73.8%/83.0% | 73.8%/83.0% | / | 155/133 | 155/133 | |
Table 11 details the result of Cypider framework on the different obfuscation techniques. The most noticeable result is that the obfuscation techniques provided by the DroidChameleon tool have a limited effect on our clustering framework. All the performance metrics were kept stable on both non obfuscated and obfuscated samples under the malware and mixed scenarios. We argue that Cypider framework is robust to common obfuscation and code transformation techniques because our framework considers many APK contents for feature extraction. Therefore, the obfuscation techniques could affect one APK content, but Cypider could leverage other contents to fingerprint the malware sample and compute the similarity with other malware samples.
13 Discussion
Cypider framework achieves a very good result regarding the percentage of the detected malware and purity of the communities considering the difficulty of the task of malware clustering in general. However, we believe that the detection performance of Cypider could be improved by considering more content vectors. The more static coverage of the APK file is, the more broad and accurate the suspicious communities are. Fortunately, Cypider could easily add new vectors due to the majority-voting mechanism to decide about the similarity. Using only static features leads to the right results. However, including dynamic features in Cypider’s detection process could boost detection since this covers Android malware that downloads and execute the payload at runtime. Cypider with only static features could be a complementary solution to other detection approaches based on dynamic features. As we have noticed in the evaluation results, there are more detected communities than the number of actual malware families. According to our analyses, multiple communities could be part of the same malware family. However, these communities could represent malware family variants. For example, DroidKungFu family is considered as one family in Drebin dataset. However, there are many variants for this family in the Genome dataset such as DroidKungFu1, DroidKungFu2 and DroidKungFu4. Moreover, we notice that some malware instances could have various labels from the vendors. For example, certain instances of FakeInst malware have their community with no connection shared with the rest of the family. After a little investigation using the hashes of the instances, we identified a different label (Adwo), which represents a different malware family. Moreover, the evaluation shows the effectiveness of Cypider in identifying Zero-day malicious apps since the detection was without any prior knowledge of the actual dataset. The unsupervised feature of Cypider framework could make it handy for security practitioners.
The concept of malicious community, proposed by Cypider, could be similar to the malware family concept. However, there are some differences: i) One malware family could be detected in multiple communities of malicious apps. So, the community gives a more granular view of the malicious app similarity based on given statical features. ii) Security practitioners could decide about a given malicious app family using manual analyses. However, the community concept comes from a purely unsupervised automatic analysis. An important feature of Cypider that we can get from detected suspicious communities is the explainability, which facilitates defining what exactly is shared among the apps of a given community. The explainable results are due to the multiple content similarity links between the apps. For example, malware apps sharing the same IP addresses that are hard-coded in the binary are most likely to be part of a Command and Control (C&C) infrastructure and are the sign of a botnet.
Obfuscation is considered a big issue in malware detection systems, including Cypider, where the adversary uses an obfuscated content or transformation attacks. The latter could download the malicious code and execute it at runtime, is undetectable by Cypider unless the malware instances share other covered contents. However, Cypider attempts to deal with obfuscated apps by considering a range of techniques. i) Cypider leverages multiple Android package contents (such as permissions), which allow the system to be more robust against obfuscation since it also uses other un-obfuscated contents. ii) In the case of Dex disassembly, Cypider uses instruction opcode instead of the whole instruction to compute the N-grams. Therefore, the latter would be more resilient to obfuscation in the instruction operands. The previous techniques show their effectiveness in the evaluation since we used a real malware dataset in addition to apps from Google play (where the apps are supposedly obfuscated through ProGuard) and obfuscated malware datasets (PRAGuard and DroidChameleon). Besides, Cypider framework could be complementary to dynamic analysis solutions to achieve better results.
14 Related Work
Previous work on Android analysis can be classified with respect to the analysis task as follows:
-
•
Malware detection The objective is to check if a unknown app is malicious or not. They mostly apply supervised learning approaches. The learning model is generated during a training phase and using labeled samples. In the testing phase, the learning model aims to identify if the analyzed sample is malware or benign.
-
•
Malware family attribution: Given a set of known families, the objective of this task is to attribute an unknown sample to a known family.
-
•
Similarity-based detection: The objective of this task is to find similarities among different apps without knowing any information about their types, i.e., benign or malware, or their families in case they are malware.
14.1 Malware detection
The Android malware detection methods focus on identifying whether the analyzed app is benign or malicious. They use three type of features: static, dynamic, and hybrid. The static methods [14, 20, 29, 30, 31, 32, 33, 34, 35, 36, 37, 38, 39, 40, 41, 42] depend on static features, which are extracted from the Apk file such as requested permissions, APIs, bytecodes, opcodes. The dynamic methods [43, 44, 45, 46, 47, 48, 49, 50, 51, 52, 53] use features that are derived from the app’s execution. They are more resilient to obfuscations than static analysis methods. However, they incur additional cost in terms of processing and memory to run the app. The hybrid methods [26, 54, 55, 56, 57, 58, 59, 60, 61, 62, 63, 64] use both static and dynamic features. In the case of Win32 malware detection, some static analysis [65, 66], dynamic analysis [67, 68, 69, 70, 71, 41, 72], and hybrid methods [73] have been proposed.
14.2 Malware family attribution
Malware family attribution methods [74, 18, 75, 76, 77, 78, 79, 80, 81] focus on detecting variants of known families. In case of Win32 malware family attribution, the methods are classified as static [82], dynamic [83], and hybrid [84]. Other methods combine between malware detection and family attribution in case of Android OS [85, 86, 87, 88] and Win32 OS [89, 90]
14.3 Similarity-based detection
Similarity-based detection methods [91, 92, 93, 94, 95, 96] focus on detecting repackaged malware. They adopt the unsupervised learning approach, i,e, they do not require training phase and they are directly applied on unlabeled samples. They assume that two or multiple apps that share the same code are likely to belong to the same family. Thus, they check if the apps are using the same malicious code (i.e., detection of malware families), or they are reusing the code of the same original app (i.e., code reuse detection). Table 12 summarizes the similarity-based detection methods with respect to (1) extracted feature, (2) similarity algorithm, (3) dataset size, (4) obtained findings from applying the method on the dataset, and (5) efficiency in terms of running time of the similarity algorithm.
DroidMOSS [93] aims to detect repackaged apps from the Android Market, which are redistributed to third-party marketplaces. It first applies a fuzzy hashing technique on the opcode of each app collected from the markets to generate the fingerprint of that app. Then, it measures the similarity between each app in the third-market and all the apps in the official Android market using the Edit distance.
Zhou et al. [95] proposed PiggyApp to detect piggybacked apps, which share the same primary module as the original app. It builds for each primary module its program dependency graph (PDG), and generates its semantic feature vector. To detect similar vectors, it uses a linearithmic search algorithm, which incurs time complexity of , where is the number of apps. AnDarwin [96, 97] uses program dependency graph to extract a semantic vectors from each app. AnDarwin finds similar code segments that are among all the semantic vectors of apps using Locality Sensitive Hashing (LSH).
DNADroid [94] computes the similarity between two apps by comparing their program dependency graphs. It then applies subgraph isomorphism to find a mapping between nodes of two PDGs. MassVet [91] is designed for vetting apps at a massive scale, without knowing what malware looks like and how it behaves. It compares a submitted app with all apps already on the market by focusing on the difference between those sharing a similar GUI structure, which is known to be largely preserved during repackaging. Similarly, DroidEagle [92] uses the layout resources within an app to detect repackaged apps and phishing malware apps which are visually similar to the original app. It generates a layout tree from each app, and uses the Layout Edit Distance (LED) to measure the similarity among apps.
Cypider aims to identify community of malware, which represent malware that are similar with respect to any set of features, which is different from the family concept that groups similar samples according to a predefined set of features. The fundamental idea of Cypider relies on building a similarity network between the input apps. The app is represented as a vector of contents. If one content is shared between a pair of apps, an edge is established between the two apps. The result is a similarity network, where the nodes are Android apps and the edges represent the high similarity with respect to one content between the apps.
| Method | Feature | Similarity algorithm | Dataset size | Findings | Efficiency |
| DroidMOSS [93] | Opcode | Edit distance | N/A | 5% to 13% repackaged apps | |
| PiggyApp [95] | PDG | linearithmic search algorithm | N/A | 0.97% to 2.7% repackaged apps | |
| Andarwin [96, 97] | PDG | LSH | 265359 | 4295 cloned and 36106 rebranded | |
| DNADroid [94] | PDG | Subgraph isomorphism | 75,000 | 141 cloned apps | |
| MassVet [91] | GUI | DiffCom | 1.2 million | 127429 malicious | 10 sec/app |
| DroidEagle [92] | GUI | LED | 99626 | 1298 | 3 hours |
| Cypider | APK features | similarity network | 110k | coverage | about 60 sec |
| precision in the | |||||
| detected malicious communities |
15 Conclusion
In this paper, we design and implement a novel, efficient, and scalable framework for Android malware detection, namely, Cypider. The detection mechanism relies on the community concept. Cypider consists of a systematic framework that can generate a fingerprint for each community and identify known and unknown malicious communities. Cypider has been implemented and evaluated on different malicious and mixed datasets. Our findings show that Cypider is a valuable and promising approach for detecting application similarity and malicious communities in Android applications. Cypider needs only few seconds to build a network similarity of a large number of apps, and incurs about 60 seconds to perform community detection for apps. The results of the community fingerprint are auspicious as of the detection is achieved.
References
- [1] “Android operating system - https://www.android.com/,” Accessed on January 2019.
- [2] “Mobile Os market share - http://gs.statcounter.com/os-market-share/mobile/worldwide.” http://gs.statcounter.com/os-market-share/mobile/worldwide, Accessed on February 2019.
- [3] “Android TV - https://www.android.com/tv/,” Accessed on May 2016.
- [4] “Android Wear Operating System - https://www.android.com/wear/,” Accessed on March 2016.
- [5] “Android Auto - https://www.android.com/auto/,” Accessed on April 2016.
- [6] “Android Things operating system - https://developer.android.com/things,” Accessed on March 2020.
- [7] “Cyber attacks on Android devices on the rise - https://www.gdatasoftware.com/news/2019/07/35228-mobile-malware-report-no-let-up-with-android-malware,” Accessed on August 2019.
- [8] Y. Zhou and X. Jiang, “Dissecting android malware: Characterization and evolution,” in IEEE Symposium on Security and Privacy, SP 2012, 21-23 May 2012, San Francisco, California, USA, pp. 95–109, 2012.
- [9] B. Schölkopf, J. C. Platt, J. Shawe-Taylor, a. J. Smola, and R. C. Williamson, “Estimating the support of a high-dimensional distribution.,” Neural computation, vol. 13, no. 7, pp. 1443–1471, 2001.
- [10] Q. Shi, J. Petterson, G. Dror, J. Langford, A. J. Smola, and S. V. N. Vishwanathan, “Hash Kernels for Structured Data,” in Journal of Machine Learning Research, vol. 10, pp. 2615–2637, 2009.
- [11] V. D. Blondel, J.-L. Guillaume, R. Lambiotte, and E. Lefebvre, “Fast unfolding of communities in large networks,” J. Stat. Mech. Theory Exp., 2008.
- [12] E. B. Karbab, M. Debbabi, A. Derhab, and D. Mouheb, “Cypider: Building Community-Based Cyber-Defense Infrastructure for Android Malware Detection,” in ACM Computer Security Applications Conference (ACSAC), 2016.
- [13] “Drebin Android Malware Dataset - https://user.informatik.uni-goettingen.de/~darp/drebin/,” Accessed on January 2015.
- [14] D. Arp, M. Spreitzenbarth, H. Malte, H. Gascon, K. Rieck, M. Hubner, H. Gascon, K. Rieck, K. Riec, H. Malte, H. Gascon, K. Rieck, M. Hubner, H. Gascon, K. Rieck, Al., K. Rieck, M. Hubner, H. Gascon, and K. Rieck, “DREBIN: Effective and Explainable Detection of Android Malware in Your Pocket.,” in Symp. Netw. Distrib. Syst. Secur., pp. 23–26, The Internet Society, 2014.
- [15] D. Maiorca, D. Ariu, I. Corona, M. Aresu, and G. Giacinto, “Stealth attacks: An extended insight into the obfuscation effects on Android malware,” Computers & Security, vol. 51, pp. 16–31, 2015.
- [16] V. Rastogi, Y. Chen, and X. Jiang, “DroidChameleon: evaluating Android anti-malware against transformation attacks,” in ACM Symposium on Information, Computer and Communications Security (ASIACCS), no. March in ASIA CCS ’13, (New York, NY, USA), pp. 329–334, ACM, 2013.
- [17] “The Android Native Development Kit (NDK) - https://developer.android.com/ndk/index.html,” Accessed on January 2016.
- [18] L. Deshotels, V. Notani, and A. Lakhotia, “Droidlegacy: Automated familial classification of android malware,” in Proceedings of ACM SIGPLAN on Program Protection and Reverse Engineering Workshop 2014, PPREW’14, p. 3, 2014.
- [19] H. C. Wu, R. W. P. Luk, K. Wong, and K. Kwok, “Interpreting TF-IDF term weights as making relevance decisions,” ACM Trans. Inf. Syst., vol. 26, no. 3, pp. 13:1–13:37, 2008.
- [20] E. B. Karbab, M. Debbabi, and D. Mouheb, “Fingerprinting Android packaging: Generating DNAs for malware detection,” Digital Investigation, 2016.
- [21] K. Weinberger, A. Dasgupta, J. Attenberg, J. Langford, and A. Smola, “Feature Hashing for Large Scale Multitask Learning,” Annual International Conference on Machine Learning (ICML), pp. (pp. 1113——–1120)., 2009.
- [22] A. Andoni, P. Indyk, T. Laarhoven, I. Razenshteyn, and L. Schmidt, “Practical and Optimal LSH for Angular Distance,” in Advances in Neural Information Processing Systems 28 (C. Cortes, N. D. Lawrence, D. D. Lee, M. Sugiyama, and R. Garnett, eds.), pp. 1225–1233, Curran Associates, Inc., 2015.
- [23] X. Hu, S. Bhatkar, K. Griffin, and K. G. Shin, “MutantX-S: Scalable Malware Clustering Based on Static Features,” Proceedings of the 2013 USENIX Annual Technical Conference, pp. 187–198, 2013.
- [24] M. Bawa, T. Condie, and P. Ganesan, “LSH forest: self-tuning indexes for similarity search,” Proc. 14th Int. Conf. World Wide Web - WWW ’05, p. 651, 2005.
- [25] “Android Malware Genome Project - http://www.malgenomeproject.org/,” Accessed on January 2015.
- [26] M. Spreitzenbarth, F. C. Freiling, F. Echtler, Al., T. Schreck, and J. Hoffmann, “Mobile-sandbox: having a deeper look into android applications,” in Proceedings of the 28th Annual ACM Symposium on Applied Computing, SAC ’13, pp. 1808–1815, ACM, 2013.
- [27] “Andr/OpFake-U malware family - https://www.sophos.com/en-us/threat-center/threat-analyses/viruses-and-spyware/Andr~OpFake-U.aspx,” Accessed on February 2016.
- [28] “Andr/Boxer-C malware family - https://www.sophos.com/en-us/threat-center/threat-analyses/viruses-and-spyware/Andr~Boxer-C.aspx,” Accessed on May 2016.
- [29] Y. Feng, S. Anand, I. Dillig, A. Aiken, Al., I. Dillig, A. Aiken, and Al., “Apposcopy: Semantics-based detection of android malware through static analysis,” in Proceedings of the 22nd ACM International Symposium on Foundations of Software Engineering, FSE 2014, pp. 576–587, ACM, 2014.
- [30] W. Yang, J. Li, Y. Zhang, Y. Li, J. Shu, D. Gu, Al., Y. Li, J. Shu, and D. Gu, “APKLancet: tumor payload diagnosis and purification for android applications,” in Proceedings of the 9th ACM symposium on Information, computer and communications security, ASIA CCS ’14, pp. 483–494, 2014.
- [31] Y. Zhongyang, Z. Xin, B. Mao, L. Xie, Al., B. Mao, and L. Xie, “DroidAlarm: an all-sided static analysis tool for Android privilege-escalation malware,” in Proceedings of the 8th ACM SIGSAC symposium on Information, computer and communications security, ASIA CCS ’13, pp. 353–358, 2013.
- [32] B. Sanz, I. Santos, Al., X. Ugarte-Pedrero, C. Laorden, J. Nieves, P. G. Bringas, and Al., “Anomaly detection using string analysis for android malware detection,” in International Joint Conference SOCO’13-CISIS’13-ICEUTE’13, pp. 469–478, Springer, 2014.
- [33] T. Kim, B. Kang, M. Rho, S. Sezer, and E. G. Im, “A multimodal deep learning method for android malware detection using various features,” IEEE Transactions on Information Forensics and Security, vol. 14, no. 3, pp. 773–788, 2018.
- [34] L. Onwuzurike, E. Mariconti, P. Andriotis, E. D. Cristofaro, G. Ross, and G. Stringhini, “Mamadroid: Detecting android malware by building markov chains of behavioral models (extended version),” ACM Transactions on Privacy and Security (TOPS), vol. 22, no. 2, p. 14, 2019.
- [35] K. Xu, Y. Li, R. H. Deng, and K. Chen, “Deeprefiner: Multi-layer android malware detection system applying deep neural networks,” in 2018 IEEE European Symposium on Security and Privacy (EuroS&P), pp. 473–487, IEEE, 2018.
- [36] K. Xu, Y. Li, R. Deng, K. Chen, and J. Xu, “Droidevolver: Self-evolving android malware detection system,” in 2019 IEEE European Symposium on Security and Privacy (EuroS&P), pp. 47–62, IEEE, 2019.
- [37] J. Allen, M. Landen, S. Chaba, Y. Ji, S. P. H. Chung, and W. Lee, “Improving accuracy of android malware detection with lightweight contextual awareness,” in Proceedings of the 34th Annual Computer Security Applications Conference, pp. 210–221, ACM, 2018.
- [38] K. O. Elish, X. Shu, D. D. Yao, B. G. Ryder, and X. Jiang, “Profiling user-trigger dependence for android malware detection,” Computers & Security, vol. 49, pp. 255–273, 2015.
- [39] F. Idrees, M. Rajarajan, M. Conti, T. M. Chen, and Y. Rahulamathavan, “Pindroid: A novel android malware detection system using ensemble learning methods,” Computers & Security, vol. 68, pp. 36–46, 2017.
- [40] E. B. Karbab, M. Debbabi, A. Derhab, and D. Mouheb, “Android Malware Detection using Deep Learning on API Method Sequences,” CoRR, 2017.
- [41] P. Burnap, R. French, F. Turner, and K. Jones, “Malware classification using self organising feature maps and machine activity data,” computers & security, vol. 73, pp. 399–410, 2018.
- [42] S. Badhani and S. K. Muttoo, “Cendroid—a cluster-ensemble classifier for detecting malicious android applications,” Computers & Security, vol. 85, pp. 25–40, 2019.
- [43] G. Canfora, E. Medvet, Al., F. Mercaldo, C. A. Visaggio, Al., F. Mercaldo, and C. A. Visaggio, “Acquiring and Analyzing App Metrics for Effective Mobile Malware Detection,” in Proc. 2016 ACM Int. Work. Secur. Priv. Anal., no. March in IWSPA ’16, pp. 50–57, ACM, 2016.
- [44] E. B. Karbab, M. Debbabi, S. Alrabaee, and D. Mouheb, “DySign: Dynamic fingerprinting for the automatic detection of android malware,” International Conference on Malicious and Unwanted Software (MALWARE), 2017.
- [45] E. B. Karbab, M. Debbabi, S. Alrabaee, and D. Mouheb, “Dysign: Dynamic fingerprinting for the automatic detection of android malware,” CoRR, vol. abs/1702.05699, 2017.
- [46] A. Ali-Gombe, I. Ahmed, G. G. Richard III, V. Roussev, Al, I. Ahmed, G. G. Richard III, V. Roussev, and Al, “AspectDroid: Android App Analysis System,” in ACM Conference on Data and Application Security and Privacy, CODASPY ’16, (New York, NY, USA), pp. 145–147, ACM, ACM, 2016.
- [47] Y. Zhang, M. Yang, B. Xu, Z. Yang, Al., G. Gu, P. Ning, X. S. Wang, and B. Zang, “Vetting undesirable behaviors in android apps with permission use analysis,” in ACM SIGSAC Conf. Comput. Commun. Secur., CCS ’13, pp. 611–622, ACM, 2013.
- [48] B. Amos, Al, H. Turner, J. White, and Al, “Applying machine learning classifiers to dynamic android malware detection at scale,” in Wirel. Commun. Mob. Comput. Conf., pp. 1666–1671, IEEE, 2013.
- [49] T.-E. E. Wei, C.-H. H. Mao, A. B. Jeng, H.-M. M. Lee, H.-T. T. Wang, and D.-J. J. Wu, “Android malware detection via a latent network behavior analysis,” in Trust, Security and Privacy in Computing and Communications (TrustCom), pp. 1251–1258, IEEE, 2012.
- [50] J. Huang, X. Zhang, L. Tan, P. Wang, B. Liang, Al., L. Tan, P. Wang, B. Liang, Al., L. Tan, P. Wang, and B. Liang, “AsDroid: Detecting stealthy behaviors in android applications by user interface and program behavior contradiction,” in Proceedings of the 36th International Conference on Software Engineering, pp. 1036–1046, ACM, 2014.
- [51] A. Saracino, D. Sgandurra, G. Dini, and F. Martinelli, “Madam: Effective and efficient behavior-based android malware detection and prevention,” IEEE Transactions on Dependable and Secure Computing, vol. 15, no. 1, pp. 83–97, 2016.
- [52] E. B. Karbab and M. Debbabi, “Maldy: Portable, data-driven malware detection using natural language processing and machine learning techniques on behavioral analysis reports,” Digital Investigation, vol. 28, no. Supplement, pp. S77–S87, 2019.
- [53] E. B. Karbab and M. Debbabi, “Portable, data-driven malware detection using language processing and machine learning techniques on behavioral analysis reports,” CoRR, vol. abs/1812.10327, 2018.
- [54] M. C. Grace, Y. Zhou, Q. Zhang, S. Zou, X. Jiang, Al., Q. Zhang, S. Zou, and X. Jiang, “Riskranker: scalable and accurate zero-day android malware detection,” in Proceedings of the 10th international conference on Mobile systems, applications, and services, MobiSys ’12, pp. 281–294, ACM, ACM, 2012.
- [55] M. Lindorfer, M. Neugschwandtner, L. Weichselbaum, Y. Fratantonio, V. van der Veen, and C. Platzer, “ANDRUBIS - 1, 000, 000 apps later: A view on current android malware behaviors,” in Third International Workshop on Building Analysis Datasets and Gathering Experience Returns for Security, BADGERS@ESORICS 2014, Wroclaw, Poland, September 11, 2014, pp. 3–17, 2014.
- [56] S. Bhandari, R. Gupta, Al., V. Laxmi, M. S. Gaur, A. Zemmari, M. Anikeev, Al., V. Laxmi, M. S. Gaur, A. Zemmari, and M. Anikeev, “DRACO: DRoid analyst combo an android malware analysis framework,” in Proc. 8th Int. Conf. Secur. Inf. Networks, pp. 283–289, ACM, 2015.
- [57] T. Vidas, J. Tan, J. Nahata, C. L. Tan, N. Christin, P. Tague, Al., C. L. Tan, N. Christin, P. Tague, and Al., “A5: Automated analysis of adversarial android applications,” in ACM Work. Secur. Priv. Smartphones Mob. Devices, pp. 39–50, 2014.
- [58] Y. Zhou, Z. Wang, W. Zhou, and X. Jiang, “Hey, you, get off of my market: Detecting malicious apps in official and alternative android markets,” in 19th Annual Network and Distributed System Security Symposium, NDSS 2012, San Diego, California, USA, February 5-8, 2012, 2012.
- [59] M. Zhang, Al., Y. Duan, H. Yin, and Z. Zhao, “Semantics-Aware Android Malware Classification Using Weighted Contextual API Dependency Graphs,” in Proceedings of the 2014 ACM SIGSAC Conference on Computer and Communications Security, CCS ’14, (New York, NY, USA), pp. 1105–1116, ACM, ACM, 2014.
- [60] F. Martinelli, F. Mercaldo, and A. Saracino, “Bridemaid: An hybrid tool for accurate detection of android malware,” in Proceedings of the 2017 ACM on Asia Conference on Computer and Communications Security, pp. 899–901, ACM, 2017.
- [61] J.-w. Jang, H. Kang, J. Woo, A. Mohaisen, and H. K. Kim, “Andro-dumpsys: anti-malware system based on the similarity of malware creator and malware centric information,” computers & security, vol. 58, pp. 125–138, 2016.
- [62] E. B. Karbab and M. Debbabi, “ToGather: Automatic Investigation of Android Malware Cyber-Infrastructures,” in International Conference on Availability, Reliability and Security, (ARES), 2018.
- [63] E. B. Karbab and M. Debbabi, “Automatic Investigation Framework for Android Malware Cyber-Infrastructures,” CoRR, 2018.
- [64] A. I. Ali-Gombe, B. Saltaformaggio, D. Xu, G. G. Richard III, et al., “Toward a more dependable hybrid analysis of android malware using aspect-oriented programming,” computers & security, vol. 73, pp. 235–248, 2018.
- [65] G. Sun and Q. Qian, “Deep Learning and Visualization for Identifying Malware Families,” IEEE Transactions on Dependable and Secure Computing (TDSC), 2018.
- [66] A. Sharma, P. Malacaria, and M. Khouzani, “Malware detection using 1-dimensional convolutional neural networks,” in 2019 IEEE European Symposium on Security and Privacy Workshops (EuroS&PW), pp. 247–256, IEEE, 2019.
- [67] F. Copty, M. Danos, O. Edelstein, C. Eisner, D. Murik, and B. Zeltser, “Accurate malware detection by extreme abstraction,” in Proceedings of the 34th Annual Computer Security Applications Conference, pp. 101–111, ACM, 2018.
- [68] S. Naval, V. Laxmi, M. Rajarajan, M. S. Gaur, and M. Conti, “Employing program semantics for malware detection,” IEEE Transactions on Information Forensics and Security, vol. 10, no. 12, pp. 2591–2604, 2015.
- [69] T. Wüchner, A. Cisłak, M. Ochoa, and A. Pretschner, “Leveraging compression-based graph mining for behavior-based malware detection,” IEEE Transactions on Dependable and Secure Computing, vol. 16, no. 1, pp. 99–112, 2017.
- [70] Y. Ding, X. Xia, S. Chen, and Y. Li, “A malware detection method based on family behavior graph,” Computers & Security, vol. 73, pp. 73–86, 2018.
- [71] M. Rhode, P. Burnap, and K. Jones, “Early-stage malware prediction using recurrent neural networks,” computers & security, vol. 77, pp. 578–594, 2018.
- [72] M. Belaoued, A. Boukellal, M. A. Koalal, A. Derhab, S. Mazouzi, and F. A. Khan, “Combined dynamic multi-feature and rule-based behavior for accurate malware detection,” International Journal of Distributed Sensor Networks, vol. 15, no. 11, p. 1550147719889907, 2019.
- [73] W. Han, J. Xue, Y. Wang, L. Huang, Z. Kong, and L. Mao, “Maldae: Detecting and explaining malware based on correlation and fusion of static and dynamic characteristics,” Computers & Security, vol. 83, pp. 208–233, 2019.
- [74] A. I. Ali-Gombe, I. Ahmed, G. G. R. III, and V. Roussev, “Opseq: Android malware fingerprinting,” in Proceedings of the 5th Program Protection and Reverse Engineering Workshop, PPREW@ACSAC, Los Angeles, CA, USA, December 8, 2015, pp. 7:1–7:12, 2015.
- [75] J. Lee, S. Lee, and H. Lee, “Screening smartphone applications using malware family signatures,” computers & security, vol. 52, pp. 234–249, 2015.
- [76] J. Kim, Al, T. G. Kim, E. G. Im, and Al, “Structural information based malicious app similarity calculation and clustering,” in Proc. 2015 Conf. Res. Adapt. Converg. Syst., pp. 314–318, ACM, 2015.
- [77] G. Suarez-Tangil, J. E. Tapiador, Al., P. Peris-Lopez, J. Blasco, Al., P. Peris-Lopez, and J. Blasco, “Dendroid: A text mining approach to analyzing and classifying code structures in Android malware families,” Expert Systems with Applications, vol. 41, no. 4, pp. 1104–1117, 2014.
- [78] Y.-D. Lin, Y.-C. Lai, C.-H. Chen, and H.-C. Tsai, “Identifying android malicious repackaged applications by thread-grained system call sequences,” computers & security, vol. 39, pp. 340–350, 2013.
- [79] P. Faruki, V. Laxmi, A. Bharmal, M. S. Gaur, and V. Ganmoor, “AndroSimilar: Robust signature for detecting variants of Android malware,” J. Inf. Secur. Appl., vol. 22, pp. 66–80, 2015.
- [80] K. Tian, D. D. Yao, B. G. Ryder, G. Tan, and G. Peng, “Detection of repackaged android malware with code-heterogeneity features,” IEEE Transactions on Dependable and Secure Computing, 2017.
- [81] M. Fan, J. Liu, X. Luo, K. Chen, Z. Tian, Q. Zheng, and T. Liu, “Android malware familial classification and representative sample selection via frequent subgraph analysis,” IEEE Transactions on Information Forensics and Security, vol. 13, no. 8, pp. 1890–1905, 2018.
- [82] S. Ni, Q. Qian, and R. Zhang, “Malware identification using visualization images and deep learning,” Computers & Security, vol. 77, pp. 871–885, 2018.
- [83] A. Mohaisen, O. Alrawi, and M. Mohaisen, “Amal: High-fidelity, behavior-based automated malware analysis and classification,” computers & security, vol. 52, pp. 251–266, 2015.
- [84] T. Chakraborty, F. Pierazzi, and V. Subrahmanian, “Ec2: ensemble clustering and classification for predicting android malware families,” IEEE Transactions on Dependable and Secure Computing, 2017.
- [85] H. Kang, J.-w. Jang, A. Mohaisen, and H. K. Kim, “Detecting and classifying android malware using static analysis along with creator information,” International Journal of Distributed Sensor Networks, vol. 2015, p. 7, 2015.
- [86] G. Canfora, F. Mercaldo, and C. A. Visaggio, “An hmm and structural entropy based detector for android malware: An empirical study,” Computers & Security, vol. 61, pp. 1–18, 2016.
- [87] L. Zhang, V. L. Thing, and Y. Cheng, “A scalable and extensible framework for android malware detection and family attribution,” Computers & Security, vol. 80, pp. 120–133, 2019.
- [88] E. B. Karbab, M. Debbabi, A. Derhab, and D. Mouheb, “MalDozer: Automatic framework for android malware detection using deep learning,” Digital Investigation, 2018.
- [89] J. Zhang, Z. Qin, H. Yin, L. Ou, and K. Zhang, “A feature-hybrid malware variants detection using cnn based opcode embedding and bpnn based api embedding,” Computers & Security, vol. 84, pp. 376–392, 2019.
- [90] S. Alrabaee, E. B. Karbab, L. Wang, and M. Debbabi, “Bineye: Towards efficient binary authorship characterization using deep learning,” in Computer Security - ESORICS 2019 - 24th European Symposium on Research in Computer Security, Luxembourg, September 23-27, 2019, Proceedings, Part II (K. Sako, S. Schneider, and P. Y. A. Ryan, eds.), vol. 11736 of Lecture Notes in Computer Science, pp. 47–67, Springer, 2019.
- [91] K. Chen, P. Wang, Y. Lee, X. Wang, N. Zhang, H. Huang, W. Zou, and P. Liu, “Finding Unknown Malice in 10 Seconds: Mass Vetting for New Threats at the Google-Play Scale,” in USENIX Security, vol. 15, 2015.
- [92] M. Sun, M. Li, and J. C. S. Lui, “Droideagle: seamless detection of visually similar android apps,” in Proceedings of the 8th ACM Conference on Security & Privacy in Wireless and Mobile Networks, New York, NY, USA, June 22-26, 2015, pp. 9:1–9:12, 2015.
- [93] W. Zhou, Y. Zhou, X. Jiang, and P. Ning, “Detecting Repackaged Smartphone Applications in Third-party Android Marketplaces,” in ACM conference on Data and application security and privacy (CODASPY), CODASPY ’12, (New York, New York, USA), pp. 317–326, ACM Press, 2012.
- [94] J. Crussell, C. Gibler, and H. Chen, “Attack of the clones: Detecting cloned applications on android markets,” in European Symposium on Research in Computer Security, vol. 7459, pp. 37–54, Springer, 2012.
- [95] W. Zhou, Y. Zhou, M. C. Grace, X. Jiang, and S. Zou, “Fast, scalable detection of piggybacked mobile applications,” in Proceedings of the third ACM conference on Data and application security and privacy, CODASPY ’13, pp. 185–196, 2013.
- [96] J. Crussell, C. Gibler, and H. Chen, “AnDarwin: Scalable Detection of Semantically Similar Android Applications,” in European Symposium on Research in Computer Security (ESORICS), vol. 8134, pp. 182–199, 2013.
- [97] J. Crussell, Al., C. Gibler, H. Chen, and Al., “Andarwin: Scalable detection of android application clones based on semantics,” IEEE Transactions on Mobile Computing, vol. 14, no. 10, pp. 2007–2019, 2015.