Intensities of -ray emissions following decay determined via photonuclear reaction yield measurements
Abstract
Intensities of ten strongest -ray transitions following =35.3 ) decay have been determined via comparison of two sets of the experimental photonucleon reaction yields driven using traditional activation equation and activation equation for genetically coupled radioactive nuclei. The found absolute intensities of the -ray transitions in question turned up to be noticeably different from the currently recommended values.
I Introduction
Nucleus decay data are important for both nuclear spectroscopy theories and experimental techniques for defining nuclear reaction cross sections or yields by means of residual activity measurements. The tin-111 () nucleus decaying via -process with the half-life of 35.3 populates a large array of excited levels of the indium-111 () daughter nuclide among which there is an isomeric state with the excitation energy 537.2 and the half-life =7.7 (Fig. 1).
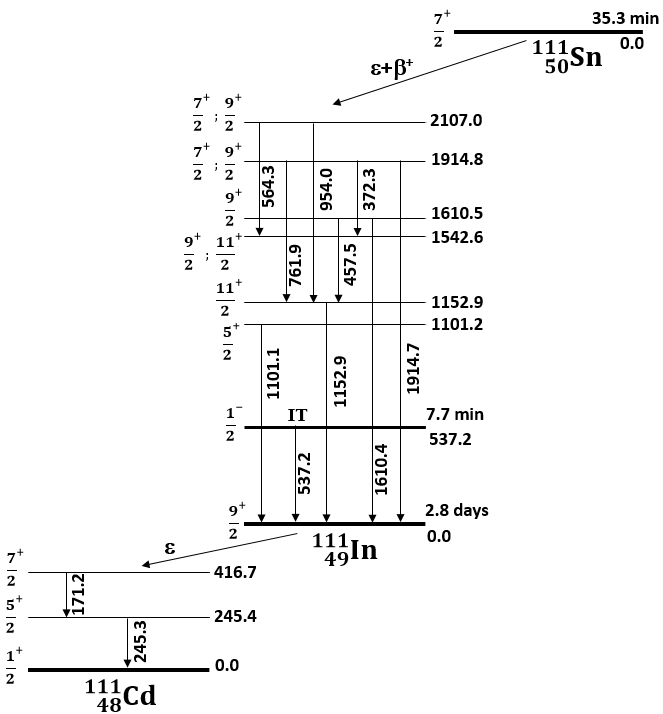
The ground state =2.80 decays to the stable one following the strong -ray transitions of 171.2 and 245.3 energies. The latest evaluated decay data for A=111 nuclear mass were recommended in the work Blachot (2009) and included to NuDat 2.8 base nud . Meanwhile the intensity values of -ray transitions between excited levels following the decay are based on relatively old experimental measurements, mostly performed in the 1970-1980s (see references in Blachot (2009)), with the use of detectors of relatively low efficiency and poor resolution compared with current -ray spectrometry techniques.
A large quantity of experimental measurements of activation cross sections and yields of different nuclear reactions induced by various incident particles, which lead to the formation of the nuclide, has been carried out for various basic and applied purposes exf . Correct values of -ray emissions following residual nuclei are needed for right determination of nuclear reaction cross sections or yields using the -ray spectrometry activation technique. We faced this problem while determining the bremsstrahlung activation yields of the near-threshold photonuclear reactions with the nuclide as a target which are partly of interest as input data for studying the -scenario of stellar nucleosynthesis of the so-called -nuclei Rauscher et al. (2013); Rauscher (2018).
II Experimental procedure and analysis
II.1 General notes
The radioisotope was produced by the n) photonuclear reaction at the 30 electron LINear ACcelerator (LINAC) located at National Science Center ”Kharkiv Institute of Physics and Technology” (NSC KIPT). Fig. 2 illustrates the scheme of our experimental setup for irradiation of targets.
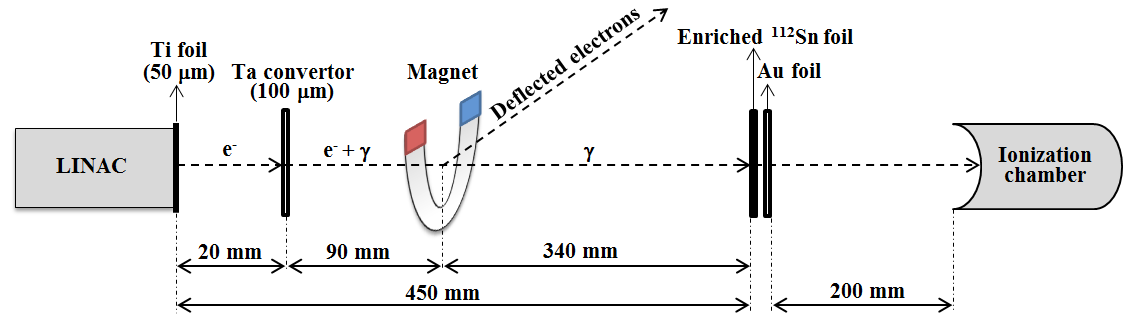
The electron beam of about 10 average operating current having 15 and less energies was deflected by the angle of 35∘ with a sector magnet (not shown in Fig. 2) creating 2% energy half-width of the beam. Having passed through the 50 titanium window the beam impacted at the 100 tantalum foil to be converted into a bremsstrahlung photon flux irradiating the investigated targets placed along the electron beam axis while the remained electrons were deflected by a permanent magnet. Four self-supporting tin metallic foils having the square shape with side 18 and total weight of 77 enriched with the isotope to 80% were used as a unified target. At every irradiation the gold foil of 20 in diameter with the weight of 120 was placed with the studied tin target in the close geometry in order to use the n reaction as a standard one to determine the bremsstrahlung flux. The cross sections of the last reaction had been earlier measured and evaluated by several experimental teams Itoh et al. (2011); Varlamov et al. (2010); Nair et al. (2008); Plaisir et al. (2012) in the giant resonance region. Their results are well consistent with each other and the residual radioactive decay has quite suitable properties nud for its activity measurement. Several exposures of the combined target (the target sandwich) were carried out over the range of the bremsstrahlung endpoint energies between the threshold of the ,n) reaction (10.79 ) and 15 to obtain the energy dependence of the photoactivation yield. The ionization chamber placed along the beam axis and screened from the background radiation with a lead shield was monitoring the bremsstrahlung photon flux by regular recording the X-ray dose rate. Fig. 3 shows the example of photon flux intensity as a function of time during irradiation. Necessary corrections were taken into account for the reaction yield calculations in the cases of essential photon flux fluctuations.

Irradiation lasted 60 and 100 (to determine the n) reaction yields) and 20 (to determine the p) reaction yields). After each irradiation the targets were instantly delivered to a low-background room far from the accelerator in order to begin the measurements of energy spectra of -rays following the radioactive decay of and its daughter using a coaxial Canberra High Purity Germanium (HPGe) detector with the relative efficiency of 30% in comparison to the efficiency of (3 in.×3 in.) -detector and 1.8 resolution for the 1332 -line of the isotope source. To reduce ambient radioactivity the detector was contained in a lead shield, with the walls of 12 in width and degraders of 3 and 5 line inside the shield to reduce the interference of the fluorescence X-rays. The -ray spectra of = 6.16 nud ) residual nucleus of the standard reaction were measured secondarily. The irradiated targets were mounted along the vertical axis of the spectrometer at several sample-to-crystal distances between 5 and 10 . The final measurements were carried out at sample-to-crystal distances providing 2% or less dead time and a negligible summing effect.
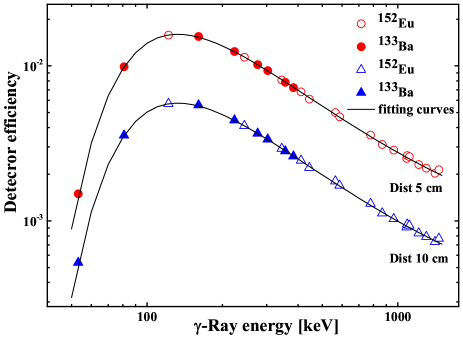
The measurements of the detector full-energy-peak efficiency were performed in the (50-1500) -ray energy region using and calibrated point sources. Fig. 4 shows the energy dependences of the detector efficiency for two distances between the source and the crystal endcap.
II.2 Activity measurements
Two typical -ray spectra of the target irradiated with 15 bremsstrahlung are shown in Fig. 5. The short-live fraction of the induced radioactivity is given in the upper panel, the long-live one in the lower panel. The arrows of the upper panel indicate 10 strongest gamma-ray transitions in the nucleus following the decay.
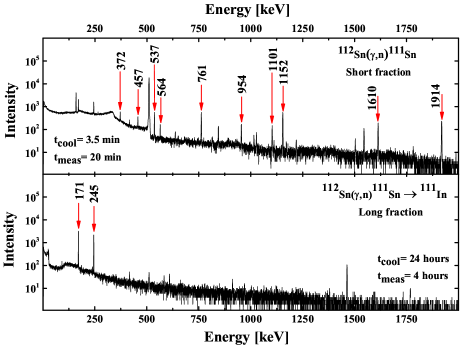
The energy of each transition is indicated in kiloelectron-volt units above the arrow. A number of other weaker -ray emissions following the and other side radioisotopes, in particular =40.06 , =160.3 ), can be identified in this -ray spectrum as well. The -ray spectrum measured one day after irradiation (the lower panel of Fig. 5), except the weak background, contains only 2 strong peaks (171.2 and 245.3 , indicated with arrows), which correspond to the -rays following the decay of the nucleus = 2.80 ) being the daughter of the nucleus (see Fig. 1) and on the other side can be additionally produced via the p) reaction (the 7.55 threshold) in appliance with the scheme:
![[Uncaptioned image]](/html/2005.03006/assets/figs/scheme.png)
Energies and intensities of the mentioned -ray transitions of the radioactive chain borrowed from NuDat 2.8 base nud are presented in Table 1.
| [] | [%] |
| 372.3 | 0.42 (7) |
| 457.5 | 0.38 (6) |
| 537.2 | 0.25 (4) |
| 564.3 | 0.30 (5) |
| 761.9 | 1.48 (23) |
| 954.0 | 0.51 (8) |
| 1101.1 | 0.64 (11) |
| 1152.9 | 2.7 |
| 1610.4 | 1.31 (20) |
| 1914.7 | 2.0 (3) |
| 537.2 | 87.2 (5) |
| 171.2 | 90.7 (9) |
| 245.3 | 94.1 (10) |
III Experimental data analysis
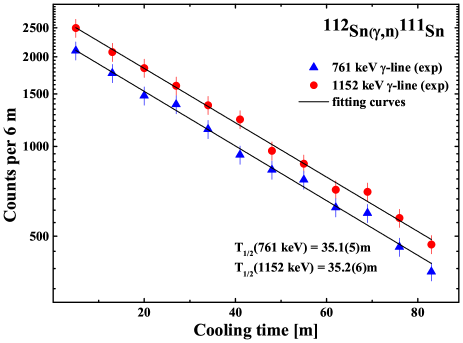
Radioactive decay curves derived analyzing the two most intense -ray transitions (761.9 and 1152.9 ) of the daughter nucleus are depicted in Fig. 6. The half-life values (indicated in the plot) of the radionuclide determined from the time dependencies of the intensities of these two -lines are in good agreement with NuDat 2.8 base value 35.3 (6) nud . Remaining gamma lines following the decay obey the same consistent pattern of exponential decay.
The bremsstrahlung activation yield of the n reaction can be determined via solution of the traditional activation equation (1):
| (1) |
in which is the experimental area of any -ray peak of the decay, is the full-energy peak detection efficiency, = is the branching coefficient of the same -ray transition, is the number of nuclei in the target being irradiated, is the end-point energy bremsstrahlung fluence covering the target, is the radioactive decay constant, and are irradiation, cooling and measurement times of the target activity respectively.
The fluence of the bremsstrahlung, penetrating the sandwiched targets of the studied foil and the standard one, can be determined from the experimentally measured ,n) reaction photoactivation yield , the angle-integrated bremsstrahlung spectrum Schiff (1951) and the cross section energy dependence of the standard reaction Itoh et al. (2011) by the equation (2):
| (2) |
De-excitation of the states (including the isomer) populated by the nucleus decay leads to the ground state. The experimental areas of 171.2 and 245.3 -ray peaks of the decay with the cooling time of being much longer than 7.7 (the isomer half-life) obey the equation (3) Friedlander et al. (1981) for genetically-coupled radioactive nuclides:
| (3) | |||
where in our case ( in the traditional activation equation (1)) and are the yields and and are the decay constants of the parent and daughter nuclei respectively.
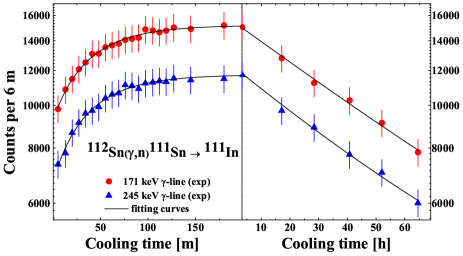
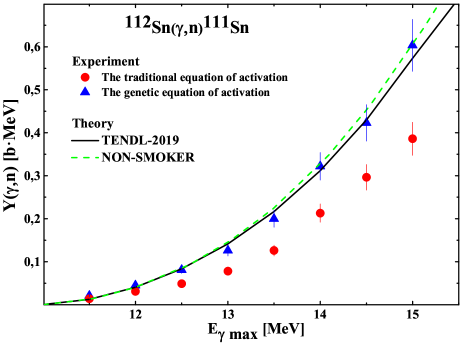
The curves of the nucleus accumulation and decay, plotted according to 171.2 and 245.3 experimental -line intensities, measured after the end of irradiation of the tin target, are shown in Fig. 7. The forms of these time dependencies are due to the differences of the half-lives of the parent and daughter members of the radioactive chain and the values of the activation yields ( and in the equation (3)) of the n) and ,p) reactions respectively. The increasing parts of the activity curves at the left part of Fig. 7 are explained by the feeding of the longer-living nucleus by the shorter-living one decay. Fitting the equation (3) for genetically coupled activities by least squares method to the experimental points we were able to determine the independent values of the both activation yields and obtained an unexpected result: the values of (i. e. the yields of the n) reaction) turned out to be noticeably larger than those determined using the traditional activation equation (1) and the NuDat 2.8 base data nud for the decay -ray intensity values. Both data sets for different bremsstrahlung energies are shown in Fig. 8 where the circles represent the experimental weighted average photonuclear ,n) reaction yields calculated applying the traditional activation equation (1) and the current nud -ray emission values of 10 strongest -ray transitions of the decay. The values of the triangle form points were obtained applying equation (3) for genetically coupled activities and the database nud emission values of the 171.2 and 245.3 -rays of the decay.
The decay characteristics (including -ray emission intensities) of the long-lived ground state nucleus have been investigated quite well by now and the only reason for this observation may be hidden in large uncertainties of the -ray emission values of the radiation transitions, following the nucleus decay, evaluated earlier nud from the energy and intensity balances of the branches populating and de-exciting the levels. The -ray intensities of the radionuclide decay presented in work Blachot (2009) were normalized based on: 1) total probabilities of radiation transitions (i.e. -rays + internal conversion electrons), 2) electron capture probability to the ground state, and 3) -decay probability to the ground state. Each of these probabilities was measured by a separate method and has its own error.
However the favorable features of the radionuclide chain gave us possibility to determine the reliable experimental independent activation yields of the ,n) photonuclear reaction using activation equation (3) for genetically coupled radioactive nuclides and 171.2 and 245.3 -ray line experimental areas with only gamma-spectrometry technique uncertainties (less than 2% of counting statistics, 1% of branching coefficients nud and 5% of detector efficiency). Comparing these activation yields with those determined via solution of traditional activation equation (1) we were able to derive updated values of the nuclei emission intensities. They are presented in the right column of Table 2.
| [%] | ||
|---|---|---|
| [] | NuDatnud | New data |
| 372.31 | 0.42 0.07 | 0.26 0.02 |
| 457.56 | 0.38 0.06 | 0.23 0.02 |
| 537.20 | 0.25 0.04 | 0.13 0.01 |
| 564.34 | 0.30 0.05 | 0.18 0.01 |
| 761.97 | 1.48 0.23 | 0.90 0.08 |
| 954.05 | 0.51 0.08 | 0.31 0.02 |
| 1101.18 | 0.64 0.11 | 0.39 0.04 |
| 1152.98 | 2.7 | 1.65 0.15 |
| 1610.47 | 1.31 0.20 | 0.80 0.07 |
| 1914.70 | 2.0 0.03 | 1.21 0.11 |
The total errors of the photoactivation yields (indicated as the point vertical bars in Fig. 8) were defined as root-mean-square errors including counting statistics errors in -ray peak areas (in the 2% region for different -ray peaks), uncertainties of detector efficiency (5%), sample-to-detector distance (5%), and the target dimensions (5%) accuracies and are within (10-12)%. The uncertainties of the -ray intensities (indicated in the right column of Table 2) are smaller since they include only detector efficiency and peak area errors. The intensities of 9 transitions, excluding 537.2 one, turned out to be lower than those of NuDat 2.8 base nud by the average factor of 1.64 (0.10). 537.2 -ray intensity recalculation taking into account different contributions of the (,n) and (,p) reactions gives the result lower by the factor of 1.92 (0.16).
In addition the solid and dashed curves in Fig. 8 represent the integral bremsstrahlung yields of the ,n) reaction calculated from the cross sections predicted by the statistical theory of nuclear reactions implemented in NON-SMOKER computer code Rauscher and Thielemann (2000) and TENDL data library ten respectively. Further interpretation of the ,n) and ,p) activation yields is currently underway.
IV Conclusions
Advantageous features of the radionuclide chain make it possible to determine intensities of -ray transitions between the levels populated in the daughter nucleus by measuring and analyzing the yields of nuclear reactions leading to the formation of and nuclei. We applied this method to derive the updated values of 10 strongest -ray transitions following radioactive decay and to derive the values of integral yields of the ,n) and ,p) photonuclear reactions in the near and above threshold energy range which are of interest for modeling the -scenario of the stellar nucleosynthesis.
New intensity values of -ray emissions following the nucleus decay will be of interest both for nuclear spectroscopy theories and correct calculations of activation cross sections and yields of those nuclear reactions where the radioactive nuclide is a residual one. The numerous relevant data presented in the EXFOR database exf have to be revised.
References
- Blachot (2009) J. Blachot, Nuclear Data Sheets 110, 1239 (2009).
- (2) https://www.nndc.bnl.gov/nudat2/.
- (3) https://www.nndc.bnl.gov/exfor/.
- Rauscher et al. (2013) T. Rauscher, N. Dauphas, I. Dillmann, C. Fröhlich, Z. Fülöp, and G. Gyürky, Reports on Progress in Physics 76, 066201 (2013).
- Rauscher (2018) T. Rauscher, Nuclear Physics News 28, 12–15 (2018).
- Itoh et al. (2011) O. Itoh, H. Utsunomiya, H. Akimune, T. Kondo, M. Kamata, T. Yamagata, H. Toyokawa, H. Harada, F. Kitatani, S. Goko, C. Nair, and Y. W. Lui, Journal of Nuclear Science and Technology 48, 834 (2011).
- Varlamov et al. (2010) V. V. Varlamov, B. S. Ishkhanov, V. N. Orlin, and S. Y. Troshchiev, Bulletin of the Russian Academy of Sciences: Physics 74, 842 (2010).
- Nair et al. (2008) C. Nair, M. Erhard, A. R. Junghans, D. Bemmerer, R. Beyer, E. Grosse, J. Klug, K. Kosev, G. Rusev, K. D. Schilling, and et al., Physical Review C 78, 055802 (2008).
- Plaisir et al. (2012) C. Plaisir, F. Hannachi, F. Gobet, M. Tarisien, m.-m. Aleonard, V. Meot, G. Gosselin, P. Morel, and B. Morillon, The European Physical Journal A 48, 68 (2012).
- Schiff (1951) L. I. Schiff, Phys. Rev. 83, 252 (1951).
- Friedlander et al. (1981) G. Friedlander, J. W. Kennedy, and J. M. Miller, Nuclear and radiochemistry 14 (1981).
- Rauscher and Thielemann (2000) T. Rauscher and F.-K. Thielemann, Atomic Data and Nuclear Data Tables 75, 1–351 (2000).
- (13) https://tendl.web.psi.ch/tendl_2019/tendl2019.html.