The effectiveness of backward contact tracing in networks
Abstract
Discovering and isolating infected individuals is a cornerstone of epidemic control [1, 2, 3, 4, 5, 6, 7]. Because many infectious diseases spread through close contacts, contact tracing is a key tool for case discovery and control [8, 9, 10, 11, 12, 13, 14, 15]. However, although contact tracing has been performed widely, the mathematical understanding of contact tracing has not been fully established and it has not been clearly understood what determines the efficacy of contact tracing. Here, we reveal that, compared with “forward” tracing—tracing to whom disease spreads, “backward” tracing—tracing from whom disease spreads—is profoundly more effective. The effectiveness of backward tracing is due to simple but overlooked biases arising from the heterogeneity in contacts. Using simulations on both synthetic and high-resolution empirical contact datasets, we show that even at a small probability of detecting infected individuals, strategically executed contact tracing can prevent a significant fraction of further transmissions. We also show that—in terms of the number of prevented transmissions per isolation—case isolation combined with a small amount of contact tracing is more efficient than case isolation alone. By demonstrating that backward contact tracing is highly effective at discovering super-spreading events, we argue that the potential effectiveness of contact tracing has been underestimated. Therefore, there is a critical need for revisiting current contact tracing strategies so that they leverage all forms of biases. Our results also have important consequences for digital contact tracing because it will be crucial to incorporate the capability for backward and deep tracing while adhering to the privacy-preserving requirements of these new platforms.
1 Introduction
Mass quarantine has shown its effectiveness in controlling the epidemic outbreak during the COVID-19 pandemic, but with a considerable social and economic cost [6, 7]. Once the initial outbreak has been suppressed, it is critical to manage resurgence in order to avoid uncontrolled spreading and another lockdown. Infection does not occur spontaneously but does so through close physical contacts. Therefore, contact tracing—tracing and isolating close contacts of infected individuals to prevent further transmission—is a potent intervention measure for successful epidemic control [8, 9, 10, 11, 3, 12, 13, 14, 15]. For instance, contact tracing has played a critical role in ending the SARS outbreak in 2003 and discovered many super-spreading events in the COVID-19 pandemic [12, 4]. However, because traditional contact tracing is labor-intensive and slow, its efficacy and cost-benefit trade-offs have been questioned [16, 17]. Therefore, digital contact tracing that leverages mobile devices may allow more swift and efficient contact tracing, potentially overcoming the limitations of the traditional contact tracing [14].
Regardless of whether it is performed in person or digitally, contact tracing in practice often discovers super-spreading events, which are abundant in many epidemics [9]. A famous example from the COVID-19 pandemic would be the ‘Shincheonji Church’ associated with the ‘Patient ’ in South Korea [5]. The patient was the first positive case from the church-event, which was later identified—via contact tracing—to be the single biggest super-spreading event in South Korea. This single super-spreading event eventually caused more than cases, accounting for more than half of South Korea’s total cases during that time [5]. As illustrated in this case, super-spreading events are the norm rather than the exception [9], and these events are often discovered through contact tracing efforts [11, 4].
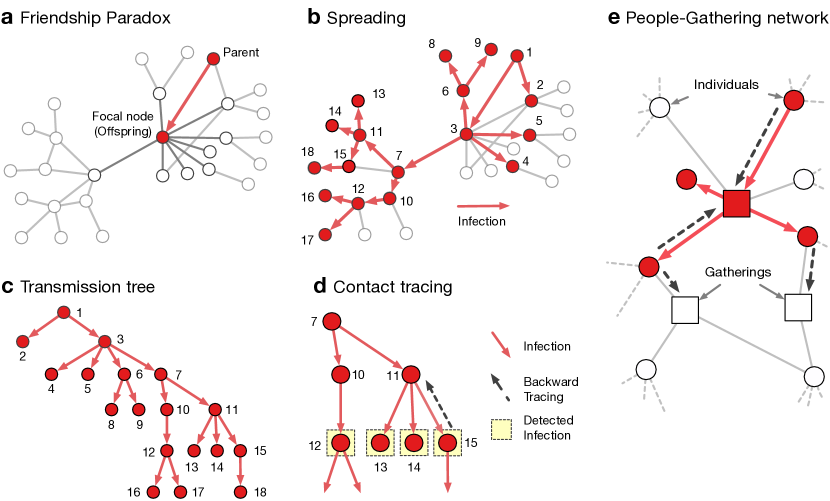
The contact tracing’s ability to detect super-spreading events can be, in part, attributed to the “friendship paradox” [18]. The friendship paradox states that your friends tend to have more friends than you, because the more friends someone has, the more often they show up in someone’s friend list. Now, because a disease is transmitted through contact ties, the disease preferentially reaches individuals with many contacts who can potentially cause super-spreading events. Beyond being an interesting piece of trivia, this insight has proven useful for epidemic surveillance and control [3]. Individuals with many social contacts such as celebrities and politicians are in many ways ideal sentinel-nodes for epidemic outbreaks [1, 3, 2, 9].
Here we argue that contact tracing is assisted by an additional statistical bias in social networks. This bias is leveraged when the contact tracing is executed backward to identify the source of infection (parent). This is because the more offsprings (infections) a parent has produced, the more frequently the parent shows up as a contact. Both biases can be at play at the same time, and thus their effects are additive, resulting in an exceptional efficacy of backward contact tracing at identifying super-spreaders and super-spreading events.
A leading factor that determines the strengths of these statistical biases is the structural properties of the underlying contact network itself, in particular, the heterogeneity of the degree (i.e., the number of contacts). Heterogeneous networks, where the number of contacts varies significantly among individuals, have a larger variance in the degree, which in turn produces a stronger friendship paradox effect. Real networks are known to be heterogeneous [19, 20, 21], with strong implications for epidemiology because these properties alter the fundamental nature of the epidemic dynamics in the form of, for instance, vanishing epidemic threshold [22], hierarchical spreading [23], and large variance in individual’s reproductive number [9] as well as the final outbreak size [24].
Here, we analyze the statistical biases that backward contact tracing leverages. Using simulations on both synthetic and empirical contact network data, we show that strategically executed contact tracing can be highly effective and efficient at controlling epidemics. Our results call not only for the incorporation of contact tracing as a more crucial part of the epidemic control strategy, but crucially for the implementation of backward-facing contact tracing protocols both in traditional and digital contact tracing programs to fully leverage the biases afforded by empirical network structures.
2 Results
2.1 Bias owing to the friendship paradox
Face-to-face contacts between people can be represented as a network, where a node is a person and an edge indicates a contact between two persons. When a node in the network is infectious, the disease can be transmitted to the neighbors through its edges (Fig. 1a). A node with many edges is likely to be one of the neighbors and thus has a high chance of infection. This is the friendship paradox described above [18]. In other words, “you” are a random node having contacts drawn from a distribution , whereas “your friends” are those having contacts drawn proportionally to . The friendship paradox aggravates epidemic outbreaks because individuals with many contacts are preferentially infected, and spread the infection to many [22, 23, 25].
Formally, if we sample a node at random, the distribution of degree (i.e., the number of contacts) is given by , which can be expressed as the probability generating function (PGF), i.e.,
| (1) |
The PGF is a polynomial representation of the degree distribution; for example, the average degree can be calculated using a derivative . Now, consider that a node is infected and the disease is transmitted through an edge chosen at random. Then, the disease is times more likely to reach a node with degree than a node with degree . Therefore, the number of other contacts (i.e, excess degree; ) found at the end of that contact is generated by
| (2) |
where is a normalization constant. Note that the average excess degree is larger than or equal to the average degree, (Friendship paradox).
This property can be leveraged by the so-called “acquaintance sampling” strategy, where one randomly samples individuals and then samples their “friends” by following contacts [1, 3]. Because the acquaintance sampling can preferentially sample hubs in a network even without knowing its whole structure, it has been shown to help early detection of an outbreak as well as efficient control of the disease [1, 3].
2.2 Bias owing to backward tracing
An often overlooked fact about contact tracing is that there are two directions that the contact tracing can lead to discovery of infected individuals. The first is following the direction of the transmission—to whom the transmission may have occurred—and the other is reaching to the parent—from whom the transmission occurred. The difference has a profound implication on the statistical nature of the sampling.
Disease spreading can be represented as a tree composed of edges from parents to offsprings (Fig. 1c). If we follow the transmission edge to the offsprings of a node, we are sampling with the bias owing to the friendship paradox (). However, when we trace back to the parent, another statistical bias comes into play. Imagine someone who has spread the disease to individuals (e.g., node 11 in Fig. 1d) and another infected individual who only spreads the disease to one individual (node 10). If we sample infected individuals (one of nodes 12–15) and follow a transmission edge back to the parent, we are likely to reach the one who has more offspring (node 11). Formally, if we trace back to the parent, the number of the other offsprings for the parent is generated by
| (3) |
The contact tracing samples a parent having degree (i.e., the number of other offsprings) with a probability proportional to ()—a bias stronger than acquaintance sampling (). To illustrate this in practice, we simulate the Susceptible-Infectious-Recovered (SIR) model on a degree heterogeneous network generated by the Barabási-Albert (BA) model [26] (See Methods on the parameters of the SIR model). At an early stage (), the degree distribution for all infected nodes and that for parents closely follow the distributions proportional to and , respectively (Fig. 1f).
Backward tracing needs information about the direction from which the infection occurs. However, except for a few diseases [27], the direction of transmission is not clear in practice. Still, we can preferentially sample super-spreading parents (events) by leveraging the bias owing to backward tracing. Because a super-spreader or super-spreading event infects many individuals, they would appear as a common contact or visited location of many infected individuals. For example, in Fig. 1d, node 11 is a common neighbor for 3 infected nodes and hence would appear 3 times more frequently than node 10. The bias can be leveraged by the frequency-based contact tracing, where we trace and isolate the most frequent nodes in the contact list. For the BA network, the frequency-based contact tracing samples nodes with a degree similar to the parents without knowing the direction of transmissions (Fig. 1g).
2.3 Effectiveness of contact tracing for heterogeneous networks
The backward tracing leverages the two sampling biases attributed to the heterogeneity in the degree distributions. Therefore, we hypothesize that contact tracing is highly effective in degree heterogeneous networks. As a proof of concept, we simulate epidemic spreading using the SIR model on a network with a power-law degree distribution. The network is generated by the BA model composed of nodes with minimum degree 2 [26] (see Simulating epidemic spreading in Methods for parameter values). Although the SIR model simulated on the BA networks, in many respects, differ from epidemic spreading in empirical social networks [28, 29, 17], it demonstrates that contact tracing can leverage the sampling biases arising from the heterogeneity.
We intervene epidemic spreading from by detecting and isolating newly infected individual at the time of infection with probability (i.e., probability of detecting infection). Then, from each detected individual, we add each contact (i.e., neighbor) to a contact list with probability (i.e., probability of successful tracing). At every interval of , we isolate the most frequent nodes in the contact list and then clear the list. Note that contact tracing with is equivalent to case isolation, i.e., we discover and isolate newly infected nodes with probability but do not trace close contacts. We model the contact tracing as preventing infections to all nodes rooted from the isolated nodes in the transmission tree.
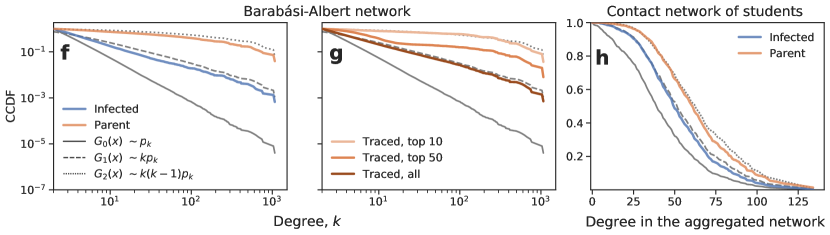
The disease infects roughly 30% of nodes at the peak of infection (Fig. 2a). The peak can be reduced by more than 70% with contact tracing for (Fig. 2a). Even a small amount of extra isolations through contact tracing (e.g., from the population of ) is still effective in flattening the curve of infections (Fig. 2b). The effectiveness is more pronounced when we can identify more infected nodes, e.g., by increasing the number of testing (Fig. 2c).
Contact tracing isolates fewer nodes in total while preventing more cases than case isolation, resulting in a high cost-efficiency in terms of the number of prevented cases per isolation (Fig. 2d–f). This might appear to be counter-intuitive because contact tracing isolates extra nodes (i.e., contacts) in addition to case isolation. However, because this additional isolation by contact tracing preferentially targets those who are at high risk, they, in turn, prevents many subsequent transmission events, reducing the total number of isolation.
Outbreak investigation can be considered as contact tracing for ‘gatherings’ (e.g. the closure of churches, grocery markets, or any spontaneous gatherings; see Fig. 1e) [30]. Note that the privacy-preserving contact tracing protocols such as DP-3T [31] can be used to detect spreading events that happened in gatherings and notify risk information for those who joined the gatherings. Moreover, the people-gathering structure is found in high temporal resolution proximity data [30] and is stable because human mobility often follows regular routines [30, 32, 33].
Contact tracing is effective at detecting the gatherings with super-spreading events for the same reason as for super-spreaders; gatherings with participants are detected with a probability roughly proportional to (see People–gathering networks in Methods). To test its effectiveness, we generate synthetic people-gathering networks composed of person-nodes and gathering-nodes with a power-law distribution of exponent using the configuration model [34]. Then, we run the SIR simulations on the network (see Simulating epidemic spreading in Methods). Contact tracing is executed from in the same way as to people contact network.
As in the case of people contact networks, contact tracing substantially reduces the peak of infections (Fig. 2g). The effectiveness stands out even if we do not isolate all but only gatherings from a population of people and gatherings (Fig. 2h and i). Contact tracing isolates a comparable number of nodes as case isolation while preventing more infections, yielding a higher cost-efficiency (Fig. 2j–l).
2.4 Contact tracing on temporal contact network of students
A virus can easily spread in a densely connected population where people routinely have face-to-face contact with each other such as students participating in the same class [35, 36], and workers in dorms [37]. Without physical distancing, epidemic control is extremely difficult. If large gatherings (e.g., classes) are prohibited, there may not be strong heterogeneity in terms of the offspring distribution (no super-spreading events). In such a case, would contact tracing be useful at all?
We test the effectiveness of contact tracing for a temporal contact network of university students, which is constructed using the physical contact data collected in the Copenhagen Network Study [38]. The physical contacts are estimated by smartphones at 5 minutes resolutions. This network, as it only captures the infections among a specific population and neglects others, has a fairly homogeneous degree distribution, with the maximum degree 42 at five minutes resolutions.
The epidemic spreading is simulated using a more empirically-grounded model—Susceptible-Exposed-Infectious-Recovered (SEIR) model—which reflects the fact that many infectious diseases have an incubation period before being infectious [17] (see Methods for data prepossessing and parameters for the SEIR model). Even in this fairly homogeneous network, the sampling biases are present; for instance, the parents of infected nodes have a larger degree than the infected nodes in the aggregated network (see Fig. 1h).
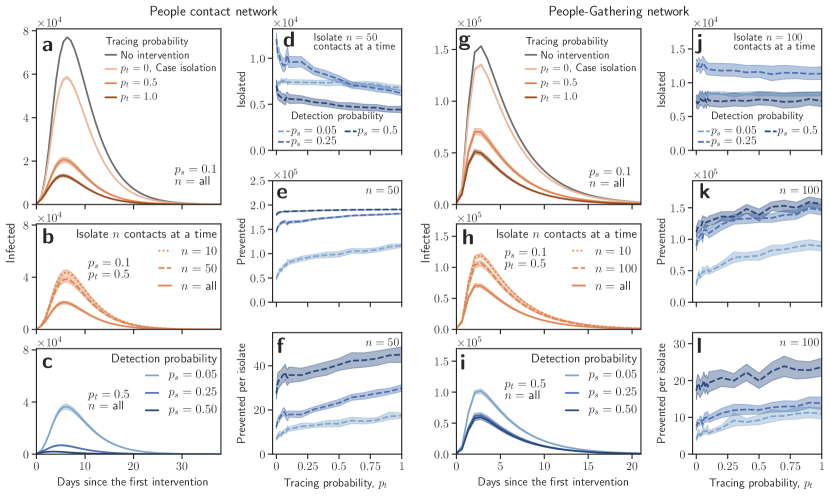
We carry out contact tracing on the third day and onward in the same way as for the synthetic networks except how we compile the contact list. We detect newly infected individuals with probability at the time of infectious. Then, with a probability , a close contact for each detected individual is traced and added to the contact list; we consider a node as a close contact if and only if it has contact with the detected individual for at least one hour in the previous seven days. The contact tracing is carried out at every interval of hours.
Our simulation shows that case isolation alone reduces the peak of infections by roughly 15% (Fig. 3a). Contact tracing lowers the peak by about 50% even though the network does not exhibit strong heterogeneity (Fig. 3a). Moreover, tracing and isolating few traced contacts has comparable effectiveness to isolating all close contacts (Fig. 3b). The peak can be further reduced by contact tracing when we can detect more infected nodes, i.e., increasing testing capacity (Fig. 3c). Contact tracing has a marked diminishing return; as tracing probability increases, contact tracing isolates more nodes but prevents nearly the same number of cases (Fig. 3d–f). Still, contact tracing yields a high benefit; it prevents at least roughly five cases per isolation. In sum, our results suggest that even when the network is homogeneous and densely connected, a small amount of contact tracing may be able to curve the spreading efficiently.
2.5 Analytical analysis of contact tracing on networks with arbitrary degree sequence
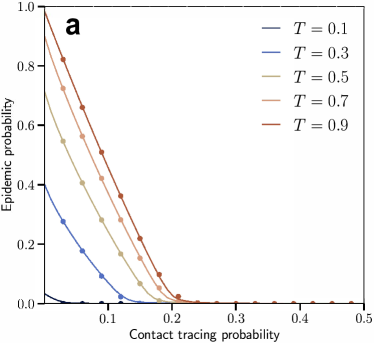
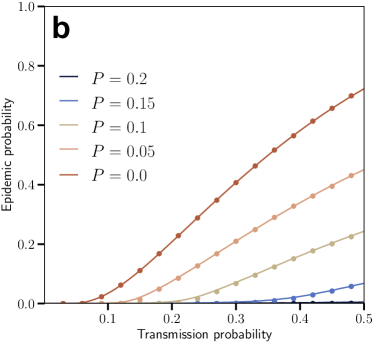
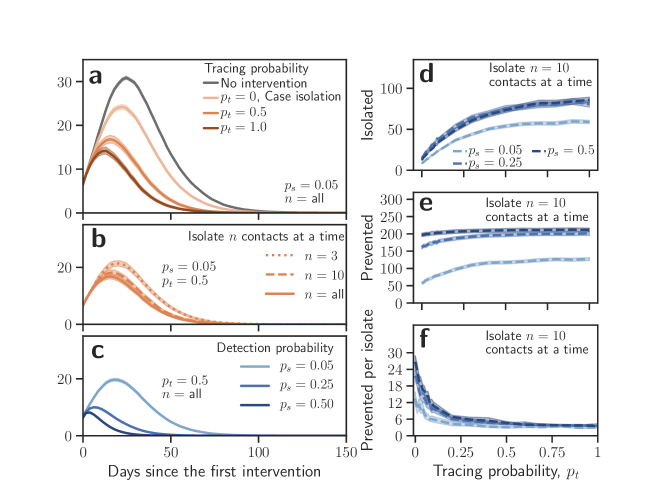
Let us investigate how much contact tracing would be necessary to prevent an outbreak. We calculate the epidemic probability—the probability of sustained transmission of disease—for networks with an arbitrary degree distribution under contact tracing based on a branching process formalism (see Epidemic probability in Methods for the derivation of the probability). We consider a contact network of people, where a disease is transmitted from an infected person (i.e., parent) to susceptible person (i.e., offspring) with transmission rate . The parent is identified and isolated with probability (i.e., tracing probability) from its offspring by contact tracing.
Our analytical solution (see Epidemic probability in Methods), as well as a numerical simulation (Fig. 4), demonstrates that increasing the tracing probability can control an epidemic and stop any possibility of sustained transmission while showing a diminishing return of contact tracing. Notably, we find a smooth epidemic threshold in , which is distinct from the usual sharp epidemic threshold observed over . This phenomenology can be understood by considering who gets targeted by contact tracing. Effective execution of contact tracing detects transmissions events from an individual with a probability proportional to , where is the degree of the individual. Consequently, as we increase the frequency of contact tracing, we not only reduce the number of transmissions but do so by only allowing transmissions to occur around relatively small degrees. Therein lies the power of contact tracing on heterogeneous networks, it reduces the size of the epidemic and localizes it around nodes of lower degrees; reducing both the total number of infections and the frequency of super-spreading events.
3 Discussion
We show that contact tracing leverages two sampling biases arising from the heterogeneity in the number of individual’s contacts. Our theoretical and simulation analyses indicate that contact tracing can be a highly effective and efficient strategy even when it is not performed on a massive scale, as long as it is strategically performed to leverage the sampling biases. Furthermore, contact tracing can be more cost-efficient than case isolation in terms of the number of prevented cases per isolation, in particular when detecting infection is difficult. The effectiveness and efficiency hinge upon the fact that backward tracing can detect super-spreading events exceptionally well. Therefore, we argue that (i) even when massive contact tracing is not feasible, it may still be worth to implement contact tracing, (ii) not all contact tracing protocols are equal—it is crucial to implement the protocols that leverage the presented biases, and (iii) the “cheaper” contact tracing offered by digital contact tracing may hold even greater potential than previously suggested [17].
In the context of digital contact tracing, our results show the need for (i) backward contact tracing that aims to identify the parent of a detected case and (ii) deep contact tracing to notify other recent contacts of the traced nodes. Current implementations of digital contact tracing, including the Apple and Google partnership [39] and the DP-3T proposal [31], notify the contacts of an infected individual about the risk of infection. However, they neglect that one of these previous contacts is likely the source of infection (i.e., parent) who might be infecting others. We show that multiple notifications are particularly indicative of the parent and can be potentially leveraged for better intervention strategies. Therefore, we urge the consideration of a multi-step notification feature that can fully leverage the sampling biases arising from the heterogeneity in the contact network structure.
An implementation of our model does not necessarily require any compromise in terms of privacy or decentralization of the contact tracing protocol itself [40]. One could also imagine a hybrid approach, where, deep contact tracing is undertaken using a centralized database when a given device has been notified more than a certain amount of time. The benefits of such network-based contact-tracing could be significant, especially if accompanied by serious educational efforts for users to explain the rationale behind the intervention and the importance of their own role in our social network.
There are several caveats to be considered. First, diagnostic tests and isolation are assumed to be instantaneous in our simulations. A huge delay may degenerate the effectiveness of preventive measures, in particular case isolation in which immediate isolation is crucial. Second, we assume that every individual has an equal probability of infection and isolation, which, however, may vary depending on demographics. The heterogeneity in the probabilities may hinder the effectiveness of opt-in contact tracing strategies. For example, it is possible that a virus is constantly sourced from people who refuse contact tracing [41, 42] or who traveled from a different country that does not share contact data.
Even with the aforementioned limitations, our results suggest that contact tracing has a larger potential than commonly considered. Because the effectiveness hinges upon the ability to reach the “source” of infection, our results underline the importance of strategic contact tracing protocols.
4 Methods
4.1 Data
We use the dataset collected in the Copenhagen Network Study [38] to construct the temporal network of physical contacts between students in a university. The data set contains information on the physical contacts between more than 700 students in a university estimated by Bluetooth signal strength. We remove all individuals from the data that have a valid Bluetooth scan in less than 60% of the observation period. Then, we regard that two individuals and had a contact if or received the Bluetooth scans from the other with the signal strength more than dB. We note that one receives the signal strength at approximately 1m distance from the device [43]. These steps resulted in a cohort of individuals with contact data for days with 5 min resolution.
4.2 Simulating epidemic spreading
We simulate the SIR model for the static contact networks and people-gathering networks using the EoN package [44], with transmission rate , recovery rate , and initial seed fraction .
For the student contact network, we simulate the SEIR model with the parameters used in studies on the COVID-19 disease [45]: expected infectious and incubation periods are set to 5 and 1 days, respectively. The transmission rate of the COVID-19 highly varies across case studies and estimation methods [24, 17]. One expects that, in any closed population with dense contacts, between 20% to 60% of the population are infected [24]. Therefore, we use a transmission rate day-1 to produce outbreaks that reach 50% of the population, which is close to the worst-case scenarios that might be expected on a university campus We randomly choose 1% of the total population as initially infected nodes at time , where is chosen randomly in the first 28 days. The epidemic spreading process may take longer than the days recorded in the contact data (i.e., 28 days). Therefore, following a previous study [46], we assume that the contacts on the first day ensue after the last day.
4.3 People–gathering networks
In the people-gathering network, a person-node is connected to a gathering-node if he/she joined the gathering. The degree of a person implies how mobile the person is across diverse sets of gatherings, and the degree of a gathering indicates the number of participants for the gathering. Denoted by and the generating functions for the degree distributions of persons and gatherings, respectively, which are defined as
| (4) | |||||
| (5) |
The transmission event happens from a person to others via a gathering. When we trace a gathering from a person, a gathering with participants is times more likely to be sampled than the gathering with only one person. Therefore, the excess size of the gathering is generated by
| (6) |
The probability distribution of the number of one’s neighbors through gatherings is given by . Because larger gatherings would produce more infections and thus more likely to be traced, the number of participants of the gathering except for the original spreader and the isolated individual is given by the probability generating function
| (7) |
In other words, contact tracing samples a gathering with participants with probability roughly proportional to . Therefore, as is the case for people contact networks, contact tracing is effective at identifying super-spreading events and prevent numerous further disease transmission events.
5 Epidemic probability
We calculate the probability that the contact tracing stops the spreading of disease. To keep the analysis simple, we assume that every newly infected node has a probability to lead to its parent node and we can prevent the infections to all of the parent’s grandchildren by notifying the infected node.
The probability of epidemics is determined by the offspring distributions, i.e., number of nodes to which an infected node spreads the disease. We note that the offspring distribution depends on how we sample nodes due to the sampling biases (see Results). Specifically, if we sample infected nodes at random or by following a random transmission, the offspring distributions are given by generating functions
| (8) |
respectively, where is the probability of transmitting disease through an edge, and and are the probabilities of having offsprings, respectively.
With contact tracing, the offsprings of a parent can continue the spreading process if and only if successful contact tracing does not take place for all the offsprings, which occurs with probability . Therefore, the nodes sampled by following a random transmission have the offspring distribution given by
| (9) |
where the denotes the under contact tracing, and is the analogous function for . We have distinguished standard transmissions (counted with the variable ) from transmissions that occurred but are isolated quickly enough by contact tracing to stop the transmission tree (counted with the variable ). This gives us a way to calculate the coefficients of which specify the distribution of successful branching events in the transmission tree (i.e., those that can continue spreading).
The probability that transmission to a node without contact tracing around the parent does not lead to sustained transmission is given by the self-consistency condition
| (10) |
where the right-hand side gives the probability that the offsprings also do not lead to sustained transmission (1 if contact tracing occurs, and otherwise). The probability of an epidemic is then the probability that at least one transmission around patient leads to sustained transmission, or
| (11) |
References
- [1] Cohen, R., Havlin, S. & Ben-Avraham, D. Efficient immunization strategies for computer networks and populations. \JournalTitlePhysical Review Letters 91, 247901 (2003).
- [2] Barthélemy, M., Barrat, A., Pastor-Satorras, R. & Vespignani, A. Dynamical patterns of epidemic outbreaks in complex heterogeneous networks. \JournalTitleJournal of Theoretical Biology 235, 275–288 (2005).
- [3] Christakis, N. A. & Fowler, J. H. Social network sensors for early detection of contagious outbreaks. \JournalTitlePLOS ONE 5, e12948 (2010).
- [4] Park, S. et al. Coronavirus disease outbreak in call center, South Korea. \JournalTitleEmerging Infectious Diseases 26, 1666–1670 (2020).
- [5] Shin, Y., Berkowitz, B. & Kim, M. J. How a South Korean church helped fuel the spread of the coronavirus. \JournalTitleThe Washington Post (2020).
- [6] Gilbert, M., Dewatripont, M., Muraille, E., Platteau, J.-P. & Goldman, M. Preparing for a responsible lockdown exit strategy. \JournalTitleNature Medicine 26, 643–644 (2020).
- [7] Mattioli, A. V., Ballerini Puviani, M., Nasi, M. & Farinetti, A. COVID-19 pandemic: The effects of quarantine on cardiovascularrisk. \JournalTitleEuropean Journal of Clinical Nutrition 74, 852–855 (2020).
- [8] Eames, K. T. D. & Keeling, M. J. Contact tracing and disease control. \JournalTitleProceedings of the Royal Society of London. Series B: Biological Sciences 270, 2565–2571 (2003).
- [9] Lloyd-Smith, J. O., Schreiber, S. J., Kopp, P. E. & Getz, W. M. Superspreading and the effect of individual variation on disease emergence. \JournalTitleNature 438, 355–359 (2005).
- [10] Klinkenberg, D., Fraser, C. & Heesterbeek, H. The effectiveness of contact tracing in emerging epidemics. \JournalTitlePLOS ONE 1, e12 (2006).
- [11] Andre, M. et al. Transmission network analysis to complement routine tuberculosis contact investigations. \JournalTitleAmerican Journal of Public Health 97, 470–477 (2007).
- [12] Glasser, J. W., Hupert, N., McCauley, M. M. & Hatchett, R. Modeling and public health emergency responses: Lessons from SARS. \JournalTitleEpidemics 3, 32–37 (2011).
- [13] Peak, C. M., Childs, L. M., Grad, Y. H. & Buckee, C. O. Comparing nonpharmaceutical interventions for containing emerging epidemics. \JournalTitleProceedings of the National Academy of Sciences 114, 4023–4028 (2017).
- [14] Ferretti, L. et al. Quantifying SARS-CoV-2 transmission suggests epidemic control with digital contact tracing. \JournalTitleScience 368, eabb6936 (2020).
- [15] Aleta, A. et al. Modelling the impact of testing, contact tracing and household quarantine on second waves of COVID-19. \JournalTitleNature Human Behaviour 4, 964–971 (2020).
- [16] Armbruster, B. & Brandeau, M. L. Contact tracing to control infectious disease: When enough is enough. \JournalTitleHealth Care Management Science 10, 341–355 (2007).
- [17] Hellewell, J. et al. Feasibility of controlling COVID-19 outbreaks by isolation of cases and contacts. \JournalTitleThe Lancet Global Health 8, e488–e496 (2020).
- [18] Feld, S. L. Why your friends have more friends than you do. \JournalTitleAmerican Journal of Sociology 96, 1464–1477 (1991).
- [19] Albert, R. & Barabási, A.-L. Statistical mechanics of complex networks. \JournalTitleRev. Mod. Phys. 74, 47–97 (2002).
- [20] Dorogovtsev, S. N. & Mendes, J. F. F. Evolution of networks: From biological nets to the Internet and WWW (Oxford University Press, 2003).
- [21] Pastor-Satorras, R. & Vespignani, A. Evolution and Structure of the Internet: A Statistical Physics Approach (Cambridge University Press, Cambridge, 2004).
- [22] Pastor-Satorras, R. & Vespignani, A. Epidemic spreading in scale-free networks. \JournalTitlePhysical Review Letters 86, 3200 (2001).
- [23] Barthélemy, M., Barrat, A., Pastor-Satorras, R. & Vespignani, A. Velocity and hierarchical spread of epidemic outbreaks in scale-free networks. \JournalTitlePhysical Review Letters 92, 178701 (2004).
- [24] Hébert-Dufresne, L., Althouse, B. M., Scarpino, S. V. & Allard, A. Beyond : The importance of contact tracing when predicting epidemics. \JournalTitlePreprint arXiv:2002.04004 (2020).
- [25] Newman, M. E. Threshold effects for two pathogens spreading on a network. \JournalTitlePhysical Review Letters 95, 108701 (2005).
- [26] Barabási, A.-L. & Albert, R. Emergence of scaling in random networks. \JournalTitleScience 286, 509–512 (1999).
- [27] Meyers, L. A., Newman, M. E. J. & Pourbohloul, B. Predicting epidemics on directed contact networks. \JournalTitleJournal of Theoretical Biology 240, 400–418, DOI: https://doi.org/10.1016/j.jtbi.2005.10.004 (2006).
- [28] Stumpf, M. P. H. & Porter, M. A. Critical truths about power laws. \JournalTitleScience 335, 665–666 (2012).
- [29] Broido, A. D. & Clauset, A. Scale-free networks are rare. \JournalTitleNature Communications 10, 1017 (2019).
- [30] Sekara, V., Stopczynski, A. & Lehmann, S. Fundamental structures of dynamic social networks. \JournalTitleProceedings of the National Academy of Sciences 113, 9977–9982 (2016).
- [31] Troncoso, C. et al. Decentralized privacy-preserving proximity tracing. \JournalTitlePreprint arXiv:2005.12273 (2020).
- [32] Song, C., Qu, Z., Blumm, N. & Barabási, A.-L. Limits of predictability in human mobility. \JournalTitleScience 327, 1018–1021 (2010).
- [33] Bagrow, J. P. & Lin, Y.-R. Mesoscopic structure and social aspects of human mobility. \JournalTitlePLOS ONE 7, e37676 (2012).
- [34] Fosdick, B., Larremore, D., Nishimura, J. & Ugander, J. Configuring random graph models with fixed degree sequences. \JournalTitleSIAM Review 60, 315–355 (2018).
- [35] Gemmetto, V., Barrat, A. & Cattuto, C. Mitigation of infectious disease at school: Targeted class closure vs school closure. \JournalTitleBMC Infectious Diseases 14, 695 (2014).
- [36] Darbon, A. et al. Disease persistence on temporal contact networks accounting for heterogeneous infectious periods. \JournalTitleRoyal Society Open Science 6, 181404 (2019).
- [37] Sadarangani, S. P., Lim, P. L. & Vasoo, S. Infectious diseases and migrant worker health in Singapore: A receiving country’s perspective. \JournalTitleJournal of Travel Medicine 24 (2017).
- [38] Sapiezynski, P., Stopczynski, A., Dreyer, D. & Lehmann, S. Interaction data from the Copenhagen Networks Study. \JournalTitleNature Scientific Data 6 (2019).
- [39] Apple & Google. Exposure notification (2020).
- [40] Cho, H., Ippolito, D. & Yu, Y. W. Contact tracing mobile apps for COVID-19: Privacy considerations and related trade-offs. \JournalTitlearXiv:2003.11511 (2020).
- [41] Holder, S. Contact Tracing Is Having a Trust Crisis. \JournalTitleBloomberg (2020).
- [42] Borowiec, S. How South Korea’s nightclub outbreak is shining an unwelcome spotlight on the LGBTQ community. \JournalTitleTime (2020).
- [43] Sekara, V. & Lehmann, S. The strength of friendship ties in proximity sensor data. \JournalTitlePLOS ONE 9, 1–8, DOI: 10.1371/journal.pone.0100915 (2014).
- [44] Kiss, I. Z., Miller, J. C., Simon, P. L. et al. Mathematics of Epidemics on Networks, vol. 598 (Springer, 2017).
- [45] Zhang, J. et al. Changes in contact patterns shape the dynamics of the COVID-19 outbreak in China. \JournalTitleScience 368, 1481–1486 (2020).
- [46] Valdano, E., Ferreri, L., Poletto, C. & Colizza, V. Analytical computation of the epidemic threshold on temporal networks. \JournalTitlePhys. Rev. X 5, 021005, DOI: 10.1103/PhysRevX.5.021005 (2015).
Acknowledgements
The authors would like to thank M. Girvan, J. Lovato, and other organizers of the Net-COVID program, which initiated the project. We also thank A. Allard, C. Moore, E. Moro, A. S. Pentland, and S. V. Scarpino for helpful discussions.
L. H.-D. acknowledges support from the National Institutes of Health 1P20 GM125498-01 Centers of Biomedical Research Excellence Award. S. K. and Y.-Y. A. acknowledges support from the Air Force Office of Scientific Research under award number FA9550-19-1-0391.
Author contributions
Y.-Y. A. conceived the research. E. M., S. K., L. H.-D. and Y.-Y. A. performed the numerical simulations. L. H.-D. and Y.-Y. A. conducted the mathematical analysis. All authors participated in the analysis and interpretation of the results as well as the writing of the manuscript.
Competing interests
We have no competing interests.