Global Table Extractor (GTE): A Framework for Joint Table Identification and Cell Structure Recognition Using Visual Context
Abstract
Documents are often used for knowledge sharing and preservation in business and science, within which are tables that capture most of the critical data. Unfortunately, most documents are stored and distributed as PDF or scanned images, which fail to preserve logical table structure. Recent vision-based deep learning approaches have been proposed to address this gap, but most still cannot achieve state-of-the-art results. We present Global Table Extractor (GTE), a vision-guided systematic framework for joint table detection and cell structured recognition, which could be built on top of any object detection model. With GTE-Table, we invent a new penalty based on the natural cell containment constraint of tables to train our table network aided by cell location predictions. GTE-Cell is a new hierarchical cell detection network that leverages table styles. Further, we design a method to automatically label table and cell structure in existing documents to cheaply create a large corpus of training and test data. We use this to enhance PubTabNet with cell labels and create FinTabNet, real-world and complex scientific and financial datasets with detailed table structure annotations to help train and test structure recognition. Our framework surpasses previous state-of-the-art results on the ICDAR 2013 and ICDAR 2019 table competition in both table detection and cell structure recognition. Further experiments demonstrate a greater than 45% improvement in cell structure recognition when compared to a vanilla RetinaNet object detection model in our new out-of-domain FinTabNet.
1 Introduction
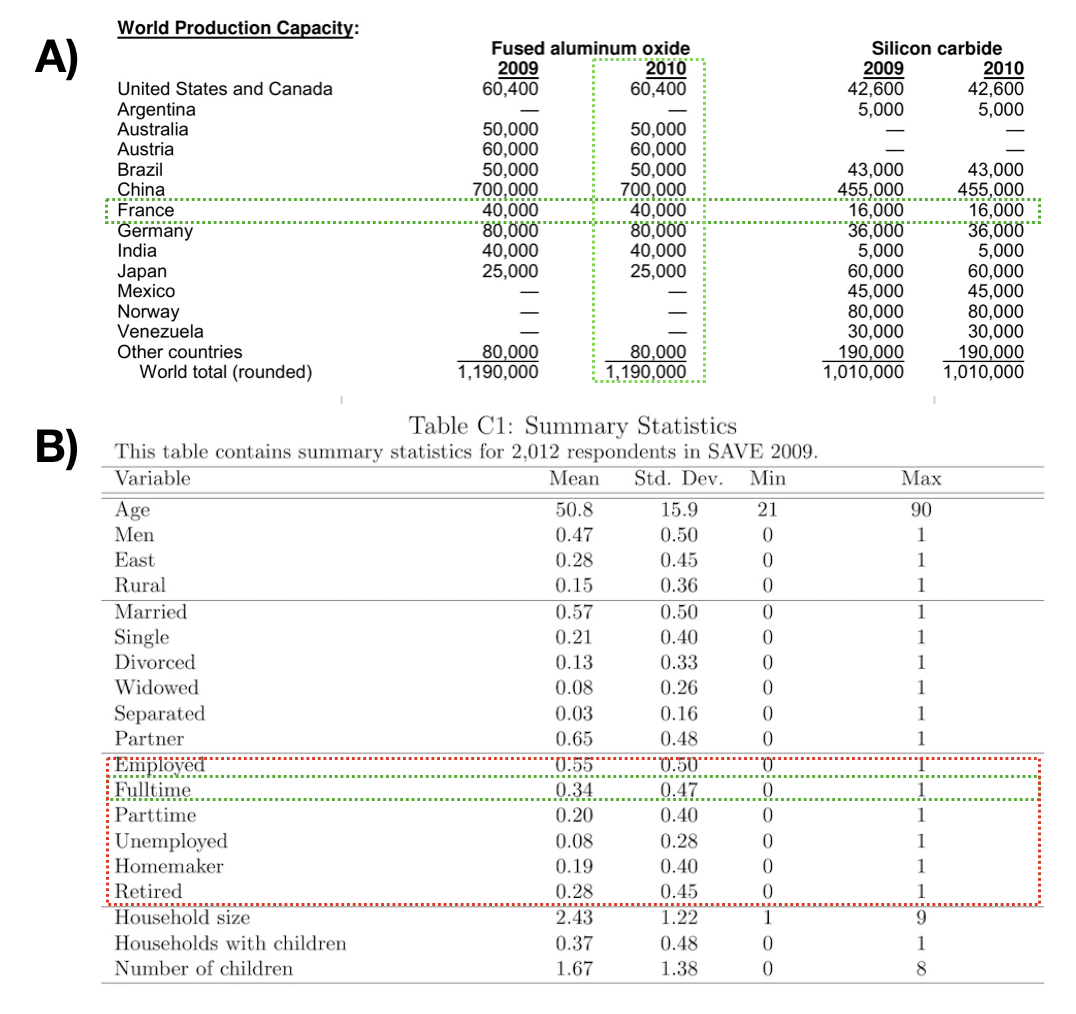
In real world enterprise and scientific applications, crucial information is often summarized in tabular form within PDF or scanned documents [1]. Since neither of these widely-used document formats preserve logical table structure, accurate table detection and cell structure recognition techniques are required to reconstruct the table before its contents can be leveraged for any subsequent analysis, such as question answering [22], scientific leaderboard construction [12] or knowledge base population [25]. Accurate table extraction is possibly the most important task and a major pain point in document analysis for businesses where the computer vision community can have a significant impact. In fact, the reliance on rules, lack of labelled data and visual nature of table recognition in documents resembles research in the early days of object recognition in images. Table detection refers to detecting the boundary of a table, while cell structure recognition generates the logical relations of cells and their contents inside a table, e.g., identification of all cells within the same row or column inside the table. Although straightforward for humans, accurately reconstructing table boundary and cell structure information from PDF or image documents is difficult for automated systems due to the wide variety of styles, layout and content tables have across heterogeneous document sources [11]. Such visual “clues” often conflict across sources, e.g., examples in Figure 1.
Unfortunately, conventional rule-based or statistical techniques for table extraction often fail to generalize as they rely heavily on hand-crafted features like graphical lines or bold font, which are not robust to style variations across different document formats. Compared to these approaches, vision-based deep learning methods have two advantages. First, by working directly on images, they can be applied to any document renderable to an image, including PDF. They do not rely on programmatic PDF encodings such as graphical line, spacing and font attributes which rule-based approaches require. Second, if a large annotated dataset for tables is available, models can be pretrained and then finetuned using a small amount of in-domain labels. However, few vision-based deep learning models for table extraction that have been proposed, with most existing deep learning approaches directly use off-the-shelf object detectors [24, 26, 18] without any major architectural adaptation.
To tackle cell structure recognition, rule-based and statistical machine learning approaches are commonly used [8]. Recent deep learning approaches either output structure as text with a image-to-sequence method [34, 18], or generate structure after detecting related objects in the table. Although object detection also needs a box to structure conversion step when compared to end-to-end sequence generation, the visualized bounding boxes of object detection methods are easier for humans to interpret and correct, which leads to better results [11]. Most existing work on object detection-based methods detect entire rows and column separately, and represents the intersection of detected rows and columns as cells [26, 33]. Such an approach has limitations in accurately detecting structure of complex tables with rows or columns which do not span the entire table or align well. Our proposed Global Table Extractor (GTE) adapts vision-based models to the table identification and cell structure recognition problem, and achieves state-of-the-art results by addressing limitations of existing work as follows. First, GTE improves object detectors by explicitly enforcing the model to learn the natural constraint of tables: A table must contain certain amount of cells inside it and a cell cannot exist outside of the table. In other words, the model should not only focus on the tables, but also pay attention to the cells inside. Second, we propose to detect each cell directly instead of detecting entire rows and columns separately since cells are more visually distinct as object units and this approach naturally supports tables with rows and columns not spanning the entire table. Third, current object detection models focus on the local area around objects, which neglects the global style of tables that determine cell appearance. To leverage the information of the whole table, we propose a hierarchical system of networks where we discriminate the global context first, the table style. The table image is then fed into different object detectors specialized for different styles. After cell bounding boxes are detected, we invent a cell cluster-based algorithm to generate cell structures. In summary, our contributions are as follows:
-
1.
We present our systematic framework for vision-guided joint table detection and cell structure recognition, GTE, which outperforms previous systems on the ICDAR 2013 and 2019 table competition benchmark.
-
(a)
We leverage a cell detection network to guide the training of the table detection network.
-
(b)
We present a hierarchical network and a novel cluster-based algorithm for cell structure recognition by classifying tables, detecting cells and convert this into structure with spatial clustering.
-
(a)
-
2.
We design a method to automatically create ground-truth labels for table recognition and use it to enhance PubTabNet[36] and create FinTabNet, which are large datasets from real-world data sources with fine-grained cell structure annotation for table related tasks. PubTabNet enhancements are now available and we intend to release FinTabNet publicly (subject to legal evaluations) to address the lack of such labelled data.
2 Related Work
2.1 Table Detection
Rule-based methods were among the earliest proposed approaches for locating tables inside a document [9, 10, 13, 5, 27]. Such rules mainly focus on text-block arrangement, horizontal and vertical lines, and item blocks. Rule-based systems perform well on some documents, but require extensive human effort to summarize rules and often fail to generalize to other domains or across heterogeneous table formats. Statistical machine learning approaches have been proposed to fill these gaps. Unsupervised methods use bottom-up clustering of word segments [17]. Examples of supervised methods include learning a MXY tree to represent a table [2], learning a Hidden Markov Model designed for table structure [32] and learning a SVM to classify tables using line information [15]. Semi-supervised methods have also been proposed to leverage unlabelled documents [3]. Recently, data-driven vision based approaches have been used to detect tables by adapting state-of-the-art object detectors such as Faster-RCNN to table detection [26, 18, 6].
2.2 Cell Structure Recognition
Earliest successful system is the rule-based T-RECS by evaluating horizontal and vertical structure of words [17]. Wang et al. presented a seven-step process similar to the X - Y cut algorithm to improve the previous system with statistical learning approaches from a training corpus [35]. Shigarov et al. decomposed tables by offering configuration of algorithms, thresholds and rule sets based on PDF metadata [29]. Recently, there is a trend from rule-based and statistical machine learning to deep learning methods in table recognition. Deep learning approaches include two categories: (a) End-to-end image-to-sequence models [18, 36]; (b) Object detection based methods [26, 33, 23].
2.3 Existing Datasets
During the development of GTE, we found few existing datasets with any kind of structure annotation. We required a dataset with a large number of labelled examples where each table cell is annotated with its pixel-coordinate location, logical coordinates inside the table structure (e.g., row-span and col-span) and cell text contents. Although the ICDAR2013 dataset met the annotation requirements, only 254 table examples (96 train and 156 test from the competition) were available, which were from European Union and US Government reports [8]. TableBank has 145K labelled tables, but provides only logical coordinates of cells in the table [18]. While in the enhanced PubTabNet and FinTabNet dataset, annotations give detailed information on the logical structure as well as the location and contents of each cell, similar to the ICDAR2013 competition. Very recently, a new ICDAR2019 table competition was held with not PDF files but images of document pages [4]. It contains in total 80 documents for table structure recognition, including both modern and handwritten archival documents. They do not have a training set for modern documents, only some for testing. Other existing datasets only contain table boundary information [28, 31].
3 PubTabNet, FinTabNet
As shown above, there is a lack of large scale datasets for cell structure recognition. To fill this gap, we designed a novel method to automatically match PDF and HTML documents in order to generate a large and comprehensive table recognition dataset. We collaborated with the authors of PubTabNet to enhance the dataset with cell labels, which was originally sourced from PubMed scientific articles. We also worked with them to make a subset of PubLayNet and PubTabNet such that each page has full table and cell information, which we call PubXNet. To generate the cell structure labels, we use token matching between the PDF and HTML version of each article. From the HTML, we know the logical structure of the table cells and from the PDF, we know the cell and table boundary location. PubTabNet contains more than 568k tables and PubXNet contains more than 24K pages.
On top of enhancing PubTabNet, we also created FinTabNet, which is a large dataset containing complex tables from the annual reports of the S&P 500 companies. Financial tables often have very different styles when compared to ones in scientific and government documents, with fewer graphical lines and larger gaps within each table and more colour variations. There are more than 70K pages with full table bounding box and structure annotations (train/val/test= 61801/7191/7085) and more than 110k tables with cell bounding boxes (train/val/test= 91596/10635/10656). The test and validation split are retrieved at the company level with 50 companies in each and companies were selected to have a similar number of tables such that the test sets are not biased towards a particular company.
4 Methods
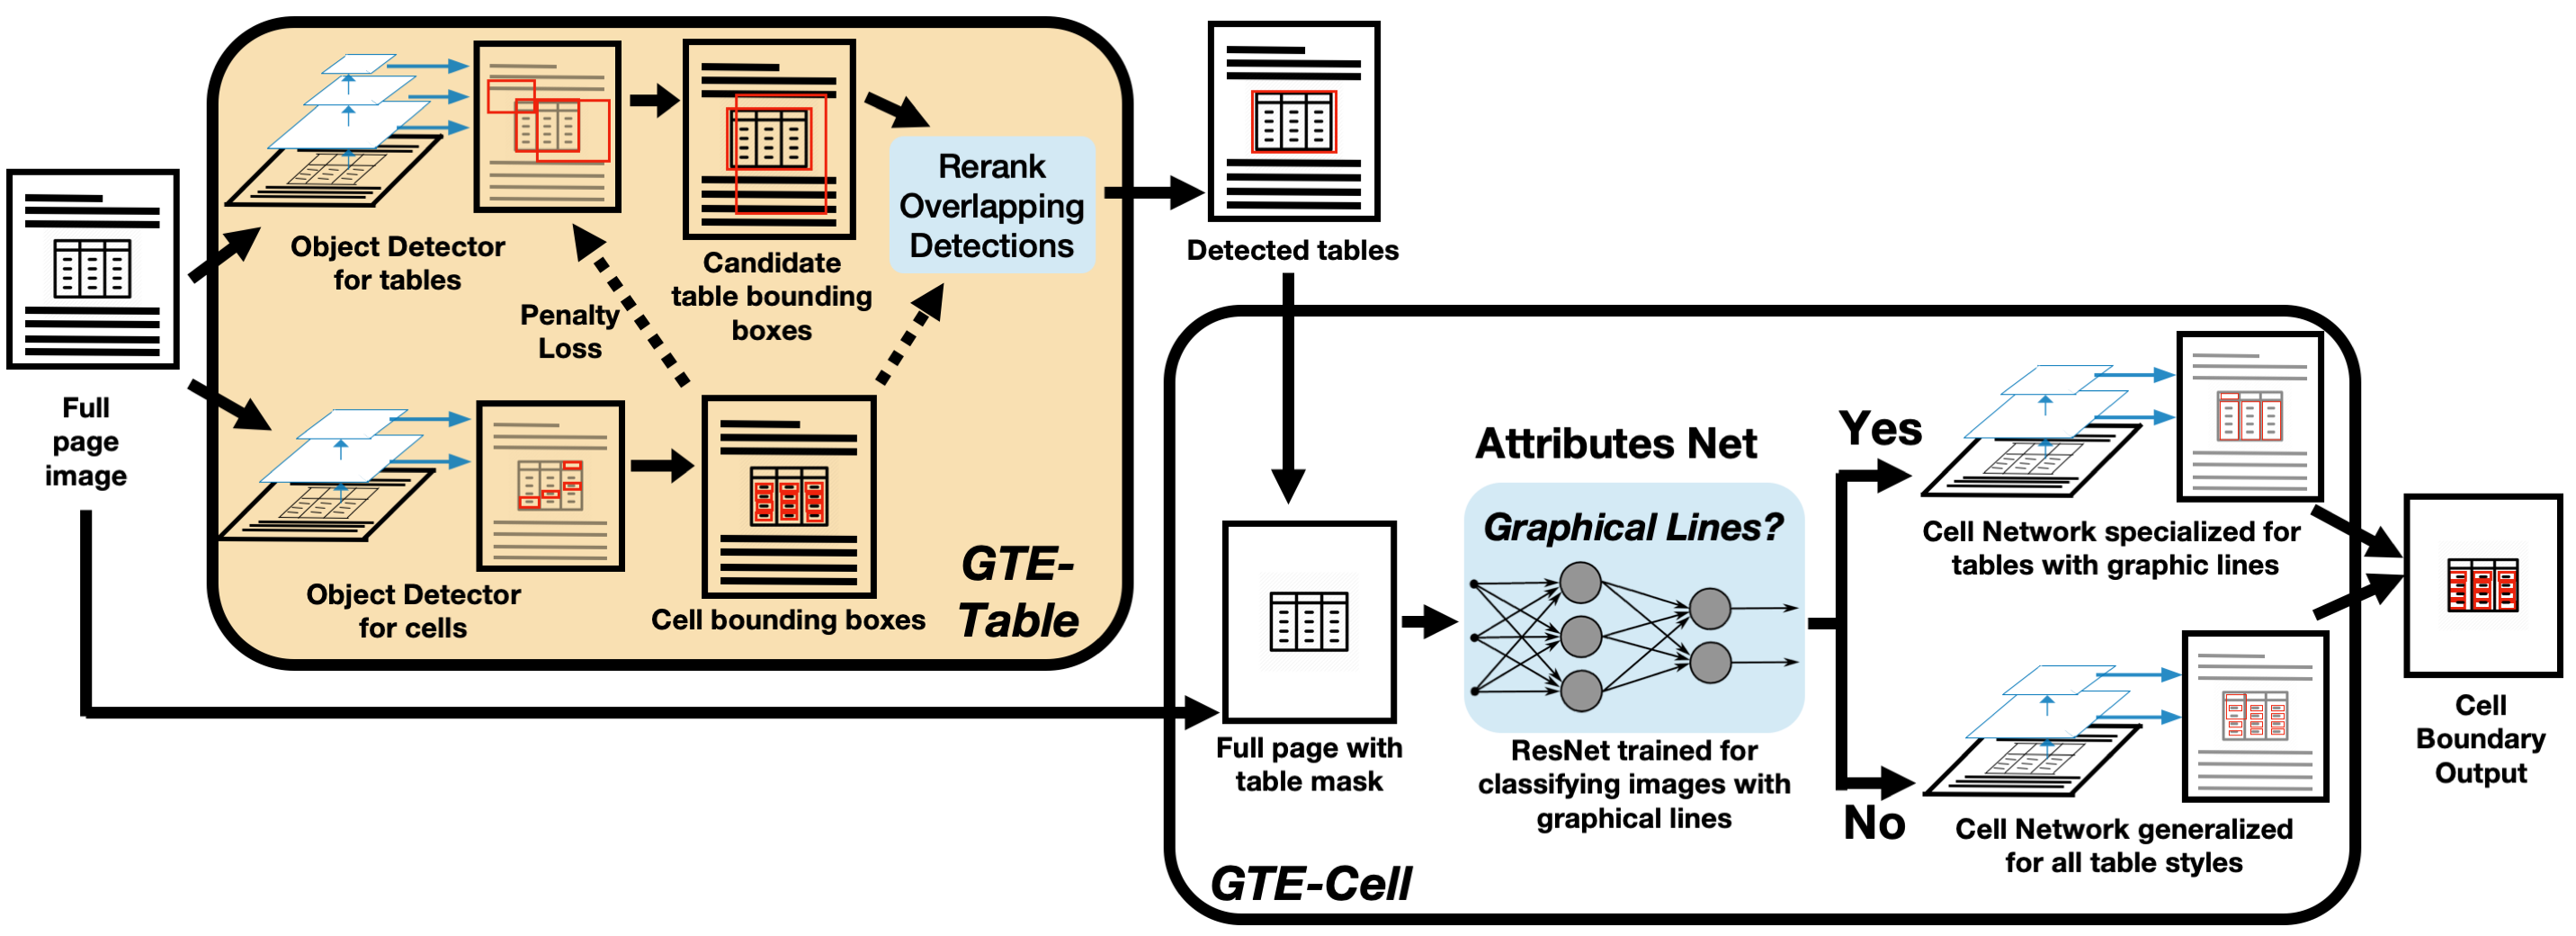
As shown in Figure 2, our full GTE framework consists of a series of vision-based neural networks. Each of the main object detection networks use context from the output of the other networks. The framework could be adapted to any kind of object detector. The table boundary network (GTE-Table) uses a cell detection network by leveraging the fact that tables must contain at least some cells. The cell structure recognition network (GTE-Cell) uses table boundaries from the table boundary network(GTE-Table) and table-level style information (Attributes Net).
4.1 GTE-Table
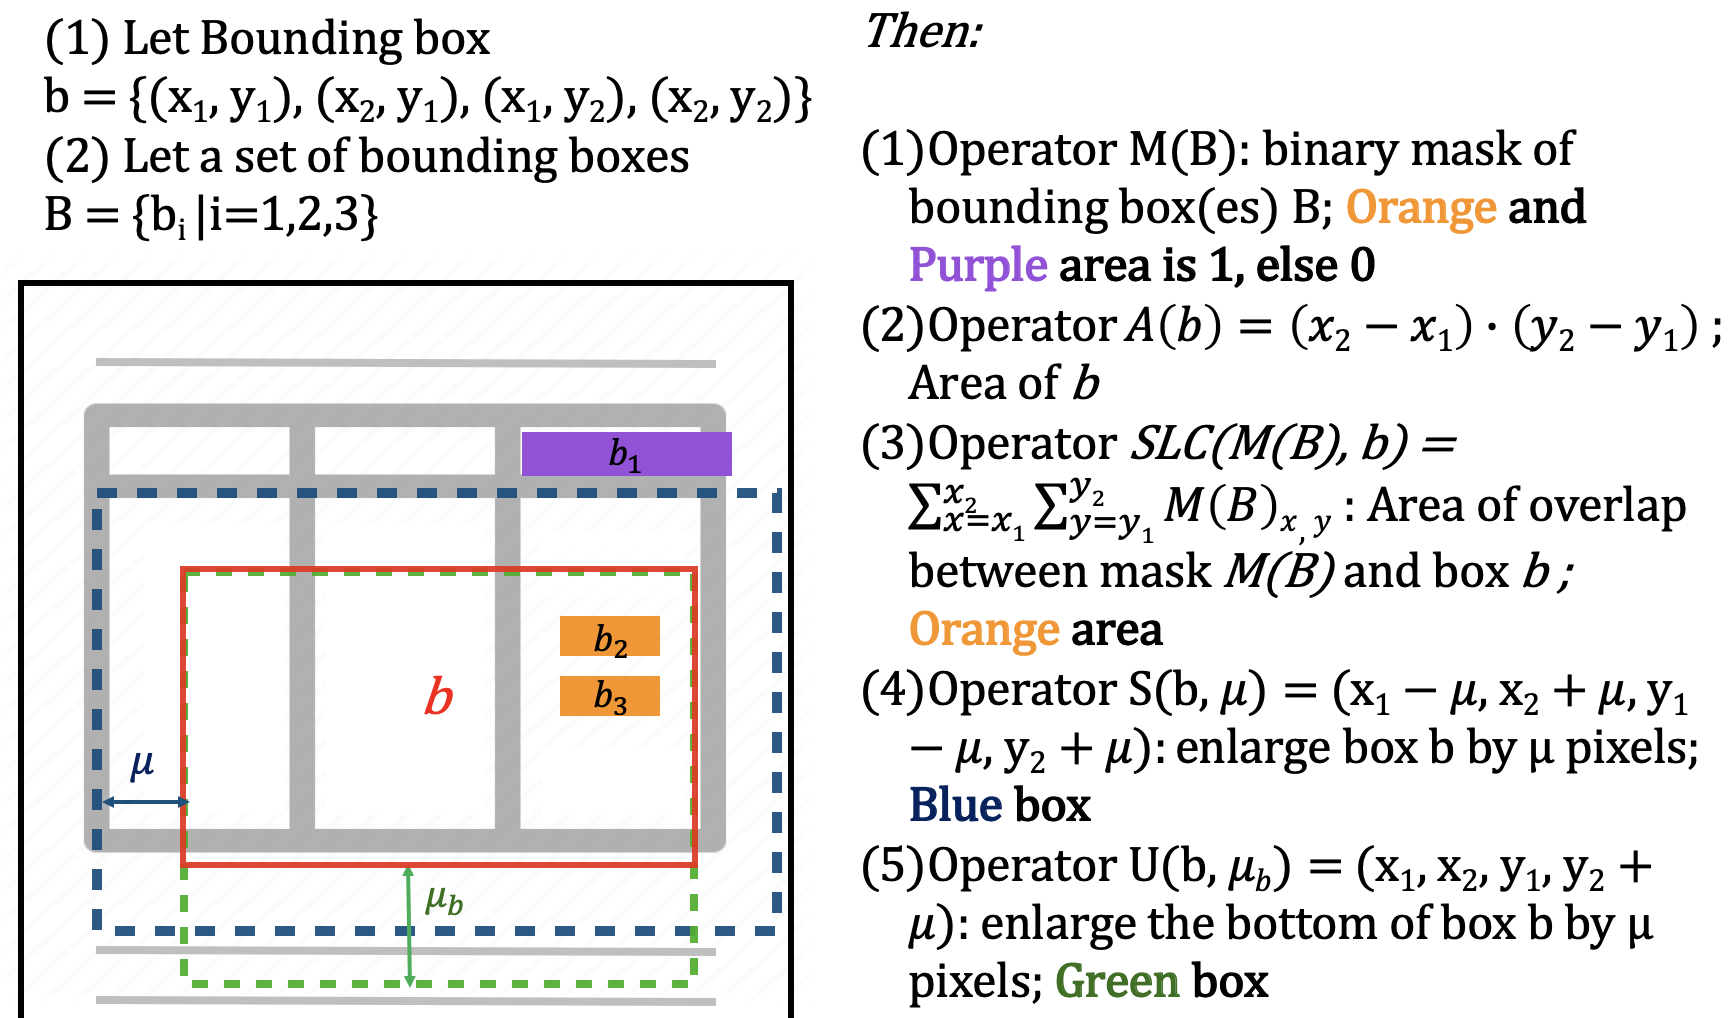
In the training stage, besides the regression and classification loss, we add a piecewise constraint loss. It penalizes the detection probability of unrealistic tables when considering cell locations. This novel cell constraint based loss function may be added to any detection network. We formalize the terminologies of this section here. We make the following definitions in Fig. 3. We used the guided cell network to generate a set of cell bounding box(es) . The cells are detected by a simpler non-hierarchical version of our GTE-Cell network that is trained on only original full-page document pages, without knowing the location of the tables. Given , we define two Boolean operators where inputs are an inner box() and outer box(), which define the boundaries of the mask input area:
Where C is true if the area covered by the cells between and is at most times the area of the minus area of the . D is true if any cells exist in the area between and . The penalty indicator is defined as
The penalty indicator is true when any of the following conditions are true:
-
•
: Less than of the whole table has cells.
-
•
: Less than of the area just inside the table has cells.
-
•
: The area just outside of the table contains any cells.
-
•
: Less than of the area at just inside the bottom of the table has cells.
Then the constraint loss() is
| (1) |
where is the table detection probability function. We choose , , , , , in our experiments. Additionally, one of the input image channels to the table network is replaced with a mask generated from the prediction of cells to further aid training.
In the inference stage, instead of the widely used non-max suppression, our ranking of proposed bounding boxes not only consider detection probabilities, but also the presence of cells inside and outside the table. We define Constraint Coefficient(CCoef) for each bounding box, where . For each boundary of the table bounding box, we calculate the amount of cells just outside subtracted by the amount of cells just inside the table. For any pair of bounding boxes overlapped with each other more than , and , we discard the bounding box with higher . We choose , , , in our experiments. The hyper-parameters are described in more details in Supplemental material. Here it suffices to say that they are chosen, in a straightforward way, based on characteristics of tables in typical documents; to give some intuition of the concrete values, in the above, a value of 5 reflects half of the height of a character (10 pixels), while 20 corresponds to two lines of text.
4.2 GTE-Cell
Tables in the real world often adhere to a global style that determines the rules and meanings of its components. For example, there are some tables that have visible vertical and horizontal ruling lines for every row and column, easily defining cell boundaries. However, there are other styles that have no ruling lines or only intermittent breaks. In such a case, a model that only looks at its local surroundings, such as most object detection networks, would not be able to ascertain whether a ruling line represents the start of a new cell. Empirically, we also found that mixing different styles of tables in training worsens model performance on some data, even though this used more training data. In our framework, we first train an attribute network aimed at classifying the presence of vertical graphical ruling lines in the table. The output of this network determines which of two cell detection networks is used, which were trained with different augmentation schemes. The “no lines” scheme erases all existing graphic lines and “full boundaries” adds in vertical and horizontal boundaries for every row and column at the median point between cells. The network specialized on tables with graphical lines is trained on the original plus “full boundaries” data while the other network is trained on the original and all augmentations.
To convert the bounding box output into a logical structure, we first align cell boxes to text lines as extracted from the PDF. Then, we determine the number of rows and columns by sampling in the vertical and horizontal directions, respectively. Before sampling in the vertical direction to determine the number of rows, we expand the left and right edges of cells while it is not overlapping with existing cells, to account for rows with missing cells. If there are graphical lines available, we ensure that the number of rows or columns detected are at least equal to the number of unique inner lines plus one. Then, we infer the vertical and horizontal alignments of the table by which edge of the cell box has the best alignment with other cells. We use K-means clustering on cell bounding box coordinates to define row and column locations. Then, we assign row and column positions to each cell based on their box locations, merging cells when necessary. Finally, we leverage the fact that cell content generally starts with a capital letter. Therefore, cells that start with a small case is likely a case of over-splitting. We merge these cells with the cell above. Also, we perform some post-processing steps. This includes assigning locations to leftover text boxes that were not overlapping with any detected cells and we split cells in certain cases when there are gaps nearby. Before producing the final logical structure of each cell in the table, we increase the row and column span of cells when the text box intersects with neighboring empty rows or columns as this is likely a hierarchical cell spanning multiple rows or columns. Our clustering-based algorithm is more efficient than a greedy or exhaustive search method that selects each cell sequentially. As well, many of our steps are designed to be robust against cell detection errors. For more details, see Algorithm 1 in the supplementary material.
| Category | Method | Input type | Recall | Precision | F1 | Cpt | Pu |
| Commercial Softwares | FineReader | 99.71 | 97.29 | 98.48 | 142 | 148 | |
| Non Deep Learning | Nurminen[8] | 90.77 | 92.10 | 91.43 | 114 | 151 | |
| Deep Learning | TableBank[18] | Image | / | / | 96.25 | / | / |
| Ours | GTE | Image | 99.77 | 98.97 | 99.31 | 147 | 146 |
| Ablation | Detection-Base | Image | 84.64 | 90.65 | 84.65 | 68 | 97 |
| GTE-Table-Sep | Image | 95.71 | 98.18 | 95.71 | 140 | 150 |
5 Experiments
5.1 Datasets
We perform extensive experiments on both the table detection and cell structure recognition tasks in the widely used ICDAR2013 table competition [8]. This dataset is considered as a standard benchmark dataset in PDF table extraction. It contains 96/156 tables for training/testing collected from European Union and US Government reports. Since the in-domain dataset is very small, pretraining the model on other datasets is required. For table detection, we pretrain the model on the combination of TableBank([18]) and PubTabNet; For cell structure recognition, we pretrain the model on PubTabNet.
We also conduct additional experiments on ICDAR2019 as well as the PubTabNet and FinTabNet datasets.
5.2 Evaluation Metrics
For ICDAR2013, We use the official evaluation script of ICDAR2013 table competition [8]. For ICDAR 2013 table detection, the metrics are character-level Recall (Rec.), Precision (Prec.) and F1-measure op(F1), averaged per document, along with Purity (Pu) and Completeness (Cpt). Consider is the set of test documents, then they are defined as follows:
5.3 Experimental Setup
5.3.1 Training and Inference Details
We leverage TableBank and PubTabNet table boundary to pretrain the object detection network before fine-tuning on the ICDAR train set for the table boundary detection task[20]. We use the architecture of RetinaNet with Resnet50-FPN backbone as our base object detection model [20, 19]. We use resolution of 643 by 900 for tables, and 965 by 1350 for cells, as cells need higher resolutions to distinguish. We redesigned the feature pyramid network for tables and cells such that there are fewer detection layers than a typical object detection network but this allows for finer-grained anchor boxes for cells and larger object boxes for tables without sacrificing computational efficiency. We add anchors with aspect ratio 0.1 and 0.25 for each feature map to catch commonly appearing wide tables and cells. In the cell network, since the objects are really dense, we use anchors of sizes 0.5, 0.7, 1, 1.2, 1.6 of the set of aspect ratio anchors. We add additional smaller scale anchors because many cells are much smaller than the anchors. In the table network, we run each page at test time at multiple zoom scales to help improve detection of abnormally small or large tables. All the object detection models in GTE are initialized with the parameters pretrained on MS COCO dataset [21].
5.4 Experimental Results
5.4.1 Table Detection
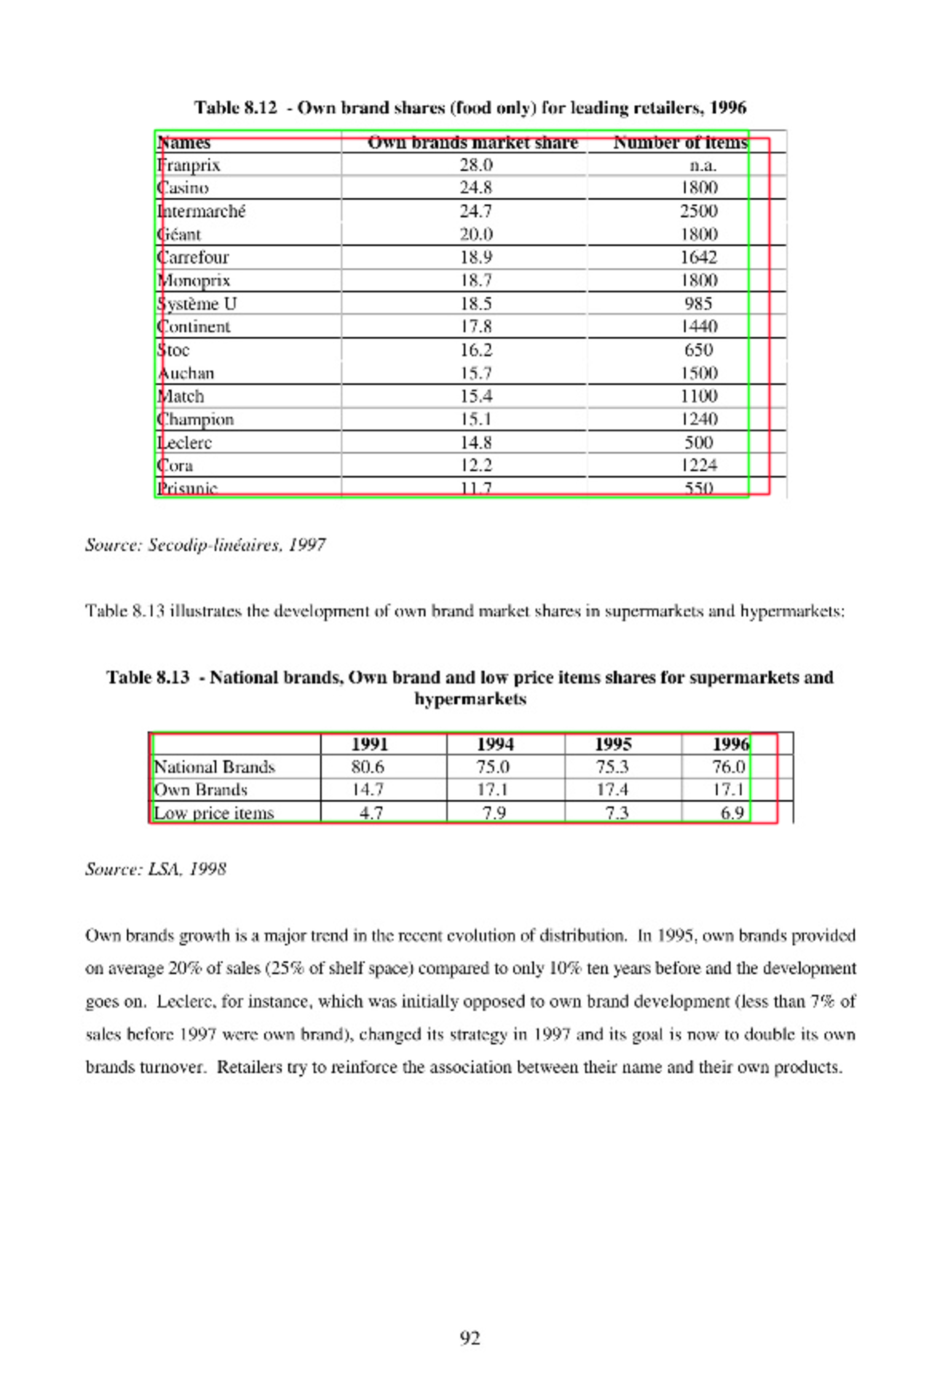
As reported in Table 1, GTE-Table achieves the best character-level F1 measure among all methods. Although FineReader slightly outperforms GTE on purity, the higher F1-measure for GTE indicates GTE produces higher quality boundaries closer to ground-truth. Since the purity metric penalizes all incorrect table boundaries equally, it does not provide “partial-credit” for almost correct answers in the same manner as character F1-measure for cases where the predicted boundary only includes a few extra characters. Figure 4 shows some correctly detected table boundaries as well as some failures. In general, we see three types of errors, partial under-detection, where some parts of the ground truth table is missing, partial over-detection, where some text outside of the ground truth is mistakenly included and mis-detection, where a non-table entity such as a chart was misidentified as a table. We do not see any cases of table non-detection in our ICDAR2013 test results and only one case of mis-detection. Overall, most partial detections are only missing or adding one or two extra lines, such as a short captions in the table.
5.4.2 Table Detection Ablation Study
As shown by the additional experimental results in Table 1, the base detection network trained to perform the cell and table detection task simultaneously (Detection-base) performs far worse than the more specialized networks. There are two main reasons behind this. First, TableBank data cannot be leveraged when pretraining the networks because it lacks cell bounding boxes annotations [18] so it is only trained of PubTabNet and finetuned on ICDAR training data. Second, tables and cells are of two completely different scales where it is hard to choose an appropriate resolution to generate anchors fitting the two scales. On the other hand, it is still important for the cell network and table network to leverage each other’s information, as shown by the nearly 3% boost in F1 accuracy as compared to the regular object detection losses (GTE-Table-Sep) that do not use information from other networks.
5.4.3 Cell Structure Recognition
As reported in Table 2, GTE-Cell outperforms all previous methods and commercial software in all metrics even without using any PDF encodings (ruling lines, rendering techniques, etc). All results are from cell detection on outputs produced from table detection by each framework, not the ground truth table. When analyzing the qualitative results in Figure 5, we see cell boundary detection often generates a detection box that is too short for very long lines of text. This is a key limitation of the anchor-based object detection system, which has difficulties with aspect ratios differing greatly from ones in the configuration. As well, in the case of tables without graphical lines at every row and column, the model may mistakenly merge multiple cells into one. In many cases, our post-processing boundary to structure algorithm is robust to some of these mistakes are still able to generate a correct or nearly correct structure output. We see three main types of detection errors that can lead to incorrect structure output. There are overmerged cell detection, where two or more cells are incorrectly merged together, oversplit cell detection, where one cell has been incorrectly split into multiple cells and cell non-detection, where there is no predicted bounding box that includes such a cell. These errors can lead to a number of inaccuracies in the boundary to cell structure process, including incorrect number of rows and columns, alignment and of course final cell location assignment as well. Examples of such errors are in the supplementary material.
5.4.4 Cell Structure Ablation Study
To analyze our GTE-Cell network further, we compare the several variations in Table 2 using ground truth table borders. Firstly, the baseline detection network (Detection-Base) that performs both cell and table detection has very poor recall and precision. For networks specialized for cell detection, we see that the model pretraining on the PubTabNet dataset gives a boost when compared to GTE-Cell-Style-Mix-no-pt. We also test each of the sub detection networks (GTE-Cell-Style-Mix for the network trained on all augmentations and GTE-Cell-Border trained on original and graphical line augmentations). The full hierarchical model GTE-Cell-Hierarchical performs better than both individual sub-models, showing that it is indeed helpful to first determine the style of the table and then use the model trained on data most similar to it. Out of 156 total test tables in ICDAR2013, there are 108 with at least some vertical graphical lines (69.23%). To note, our attributes network (graphical line table classifier) was correct in 123 out of 156 tables (78.84%). The errors generally come from very small tables or tables with vertical graphical lines that only span the header, which is an ambiguity also present in the training data. To help mitigate this error, during the row and column sampling step, we keep track of the standard deviation of the sampling points. If this value is high, it likely indicates that the cell detection model used was not suitable for the given table as tables tend to have similar number of columns and rows throughout, thus we would then use the alternate cell model.
5.4.5 Experiments with Additional Datasets
To demonstrate the robustness of our network on more complex tables and ones outside of the training data domain, we tested the same model on ICDAR2019, PubTabNet, and FinTabNet (Table 3). For ICDAR2019 table border task (Table 4), our score is comparable to the top method. However, it can be difficult to really differentiate as we found that many of our table detections are correct but the annotations themselves are inconsistently including or excluding whitespace. Therefore, we believe that the IOU=0.9 measure is not reliable without determining the amount of text correctly included. We also adapt our model output for task B2 for modern documents (trained on FinTabNet as no training data is provided) to demonstrate our full recognition system and we show significant improvements to both the competition top-performer as well as more recent results(Table 5). We believe that the IOU at lower thresholds is a more accurate measure for this task similar to our reasoning for table border as we found that many of our structure is exactly correct when looking at the text extracted but is shown as 0 at IOU=0.9 as the small text boxes are a bit shifted from the label without cutting off any text so we show results for IOU=0.1 as well. Examples of this ambiguity is displayed in the supplement.
For PubTabNet and FinTabNet data, we use TEDS scoring (see details in [36]) to be consistent with the original PubTabNet paper. However, these numbers are not directly comparable as our results are on the PDFs from the validation set. The test set has not been made available. Additionally, we noticed that the original dataset inconsistently included bolding and italics that are not in the original table image, we therefore modified the original evaluation script to ignore these styling tags. Nevertheless, our TEDS of 93.01 compares well to the original score of 88.38. We also show good table and structure recognition scores on our new FinTabNet dataset both in cases where the model was and was not finetuned. It performs much better than the detection-base, showing that our model improvements transfer to other document domains.
| Dataset | Method | Task | FT? | Table F1 | TEDS |
| PTN | GTE | Structure | Y | NA | 93.01 |
| FTN | Det-Base | Table | N | 81.17 | NA |
| FTN | GTE | Table | N | 89.97 | NA |
| FTN | GTE | Table | Y | 95.29 | NA |
| FTN | Det-Base | Structure | N | NA | 41.57 |
| FTN | GTE | Structure | N | NA | 87.14 |
| FTN | GTE | Structure | Y | NA | 91.02 |
6 Conclusion and Future Work
In summary, we have demonstrated a vision based table extraction framework with state-of-the-art results. It can perform the full pipeline of table recognition, from document to table structure, which can be used easily for down-stream analysis. Our framework leverages the global visual context of tables, including the style and rules in the relationship between cells and tables. As well, we have released the enhanced PubTabNet dataset and will release FinTabNet, which we hope will help others using data hungry methods to tackle table-related problems. Our vision based method is very easily merged with Optical Character Recognition (OCR) methods to perform table recognition fully from images.
References
- [1] D. Burdick, M. Danilevsky, A. V. Evfimievski, Y. Katsis, and N. Wang. Table extraction and understanding for scientific and enterprise applications. Proceedings of the VLDB Endowment, 13(12):3433–3436, 2020.
- [2] F. Cesarini, S. Marinai, L. Sarti, and G. Soda. Trainable table location in document images. Object recognition supported by user interaction for service robots, 3:236–240 vol.3, 2002.
- [3] M. Fan and D. S. Kim. Table region detection on large-scale PDF files without labeled data. CoRR, abs/1506.08891, 2015.
- [4] L. Gao, Y. Huang, H. Déjean, J.-L. Meunier, Q. Yan, Y. Fang, F. Kleber, and E. Lang. Icdar 2019 competition on table detection and recognition (ctdar). In 2019 International Conference on Document Analysis and Recognition (ICDAR), pages 1510–1515. IEEE, 2019.
- [5] B. Gatos, D. Danatsas, I. Pratikakis, and S. J. Perantonis. Automatic table detection in document images. In ICAPR, 2005.
- [6] A. Gilani, S. R. Qasim, M. I. Malik, and F. Shafait. Table detection using deep learning. 2017 14th IAPR International Conference on Document Analysis and Recognition (ICDAR), 01:771–776, 2017.
- [7] M. C. Göbel, T. Hassan, E. Oro, and G. Orsi. A methodology for evaluating algorithms for table understanding in pdf documents. In ACM Symposium on Document Engineering, 2012.
- [8] M. C. Göbel, T. Hassan, E. Oro, and G. Orsi. Icdar 2013 table competition. 2013 12th International Conference on Document Analysis and Recognition, pages 1449–1453, 2013.
- [9] E. J. Green and M. S. Krishnamoorthy. Recognition of tables using grammars. 1995.
- [10] Y. Hirayama. A method for table structure analysis using dp matching. Proceedings of 3rd International Conference on Document Analysis and Recognition, 2:583–586 vol.2, 1995.
- [11] J. Hoffswell and Z. Liu. Interactive repair of tables extracted from pdf documents on mobile devices. In CHI, 2019.
- [12] Y. Hou, C. Jochim, M. Gleize, F. Bonin, and D. Ganguly. Identification of tasks, datasets, evaluation metrics, and numeric scores for scientific leaderboards construction. arXiv preprint arXiv:1906.09317, 2019.
- [13] J. Hu, R. S. Kashi, D. P. Lopresti, and G. T. Wilfong. Medium-independent table detection. In Document Recognition and Retrieval, 1999.
- [14] Y. Huang, Q. Yan, Y. Li, Y. Chen, X. Wang, L. Gao, and Z. Tang. A yolo-based table detection method. In 2019 International Conference on Document Analysis and Recognition (ICDAR), pages 813–818, 2019.
- [15] T. Kasar, P. Barlas, S. Adam, C. Chatelain, and T. Paquet. Learning to detect tables in scanned document images using line information. In 2013 12th International Conference on Document Analysis and Recognition, pages 1185–1189, Aug 2013.
- [16] I. Kavasidis, S. Palazzo, C. Spampinato, C. Pino, D. Giordano, D. Giuffrida, and P. Messina. A saliency-based convolutional neural network for table and chart detection in digitized documents. ArXiv, abs/1804.06236, 2018.
- [17] T. Kieninger and A. Dengel. The t-recs table recognition and analysis system. In Document Analysis Systems, 1998.
- [18] M. Li, L. Cui, S. Huang, F. Wei, M. Zhou, and Z. Li. Tablebank: Table benchmark for image-based table detection and recognition. ArXiv, abs/1903.01949, 2019.
- [19] T.-Y. Lin, P. Dollár, R. B. Girshick, K. He, B. Hariharan, and S. J. Belongie. Feature pyramid networks for object detection. 2017 IEEE Conference on Computer Vision and Pattern Recognition (CVPR), pages 936–944, 2016.
- [20] T.-Y. Lin, P. Goyal, R. B. Girshick, K. He, and P. Dollár. Focal loss for dense object detection. 2017 IEEE International Conference on Computer Vision (ICCV), pages 2999–3007, 2017.
- [21] T.-Y. Lin, M. Maire, S. J. Belongie, L. D. Bourdev, R. B. Girshick, J. Hays, P. Perona, D. Ramanan, P. Dollár, and C. L. Zitnick. Microsoft coco: Common objects in context. In ECCV, 2014.
- [22] P. Pasupat and P. Liang. Compositional semantic parsing on semi-structured tables. In ACL, 2015.
- [23] D. Prasad, A. Gadpal, K. Kapadni, M. Visave, and K. Sultanpure. Cascadetabnet: An approach for end to end table detection and structure recognition from image-based documents. In Proceedings of the IEEE/CVF Conference on Computer Vision and Pattern Recognition Workshops, pages 572–573, 2020.
- [24] S. Ren, K. He, R. B. Girshick, and J. Sun. Faster r-cnn: Towards real-time object detection with region proposal networks. IEEE Transactions on Pattern Analysis and Machine Intelligence, 39:1137–1149, 2015.
- [25] M. Rotmensch, Y. Halpern, A. Tlimat, S. Horng, and D. Sontag. Learning a health knowledge graph from electronic medical records. Scientific reports, 7(1):1–11, 2017.
- [26] S. Schreiber, S. Agne, I. Wolf, A. Dengel, and S. Ahmed. Deepdesrt: Deep learning for detection and structure recognition of tables in document images. 2017 14th IAPR International Conference on Document Analysis and Recognition (ICDAR), 01:1162–1167, 2017.
- [27] F. Shafait and R. Smith. Table detection in heterogeneous documents. In Document Analysis Systems, 2010.
- [28] A. Shahab, F. Shafait, T. Kieninger, and A. Dengel. An open approach towards the benchmarking of table structure recognition systems. In Document Analysis Systems, 2010.
- [29] A. O. Shigarov, A. A. Mikhailov, and A. Altaev. Configurable table structure recognition in untagged pdf documents. In DocEng, 2016.
- [30] S. A. Siddiqui, M. I. Malik, S. Agne, A. Dengel, and S. Ahmed. Decnt: Deep deformable cnn for table detection. IEEE Access, 6:74151–74161, 2018.
- [31] N. Siegel, N. Lourie, R. Power, and W. Ammar. Extracting scientific figures with distantly supervised neural networks. In JCDL, 2018.
- [32] A. C. e. Silva. Learning rich hidden markov models in document analysis: Table location. In Proceedings of the 2009 10th International Conference on Document Analysis and Recognition, ICDAR ’09, pages 843–847, 2009.
- [33] C. Tensmeyer, V. I. Morariu, B. Price, S. Cohen, and T. Martinez. Deep splitting and merging for table structure decomposition. In 2019 International Conference on Document Analysis and Recognition (ICDAR), pages 114–121. IEEE, 2019.
- [34] O. Vinyals, A. Toshev, S. Bengio, and D. Erhan. Show and tell: A neural image caption generator. 2015 IEEE Conference on Computer Vision and Pattern Recognition (CVPR), pages 3156–3164, 2014.
- [35] Y. Wang, I. T. Phillips, and R. M. Haralick. Table structure understanding and its performance evaluation. Pattern Recognition, 37:1479–1497, 2004.
- [36] X. Zhong, E. ShafieiBavani, and A. J. Yepes. Image-based table recognition: data, model, and evaluation. arXiv preprint arXiv:1911.10683, 2019.