TESS Asteroseismic Analysis of the Known Exoplanet Host Star HD 222076
Abstract
The Transiting Exoplanet Survey Satellite (TESS) is an all-sky survey mission aiming to search for exoplanets that transit bright stars. The high-quality photometric data of TESS are excellent for the asteroseismic study of solar-like stars. In this work, we present an asteroseismic analysis of the red-giant star HD 222076 hosting a long-period (2.4 yr) giant planet discovered through radial velocities. Solar-like oscillations of HD 222076 are detected around by TESS for the first time. Asteroseismic modeling, using global asteroseismic parameters as input, yields a determination of the stellar mass (), radius (), and age (Gyr), with precisions greatly improved from previous studies. The period spacing of the dipolar mixed modes extracted from the observed power spectrum reveals that the star is on the red-giant branch burning hydrogen in a shell surrounding the core. We find that the planet will not escape the tidal pull of the star and be engulfed into it within about Myr, before the tip of the red-giant branch is reached.
1 Introduction
Thanks to the very long duration and high precision of photometric space observation missions, such as CoRoT (Baglin et al., 2006) and Kepler (Borucki et al., 2010), asteroseismology has made major advances in the understanding of stellar interior physics and evolution. In particular, the detection of oscillations in solar-type and red-giant stars has led to breakthroughs such as the discovery of fast core rotation and a way to distinguish between hydrogen-shell-burning stars and stars that are also burning helium in their cores (see Chaplin & Miglio, 2013, for a review).
With the development of data analysis techniques (e.g., Davies & Miglio, 2016; Lund et al., 2017a; Corsaro & De Ridder, 2014; Corsaro et al., 2015) and improved stellar modeling strategies (e.g., Serenelli et al., 2017; Silva Aguirre et al., 2017), as well as optimization procedures that make use of individual oscillation frequencies (Metcalfe et al., 2010; Jiang et al., 2011; Mathur et al., 2012; Silva Aguirre et al., 2015; Rendle et al., 2019), asteroseismology has also proven to be an efficient tool to estimate fundamental stellar properties such as stellar masses, radii and ages. This, in turn, enables the systematic characterization of exoplanet host stars through asteroseismology, which provides with unmatched precision in the absolute properties of their planets (Ballard et al., 2014; Campante et al., 2015; Silva Aguirre et al., 2015; Lundkvist et al., 2016; Campante et al., 2019; Huber et al., 2019). Furthermore, the synergy between exoplanet research and asteroseismology also enables us to set constraints on the spin-orbit alignment of exoplanet systems (Huber et al., 2013; Benomar et al., 2014; Chaplin et al., 2014a; Lund et al., 2014; Campante et al., 2016a; Kamiaka et al., 2019) and to perform statistical inferences on the orbital eccentricities, through asterodensity profiling (Kane et al., 2012; Sliski & Kipping, 2014; Van Eylen & Albrecht, 2015; Van Eylen et al., 2019).
The NASA‘s Transiting Exoplanet Survey Satellite (TESS) Mission (Ricker et al., 2014) is performing a near all-sky survey for exoplanets using the transit method in an area 400 times larger than that covered by the Kepler mission, reinforcing the synergy between asteroseismology and exoplanet science. Using its dedicated 2-minute cadence and excellent photometric precision observations, TESS is expected to detect oscillations in thousands of solar-like oscillators (Campante et al., 2016b; Schofield et al., 2019), and simulations predict that at least 100 solar-type and red-giant stars observed by TESS will host transiting or nontransiting exoplanets (Campante et al., 2016b). Considering the geometric transit probability of each system detected by the radial velocity (RV) method and the observational strategy of TESS, Dalba et al. (2019) predicted that TESS would observe transits for 11 RV-detected planets in its primary mission. However, only three of these detections were expected to be novel, such that the RV-detected planet was not previously known to transit.
In this paper, we present an asteroseismic analysis of the evolved known host HD 222076, which has a long-period planet detected through RV method. TESS observed solar-like oscillations for HD 222076 for the first time. We use these oscillations in detailed stellar modeling to derive the mass, radius and age of the host star. Detections of oscillations by TESS in the previously known exoplanet-host stars HD 212771 and HD 203949 were reported by Campante et al. (2019), following on the discovery of the first planet transiting a star (TOI-197 or TESS Object of Interest 197) in which oscillations could be measured (Huber et al., 2019).
2 Observations
2.1 High-Resolution Spectroscopy
HD 222076 (TIC 325178933, HIP 116630) is a bright (with apparent TESS magnitude ), spectroscopically-classified red-giant-branch star (K1 III; Houk & Cowley, 1975). It is among the targets of an RV survey of 164 bright G and K giant stars in the southern hemisphere conducted by Jones et al. (2011), with the purpose of studying the effect of the host star evolution on the inner structure of planetary systems. And it is also listed in the Stars With ExoplanETs CATalog (SWEET-Cat, Santos et al., 2013; Sousa et al., 2018), which provides stellar atmospheric parameters and masses for the planet-host stars derived assuming local thermodynamic equilibrium (LTE) and using high-resolution and high signal-to-noise spectra. Based on precise radial velocities obtained with three instruments in two parallel planet-search efforts: the UCLES spectrograph (Diego et al., 1990) on the 3.9 m Anglo-Australian Telescope, the CHIRON spectrograph (Tokovinin et al., 2013) on the 1.5 m telescope at CTIO, and the FEROS spectrograph on the 2.2 m telescope at La Silla (Kaufer et al., 1999), Wittenmyer et al. (2017) reported the detection of a giant planet HD 222076b that has an orbital period of days with a semimajor axis of au, and a minimum mass of (with being the orbital inclination and the mass of Jupiter). A complete list of stellar parameters and relevant literature sources are given in Table 1.
2.2 Broadband Photometry and Gaia Parallax
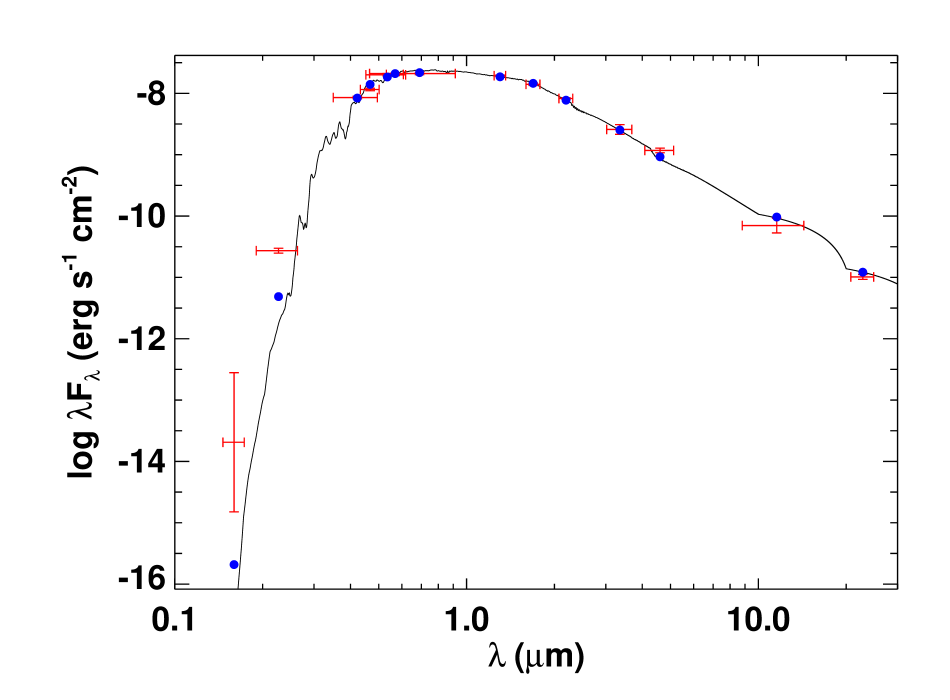
For an independent, empirical determination of the stellar radius, we analyzed the broadband spectral energy distribution (SED) together with the Gaia parallax, following the procedures described in Stassun & Torres (2016); Stassun et al. (2017, 2018a). We obtained the magnitudes from Tycho-2, the magnitudes from APASS, the magnitudes from 2MASS, the W1–W4 magnitudes from WISE, the magnitude from Gaia, and the FUV and NUV fluxes from GALEX. Together, the available photometry spans the full stellar SED over the wavelength range 0.15–22 m (see Figure 1).
We performed a fit using Kurucz stellar atmosphere models, with the priors on effective temperature (), surface gravity (), and metallicity ([Fe/H]) from the spectroscopic parameters listed in Table 1. The remaining free parameter is the extinction (), which we limited to the maximum line-of-sight extinction from the Schlegel et al. (1998) dust maps. The resulting fit is very good (Figure 1) with a reduced of 3.5, and a best fit extinction of . Integrating the (unextincted) model SED gives the bolometric flux at Earth of erg s-1 cm-2. Taking the and together with the Gaia parallax, adjusted by mas to account for the systematic offset reported by Stassun & Torres (2018), gives the stellar radius as .
Combining the bolometric flux with the Gaia DR2 distance allows us to derive a nearly model-independent luminosity, which is a valuable constraint for asteroseismic modeling. Using a Gaia parallax () of mas (adjusted for the mas zero-point offset for nearby stars reported by Stassun & Torres (2018)) with the bolometric flux obtained above yielded .
In addition, we can estimate the stellar mass () from the eclipsing-binary based empirical relations of Torres et al. (2010), which gives . This, together with the empirical radius above, gives the mean stellar density g cm-3. However, we note that for the empirical relations of Torres et al. (2010) are extrapolated, therefore the inferred stellar mass for the of HD 222076 should be regarded with caution.
2.3 TESS Photometry
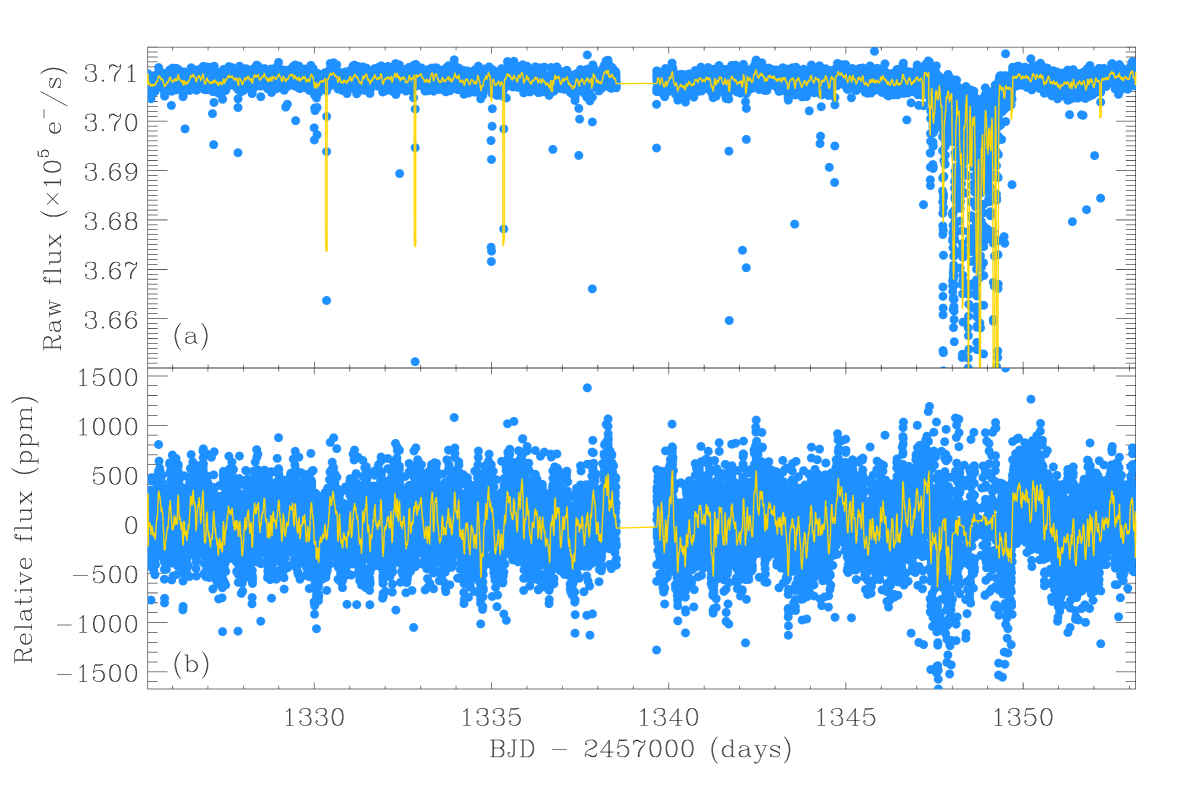
TESS observed HD 222076 in 2-minute cadence during Sector 1 of Cycle 1 for a total of 27.9 days. According to Figure 5(b) of Campante et al. (2016b), with this cadence TESS is predicted to detect solar-like oscillations down to an I-band magnitude (used as a proxy for the TESS magnitude) of around 10, for a star with effective temperature of and luminosity of . Given its TESS magnitude. of 6.59, solar-like oscillations are expected to be detected in the light curve of HD 222076. The light curve was produced using a special version of the photometry pipeline111https://github.com/tasoc/(Handberg & Lund, 2019) maintained by the TESS Asteroseismic Science Operations Center222https://tasoc.dk/ (TASOC; Lund et al., 2017b), which is an extended version of the one adopted in the K2P pipeline (Lund et al., 2015) originally developed to generate light curves for data collected by the K2 Mission. Figure 2(a) shows the raw light curve obtained from the TASOC pipeline. The coverage is nearly continuous with a high duty cycle 96%, displaying a 2 day gap that separates the two spacecraft orbits in the observing sector. A 2.5 days period of high jitter is seen towards the end of the sector, corresponding to instrumental variations due to the spacecraft’s angular momentum dumping cycle, which is evident in light curves from Sector 1. The transit of planet HD 222076b is not detected by TESS due to the short observation period. For asteroseismic analysis, the raw light curves are subsequently corrected for systematic effects using the KASOC Filter (Handberg & Lund, 2014). The corrected light curve is shown in Figure 2(b).
3 Asteroseismic analysis
3.1 Global Oscillation Parameters
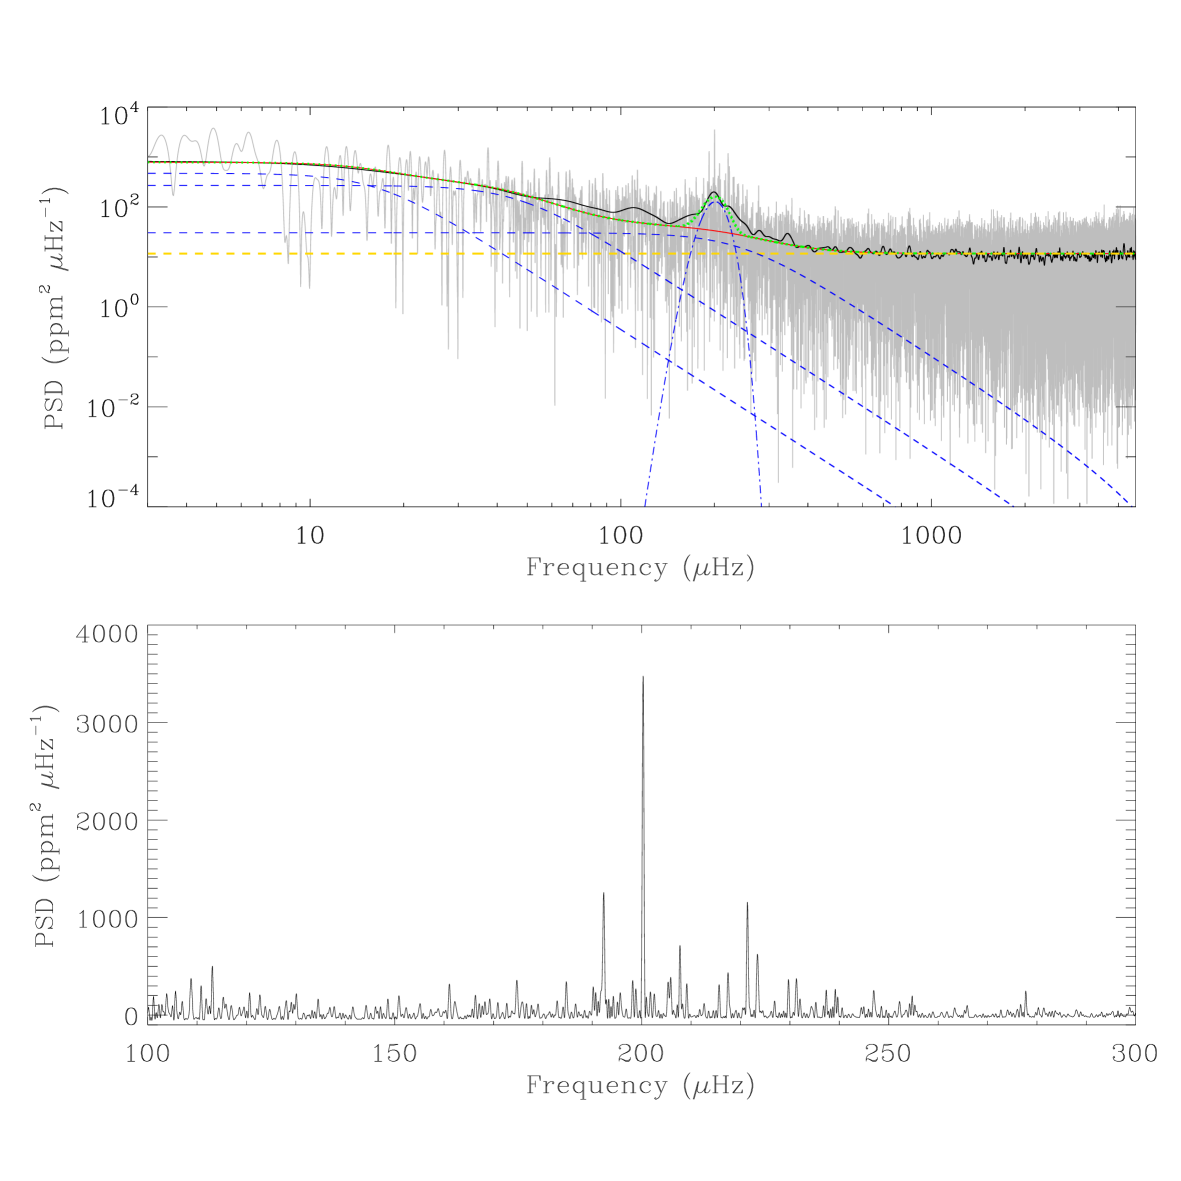
To extract oscillation parameters the corrected light curve was analyzed with several different methods (Kurtz, 1985; Jiang et al., 2011; Corsaro & De Ridder, 2014; Corsaro et al., 2015; Buzasi et al., 2015), many of which have been extensively applied on Kepler/K2 data (e.g., Hekker et al., 2011; Verner et al., 2011). The top panel of Figure 3 illustrates the power spectrum of HD 222076 computed based on the corrected light curve. The power spectrum shows a frequency-dependent background signal due to stellar activity, granulation, and faculae that can be modeled by a sum of several Lorentzian-like functions (Harvey, 1985; Karoff, 2008; Kallinger et al., 2014; Corsaro et al., 2017), and a flat noise. The individual components of the background and the final fit using the method by Jiang et al. (2011) are also shown as dashed blue curves and solid red curve, respectively, in the top panel of Figure 3. Then the total background was subtracted from the power spectrum, and a close-up of the power excess region is shown in the bottom panel of Figure 3.
Next, global seismic parameters such as the frequency of maximum power () and the mean large frequency separation () were measured based on the analysis of the background corrected power spectrum. In summary, was measured by fitting a Gaussian function to the the power excess hump of the smoothed power spectrum (Huber et al., 2009; Hekker et al., 2010; Mathur et al., 2010; Kallinger et al., 2014), as shown in Figure 3. Our analysis yielded . To measure methods like autocorrelation of the amplitude spectrum (Huber et al., 2009; Mosser & Appourchaux, 2009), asymptotic or linear fit to the frequencies of the radial modes (mode degree , mode extraction given in Section 3.2) were used, which gave . We note that the results from different groups for the two parameters agree within a few percent. A comparison of global oscillation parameters derived from different methods, including the ones used in our analysis, is given by Hekker et al. (2011). The values of and were averages over all results reported by different methods. And the uncertainties of the two parameters were calculated from the scatter over all results from different methods. Values for the two parameters are listed in Table 1.
3.2 Individual Mode Frequencies
The background-corrected power spectrum in Figure 3 shows a clear signature of solar-like oscillations: a regular series of peaks spaced by a large separation. Given that TESS instrument artifacts are not yet well understood, we restricted our analysis to the frequency range between 150 to 270 Hz where we observe peaks well above the noise level. In this region we also see multiple peaks due to dipole mixed modes (Beck et al., 2011; Bedding et al., 2011).
Individual frequencies were extracted from the power spectrum with several independent methods ranging from traditional iterative fitting of sine waves, i.e., pre-whitening (e.g. Kjeldsen et al., 2005; Lenz & Breger, 2005; Bedding et al., 2007; Jiang et al., 2011), to fitting of Lorentzian mode profiles (e.g. Handberg & Campante, 2011; Appourchaux et al., 2012; Mosser et al., 2012; Corsaro & De Ridder, 2014; Corsaro et al., 2015; Vrard et al., 2015; Davies & Miglio, 2016; Handberg et al., 2017; Roxburgh, 2017; Kallinger et al., 2018; Corsaro, 2019). Most of the and 2 oscillation modes were successfully identified either based on the frequency ridges in the échelle diagram (Bedding & Kjeldsen, 2010) or by using a multi-modal approach presented in Corsaro (2019). Very good agreement was achieved from a comparison of the frequencies returned by different methods.
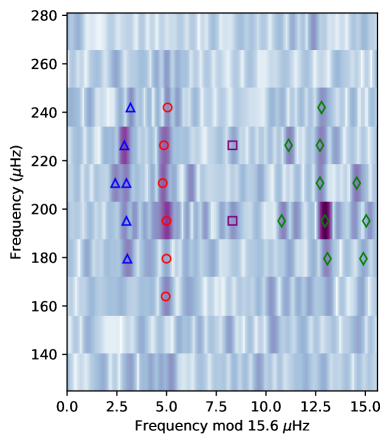
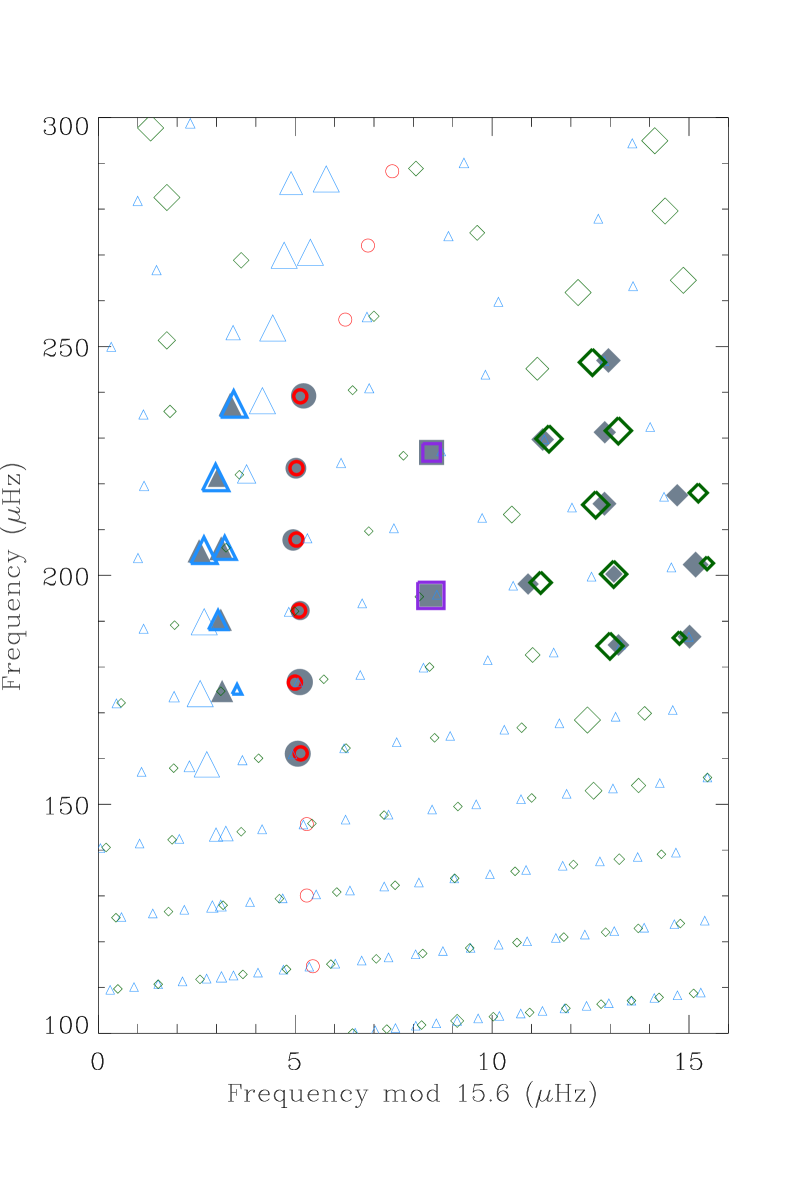
In Figure 4, the grayscale échelle diagram is illustrated for the background-corrected power spectrum. The identified modes (filled symbols) shown in the figure are returned by at least two independent methods with frequency differences smaller than the uncertainties. However, due to the relatively short observation time of TESS, mixed mode patterns are not so clear in the échelle diagram. Therefore, the identification of mixed modes needs further confirmation from comparisons with the model frequencies (see Section 4). The final frequency list of the identified peaks is given in Table 2. The radial modes identified from the power spectrum also allowed us to measure by performing a linear fit. The resulting value of contributes the final estimate given in Section 3.1.
4 Modeling
A common way to estimate the fundamental stellar properties is to compare calculated model parameters with the observational constraints that include observed asteroseismic parameters and complementary spectroscopic data. We used a number of independent approaches to model the observed stellar parameters and frequencies, including different stellar evolution codes (ASTEC, MESA; Christensen-Dalsgaard, 2008a; Paxton et al., 2011, 2013, 2015), oscillation codes (ADIPLS, GYRE Christensen-Dalsgaard, 2008b; Townsend & Teitler, 2013), and optimization methods (including AIMS, DIAMONDS, PARAM; Corsaro & De Ridder, 2014; Rodrigues et al., 2014; Wu & Li, 2016, 2017; Rodrigues et al., 2017; Frandsen et al., 2018; Nsamba et al., 2018; Zhang et al., 2018; Ong & Basu, 2019; Rendle et al., 2019; Yıldız et al., 2019). Corrections for the surface effect (Kjeldsen et al., 2008; Ball & Gizon, 2017; Viani et al., 2018) were employed by most of the adopted methods. The adopted model inputs included the set of {[Fe/H], , , , }. The atmospheric parameters ([Fe/H] and ) are adopted from Wittenmyer et al. (2017). To investigate the impacts of different inputs, modelers provided results with and without the use of individual frequencies and the luminosity as observable constraints. The diversity of modeling procedures employed implicitly accounts for the impact of using different stellar models and analysis methodologies on the final estimates. While a detailed comparison of the results from different groups is beyond the scope of this paper, we note extensive comparisons of red-giant models and oscillation frequencies computed with 9 widely used stellar evolution codes have recently been performed in the context of Aarhus Red Giants Challenge (Christensen-Dalsgaard et al., 2020; Silva Aguirre et al., 2020a).
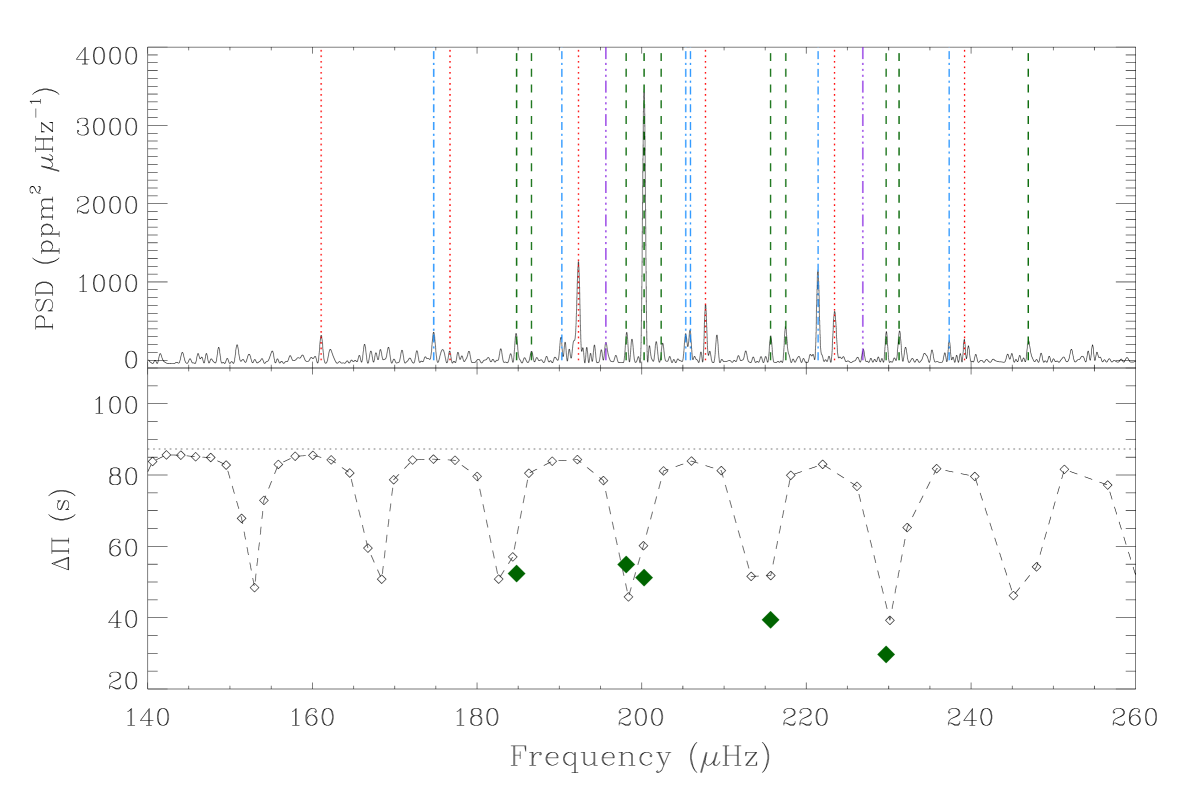
Overall, most of the codes were able to find adequate fits to the observable constraints, and the outputs are generally consistent with each other. Most modeling codes were able to provide adequate fits to the observed frequencies. As mentioned before, due to the relative short observational time of TESS, the frequency resolution and the peak heights are not good enough, which degrades the possibility to extract the close and the low-amplitude modes from the relative high-noise-level power spectrum. The detectability of solar-like oscillations is connected with the ratio of total mean mode power due to acoustic oscillations to the total background power across the frequency range occupied by the oscillations. This quantity provides a global measure of the signal-to-noise ratio (S/N), With TESS 2-minute cadence data the total S/N is predicted to be 3.1 for HD 222076, which is obtained based on the formulae in Campante et al. (2016b) using the noise floor of . By comparing the observed frequencies with those from the best-fitting model (see Figure 5), we were able to identify the modes with corresponding mode degrees and orders that are also given in Table 2. The oscillation peaks identified from the spectrum (top panel of Figure 6) are all with a peak height-to-background ratio larger than 4, exceeding the predicted ratio of 3.1. Our asteroseismic analysis indicates that the TESS photometric performance is better than predicted for the case of HD 222076. This is supported by the recently asteroseismic study of 25 TESS red giants by Silva Aguirre et al. (2020b). Among the extracted modes 12 (10 dipole, 2 quadrupole) are closely spaced mixed modes and 2 are modes. The identified dipolar mixed modes are pressure-mode-like ones that have larger amplitudes and hence are more likely detectable. The asymptotic period spacing of dipolar modes from the best-fitting model, defined by the radial position of the base of the convection zone as
| (1) |
is s. The frequency-independent is a good model representation of the period spacing (Wu & Li, 2019), usually taken as a constant value, derived from fitting the observed frequencies when the gravity-mode-like mixed modes are dense enough on the power spectrum (Mosser et al., 2014). In our case with only pressure-mode-like mixed modes obtained from observation, we estimate the observed period spacing , computed as the average spacing of the observed mixed modes (see the bottom panel of Figure 6), as s. The large uncertainty on is due to the relatively small spacings between the high-frequency modes. However, the values of and indicate that the star HD 222076 is a hydrogen-shell-burning red-giant star (Bedding et al., 2011; Corsaro et al., 2012) that locates before the luminosity bump, and the best-fitting model corroborates that.
The consolidated values for , , , , and age of HD 222076 from asteroseismic modeling are summarized in Table 1, constraining the corresponding properties to and , respectively. The uncertainties on these stellar parameters were recalculated by adding the median uncertainty for a given parameter in quadrature to the standard deviation of the parameter estimates returned by all methods. This takes account of both random and systematic errors estimated from different methods and has been commonly adopted for Kepler (e.g., Chaplin et al., 2014b). Adding seismic information in the optimization methods adds extra constraints to the best-fit model selection process. This should yield more precise stellar parameters compared to the empirical eclipsing-binary relation of, e.g., Torres et al. (2010). However, the uncertainties on the parameters estimated from the empiric relation presented in Section 2.2 are comparable with those on the asteroseismic values. This is owing to the relatively large uncertainties returned by several modeling methods as well as possible systematic errors reflecting the use of different codes or techniques. Nevertheless, the precision level of stellar parameters obtained in this study resembles that obtained when analyzing the full length of asteroseismic observations from the nominal Kepler mission. In addition, the stellar mass from the asteroseismic modeling is expected to be more accurate than that from the empirical relation, which is extrapolated for HD 222076 (cf. Section 2.2). The stellar properties estimated in this section indeed have much smaller uncertainties, but are otherwise consistent with those presented in the planet-discovery paper of Wittenmyer et al. (2017).
5 Planet Characterization
HD 222076b is typical of the population of planets orbiting evolved stars, which are generally beyond au and with masses greater than (e.g., Lovis & Mayor, 2007; Döllinger et al., 2009; Bowler et al., 2010; Jones et al., 2014; Grunblatt et al., 2019). Wittenmyer et al. (2017) computed a lower mass bound of and a semimajor axis of au for HD 222076 b. We revise this estimate by using the asteroseismic stellar mass () in Table 1 and the orbital period (days) and velocity semiamplitude (m/s) from Wittenmyer et al. (2017), and obtain au and . We note that by computing the semimajor axis and the minimum mass from the parameters in Wittenmyer et al. (2017) only, we obtain au and , which are larger than the (au and ) uncertainties that they reported. In this sense, our results reduce the uncertainties with the improved stellar mass.
A semimajor axis of under au suggests that a giant planet is in danger of being engulfed during the giant branch phases of stellar evolution (Mustill & Villaver, 2012; Villaver et al., 2014; Madappatt et al., 2016; Gallet et al., 2017; Rao et al., 2018; Sun et al., 2018). Here, we explore this possibility by applying the same procedure as in Campante et al. (2019), which is based on the dynamical tidal formalism of Zahn (1977) that was implemented in Villaver et al. (2014), with the added adiabatic assumption of stellar mass loss (Veras et al., 2011) and wind velocity and density prescriptions from Veras et al. (2015). We do not consider atmospheric evaporation (Schreiber et al., 2019), or the possibility of another hidden planet in the system or any other dynamical process which may affect the planet’s post-main-sequence evolution (Veras, 2016).
We find that the planet is engulfed during the red-giant branch phase and fails to reach the asymptotic giant branch phase. The time at which the engulfment occurs is at about Gyr, or about Myr from now; before the tip of the red-giant branch is reached. This result is insensitive to the choice of planet radius, of which the tidal calculation is a function through the frictional force on the planet (we applied two extreme cases of and ). The result is, however, sensitive to the planet mass: because the computed value of is a lower limit, this engulfment time represents an upper limit.
6 Conclusion
The analysis performed in this work demonstrates the strong potential of TESS to characterize exoplanets and their host stars using asteroseismology. We have re-analyzed the HD 222076 planet system, which was discovered by Wittenmyer et al. (2017), based on the 2-minute cadence data from TESS. The observation time (27.9 days) of the star is rather short compared to the long orbital period (871 days) of the planet, we do not see transit from the data. However, the high-quality photometric observation enables us to perform an asteroseismic analysis of the host star, placing strong constraints on the stellar parameters. From the asteroseismic modeling we obtain a value for the stellar mass of , a stellar radius of and an age of Gyr. The asteroseismic analysis further allows the detection of 10 dipole mixed modes from the observed power spectrum. The observed period spacing of these mixed modes and the mean large frequency separation reveal that the star HD 222076 is a hydrogen-shell-burning red-giant branch star. Thanks to the measurement of the mixed modes, the evolutionary stage of this star can be analyzed in such level of detail for the first time.
The updated stellar parameters from our asteroseismic analysis have enabled improved estimations for the lower bound of the planetary mass of and a semimajor axis of au. With the value obtained for the semimajor axis, we predict that the giant planet is in danger of being engulfed during the giant branch phase of stellar evolution. Based on the estimated stellar age, the engulfment will occur in about Myr from now, at the latest.
Our asteroseismic analysis indicates that the TESS photometric performance is better than that predicted by Campante et al. (2016b) for the case of HD 222076. Indeed, Silva Aguirre et al. (2020b) found that the quality of TESS photometry is similar to that of Kepler and K2. This emphasizes the potential of TESS for characterizing host stars and understanding their planets.
7 Acknowledgements
The project leading to this publication has received funding from the Strategic Priority Research Program of Chinese Academy of Sciences (Grant No. XDB 41000000) and the National Key Program for Science and Technology Research and Development (2017YFB0203300). This paper includes data collected by the TESS mission. Funding for the TESS mission is provided by the NASA Explorer Program. Funding for the TESS Asteroseismic Science Operations Center at Aarhus University is provided by ESA PRODEX (PEA 4000119301) and Stellar Astrophysics Centre (SAC), funded by the Danish National Research Foundation (Grant agreement No.: DNRF106). J.C. is funded by the Fundamental Research Funds for the Central Universities (grant: 19lgpy278) and gratefully thank Biwei Jiang for the discussions on this work. Q.-S.Z is cosponsored by the National Natural Science Foundation of China (grant No. 11303087) and the Ten Thousands Talents Program of Yunnan Province, and foundations of the Chinese Academy of Sciences (Light of West China Program, Youth Innovation Promotion Association). D.V. gratefully acknowledges the support of the STFC via an Ernest Rutherford Fellowship (grant ST/P003850/1). T.W. and X-Y.Z. thank the supports from the NSFC of China (Grant Nos. 11503076, 11773064, 11873084, and 11521303), from Yunnan Applied Basic Research Projects (Grant No. 2017B008) and from Youth Innovation Promotion Association of Chinese Academy of Sciences. T.W. and X-Y.Z. also gratefully acknowledge the computing time granted by the Yunnan Observatories, and provided on the facilities at the Yunnan Observatories Supercomputing Platform. DLB acknowledges support from the Whitaker Center for STEM Education at Florida Gulf Coast University. B.N. acknowledges postdoctoral funding from the Alexander von Humboldt Foundation taken at the Max-Planck-Institut für Astrophysik (MPA). T.D.Li acknowledges support from the Australian Research Council (grant DE 180101104), and the European Research Council (ERC) under the European Union’s Horizon 2020 research and innovation programme (CartographY GA. 804752). P.M. acknowledges support from NCN grant no. 2016/21/B/ST9/01126. M.Y., Z.Ç.O., and S.Ö. acknowedge the Scientific and Technological Research Council of Turkey (TÜBİTAK:118F352). TLC acknowledges support from the European Union’s Horizon 2020 research and innovation programme under the Marie Skłodowska-Curie grant agreement No. 792848 (PULSATION). This work was supported by FCT/MCTES through national funds (UID/FIS/04434/2019). M. S. Cunha is supported by national funds through FCT – Fundação para a Ciência e a Tecnologia - in the form of a work contract and through the research grants UIDB/04434/2020, UIDP/04434/2020 and PTDC/FIS-AST/30389/2017, and by FEDER - Fundo Europeu de Desenvolvimento Regional through COMPETE2020 - Programa Operacional Competitividade e Internacionalização (grant: POCI-01-0145-FEDER-030389).
References
- Appourchaux et al. (2012) Appourchaux, T., Chaplin, W. J., García, R. A., et al. 2012, A&A, 543, A54, doi: 10.1051/0004-6361/201218948
- Baglin et al. (2006) Baglin, A., Auvergne, M., Boisnard, L., et al. 2006, in 36th COSPAR Scientific Assembly, Vol. 36, 3749
- Ball & Gizon (2017) Ball, W. H., & Gizon, L. 2017, A&A, 600, A128, doi: 10.1051/0004-6361/201630260
- Ballard et al. (2014) Ballard, S., Chaplin, W. J., Charbonneau, D., et al. 2014, ApJ, 790, 12, doi: 10.1088/0004-637X/790/1/12
- Beck et al. (2011) Beck, P. G., Bedding, T. R., Mosser, B., et al. 2011, Science, 332, 205, doi: 10.1126/science.1201939
- Bedding & Kjeldsen (2010) Bedding, T. R., & Kjeldsen, H. 2010, Communications in Asteroseismology, 161, 3, doi: 10.1553/cia161s3
- Bedding et al. (2007) Bedding, T. R., Kjeldsen, H., Arentoft, T., et al. 2007, ApJ, 663, 1315, doi: 10.1086/518593
- Bedding et al. (2011) Bedding, T. R., Mosser, B., Huber, D., et al. 2011, Nature, 471, 608, doi: 10.1038/nature09935
- Benomar et al. (2014) Benomar, O., Masuda, K., Shibahashi, H., & Suto, Y. 2014, PASJ, 66, 94, doi: 10.1093/pasj/psu069
- Borucki et al. (2010) Borucki, W. J., Koch, D., Basri, G., et al. 2010, Science, 327, 977, doi: 10.1126/science.1185402
- Bowler et al. (2010) Bowler, B. P., Johnson, J. A., Marcy, G. W., et al. 2010, ApJ, 709, 396, doi: 10.1088/0004-637X/709/1/396
- Buzasi et al. (2015) Buzasi, D. L., Carboneau, L., Hessler, C., Lezcano, A., & Preston, H. 2015, in IAU General Assembly, Vol. 29, 2256843
- Campante et al. (2015) Campante, T. L., Barclay, T., Swift, J. J., et al. 2015, ApJ, 799, 170, doi: 10.1088/0004-637X/799/2/170
- Campante et al. (2016a) Campante, T. L., Lund, M. N., Kuszlewicz, J. S., et al. 2016a, ApJ, 819, 85, doi: 10.3847/0004-637X/819/1/85
- Campante et al. (2016b) Campante, T. L., Schofield, M., Kuszlewicz, J. S., et al. 2016b, ApJ, 830, 138, doi: 10.3847/0004-637X/830/2/138
- Campante et al. (2019) Campante, T. L., Corsaro, E., Lund, M. N., et al. 2019, ApJ, 885, 31, doi: 10.3847/1538-4357/ab44a8
- Chaplin et al. (2014b) Chaplin, W. J., Elsworth, Y., Davies, G. R., et al. 2014b, MNRAS, 445, 946, doi: 10.1093/mnras/stu1811
- Chaplin & Miglio (2013) Chaplin, W. J., & Miglio, A. 2013, ARA&A, 51, 353, doi: 10.1146/annurev-astro-082812-140938
- Chaplin et al. (2014a) Chaplin, W. J., Basu, S., Huber, D., et al. 2014a, ApJS, 210, 1, doi: 10.1088/0067-0049/210/1/1
- Christensen-Dalsgaard (2008a) Christensen-Dalsgaard, J. 2008a, Ap&SS, 316, 13, doi: 10.1007/s10509-007-9675-5
- Christensen-Dalsgaard (2008b) —. 2008b, Ap&SS, 316, 113, doi: 10.1007/s10509-007-9689-z
- Christensen-Dalsgaard et al. (2020) Christensen-Dalsgaard, J., Silva Aguirre, V., Cassisi, S., et al. 2020, A&A, 635, A165, doi: 10.1051/0004-6361/201936766
- Corsaro (2019) Corsaro, E. 2019, Frontiers in Astronomy and Space Sciences, 6, 21, doi: 10.3389/fspas.2019.00021
- Corsaro & De Ridder (2014) Corsaro, E., & De Ridder, J. 2014, A&A, 571, A71, doi: 10.1051/0004-6361/201424181
- Corsaro et al. (2015) Corsaro, E., De Ridder, J., & García, R. A. 2015, A&A, 579, A83, doi: 10.1051/0004-6361/201525895
- Corsaro et al. (2012) Corsaro, E., Stello, D., Huber, D., et al. 2012, ApJ, 757, 190, doi: 10.1088/0004-637X/757/2/190
- Corsaro et al. (2017) Corsaro, E., Mathur, S., García, R. A., et al. 2017, A&A, 605, A3, doi: 10.1051/0004-6361/201731094
- Cunha et al. (2015) Cunha, M. S., Stello, D., Avelino, P. P., Christensen-Dalsgaard, J., & Townsend, R. H. D. 2015, ApJ, 805, 127, doi: 10.1088/0004-637X/805/2/127
- Dalba et al. (2019) Dalba, P. A., Kane, S. R., Barclay, T., et al. 2019, PASP, 131, 034401, doi: 10.1088/1538-3873/aaf183
- Davies & Miglio (2016) Davies, G. R., & Miglio, A. 2016, Astronomische Nachrichten, 337, 774, doi: 10.1002/asna.201612371
- Diego et al. (1990) Diego, F., Charalambous, A., Fish, A. C., & Walker, D. D. 1990, Society of Photo-Optical Instrumentation Engineers (SPIE) Conference Series, Vol. 1235, Final tests and commissioning of the UCL echelle spectrograph, ed. D. L. Crawford, 562–576, doi: 10.1117/12.19119
- Döllinger et al. (2009) Döllinger, M. P., Hatzes, A. P., Pasquini, L., Guenther, E. W., & Hartmann, M. 2009, A&A, 505, 1311, doi: 10.1051/0004-6361/200911702
- Frandsen et al. (2018) Frandsen, S., Fredslund Andersen, M., Brogaard, K., et al. 2018, A&A, 613, A53, doi: 10.1051/0004-6361/201730816
- Gaia Collaboration et al. (2018) Gaia Collaboration, Brown, A. G. A., Vallenari, A., et al. 2018, A&A, 616, A1, doi: 10.1051/0004-6361/201833051
- Gallet et al. (2017) Gallet, F., Bolmont, E., Mathis, S., Charbonnel, C., & Amard, L. 2017, A&A, 604, A112, doi: 10.1051/0004-6361/201730661
- Grunblatt et al. (2019) Grunblatt, S. K., Huber, D., Gaidos, E., et al. 2019, AJ, 158, 227, doi: 10.3847/1538-3881/ab4c35
- Handberg et al. (2017) Handberg, R., Brogaard, K., Miglio, A., et al. 2017, MNRAS, 472, 979, doi: 10.1093/mnras/stx1929
- Handberg & Campante (2011) Handberg, R., & Campante, T. L. 2011, A&A, 527, A56, doi: 10.1051/0004-6361/201015451
- Handberg & Lund (2014) Handberg, R., & Lund, M. N. 2014, MNRAS, 445, 2698, doi: 10.1093/mnras/stu1823
- Handberg & Lund (2019) Handberg, R., & Lund, M. N. 2019, T’DA Data Release Notes - Data Release 4 for TESS Sectors 1 + 2, doi: 10.5281/zenodo.2579846
- Harvey (1985) Harvey, J. 1985, in ESA Special Publication, Vol. 235, Future Missions in Solar, Heliospheric & Space Plasma Physics, ed. E. Rolfe & B. Battrick, 199
- Hekker et al. (2010) Hekker, S., Broomhall, A. M., Chaplin, W. J., et al. 2010, MNRAS, 402, 2049, doi: 10.1111/j.1365-2966.2009.16030.x
- Hekker et al. (2011) Hekker, S., Elsworth, Y., De Ridder, J., et al. 2011, A&A, 525, A131, doi: 10.1051/0004-6361/201015185
- Houk & Cowley (1975) Houk, N., & Cowley, A. P. 1975, University of Michigan Catalogue of two-dimensional spectral types for the HD stars. Volume I. Declinations -900 to -530.
- Huber et al. (2009) Huber, D., Stello, D., Bedding, T. R., et al. 2009, Communications in Asteroseismology, 160, 74. https://arxiv.org/abs/0910.2764
- Huber et al. (2013) Huber, D., Carter, J. A., Barbieri, M., et al. 2013, Science, 342, 331, doi: 10.1126/science.1242066
- Huber et al. (2019) Huber, D., Chaplin, W. J., Chontos, A., et al. 2019, AJ, 157, 245, doi: 10.3847/1538-3881/ab1488
- Jiang et al. (2011) Jiang, C., Jiang, B. W., Christensen-Dalsgaard, J., et al. 2011, ApJ, 742, 120, doi: 10.1088/0004-637X/742/2/120
- Jones et al. (2014) Jones, M. I., Jenkins, J. S., Bluhm, P., Rojo, P., & Melo, C. H. F. 2014, A&A, 566, A113, doi: 10.1051/0004-6361/201323345
- Jones et al. (2011) Jones, M. I., Jenkins, J. S., Rojo, P., & Melo, C. H. F. 2011, A&A, 536, A71, doi: 10.1051/0004-6361/201117887
- Kallinger et al. (2018) Kallinger, T., Beck, P. G., Stello, D., & Garcia, R. A. 2018, A&A, 616, A104, doi: 10.1051/0004-6361/201832831
- Kallinger et al. (2014) Kallinger, T., De Ridder, J., Hekker, S., et al. 2014, A&A, 570, A41, doi: 10.1051/0004-6361/201424313
- Kamiaka et al. (2019) Kamiaka, S., Benomar, O., Suto, Y., et al. 2019, AJ, 157, 137, doi: 10.3847/1538-3881/ab04a9
- Kane et al. (2012) Kane, S. R., Ciardi, D. R., Gelino, D. M., & von Braun, K. 2012, MNRAS, 425, 757, doi: 10.1111/j.1365-2966.2012.21627.x
- Karoff (2008) Karoff, C. 2008, PhD thesis, Aarhus University
- Kaufer et al. (1999) Kaufer, A., Stahl, O., Tubbesing, S., et al. 1999, The Messenger, 95, 8
- Kjeldsen et al. (2008) Kjeldsen, H., Bedding, T. R., & Christensen-Dalsgaard, J. 2008, ApJ, 683, L175, doi: 10.1086/591667
- Kjeldsen et al. (2005) Kjeldsen, H., Bedding, T. R., Butler, R. P., et al. 2005, ApJ, 635, 1281, doi: 10.1086/497530
- Kurtz (1985) Kurtz, D. W. 1985, MNRAS, 213, 773, doi: 10.1093/mnras/213.4.773
- Lenz & Breger (2005) Lenz, P., & Breger, M. 2005, Communications in Asteroseismology, 146, 53, doi: 10.1553/cia146s53
- Lovis & Mayor (2007) Lovis, C., & Mayor, M. 2007, A&A, 472, 657, doi: 10.1051/0004-6361:20077375
- Lund et al. (2015) Lund, M. N., Handberg, R., Davies, G. R., Chaplin, W. J., & Jones, C. D. 2015, ApJ, 806, 30, doi: 10.1088/0004-637X/806/1/30
- Lund et al. (2017b) Lund, M. N., Handberg, R., Kjeldsen, H., Chaplin, W. J., & Christensen-Dalsgaard, J. 2017b, in European Physical Journal Web of Conferences, Vol. 160, European Physical Journal Web of Conferences, 01005, doi: 10.1051/epjconf/201716001005
- Lund et al. (2014) Lund, M. N., Lundkvist, M., Silva Aguirre, V., et al. 2014, A&A, 570, A54, doi: 10.1051/0004-6361/201424326
- Lund et al. (2017a) Lund, M. N., Silva Aguirre, V., Davies, G. R., et al. 2017a, ApJ, 835, 172, doi: 10.3847/1538-4357/835/2/172
- Lundkvist et al. (2016) Lundkvist, M. S., Kjeldsen, H., Albrecht, S., et al. 2016, Nature Communications, 7, 11201, doi: 10.1038/ncomms11201
- Madappatt et al. (2016) Madappatt, N., De Marco, O., & Villaver, E. 2016, MNRAS, 463, 1040, doi: 10.1093/mnras/stw2025
- Mathur et al. (2010) Mathur, S., García, R. A., Régulo, C., et al. 2010, A&A, 511, A46, doi: 10.1051/0004-6361/200913266
- Mathur et al. (2012) Mathur, S., Metcalfe, T. S., Woitaszek, M., et al. 2012, ApJ, 749, 152, doi: 10.1088/0004-637X/749/2/152
- Metcalfe et al. (2010) Metcalfe, T. S., Monteiro, M. J. P. F. G., Thompson, M. J., et al. 2010, ApJ, 723, 1583, doi: 10.1088/0004-637X/723/2/1583
- Mosser & Appourchaux (2009) Mosser, B., & Appourchaux, T. 2009, A&A, 508, 877, doi: 10.1051/0004-6361/200912944
- Mosser et al. (2012) Mosser, B., Goupil, M. J., Belkacem, K., et al. 2012, A&A, 540, A143, doi: 10.1051/0004-6361/201118519
- Mosser et al. (2014) Mosser, B., Benomar, O., Belkacem, K., et al. 2014, A&A, 572, L5, doi: 10.1051/0004-6361/201425039
- Mustill & Villaver (2012) Mustill, A. J., & Villaver, E. 2012, ApJ, 761, 121, doi: 10.1088/0004-637X/761/2/121
- Nsamba et al. (2018) Nsamba, B., Campante, T. L., Monteiro, M. J. P. F. G., et al. 2018, MNRAS, 477, 5052, doi: 10.1093/mnras/sty948
- Ong & Basu (2019) Ong, J. M. J., & Basu, S. 2019, ApJ, 870, 41, doi: 10.3847/1538-4357/aaf1b5
- Paxton et al. (2011) Paxton, B., Bildsten, L., Dotter, A., et al. 2011, ApJS, 192, 3, doi: 10.1088/0067-0049/192/1/3
- Paxton et al. (2013) Paxton, B., Cantiello, M., Arras, P., et al. 2013, ApJS, 208, 4, doi: 10.1088/0067-0049/208/1/4
- Paxton et al. (2015) Paxton, B., Marchant, P., Schwab, J., et al. 2015, ApJS, 220, 15, doi: 10.1088/0067-0049/220/1/15
- Rao et al. (2018) Rao, S., Meynet, G., Eggenberger, P., et al. 2018, A&A, 618, A18, doi: 10.1051/0004-6361/201833107
- Rendle et al. (2019) Rendle, B. M., Buldgen, G., Miglio, A., et al. 2019, MNRAS, 484, 771, doi: 10.1093/mnras/stz031
- Ricker et al. (2014) Ricker, G. R., Winn, J. N., Vanderspek, R., et al. 2014, Society of Photo-Optical Instrumentation Engineers (SPIE) Conference Series, Vol. 9143, Transiting Exoplanet Survey Satellite (TESS), 914320, doi: 10.1117/12.2063489
- Rodrigues et al. (2014) Rodrigues, T. S., Girardi, L., Miglio, A., et al. 2014, MNRAS, 445, 2758, doi: 10.1093/mnras/stu1907
- Rodrigues et al. (2017) Rodrigues, T. S., Bossini, D., Miglio, A., et al. 2017, MNRAS, 467, 1433, doi: 10.1093/mnras/stx120
- Roxburgh (2017) Roxburgh, I. W. 2017, A&A, 604, A42, doi: 10.1051/0004-6361/201731057
- Santos et al. (2013) Santos, N. C., Sousa, S. G., Mortier, A., et al. 2013, A&A, 556, A150, doi: 10.1051/0004-6361/201321286
- Schlegel et al. (1998) Schlegel, D. J., Finkbeiner, D. P., & Davis, M. 1998, ApJ, 500, 525, doi: 10.1086/305772
- Schofield et al. (2019) Schofield, M., Chaplin, W. J., Huber, D., et al. 2019, ApJS, 241, 12, doi: 10.3847/1538-4365/ab04f5
- Schreiber et al. (2019) Schreiber, M. R., Gänsicke, B. T., Toloza, O., Hernandez, M.-S., & Lagos, F. 2019, ApJ, 887, L4, doi: 10.3847/2041-8213/ab42e2
- Serenelli et al. (2017) Serenelli, A., Johnson, J., Huber, D., et al. 2017, ApJS, 233, 23, doi: 10.3847/1538-4365/aa97df
- Silva Aguirre et al. (2015) Silva Aguirre, V., Davies, G. R., Basu, S., et al. 2015, MNRAS, 452, 2127, doi: 10.1093/mnras/stv1388
- Silva Aguirre et al. (2017) Silva Aguirre, V., Lund, M. N., Antia, H. M., et al. 2017, ApJ, 835, 173, doi: 10.3847/1538-4357/835/2/173
- Silva Aguirre et al. (2020a) Silva Aguirre, V., Christensen-Dalsgaard, J., Cassisi, S., et al. 2020a, A&A, 635, A164, doi: 10.1051/0004-6361/201935843
- Silva Aguirre et al. (2020b) Silva Aguirre, V., Stello, D., Stokholm, A., et al. 2020b, ApJ, 889, L34, doi: 10.3847/2041-8213/ab6443
- Sliski & Kipping (2014) Sliski, D. H., & Kipping, D. M. 2014, ApJ, 788, 148, doi: 10.1088/0004-637X/788/2/148
- Sousa et al. (2018) Sousa, S. G., Adibekyan, V., Delgado-Mena, E., et al. 2018, A&A, 620, A58, doi: 10.1051/0004-6361/201833350
- Stassun et al. (2017) Stassun, K. G., Collins, K. A., & Gaudi, B. S. 2017, AJ, 153, 136, doi: 10.3847/1538-3881/aa5df3
- Stassun et al. (2018a) Stassun, K. G., Corsaro, E., Pepper, J. A., & Gaudi, B. S. 2018a, AJ, 155, 22, doi: 10.3847/1538-3881/aa998a
- Stassun & Torres (2016) Stassun, K. G., & Torres, G. 2016, AJ, 152, 180, doi: 10.3847/0004-6256/152/6/180
- Stassun & Torres (2018) —. 2018, ApJ, 862, 61, doi: 10.3847/1538-4357/aacafc
- Stassun et al. (2018b) Stassun, K. G., Oelkers, R. J., Pepper, J., et al. 2018b, AJ, 156, 102, doi: 10.3847/1538-3881/aad050
- Sun et al. (2018) Sun, M., Arras, P., Weinberg, N. N., Troup, N. W., & Majewski, S. R. 2018, MNRAS, 481, 4077, doi: 10.1093/mnras/sty2464
- Tokovinin et al. (2013) Tokovinin, A., Fischer, D. A., Bonati, M., et al. 2013, PASP, 125, 1336, doi: 10.1086/674012
- Torres et al. (2010) Torres, G., Andersen, J., & Giménez, A. 2010, A&A Rev., 18, 67, doi: 10.1007/s00159-009-0025-1
- Townsend & Teitler (2013) Townsend, R. H. D., & Teitler, S. A. 2013, MNRAS, 435, 3406, doi: 10.1093/mnras/stt1533
- Van Eylen & Albrecht (2015) Van Eylen, V., & Albrecht, S. 2015, ApJ, 808, 126, doi: 10.1088/0004-637X/808/2/126
- Van Eylen et al. (2019) Van Eylen, V., Albrecht, S., Huang, X., et al. 2019, AJ, 157, 61, doi: 10.3847/1538-3881/aaf22f
- van Leeuwen (2007) van Leeuwen, F. 2007, A&A, 474, 653, doi: 10.1051/0004-6361:20078357
- Veras (2016) Veras, D. 2016, Royal Society Open Science, 3, 150571, doi: 10.1098/rsos.150571
- Veras et al. (2015) Veras, D., Eggl, S., & Gänsicke, B. T. 2015, MNRAS, 451, 2814, doi: 10.1093/mnras/stv1047
- Veras et al. (2011) Veras, D., Wyatt, M. C., Mustill, A. J., Bonsor, A., & Eldridge, J. J. 2011, MNRAS, 417, 2104, doi: 10.1111/j.1365-2966.2011.19393.x
- Verner et al. (2011) Verner, G. A., Elsworth, Y., Chaplin, W. J., et al. 2011, MNRAS, 415, 3539, doi: 10.1111/j.1365-2966.2011.18968.x
- Viani et al. (2018) Viani, L. S., Basu, S., Joel Ong J., M., Bonaca, A., & Chaplin, W. J. 2018, ApJ, 858, 28, doi: 10.3847/1538-4357/aab7eb
- Villaver et al. (2014) Villaver, E., Livio, M., Mustill, A. J., & Siess, L. 2014, ApJ, 794, 3, doi: 10.1088/0004-637X/794/1/3
- Vrard et al. (2015) Vrard, M., Mosser, B., Barban, C., et al. 2015, A&A, 579, A84, doi: 10.1051/0004-6361/201425064
- Wittenmyer et al. (2017) Wittenmyer, R. A., Jones, M. I., Zhao, J., et al. 2017, AJ, 153, 51, doi: 10.3847/1538-3881/153/2/51
- Wittenmyer et al. (2016) Wittenmyer, R. A., Liu, F., Wang, L., et al. 2016, AJ, 152, 19, doi: 10.3847/0004-6256/152/1/19
- Wu & Li (2016) Wu, T., & Li, Y. 2016, ApJ, 818, L13, doi: 10.3847/2041-8205/818/1/L13
- Wu & Li (2017) —. 2017, ApJ, 846, 41, doi: 10.3847/1538-4357/aa8361
- Wu & Li (2019) —. 2019, ApJ, 881, 86, doi: 10.3847/1538-4357/ab2ad8
- Yıldız et al. (2019) Yıldız, M., Çelik Orhan, Z., & Kayhan, C. 2019, MNRAS, 489, 1753, doi: 10.1093/mnras/stz2223
- Zahn (1977) Zahn, J. P. 1977, A&A, 500, 121
- Zhang et al. (2018) Zhang, X., Wu, T., & Li, Y. 2018, ApJ, 855, 16, doi: 10.3847/1538-4357/aaaabb
| Parameter | Value | References |
|---|---|---|
| Basic Properties | ||
| TIC | 325178933 | 1 |
| Hipparcos ID | 116630 | 2 |
| TESS Mag. | 6.59 | 1 |
| Sp. Type | K1 III | 3 |
| Spectroscopy | ||
| (K) | 4 | |
| 5 | ||
| 6 | ||
| (dex) | 4 | |
| 5 | ||
| 6 | ||
| (cgs) | 4 | |
| 5 | ||
| 6 | ||
| SED & Gaia DR2 Parallax | ||
| 7 | ||
| () | 7 | |
| () | 7 | |
| () | aaBased on extrapolated relations of Torres et al. (2010), should be regarded with caution (cf. Section 2.2) . | 7 |
| (gcc) | 7 | |
| () | 7 | |
| (mas) | bbAdjusted for the systematic offset of Stassun & Torres (2018). | 8 |
| Asteroseismology | ||
| (Hz) | 7 | |
| (Hz) | 7 | |
| (s) | 7 | |
| () | 7 | |
| () | 7 | |
| (gcc) | 7 | |
| (cgs) | 7 | |
| (Gyr) | 7 | |
| (Hz) | (Hz) | ||||
|---|---|---|---|---|---|
| 0 | 9 | 9 | 161.06 | 0.03 | |
| 2 | -102 | 9 | -111 | 174.74 | 0.02 |
| 0 | 10 | 10 | 176.71 | 0.03 | |
| 1 | -51 | 10 | -61 | 184.81 | 0.07 |
| 1 | -50 | 10 | -60 | 186.62 | 0.03 |
| 2 | -92 | 10 | -102 | 190.31 | 0.02 |
| 0 | 11 | 11 | 192.32 | 0.01 | |
| 3 | -131 | 10 | -141 | 195.64 | 0.02 |
| 1 | -46 | 11 | -57 | 198.11 | 0.02 |
| 1 | -45 | 11 | -56 | 200.29 | 0.01 |
| 1 | -44 | 11 | -55 | 202.34 | 0.03 |
| 2 | -84 | 11 | -95 | 205.36 | 0.02 |
| 2 | -83 | 11 | -94 | 205.92 | 0.03 |
| 0 | 12 | 12 | 207.75 | 0.02 | |
| 1 | -40 | 12 | -52 | 215.65 | 0.03 |
| 1 | -39 | 12 | -51 | 217.50 | 0.02 |
| 2 | -76 | 12 | -88 | 221.42 | 0.01 |
| 0 | 13 | 13 | 223.42 | 0.02 | |
| 3 | -109 | 12 | -121 | 226.86 | 0.03 |
| 1 | -36 | 13 | -49 | 229.69 | 0.02 |
| 1 | -35 | 13 | -48 | 231.26 | 0.02 |
| 2 | -69 | 13 | -82 | 237.34 | 0.02 |
| 0 | 14 | 14 | 239.21 | 0.03 | |
| 1 | -31 | 14 | -45 | 246.95 | 0.03 |