Transfer Learning for Thermal Comfort Prediction in Multiple Cities
Abstract.
HVAC (Heating, Ventilation and Air Conditioning) system is an important part of a building, which constitutes up to 40% of building energy usage. The main purpose of HVAC, maintaining appropriate thermal comfort, is crucial for the best utilisation of energy usage. Besides, thermal comfort is also crucial for well-being, health, and work productivity. Recently, data-driven thermal comfort models have got better performance than traditional knowledge-based methods (e.g. Predicted Mean Vote Model). An accurate thermal comfort model requires a large amount of self-reported thermal comfort data from indoor occupants which undoubtedly remains a challenge for researchers. In this research, we aim to tackle this data-shortage problem and boost the performance of thermal comfort prediction. We utilise sensor data from multiple cities in the same climate zone to learn thermal comfort patterns. We present a transfer learning based multilayer perceptron model from the same climate zone (TL-MLP-C*) for accurate thermal comfort prediction. Extensive experimental results on ASHRAE RP-884, the Scales Project and Medium US Office datasets show that the performance of the proposed TL-MLP-C* exceeds the state-of-the-art methods in accuracy and F1-score.
1. Introduction
Internet of Things (IoT) devices have been widely used in the urban environment across various disciplines such as early-warning systems, traffic management, environment monitoring and buildings’ HVAC (Heating, Ventilation and Air Conditioning) systems (Hu et al., 2015; Abbas et al., 2018; Elnour et al., 2020). At the same time, sensors have become the backbones of smart cities which enable spatial and situational awareness of real-time monitoring in dynamic phenomena, e.g., pedestrian movement (Wang et al., 2017), parking events (Shao et al., 2018, 2017), occupancy recognition (Ang et al., 2016) and energy consumption (Song et al., 2019).
As one of the most important parts in cities all over the world, buildings account for about 40% global energy usage and 60% worldwide electricity usage (Sadid et al., 2017). A large proportion of this usage is contributed by the buildings’ HVAC system. In sub-tropical climate cities like Sydney, HVAC even consumes about 70% of the buildings’ energy usage (Rahman et al., 2010; Zhang et al., 2018). With different kinds of IoT sensors (e.g., temperature sensor, humidity sensor, air velocity sensor, air quality sensor) installed in the building, the HVAC system can dynamically maintain the indoor occupant comfort at minimal energy usage. To achieve overall satisfaction with the indoor environment, thermal comfort is often considered to be the most influential factor compared with other factors such as visual and acoustics comfort (Frontczak and Wargocki, 2011).
Thermal Comfort is the state of mind which expresses satisfaction with the thermal environment (ASHRAE Standard 2004 (of Heating et al., 2004)). Researchers have found that thermal discomfort not only affects occupant productivity, work performance and engagement (Gao et al., 2020), but also has a bad influence on lifelong health. Hence, it is important to maintain a thermal-comfort environment for the well-being of the occupants while minimizing the buildings’ energy usage. A crucial step towards this goal is to create an accurate model for thermal comfort.
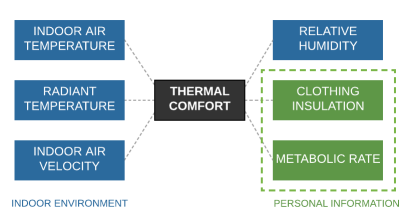
The Predicted Mean Vote (PMV) model proposed by Fanger et al. (Fanger et al., 1970) stands among the most prevalent thermal comfort model, which was developed with principles of human heat-balance and adopted by the American Society of Heating, Refrigerating and Air-conditioning Engineers (ASHRAE) Standard 55. The PMV model relates thermal comfort scale with six different factors: air temperature, mean radiant temperature, relative humidity, air speed, metabolic rate, and clothing insulation (see Figure 1). Then, the average thermal sensation score can be calculated at a 7-point scale ranging from 3 to -3, which indicates feeling hot, warm, slightly warm, neutral, slightly cool, cool and cold.
However, some researchers revealed the discrepancy between thermal sensation vote reported by occupants and predicted mean vote (Becker and Paciuk, 2009; van Hoof, 2008). It could probably be that a variety of parameters may affect thermal comfort such as time factors (e.g., hour, day, season) (Auffenberg et al., 2015; Chun et al., 2008), personal information (e.g., heart rate, skin temperature, age, gender) (Chaudhuri et al., 2018; Indraganti et al., 2015; Indraganti and Rao, 2010; Karjalainen, 2007), environmental factors (e.g., air quality, color, light, noise, outdoor climates) (Seppänen et al., 1999; Kolokotsa et al., 2001), culture (e.g., dress code, economic status) (Indraganti and Rao, 2010), short and long-time thermal exposure (Chun et al., 2008), etc. Therefore, the data-driven method is a better choice compared with traditional PMV model as more parameters could be utilized to improve the performance of thermal comfort prediction.
To build a data-driven thermal comfort model, there are mainly two types of approaches for obtaining occupants’ thermal comfort feelings in the buildings. One is the survey-based approach (Di Napoli et al., 2020; Nikolaou et al., 2009; Langevin et al., 2015), which utilizes a participatory learning process with a questionnaire. The other one is the physiological measurement-based approach (Liu, 2018; Choi and Yeom, 2019). It records certain physiological signals (skin temperature (Liu et al., 2011), heart rate (Liu et al., 2008), skin conductance (Gerrett et al., 2013), etc.) from wearable sensors. However, both approaches need real-time and continuous monitoring or feedback of indoor occupants, which can be regarded as a burden for participants, making it a challenging task for researchers, especially for those with limited time and budget. Considering the definition of thermal comfort is ’the state of mind which expresses satisfaction of thermal environment’, the survey-based approaches potentially learn personal thermal comfort more accurately than physiological approaches as they try to directly extract the state of mind of a person. Thus, in this research, we will explore ways to deal with the lack of thermal comfort survey data.
Various thermal comfort studies have been carried out in different cities all over the world, and several databases including multiple cities and climate zones are currently online (see Section 3). Considered the sensor data inferred from different cities may have very divergent patterns caused by the building materials, construction requirements and climate changes, previous studies mainly focus on investigating how people group living in specific cities react to their thermal environment such as hot-arid climate in Kalgoorlie-Boulder Australia (Cena and de Dear, 1999), humid subtropical climate in Brisbane Australia (De Dear and Brager, 1998).
Recently, there are many publications applying machine learning algorithms to predict thermal comfort for a specified group of people (e.g., like for a group working in the same building). However, it is usually hard to get enough labelled thermal comfort data, which limits the performance of data-driven thermal comfort modelling. The considered occupant thermal comfort level has a strong correlation with indoor environment sensor data (e.g., air temperature, air velocity, humidity and radiant temperature) and physiological data (e.g., metabolic rate, skin temperature). It is possible to utilize sensor data from multiple cities to benefit the target building in another city.
Therefore, in this paper, we hypothesize that the performance of thermal comfort prediction can be boosted by transfer learning across sensor data from multiple cities. Then, we aim to answer the following research questions: Can we predict occupants’ thermal comfort accurately by learning from multiple buildings in the same climate zone when we do not have enough data? If so, which features contribute most for effective thermal comfort transfer learning?
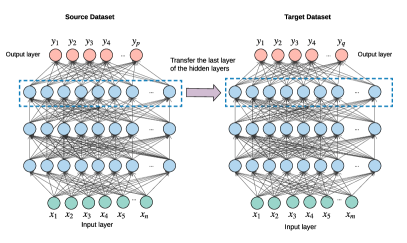
To answer the above questions, we present a thermal comfort prediction framework with transfer learning technique, which aims to predict occupants’ thermal sensation with insufficient labelled data. ASHRAE RP-884 database (Fanger et al., 1970) and the Scales Project dataset (Schweiker et al., 2019) are chosen as source datasets and Medium US Office (Langevin et al., 2015) is used as the target dataset. To deal with the imbalanced class problem, we merge the minority classes and divide the data into five categories, then apply a generative adversarial network based resampling method TabularGAN for meaningful thermal comfort classification. The thermal comfort prediction model for the target dataset is trained by retaining the last hidden layer of the neural network from the source domain. To summarize, we make the following contributions as listed:
-
•
To the best of our knowledge, we are the first to transfer the knowledge from similar thermal environments (climate zones) to the target building for effective thermal comfort modelling. We propose the transfer learning based multilayer perceptron (TL-MLP) model and transfer learning based multilayer perceptron from the same climate zone (TL-MLP-C*) model. We confirm that thermal comfort sensor data from multiple cities in the same climate zone can benefit the small thermal comfort dataset for the target building in another city with insufficient training data.
-
•
Extensive experimental results show that the proposed TL-MLP and TL-MLP-C* models outperform the state-of-the-art algorithms for thermal comfort prediction and can be implemented in any building without adequate thermal comfort labelled data.
-
•
We identify the most significant feature sets for effective thermal comfort transfer learning. We find the combination of age, gender, outdoor environmental features and six factors from the PMV model can lead to the best prediction performance for transfer learning based thermal comfort modelling.
The remainder of the paper is organized as follows. Section 2 presents the related work on transfer learning and thermal comfort modelling. Section 3 introduces the datasets and shows preliminary analysis. Section 4 demonstrates the proposed thermal comfort modelling framework. Section 5 contains the result of experiments with the detailed experiment settings, comparison with the state-of-the-art algorithms, and improvement analysis with different configurations (e.g., feature combinations, number of hidden layers). Section 6 concludes the paper and shows the direction in future work.
2. Related Work
This section discusses the background on thermal comfort modelling techniques and transfer learning applications especially on sensing data. Then we summarize the data-driven thermal comfort studies in Table 1 and address the advantages of this research.
2.1. Thermal Comfort Modelling
Fanger’s PMV model and de Richard’s adaptive model are the most famous knowledge-driven thermal comfort models. The adaptive model (De Dear and Brager, 1998) is based on the idea that occupant can adapt to different temperatures in different times and outdoor weather affects indoor comfort. Occupants can achieve their own comfort through personal adjustments such as clothing changes or window adjustments. Clear et al. (Clear et al., 2013) explored how adaptive thermal comfort could be supported by new ubiquitous computing technologies. They addressed that IoT sensing technologies can help build a more sustainable environment where people are more active in maintaining and pursuing their thermal comfort, which is less energy-intensive and less tightly controlled.
Recently, data-driven thermal comfort modelling becomes more and more popular and a lot of efforts have been made for applying machine learning and deep learning techniques to human thermal comfort modelling. Ran et al. (Ranjan and Scott, 2016) used Rotation Forests to predict thermal comfort with thermographic imaging involving thirty individuals in a UK office building. Similarly, Ghahramani et al. (Ghahramani et al., 2018) used a hidden Markov model (HMM) based learning method to predict personal thermal comfort with infrared thermography of the human face from 10 subjects. Chaudhuri et al. (Chaudhuri et al., 2018) established a random forest-based thermal comfort model for different gender groups (6 females and 8 males) using physiological signals (e.g., skin conductance, blood pressure, skin temperature). However, all the thermal comfort prediction models mentioned above need to install additional devices (individual thermal cameras, smart eyeglass, physiological sensors) and may lead to the privacy concern.
Luo et al. (Luo et al., 2020) compared to nine widely used machine learning algorithms for thermal sensation prediction using the ASHRAE Comfort Database II. They found that ML-based thermal sensation prediction models generally have higher accuracy than traditional PMV models and Random Forest has the best performance compared with other ML algorithms. They also addressed the importance of tuning parameters and selecting input features for machine learning models.
| Reference | Date | Dataset | Data source | Location | Time | Approach | Key findings | ||||||||||
|---|---|---|---|---|---|---|---|---|---|---|---|---|---|---|---|---|---|
| Hu et al. (Hu et al., 2018) | 2018 |
|
Field study | Singapore | 3 weeks |
|
|
||||||||||
| Zhang et al. (Zhang et al., 2018) | 2018 |
|
Field study | Philadelphia, USA | 1 year |
|
|
||||||||||
| Ran et al. (Ranjan and Scott, 2016) | 2016 |
|
Lab study | UK | 5 weeks | Rotation forest |
|
||||||||||
| Ghahramani et al. (Ghahramani et al., 2018) | 2018 |
|
Lab study | Los Angeles, USA | 4 days |
|
|
||||||||||
| Chaudhuri et al. (Chaudhuri et al., 2018) | 2018 |
|
Lab study | Singapore | 2 months | Random forest |
|
||||||||||
| Luo et al. (Luo et al., 2020) | 2020 |
|
Field study | Multiple locations | N/A |
|
|
||||||||||
| Ferreira et al. (Ferreira et al., 2012) | 2012 |
|
Field study | Portugal | 8 days |
|
|
||||||||||
| Hu et al. (Hu et al., 2019) | 2019 |
|
Lab study | Singapore | 4 months |
|
|
||||||||||
| This work | N/A |
|
Field study | Multiple locations | 1 year |
|
|
In recent years, the use of the artificial neural network in thermal comfort modelling in buildings has been increasing significantly. Ferreira et al. (Ferreira et al., 2012) addressed the problem of controlling an HVAC system with the purpose of achieving a desired thermal comfort level and energy savings. Several neural network models have been investigated to calculate the PMV index for the model based predictive control, which provide good coverage of the thermal sensation scale. Hu et al. (Hu et al., 2018) built an intelligent thermal comfort management system using sensing data and wearable data. They implemented a black-box MLP neural network for thermal comfort modelling, which displayed better prediction performance than the PMV model, traditional white-box machine learning models (e.g., Naïve Bayes, k-Nearest Neighbor and Decision Tree) and classical black-box machine learning models (e.g., Support Vector Machine, Random Forest).
Compared to most previous research using coarse-grained architecture (link input attributes and thermal comfort score directly), Zhang et al. (Zhang et al., 2018) used the MLP neural network to model the relationship between controlling building operations and thermal comfort factors, their proposed fine-grained DNN approach for thermal comfort modelling outperforms the coarse-grained modelling and the other popular machine learning algorithms.
2.2. Transfer Learning Applications
Though great contributions have been made for improving the prediction accuracy of thermal comfort through various machine learning techniques, there still exists a main bottleneck for data-driven thermal comfort modelling - the accessibility of sufficient thermal comfort data. Transfer learning allows researchers to learn an accurate model using only a tiny amount of new data and a large amount of data from a previous task (Dai et al., 2009).
The transfer learning technique has been applied to many real-world applications involving image/video classification, natural language processing (NLP), recommendation systems, etc. For instance, transfer learning technique has been used for the children’s Automatic Speech Recognition (ASR) task (Shivakumar and Georgiou, 2018). Researchers learn from adult’s models to children’s models through a Deep Neural Network (DNN) framework. They investigated the transfer learning techniques between adult and children ASR systems in acoustic variability (layers near input) and pronunciation variability (layers near output), and updated both the top-most and bottom-most layers and kept the rest of the layers fixed.
Some existing work has focused on transfer learning on the sensor data. Wang et al. (Wang et al., 2018) proposed a transfer learning based framework for cross-domain activity recognition. Firstly, they used the majority voting technique to obtain the pseudo-label of the target domain. Intra-class knowledge transfer was interactively performed to convert two domains into the same feature subspace. After that, labels for the target domain can be ignored by the second annotation. Ye et al. (Ye, 2018) learned human activity labels by leveraging annotations across multiple datasets with the same feature space even though the datasets may have different sensing deployment, sensing technologies and different users.
Recently, a transfer active learning framework was proposed to predict thermal comfort (Natarajan, 2019). They considered the thermal comfort prediction as inductive transfer learning where labelled data is available in both source and target domains but users do not have access to all labelled data in target domain. They used parameter transferred from the source domain to target domain. The biggest disadvantage of their method is that they assume the feature spaces in both domains must be same, which is not applicable in the daily life as there may exist unique useful features in the target dataset.
Similarly, Hu et al. (Hu et al., 2019) adopted transfer learning for thermal comfort modelling and assumed the feature space of source domain is a subset of that of target domain. They connected the classifiers from source domain and target domain and then built a new classifier to obtain knowledge from source domain, but did not explain why the network structure works well. Besides, they trained the thermal comfort model for the lab study and learn knowledge from data from buildings all over the world in the ASHRAE RP-884dataset, but did not consider the differences of thermal environments in different climate zones.
The data-driven thermal comfort modelling works are summarized in Table 1. Overall, there are several advantages of our work: (1) we are the first to transfer the knowledge from similar thermal environments (climate zones) to the target building for effective thermal comfort modelling. Most previous research focus on building thermal comfort model for one target building (Hu et al., 2018; Zhang et al., 2018; Ranjan and Scott, 2016; Ghahramani et al., 2018; Chaudhuri et al., 2018; Luo et al., 2020; Ferreira et al., 2012). Even though a few research (Hu et al., 2019) started to apply transfer learning for building thermal comfort model, their target dataset is collected from the lab study and does not consider the influences of different climate zones; (2) unlike some research use data collected from the lab study (Ranjan and Scott, 2016; Ghahramani et al., 2018; Chaudhuri et al., 2018; Hu et al., 2019), we build the thermal comfort model using data from the field study in both target and source domain, which is much more meaningful in real-world scenarios; (3) compared with some research utilising additional devices (e.g., thermal cameras in (Ranjan and Scott, 2016), eyeglass in (Ghahramani et al., 2018), wristbands in (Hu et al., 2019)), our research is easier and cheaper to be carried out, and better to protect the privacy of occupants.
3. Data Sets Introduction
In this section, we first introduce the basic information of three popular datasets adopted in this research. Then we conduct the preliminary analysis to understand the variables (environmental and personal factors) and patterns in each dataset.
3.1. Overview
ASHRAE RP-884 Database (of Heating et al., 2004). The ASHRAE RP-884 database is one of the most popular public databases for human thermal comfort study, which has been used in numerous previous research (Toe and Kubota, 2013; Langevin et al., 2012; Lu et al., 2019; von Grabe and Winter, 2008). ASHRAE RP-884 dataset was initially collected to develop De Dear’s adaptive model, involving more than 25,000 observations collected from 52 studies and 26 cities over different climate zones all over the world. We adopt this public database as one of the source datasets in our research.
| Dataset | ASHRAE RP-884 | The Scales Project | Medium US Office |
|---|---|---|---|
| Instances | 25,623 | 8225 | 2,497 |
| Participants | Unknown (48% M, 52% F) | 8225 (53% M, 46% F) | 24 (33% M, 67% F) |
| Indoor AT Range (C) | 6.2 - 42.7 | 13.2 - 34.2 | 17.9 - 27.8 |
| Indoor RH Range (%) | 2.0 - 97.8 | 18.0 - 82.4 | 15.7 - 72.4 |
| Indoor AV Range (m/s) | 0.01 - 1.71 | 0.00 - 0.70 | 0.02 - 0.19 |
| MR Range (Met) | 0.64 - 6.82 | NaN | 1.00 - 6.80 |
| CL Range (Clo) | 0.04 - 2.29 | NaN | 0.21 - 1.73 |
The Scales Project Dataset (Schweiker et al., 2019). The Scales Project dataset is published in 2019 which contains thermal comfort responses from 57 cities in 30 countries for 8225 participants. This dataset aims at exploring participants’ thermal comfort, thermal sensation, thermal acceptances and to investigate the validity of assumptions regarding the interpretation of responses from the survey. This public dataset is used as one of the source datasets in the research.
Medium US Office Dataset (Langevin et al., 2015). Medium US Office dataset developed by Langevin et al. (Langevin et al., 2015) is a popular dataset used by recent thermal comfort studies (Schweiker and Wagner, 2016; Zhang et al., 2018). It collected data from 24 participants (16 females and 8 males) in the Friends Center Office building in Philadelphia city, USA. Longitudinal thermal comfort surveys are distributed online 3 times daily (morning, mid-day and afternoon) for a continuous 2-week period in each of the four project seasons between July 2012 and August 2013. Data types vary from daily surveys to sensor data including but not limited to the indoor air temperature, air velocity, relative humidity, concentration and illuminance. This public dataset is used as the target dataset in the research.
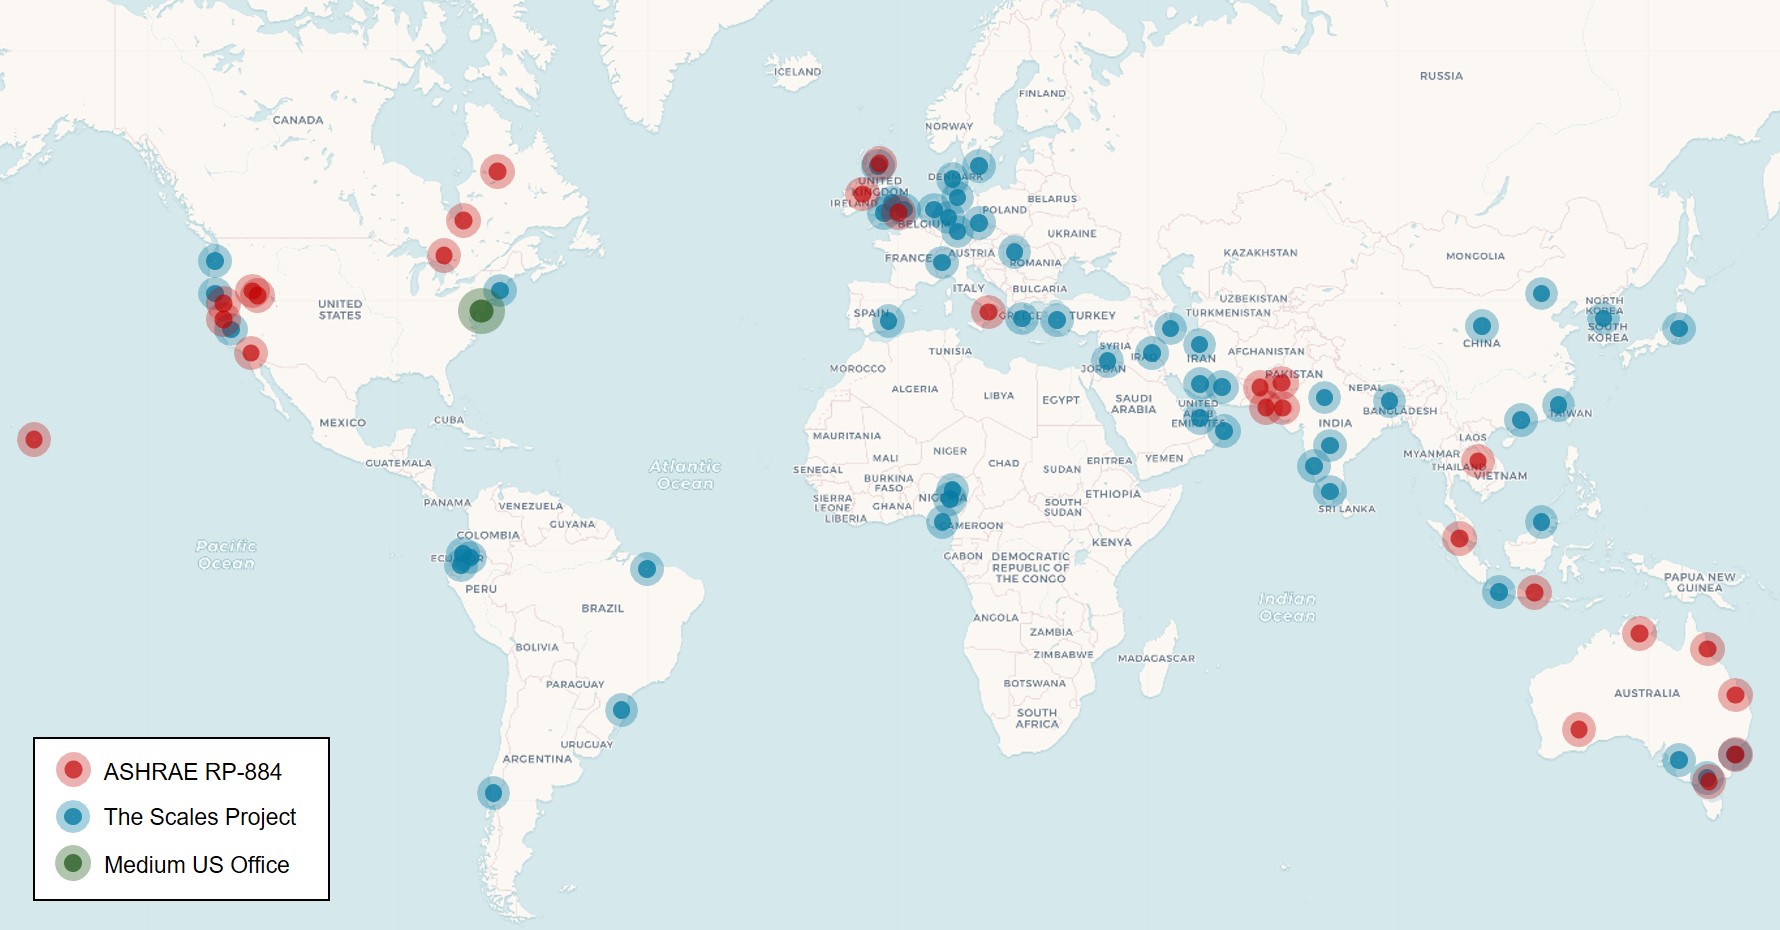
The locations of all cities conducting the study are displayed in Figure 2. Red points represent 26 cities in the ASHRAE RP-884 database, blue points mean the 57 cities in the Scales Project dataset, and green point indicates the Philadelphia city in the Medium US Office dataset. In this research, we aim to learn the knowledge from data in cities indicated by red points and blue points, to benefit one building in the Philadelphia (green points).
Table 2 shows the basic information for the ASHRAE RP884 database, the Scales Project dataset and Medium US Office dataset. The first two datasets have different building types (HVAC, naturally ventilated and mixed ventilated) while there is only one HVAC building in Medium US Office dataset. Since the ASHRAE and Scales datasets include different climate zones all over the world, they have wider indoor air temperature ranges than Friends Center building in Medium US Office (17.9-27.8). Different to the ASHRAE RP-884 database and the Scales Project dataset, Medium US Office have much smaller participants. Besides, the range of indoor relative humidity (Indoor RH), indoor air velocity (Indoor AV), metabolic rate (MR), clothing level (Clo) in Medium US Office is smaller than the ASHRAE dataset. In Medium US Office dataset, we found that 67% thermal survey responses are from female participants and in the ASHRAE/Scales datasets, the responses from male and female are almost the same.
3.2. Preliminary Analytics
In this section, we conduct some preliminary analytics between the ASHRAE RP-884 dataset, the Scales Project dataset and Medium US Office dataset. We observe that these three datasets have plenty of similarities, and of course, there are some differences.
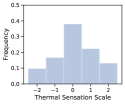
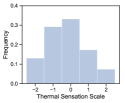
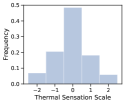
Figure 3 shows the distribution of thermal sensation for the ASHRAE RP-884 dataset, the Scales Project and Medium US Office dataset. Since the instances of sensation scale for +3 (Hot) and -3 (cold) is far less than the other instances in both data sets, we merged +3 (hot) and +2 (warm) into one class, and -3 (cold) and -2 (cool) into one class. In the office environment, indoor environmental factors such as temperature are generally maintained at a relatively comfortable level (17.9-27.8 in Medium US dataset), people can also choose to adjust their clothing level and behaviour (e.g., open the heater, have hot drinks) in case of too cold or too hot.
Although the regression model is effective in many times-series problems (Shao et al., 2018; Gao et al., 2019), classification method still dominate the thermal comfort area. Therefore, in this paper, we choose the classifiers rather than regressors for effective thermal comfort prediction. Besides, based on the previous discussion, thermal sensation scales are classified into 5 categories (i.e., cold or cool, slightly cool, neutral, slightly warm, hot or warm).
For the above three datasets, they have similar thermal sensation distributions and occupants feel neutral towards the thermal environment in most time. We can observe that there are more responses for feeling slightly warm or cool than feeling warm/cool or hot/cold, which accords with our thermal comfort feelings in daily life. Meanwhile, the thermal sensation distributions in the ASHRAE dataset and the Scales Project dataset are more uniform than the distribution of the Medium US Office dataset. This is because the ASHRAE dataset and the Scales Project dataset consist of a variety of data from different climate zones all over the world while Medium US Office dataset only includes data from one building.
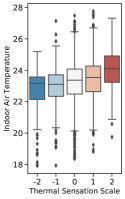
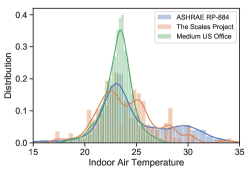
Indoor air temperature is one of the most significant factors affecting occupant’s thermal feelings. Figure 4 shows the distribution of indoor air temperature for the three datasets, most temperature values are between 22-24. However, there are also some differences between these three distributions. The ASHRAE and the Scales Project dataset has higher indoor air temperature due to the fact that some thermal sensations responses are from the hot climate area. On the contrary, in Medium US Office dataset, the indoor temperature distribution seems to be centered around 20 to 27.
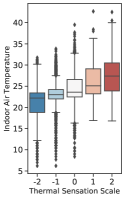
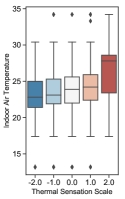
From Figure 5, we can see the relationship between the indoor air temperature and thermal sensation scale. Usually, a higher indoor air temperature indicates a higher thermal sensation scale for all three datasets. Interestingly, in Medium US Office dataset, the average indoor air temperature for feeling cold or cool is a bit higher than that for feeling slightly cool. This phenomenon may be due to too few subjects (24 participants in total) in the Medium US Office dataset. Also, the other factors such as relative humidity, age, gender, outdoor weather will affect the thermal sensation. That’s the reason why we try to use as many features to build a more accurate and robust thermal comfort prediction model.
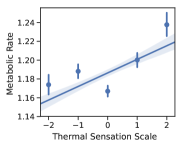
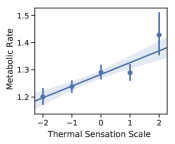
Figure 6 indicates that, in ASHRAE and Medium US Office datasets, the metabolic rate has a positive relationship with the thermal sensation scale. Although they have different average values and confidence intervals for metabolic rate, the trend of how thermal sensation scale changing over metabolic rate seems the same.
From the above analysis, there are observable differences between the ASHRAE, the Scales Project and Medium US Office datasets. One of the reason is that buildings in these three datasets are located in various climate zones, where the climate variability can lead to a different working environment, occupant cognition and behaviour, therefore affecting occupants’ thermal sensation in different buildings. Considered the three datasets share lots of similarities in occupant thermal comfort, and the number of instances in the target dataset is very limited, we then explore to infer occupants’ thermal comfort by learning from multiple buildings in the same climate zone with similar climate conditions. We will then introduce the proposed thermal comfort modelling in Section 4.4.
4. Methodology
In this section, we introduce the proposed thermal comfort transfer learning framework. Firstly, we introduce the problem definition and then discuss the selected features in the source datasets and target dataset. After that, we demonstrate the methods of dealing with imbalanced thermal comfort dataset. Lastly, we explain the proposed thermal comfort modelling framework.
4.1. Problem Definition
To learn sensor data from multiple datasets for thermal comfort modelling, some notations need to be defined in this paper. Firstly, we give the definition of a ’task’ and a ’domain’. A domain can be represented as , which contains two parts: the feature space and the marginal probability distribution , where X = . The task can be represented as , which contains two components: the label space and a target prediction function . can not be observed but can be learnt from the training data, which could also be considered as a conditional function .
In our research, we aim to transfer the knowledge from the source domain (RP-884 and the Scales Project datasets) to benefit the thermal comfort prediction in the target domain (Medium US Office dataset). Although both domains have different features, they share several common features such as indoor air temperature, indoor relative humidity, indoor air velocity, indoor mean radiant temperature, clothing level, metabolic rate, occupants’ age and gender. Therefore, predicting thermal comfort falls under Transductive transfer learning (Arnold et al., 2007), which can be formally defined as: Given a source domain and the corresponding learning task , a target domain and the corresponding learning task , we aims to improve the performance of the prediction function in , by discover the knowledge from and , where and .
| Category | Data Source | Feature Name | Description | Units |
| Indoor | HOBO Datalogger (15 mins) | Indoor_AT | Indoor temperature | |
| Indoor_RH | Indoor relative humidity | |||
| Indoor_AV | Indoor air velocity | |||
| Indoor_AMRT | Indoor radiant temperature | |||
| Outdoor | Weather Analytics (15 mins) | Outdoor_AT | Outdoor temperature | |
| Outdoor_RH | Outdoor humidity | |||
| Personal | Daily Survey (3 times/day) | CL | Clothing insulation | clo |
| MR | Metabolic rate | Met | ||
| Background Survey (once) | Age | Participant’s age | Years | |
| Gender | Participant’s gender |
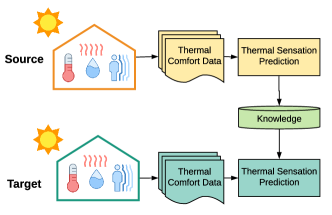
Figure 7 shows the thermal comfort transfer learning system, in which we could use the transfer learning method to learn knowledge from the source datasets and benefit the target dataset in a specified city.
4.2. Feature Selection
Human thermal sensation is influenced by a variety of factors such as time factors (Auffenberg et al., 2015), personal information (Chaudhuri et al., 2018), environmental changes (Seppänen et al., 1999), and culture (Indraganti and Rao, 2010). In this research, several features are chosen for thermal comfort transfer learning based on the following criteria: (1) the features are commonly studied in previous thermal comfort research; (2) the features are easy to be calculated or collected by passive sensing or self-report responses. In sum, we divide the features into three broad categories: indoor environmental features, outdoor environmental features and personal features. Table 3 displays the selected features in Medium US Office dataset.
Indoor Environmental Features. Indoor environment affects the occupants’ thermal comfort directly and we adopt the following basic indoor environmental features derived from Fanger’s PMV model (Fanger et al., 1970): air temperature, mean radiant temperature, air velocity and relative humidity for thermal comfort prediction. Air temperature is the average temperature of the air surrounding the occupant around the location and time. Radiant temperature indicates the radiant heat transferred from a surface, and the mean radiant temperature is affected by the emissivity and temperature of surrounding surfaces, viewing angles, etc. Air velocity means the average speed of air with respect to the direction and time. The relative humidity is the ratio of amount of water vapour in the air to the water vapour that the air can hold at specified pressure the temperature.
Outdoor Environmental Features. Outdoor weather conditions can have physiological effects on individuals thermal perception and clothing preference in different seasons (Becker and Paciuk, 2009; Zhang et al., 2020). For instance, in summer people tend to choose lightweight clothing, which will have an influence on their indoor thermal comfort. The most popular measurements of outdoor environment include outdoor air temperature, outdoor humidity, which will also be adopted in this research.
Personal Features. Studying personal features is crucial for effective thermal comfort modelling because thermal sensation is a subjective measurement and different individuals perceive the same environment differently. In this research, we select the following personal features: clothing insulation, metabolic rate, age and gender. Clothing insulation has a major impact on thermal comfort level because it affects heat loss and thus the heat balance. Previous research shows the relationship between age and thermal sensation (Indraganti et al., 2015; Indraganti and Rao, 2010). Besides, Sami et al. (Karjalainen, 2007) found a significant gender difference in thermal comfort: females tend to prefer a higher room temperature than males and feel both uncomfortably hot and uncomfortably cold more often than males. Hence, gender and age are considered as the features for thermal comfort modelling.
The features in a source domain can be considered as a subset in target domain. The ASHRAE dataset shares eight features with the Medium US Office dataset while the Scales Project dataset only shares six features with target dataset. Although there are various other features in the three datasets above such as occupant behaviour data (e.g., adjust heaters/ curtains/ thermostats) and background survey (e.g., acceptable temperature), we just simplify the thermal comfort prediction and therefore do not show the other features.
4.3. Imbalance Class Distribution
As thermal sensation scale are 5-point values, we regard thermal comfort prediction as a classification task. Fig. 3 shows the distributions of the ASHRAE RP-884, the Scales Project and Medium US Office datasets. It is clear that the three distributions are imbalanced and the number of thermal sensation instance for -1 (cool) to 1 (warm) far exceeds the other instances. To train a fair classifier, we must deal with this class imbalance issue in thermal comfort data. Take the binary classification as an example. If class is 95% and class is 5% in the dataset, we can simply reach an accuracy of 95% by predicting class each time, which contributes a useless classifier for our purpose. In this research, we assume the survey responses are ’correct’. Although there may exist some biases (e.g., rating bias, anchoring bias, social-desirability bias) in self-report data, we will not discuss them in this paper.
To deal with the imbalanced dataset, oversampling and undersampling are efficient techniques to adjust the class distribution of the data set. Under-sampling (e.g., Clustering, Edited Nearest Neighbours (Wilson, 1972), Tomek Links (Tomek, 1976)) can balance the dataset by reducing the size of the majority class. However, under-sampling methods are usually used when we have sufficient data. Oversampling (e.g., Synthetic Minority Oversampling Technique (Chawla et al., 2002), Adaptive Synthetic Sampling (He et al., 2008)) aims to balance the dataset by increasing the number of minority classes, which can be applied when the data is insufficient.
Generative Adversarial Network (GAN) has got successful applications in various fields which can learn the probability distribution of a dataset and synthesize samples from the distribution. GAN uses a generator to capture the underlying data distribution of a dataset and a discriminator to estimate the probability that a given sample comes from the original dataset rather than being created by . Some techniques such as TableGAN (Park et al., 2018), TabularGAN (Xu and Veeramachaneni, 2018) have been proposed to handle the imbalance of tabular data. Particularly, Quintana et al. (Quintana and Miller, 2019) have used TabularGAN to synthesize a small thermal comfort dataset. They found that when the size of synthesized data is no larger than the size of real samples, the thermal comfort dataset can achieve similar performance to the real samples.
In the thermal comfort classification problem, labelled thermal comfort responses are usually small in samples. Therefore, in this research, we explore to synthesize survey responses for handling the imbalance of thermal sensation classes. TabularGAN 111Python package for TabularGAN: https://pypi.org/project/tgan/ is used in this research to generate tabular data based on the generative adversarial network. TabularGAN can learn each column’s marginal distribution by minimizing KL divergence, which is suitable for the thermal comfort classification problem compared with other methods such as TableGAN, Edited Nearest Neighbors (Wilson, 1972), SMOTE (Chawla et al., 2002), etc. The reason why we did not adopt TableGAN is that it optimizes the prediction accuracy on synthetic data through minimizing cross entropy loss while TabularGAN focuses more about marginal distribution. It learns each column’s marginal distribution by minimizing KL divergence, which is more suitable for the thermal comfort classification problem.
4.4. Thermal Comfort Modelling
Traditional data-driven thermal comfort modelling is isolated and occurs purely based on specific buildings in the same climate zone. No thermal comfort knowledge is retained which can be transferred from one thermal comfort model to another. Recently, the transfer learning technique has been intensively studied in different applications (Natarajan, 2019; Shivakumar and Georgiou, 2018). Transfer learning aims to leverage knowledge from source tasks and then apply them to the target task. There are various transfer learning techniques which can be roughly grouped into three categories: inductive transfer learning, unsupervised transfer learning and transductive transfer learning (Pan and Yang, 2009). Inductive transfer learning (Daume III and Marcu, 2006) aims to improve performance on the current task after having learned a different but related skill or concept on a previous task. Unsupervised transfer learning (Dai et al., 2008) focus on solving unsupervised learning tasks in the target domain such as dimensionality reduction, clustering, and density. Transductive transfer learning aims to utilize the knowledge from the source domain to improve the performance of the prediction task in the target domain.
Transductive transfer learning can exploit the different levels of information captured from different layers in the neural network. Generally, layers close to the input data capture specific characteristics in the dataset while deeper layers could capture information more relevant to the tasks (e.g., object types in image recognition, thermal sensation labels in thermal comfort prediction). The Medium US Office dataset, as described in Section 3.1, differs in cities and climate zones from the ASHRAE dataset and the Scales Project dataset. In different climate zones, there are various factors possibly contributing to thermal comfort, e.g., climate characteristics, occupants’ recognition and endurance. This motivates us to investigate the transfer learning between the ASHRAE/the Scales Project datasets and Medium US office dataset in climate variability, which is close to the layers near the input.
We assume the climate variability affects the lower-level neural network only. Therefore, these layers need to be adapted to better represent the Friends Center office building in the target dataset. This can be regarded as retaining the knowledge of higher-level mappings from the source dataset. Hence, we retain the last hidden layer of models in ASHRAE and the Scales Project as shown in Figure 8. Then, the thermal comfort neural network will be retrained with Medium US Office dataset until convergence to find optimal parameters for lower hidden layers.
5. Experiment
In this section, we conduct experiments on the proposed thermal comfort transfer learning method and compare the performance with the state-of-the-art techniques and different configurations. We aim to address the research questions: Can we predict occupants’ thermal comfort accurately by learning from multiple buildings in the same climate zone when we do not have enough data? If so, which features contribute most for effective thermal comfort transfer learning? Specifically, we explore how the numbers of hidden layers and sample size of the training set in the target building affect thermal comfort transfer learning performance.
5.1. Experiment Setup
In our research, the source domain (ASHRAE RP-884 dataset and the Scales Project dataset) and the target domain (Medium US Office dataset) share some common features, which includes four indoor environmental variables (air temperature, indoor relative humidity, mean radiant temperature, indoor air velocity), two environmental variables (air temperature and humidity) and two personal variables (age and gender). At the same time, ASHRAE R[-884 and Medium US Office datasets share another two personal variables (clothing insulation, metabolic rate). The shared features make it possible to transfer knowledge to the target domain from the source domain.
Pre-Processing. As discussed in Section 3.2, we firstly merge the minority classes and reclassify the thermal sensation into five categories. Then, we standardize features by scaling to unity variance for better classification performance. Considering the thermal sensation classes are extremely imbalanced, in order to train a meaningful classifier, the TabularGAN (Xu and Veeramachaneni, 2018) technique is applied for synthesizing samples in all the classes except the majority class in the training set. 50% sample number in each class was synthesized while ensuring that the number of samples per category does not exceed the number of samples in the majority class.
Take the Medium US Office dataset for example, there are 2497 instances in the original dataset. After removing the null value and categorizing the responses of thermal sensation, there are 1090 responses for ’neutral’, 462 responses for ’slightly cool’, 408 responses for ’slightly worm’, 154 responses for ’cool or cold’ and 131 responses for ’warm or hot’. After synthesizing the data using TabularGAN, there are 981 responses for ’neutral’, 624 responses for ’slightly cool’, 551 responses for ’slightly warm’, 208 responses for ’cool or cold’ and 177 responses for ’warm or hot’ in the training set (90% of the dataset).
Architecture. In this research, we choose the multilayer perception (MLP) neural network as the classifier for the source domain and target domain. Each neural network consists of two hidden layers with 64 neurons in each layer. The Relu function is used as the activation function in hidden layers. Then, the softmax function is applied to the output layer as the activation function. We train the classifier with the categorical cross-entropy loss function and the Adam optimizer with learning rate = 0.001. The batch size is set to 200 and the max epoch have been set to 500. Besides, fixed random seed is chosen for dataset shuffling and training.
Evaluation. Similar to previous thermal comfort studies (Hu et al., 2018; Ranjan and Scott, 2016; Chaudhuri et al., 2018; Ghahramani et al., 2018), accuracy and weighted F1-score are chosen as the performance metrics. Accuracy reflects the overall performance for the thermal comfort model. Since our priority goal is to correctly predict the thermal sensation for as many occupants as possible to achieve the overall thermal comfort/energy saving in the building, accuracy is used as the main evaluation metric in this problem. We also adopt weighted F1-score as the good component to accuracy for capturing performance across imbalanced classes. F1-score takes both false positives and false negatives into account to strike a balance between precision and recall. ‘Weighted-average’ calculate metrics for each class, and find their average weighted by the number of true instances for each class. It takes class imbalance into account compared with the ‘macro-average’ method. Weighted F1-score is helpful for evaluating thermal sensation classifiers as it can take all imbalanced classes into consideration. That is to say, it evaluates the classifiers for different user groups with different thermal sensation levels instead of all occupants globally.
Baselines. For the baseline, three different categories of baselines are selected to compare with our proposed method: Random guess, PMV model and multiple traditional machine learning models. Random guessing generates the sample from the distribution of thermal comfort and regards it as a predicted value. Similar random baselines have been widely used in previous thermal comfort studies such as (Abouelenien et al., 2017; Hu et al., 2019). The PMV model is the most prevalent thermal comfort model all over the world. In the experiment, we will only use the four indoor environmental variables, metabolic rate and clothing insulation to calculate the PMV score according to the formula in (da Silva et al., 2014) for the target dataset. Then the thermal sensation class is calculated based on the Equation 1.
| (1) |
For the multiple traditional machine learning models, we choose K-nearest Neighbors (Fukunaga and Narendra, 1975), Naive Bayes (Rish et al., 2001), Support Vector Machine (with Linear, RBF and Polynomial kernel) (Suykens and Vandewalle, 1999), Decision Tree (Safavian and Landgrebe, 1991), Random Forest (Liaw et al., 2002), AdaBoost (ZHAO et al., 2010) as baselines. Naive Bayes (Rish et al., 2001) from Bayes family methods is chosen due to its fast speed and working well with high dimensions. Support Vector Machine (Suykens and Vandewalle, 1999) technique is efficient for handling high dimensional spaces. Different from algorithms like SVM, AdaBoost (ZHAO et al., 2010) is fast, simple and easy to use with less need for tuning parameters. K-nearest Neighbors (Fukunaga and Narendra, 1975) is a simple method storing all available instances and classifying data instances according to a similarity measure, which has been widely used in the pattern recognition and statistical prediction area. Random Forest (Liaw et al., 2002) is an ensemble learning method for classification operated by building multiple decision trees. It can cope with high-dimensional features and judge the feature importance.
Compared to thes PMV model using six factors for thermal comfort prediction, the multiple machine learning algorithms use ten features as input features (see Table 3). Besides, all the above three baselines build thermal comfort classification model on the Medium US dataset.
Cross-validation. We apply the -fold cross-validation (Bengio and Grandvalet, 2004) (k=10) method for effective thermal comfort classification. The advantage of 10-fold cross-validation is to estimate an unbiased generalization performance of the thermal comfort prediction model. In the experiment, the data from the target domain (US Medium Office dataset) is randomly partitioned into 10 folds and each fold serves as the testing data iteratively and the remaining 9 folds are used as training data. The cross-validation process is repeated 10 times and the prediction results (accuracy and weighted F1-score) are averaged to produce a single estimation.
| Climate | Number of cities | Instances | ||||
|---|---|---|---|---|---|---|
| Tropical |
|
3826 | ||||
| Dry |
|
3290 | ||||
| Temperate |
|
3512 | ||||
| Continental | 3 (Ottawa, Montreal, Grand Rapids) | 2808 | ||||
| All | 26 | 13436 |
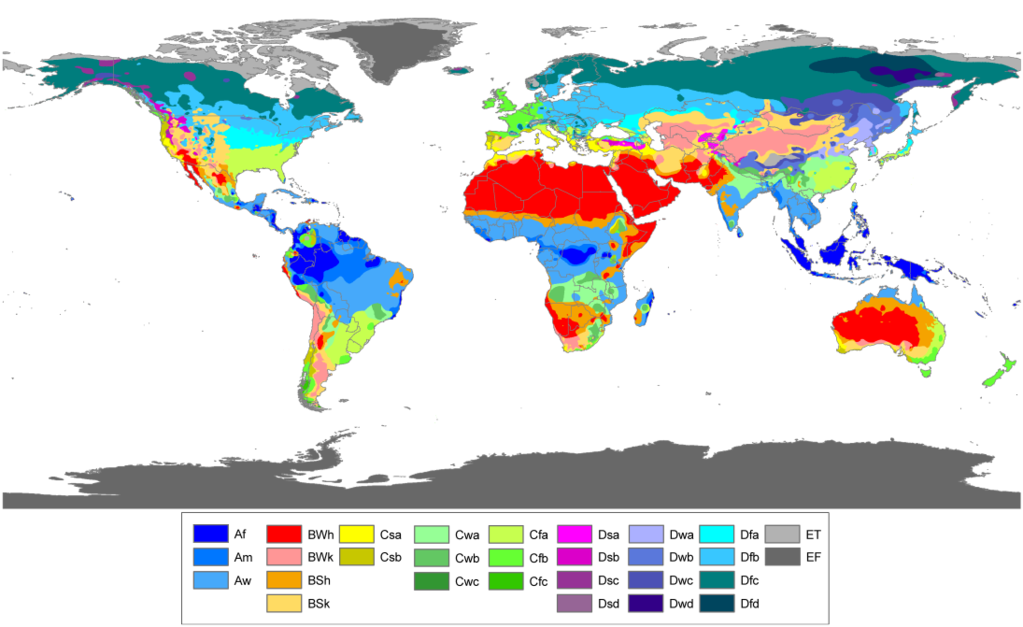
Climate zone divisions. We adopt Köppen climate classification updated by Peel et al. (Peel et al., 2007) which is one of the most widely used climate classification systems in the world. As shown in see Figure 9, the Köppen climate classification divides climates into five main climate zones: A (tropical), B (dry), C (temperate), D (continental), and E (polar). Each large climate zone is then divided into several small subzones based on temperature patterns and seasonal precipitation. All specific climates are assigned a main group of climate zone (the first letter).
In our study, the target domain (Philadelphia city in the US) belongs to the ’temperate’ climate zone. In the source domain, the Scales Project dataset includes 8225 instances from 57 cities in total, and 5411 instances from 32 cities (e.g., Yokohama, Sydney, Cambridge) where located in the ’temperate’ climate zone. For the ASHRAE RP-884 database, it consists of 25623 thermal comfort responses from 26 cities in total, where 12 cities (e.g., Berkeley, Athens, Chester) (Yong and Djamila, 2019) are situated in the same climate zone with Philadelphia city.
We run the proposed transfer learning based multilayer perceptron (TL-MLP) model and transfer learning based multilayer perceptron from the same climate zones (TL-MLP-C*) model with the ASHRAE database and the Scales Project database as the source domain, the Medium US Office dataset as the target domain. Especially, for both proposed models, we only use the data from HVAC buildings in all datasets. For the TL-MLP-C* model, we use the data from HVAC buildings in the same climate zone as the source domain and Friends Center building as the target domain.
Besides, we classify the HVAC buildings in ASHRAE RP-884 database to different climates (see Table 4). It shows that, in ASHRAE RP-884 database, there are 13436 observations from HVAC buildings in total and 3512 observations in the ’temperate’ climate zone. Since the Scales Project dataset recorded the Köppen climate and HVAC status information during the data collection, after calculation, there are 4621 observations from HVAC buildings in total and 3245 observations collected from the HVAC buildings located in ’temperate’ climate zone.
5.2. Overall Prediction Result
| Algorithm | Accuracy(%) | F1-score(%) |
| PMV | 33.35 (2.40) | 32.45 (2.35) |
| Random | 27.23 (1.30) | 29.30 (1.40) |
| KNN | 41.43 (2.95) | 41.93 (2.85) |
| SVM (Linear) | 29.44 (5.19) | 30.92 (4.84) |
| SVM (RBF) | 37.93 (3.86) | 40.91 (4.04) |
| SVM (Poly) | 34.02 (4.59) | 37.66 (5.15) |
| Decision Tree | 43.33 (4.94) | 43.34 (4.87) |
| Random Forest | 51.41 (3.03) | 52.93 (3.69) |
| Naive Bayes | 40.43 (4.10) | 39.40 (3.97) |
| AdaBoost | 42.94 (3.22) | 42.41 (3.94) |
| MLP | 50.35 (3.81) | 50.67 (4.51) |
| TL-MLP | 50.76 (4.31) | 53.60 (4.43) |
| TL-MLP-C* | 54.50 (4.16) | 55.12 (4.14) |
Table 5 shows the performance of different thermal comfort modelling algorithms. We use all the ten features described in Section 4.2 on most algorithms except for the PMV model. From Table 5, we can see that the PMV model only performs better than the Random baseline and SVM classifiers (kernel = ’Linear’) in accuracy. The F1-score of linear SVM is still higher than the PMV model. This may be due to the fact we use more features in machine learning classifiers while the PMV model only has six factors. We will discuss the prediction performance with different features sets later in Section 5.3.
From Table 5, it can be observed that the Random Forest algorithm performs best on all metrics compared with the PMV model, random baseline and other data-driven models including eight traditional machine learning classifiers. This may because Random Forest is usually regarded as the best classification algorithm for small datasets (Hu et al., 2019) and has been proved to have the highest prediction accuracy for thermal sensation (Luo et al., 2020).
Most importantly, we find that TL-MLP has higher F1-score for thermal comfort classification than other machine learning methods without using transfer learning. Though TL-MLP has better prediction performance than MLP on all metrics, the prediction accuracy of TL-MLP is slightly lower than the Random Forest. The potential reason is that TL-MLP transfer knowledge from all HVAC buildings in the world regardless of the different climate zones, leading to low prediction accuracy than Random Forest. Excitingly, transfer learning based thermal comfort model from the same climate zone (TL-MLP-C*) works better than all state-of-the-art algorithms on all metrics (accuracy and F1-score), indicating the effectiveness of the proposed approach.
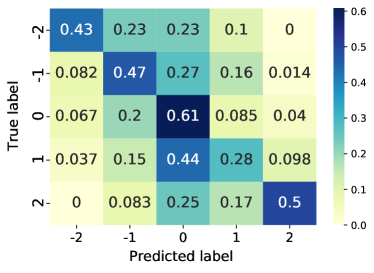
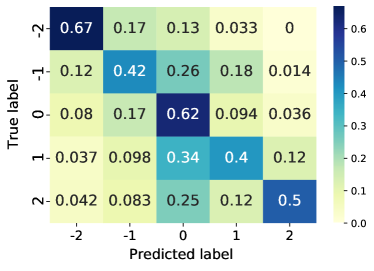
To further investigate how the proposed TL-MLP-C* improves the prediction performance in comparison to MLP, we show the confusion matrix diagrams for MLP and TL-MLP-C* in Figure 10. It can be observed that the MLP model can predict the label 0 (neutral) with the highest probability 0.61 which is similar to 0.62 in TL-MLP-C*. However, it still has high chances to declassify label 1 (slightly warm) to 0 (neutral). Instead, transfer learning based thermal comfort model TL-MLP-C* can predict labels more accurately than traditional MLP model, especially for the minority classes (-2, -1, 1). It can predict 67% label -2 (cool or cold) and 40% label 1 (slightly warm) correctly and achieves the average 54.50% accuracies for all the classes from -2 to 2.
In summary, our proposed transfer learning based models (TL-MLP and TL-MLP-C*) achieve remarkable performance for thermal comfort prediction compared with the random baseline, traditional PMV model and data-driven algorithms without transfer learning. In particular, the TL-MLP-C* model outperforms state-of-the-art algorithms on both metrics (accuracy and F1-score). At the same time, the improved prediction performance of TL-MLP-C* is significant compared to the standard MLP model.
5.3. Impact of Different Feature Combinations
We will now explore how accurately the proposed TL-MLP and TL-MLP-C* models work when only a set of features is available. Usually, indoor sensors are cheap, unobtrusive and have been installed in many HVAC buildings. However, some features may be unavailable due to factors such as privacy, costs, etc. For instance, occupants may not willing to report their age, which reflects their metabolism level and influence their thermal comfort feelings. Besides, it is somewhat inconvenient to install outdoor weather station outside the building which captures outdoor environment changes (e.g., outdoor air temperature and humidity) more accurately than the official weather stations used for local weather forecasting.
Hence, in the experiment, we will divide our features into 3 different sets based on PMV factors, personal factors and outdoor environmental factors, and then compare the different sets and explore which features contribute most for effective thermal comfort transfer learning. The feature sets are as follows:
-
•
: Six basic factors introduced in the PMV model: indoor air temperature, indoor air velocity, indoor relative humidity, indoor radiant temperature, clothing insulation and metabolic rate. This is the most common feature set for thermal comfort modelling used in previous studies (Hu et al., 2019).
-
•
: Six factors from and two personal factors: age and gender. Personal factors such as gender and age can be easily collected through background surveys.
-
•
: Eight factors from and two outdoor environmental factors including outdoor air temperature and outdoor relative humidity. The above two outdoor environmental features need to be accessed from the outdoor weather station near the target building.
| Sets | Algorithm | Accuracy(%) | F1-score(%) |
| PMV | 33.35 | 32.45 | |
| Random Forest | 34.77 | 34.92 | |
| MLP | 33.18 | 34.06 | |
| TL-MLP | 33.53 | 35.90 | |
| TL-MLP-C* | 33.98 | 39.32 | |
| Random Forest | 43.43 | 43.18 | |
| MLP | 42.96 | 45.31 | |
| TL-MLP | 44.10 | 45.88 | |
| TL-MLP-C* | 47.10 | 51.15 | |
| Random Forest | 51.41 | 52.93 | |
| MLP | 50.35 | 50.67 | |
| TL-MLP | 50.76 | 53.60 | |
| TL-MLP-C* | 54.50 | 55.12 |
For different feature sets, we use the same oversampling methods and fixed random seeds in neural network training. Table 6 shows the prediction performance for different feature sets on the target dataset. Random Forest and MLP algorithm are chosen to compare with TL-MLP and TL-MLP-C* algorithms due to their relatively high performance showed in Table 5. For feature sets, we can observe that the performance of TL-MLP and TL-MLP-C* models increase with the growing number of features. In the meantime, TL-MLP-C* model has the highest accuracy and F1-score in each feature set.
For the feature set, the PMV model works slightly better than the MLP model in accuracy but worse in F1-score metrics. Random Forest algorithm achieves the best performance in accuracy while TL-MLP-C* has the highest F1-score. With transfer learning from source datasets, TL-MLP and TL-MLP-C* have similar prediction accuracy with traditional PMV model. It shows that the advantages of the proposed TL-MLP and TL-MLP-C* models can not be fully utilized when the number of features is limited.
In the feature set, all data-driven models achieve better prediction performance than only using the feature set. This shows that personal information (age and gender) could improve thermal comfort prediction effectively. Moreover, TL-MLP-C* model has the best prediction performance than the other methods in both metrics when considering personal factors.
In comparison to the and feature sets, Random Forest, MLP, TL-MLP and TL-MLP-C* work best among all metrics in feature set. This proves that outdoor environmental changes can affect occupants’ thermal sensation in HVAC buildings, and shows the necessity to take outdoor features into consideration for effective thermal comfort modelling.
5.4. Impact of the Number of Hidden Layers
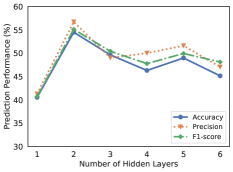
We also conduct adaption experiments by using the different number of hidden layers in TL-MLP-C* model. Figure 11 shows the prediction accuracy and F1-score for TL-MLP-C* with the different number of hidden layers. We can observe that the prediction performance is worst in all metrics with only one hidden layer. Since our proposed transfer learning method is to transfer the last layer of the hidden layer, if we only set one hidden layer, the target dataset will have little contribution to the prediction model. When hidden layers are set to 2, the proposed TL-MLP-C* model has the highest prediction performance in accuracy and F1-score. As the number of hidden layers continues to increase, the prediction performance tends to decrease, which may due to the model being overfitting with more trainable parameters.
Finally, despite that our proposed TL-MLP-C* model has better thermal comfort prediction performance than the-state-of-art methods, the achieved accuracy (54.50%) is still not remarkably high. There are several potential reasons: (1) We adopt TabularGAN to re-sample the minority classes for meaningful classification. 50% size of instances in each class were synthesized while ensuring that the number of samples per category does not exceed the number of samples in the majority class. Though some previous works achieve slightly higher accuracy for thermal comfort prediction (e.g., 63.09% in (Hu et al., 2019), 62% in (Luo et al., 2020)), they only assigned a bit higher weights to the instances in the minority classes which can not handle the class imbalance problem as well as we do. (2) Predicting thermal comfort is challenging since there are many factors that affect occupant thermal sensation (as discussed in Section 1). There may also exist lots of response bias during the survey. Therefore, the classification accuracy in most previous research is not good too and rarely higher than 60% even for personal thermal comfort modelling; (3) It could be better to regard the thermal comfort prediction as a regression problem instead of the classification problem. For example, classifying ’-2’ (cool) to ’-1’ (slightly cool) should be more acceptable than classifying ’-2’ (cool) to ’+2’ (warm). We will try thermal comfort regression in future work.
6. Conclusion
A huge amount of sensor data has been generated in cities all over the world. Utilising the sensor data from multiple cities to benefit the target city has become a critical issue in recent years. In this research, we have answered the following research question: can we predict occupants’ thermal comfort accurately by learning from multiple buildings in the same climate zone when we do not have enough data? If so, which features contribute most for effective thermal comfort transfer learning? We proposed the transfer learning based thermal comfort modelling and applied a generative adversarial network based resampling method for meaningful thermal comfort classification.
By retaining the last hidden layer of the neural network from the source domain (ASHARE RP-884 dataset and the Scales Project dataset), we trained the thermal comfort model for the Friends Center building from the Medium US Office dataset and found the optimal parameter settings for lower hidden layers. Extensive experimental results showed that the proposed TL-MLP and TL-MLP-C* models outperform the state-of-the-art algorithms for thermal comfort prediction. Interestingly, the most significant feature sets are identified for effective thermal comfort transfer learning.
This research provides a significant view for learning thermal comfort related sensor data from multiple cities in the same climate zone to benefit thermal comfort prediction in the target building with limited data. In the future, we plan to propose more advanced transfer learning techniques to find the transferable representations between the source domain and target domain. Also, we would like to utilize occupant behaviours (e.g., heating, drinking) to improve the performance of thermal comfort prediction.
Acknowledgement
This research was supported by the Australian Government through the Australian Research Council’s Linkage Projects funding scheme (project LP150100246). We also sincerely thank the anonymous reviewers.
References
- (1)
- cre ([n.d.]) [n.d.]. Creative Commons License Deed. https://creativecommons.org/licenses/by-sa/3.0/deed.en
- Abbas et al. (2018) Samar Abbas, Abu Bakar, Yasra Chandio, Khadija Hafeez, Ayesha Ali, Tariq M Jadoon, and Muhammad Hamad Alizai. 2018. Inverted HVAC: Greenifying older buildings, one room at a time. ACM Transactions on Sensor Networks (TOSN) 14, 3-4 (2018), 1–26.
- Abouelenien et al. (2017) Mohamed Abouelenien, Mihai Burzo, Rada Mihalcea, Kristen Rusinek, and David Van Alstine. 2017. Detecting human thermal discomfort via physiological signals. In Proceedings of the 10th International Conference on PErvasive Technologies Related to Assistive Environments. 146–149.
- Ang et al. (2016) Irvan Bastian Arief Ang, Flora Dilys Salim, and Margaret Hamilton. 2016. Human occupancy recognition with multivariate ambient sensors. In 2016 IEEE International Conference on Pervasive Computing and Communication Workshops (PerCom Workshops). IEEE, 1–6.
- Arnold et al. (2007) Andrew Arnold, Ramesh Nallapati, and William W Cohen. 2007. A Comparative Study of Methods for Transductive Transfer Learning.. In ICDM Workshops. 77–82.
- Auffenberg et al. (2015) Frederik Auffenberg, Sebastian Stein, and Alex Rogers. 2015. A personalised thermal comfort model using a Bayesian network. In Twenty-Fourth International Joint Conference on Artificial Intelligence.
- Becker and Paciuk (2009) R Becker and M Paciuk. 2009. Thermal comfort in residential buildings–failure to predict by standard model. Building and Environment 44, 5 (2009), 948–960.
- Bengio and Grandvalet (2004) Yoshua Bengio and Yves Grandvalet. 2004. No unbiased estimator of the variance of k-fold cross-validation. Journal of machine learning research 5, Sep (2004), 1089–1105.
- Cena and de Dear (1999) Krzysztof Cena and Richard J de Dear. 1999. Field study of occupant comfort and office thermal environments in a hot, arid climate. ASHRAE Transactions 105 (1999), 204.
- Chaudhuri et al. (2018) Tanaya Chaudhuri, Deqing Zhai, Yeng Chai Soh, Hua Li, and Lihua Xie. 2018. Random forest based thermal comfort prediction from gender-specific physiological parameters using wearable sensing technology. Energy and Buildings 166 (2018), 391–406.
- Chawla et al. (2002) Nitesh V Chawla, Kevin W Bowyer, Lawrence O Hall, and W Philip Kegelmeyer. 2002. SMOTE: synthetic minority over-sampling technique. Journal of artificial intelligence research 16 (2002), 321–357.
- Choi and Yeom (2019) Joon-Ho Choi and Dongwoo Yeom. 2019. Development of the data-driven thermal satisfaction prediction model as a function of human physiological responses in a built environment. Building and environment 150 (2019), 206–218.
- Chun et al. (2008) Chungyoon Chun, Alison Kwok, Teruaki Mitamura, Norie Miwa, and Akihiro Tamura. 2008. Thermal diary: Connecting temperature history to indoor comfort. Building and Environment 43, 5 (2008), 877–885.
- Clear et al. (2013) Adrian K Clear, Janine Morley, Mike Hazas, Adrian Friday, and Oliver Bates. 2013. Understanding adaptive thermal comfort: new directions for UbiComp. In Proceedings of the 2013 ACM international joint conference on Pervasive and ubiquitous computing. ACM, 113–122.
- da Silva et al. (2014) Manuel Carlos Gameiro da Silva, JN Pires, A Loureiro, LD Pereira, P Neto, A Gaspar, DX Viegas, N Soares, M Oliveira, and J Costa. 2014. Spreadsheets for the calculation of Thermal Comfort Indices PMV and PPD. URL: http://www. researchgate. (2014).
- Dai et al. (2009) Wenyuan Dai, Ou Jin, Gui-Rong Xue, Qiang Yang, and Yong Yu. 2009. Eigentransfer: a unified framework for transfer learning. In Proceedings of the 26th Annual International Conference on Machine Learning. ACM, 193–200.
- Dai et al. (2008) Wenyuan Dai, Qiang Yang, Gui-Rong Xue, and Yong Yu. 2008. Self-taught clustering. In Proceedings of the 25th international conference on Machine learning. ACM, 200–207.
- Daume III and Marcu (2006) Hal Daume III and Daniel Marcu. 2006. Domain adaptation for statistical classifiers. Journal of artificial Intelligence research 26 (2006), 101–126.
- De Dear and Brager (1998) Richard De Dear and Gail Schiller Brager. 1998. Developing an adaptive model of thermal comfort and preference. (1998).
- Di Napoli et al. (2020) Claudia Di Napoli, Christopher Barnard, Christel Prudhomme, Hannah L Cloke, and Florian Pappenberger. 2020. ERA5-HEAT: A global gridded historical dataset of human thermal comfort indices from climate reanalysis. Geoscience Data Journal (2020).
- Elnour et al. (2020) Mariam Elnour, Nader Meskin, and Mohammed Al-Naemi. 2020. Sensor data validation and fault diagnosis using Auto-Associative Neural Network for HVAC systems. Journal of Building Engineering 27 (2020), 100935.
- Fanger et al. (1970) Poul O Fanger et al. 1970. Thermal comfort. Analysis and applications in environmental engineering. Thermal comfort. Analysis and applications in environmental engineering. (1970).
- Ferreira et al. (2012) PM Ferreira, AE Ruano, S Silva, and EZE Conceicao. 2012. Neural networks based predictive control for thermal comfort and energy savings in public buildings. Energy and buildings 55 (2012), 238–251.
- Frontczak and Wargocki (2011) Monika Frontczak and Pawel Wargocki. 2011. Literature survey on how different factors influence human comfort in indoor environments. Building and environment 46, 4 (2011), 922–937.
- Fukunaga and Narendra (1975) Keinosuke Fukunaga and Patrenahalli M. Narendra. 1975. A branch and bound algorithm for computing k-nearest neighbors. IEEE transactions on computers 100, 7 (1975), 750–753.
- Gao et al. (2020) Nan Gao, Wei Shao, Mohammad Saiedur Rahaman, and Flora D Salim. 2020. n-Gage: Predicting in-class Emotional, Behavioural and Cognitive Engagement in the Wild. arXiv preprint arXiv:2007.04831 (2020).
- Gao et al. (2019) Nan Gao, Wei Shao, and Flora D. Salim. 2019. Predicting Personality Traits from Physical Activity Intensity. IEEE Computer Magazine (2019).
- Gerrett et al. (2013) Nicola Gerrett, Bernard Redortier, Thomas Voelcker, and George Havenith. 2013. A comparison of galvanic skin conductance and skin wettedness as indicators of thermal discomfort during moderate and high metabolic rates. Journal of Thermal Biology 38, 8 (2013), 530–538.
- Ghahramani et al. (2018) Ali Ghahramani, Guillermo Castro, Simin Ahmadi Karvigh, and Burcin Becerik-Gerber. 2018. Towards unsupervised learning of thermal comfort using infrared thermography. Applied Energy 211 (2018), 41–49.
- He et al. (2008) Haibo He, Yang Bai, Edwardo A Garcia, and Shutao Li. 2008. ADASYN: Adaptive synthetic sampling approach for imbalanced learning. In 2008 IEEE International Joint Conference on Neural Networks (IEEE World Congress on Computational Intelligence). IEEE, 1322–1328.
- Hu et al. (2015) Shaohan Hu, Lu Su, Hengchang Liu, Hongyan Wang, and Tarek F Abdelzaher. 2015. Smartroad: Smartphone-based crowd sensing for traffic regulator detection and identification. ACM Transactions on Sensor Networks (TOSN) 11, 4 (2015), 1–27.
- Hu et al. (2019) Weizheng Hu, Yong Luo, Zongqing Lu, and Yonggang Wen. 2019. Heterogeneous Transfer Learning for Thermal Comfort Modeling. In Proceedings of the 6th ACM International Conference on Systems for Energy-Efficient Buildings, Cities, and Transportation. 61–70.
- Hu et al. (2018) Weizheng Hu, Yonggang Wen, Kyle Guan, Guangyu Jin, and King Jet Tseng. 2018. iTCM: Toward Learning-Based Thermal Comfort Modeling via Pervasive Sensing for Smart Buildings. IEEE Internet of Things Journal 5, 5 (2018), 4164–4177.
- Indraganti et al. (2015) Madhavi Indraganti, Ryozo Ooka, and Hom B Rijal. 2015. Thermal comfort in offices in India: behavioral adaptation and the effect of age and gender. Energy and Buildings 103 (2015), 284–295.
- Indraganti and Rao (2010) Madhavi Indraganti and Kavita Daryani Rao. 2010. Effect of age, gender, economic group and tenure on thermal comfort: a field study in residential buildings in hot and dry climate with seasonal variations. Energy and buildings 42, 3 (2010), 273–281.
- Karjalainen (2007) Sami Karjalainen. 2007. Gender differences in thermal comfort and use of thermostats in everyday thermal environments. Building and environment 42, 4 (2007), 1594–1603.
- Kolokotsa et al. (2001) D Kolokotsa, D Tsiavos, GS Stavrakakis, K Kalaitzakis, and E Antonidakis. 2001. Advanced fuzzy logic controllers design and evaluation for buildings’ occupants thermal–visual comfort and indoor air quality satisfaction. Energy and buildings 33, 6 (2001), 531–543.
- Langevin et al. (2015) Jared Langevin, Patrick L Gurian, and Jin Wen. 2015. Tracking the human-building interaction: A longitudinal field study of occupant behavior in air-conditioned offices. Journal of Environmental Psychology 42 (2015), 94–115.
- Langevin et al. (2012) Jared Langevin, Jin Wen, and Patrick L Gurian. 2012. Relating occupant perceived control and thermal comfort: Statistical analysis on the ASHRAE RP-884 database. HVAC&R Research 18, 1-2 (2012), 179–194.
- Liaw et al. (2002) Andy Liaw, Matthew Wiener, et al. 2002. Classification and regression by randomForest. R news 2, 3 (2002), 18–22.
- Liu (2018) Shichao Liu. 2018. Personal thermal comfort models based on physiological parameters measured by wearable sensors. (2018).
- Liu et al. (2011) Weiwei Liu, Zhiwei Lian, Qihong Deng, and Yuanmou Liu. 2011. Evaluation of calculation methods of mean skin temperature for use in thermal comfort study. Building and Environment 46, 2 (2011), 478–488.
- Liu et al. (2008) Weiwei Liu, Zhiwei Lian, and Yuanmou Liu. 2008. Heart rate variability at different thermal comfort levels. European journal of applied physiology 103, 3 (2008), 361–366.
- Lu et al. (2019) Siliang Lu, Weilong Wang, Chaochao Lin, and Erica Cochran Hameen. 2019. Data-driven simulation of a thermal comfort-based temperature set-point control with ASHRAE RP884. Building and Environment 156 (2019), 137–146.
- Luo et al. (2020) Maohui Luo, Jiaqing Xie, Yichen Yan, Zhihao Ke, Peiran Yu, Zi Wang, and Jingsi Zhang. 2020. Comparing machine learning algorithms in predicting thermal sensation with ASHRAE Comfort Database II. Energy and Buildings (2020), 109776.
- Natarajan (2019) Emil Laftchiev Annamalai Natarajan. 2019. A Transfer Active Learning Framework to Predict Thermal Comfort. International Journal of Prognostics and Health Management 10 (2019), 13.
- Nikolaou et al. (2009) T Nikolaou, I Skias, D Kolokotsa, and G Stavrakakis. 2009. Virtual building dataset for energy and indoor thermal comfort benchmarking of office buildings in Greece. Energy and Buildings 41, 12 (2009), 1409–1416.
- of Heating et al. (2004) American Society of Heating, Refrigerating, Air-Conditioning Engineers, and American National Standards Institute. 2004. Thermal environmental conditions for human occupancy. Vol. 55. American Society of Heating, Refrigerating and Air-Conditioning Engineers.
- Pan and Yang (2009) Sinno Jialin Pan and Qiang Yang. 2009. A survey on transfer learning. IEEE Transactions on knowledge and data engineering 22, 10 (2009), 1345–1359.
- Park et al. (2018) Noseong Park, Mahmoud Mohammadi, Kshitij Gorde, Sushil Jajodia, Hongkyu Park, and Youngmin Kim. 2018. Data synthesis based on generative adversarial networks. Proceedings of the VLDB Endowment 11, 10 (2018), 1071–1083.
- Peel et al. (2007) Murray C Peel, Brian L Finlayson, and Thomas A McMahon. 2007. Updated world map of the Köppen-Geiger climate classification. (2007).
- Quintana and Miller (2019) Matias Quintana and Clayton Miller. 2019. Towards Class-Balancing Human Comfort Datasets with GANs. In Proceedings of the 6th ACM International Conference on Systems for Energy-Efficient Buildings, Cities, and Transportation. 391–392.
- Rahman et al. (2010) MM Rahman, MG Rasul, and Mohammad Masud Kamal Khan. 2010. Energy conservation measures in an institutional building in sub-tropical climate in Australia. Applied Energy 87, 10 (2010), 2994–3004.
- Ranjan and Scott (2016) Juhi Ranjan and James Scott. 2016. ThermalSense: determining dynamic thermal comfort preferences using thermographic imaging. In Proceedings of the 2016 ACM International Joint Conference on Pervasive and Ubiquitous Computing. ACM, 1212–1222.
- Rish et al. (2001) Irina Rish et al. 2001. An empirical study of the naive Bayes classifier. In IJCAI 2001 workshop on empirical methods in artificial intelligence, Vol. 3. 41–46.
- Sadid et al. (2017) Waselul H Sadid, Saad A Abobakr, and Guchuan Zhu. 2017. Discrete-event systems-based power admission control of thermal appliances in smart buildings. IEEE Transactions on Smart Grid 8, 6 (2017), 2665–2674.
- Safavian and Landgrebe (1991) S Rasoul Safavian and David Landgrebe. 1991. A survey of decision tree classifier methodology. IEEE transactions on systems, man, and cybernetics 21, 3 (1991), 660–674.
- Schweiker et al. (2019) Marcel Schweiker, Amar Abdul-Zahra, Maíra André, Farah Al-Atrash, Hanan Al-Khatri, Rea Risky Alprianti, Hayder Alsaad, Rucha Amin, Eleni Ampatzi, Alpha Yacob Arsano, et al. 2019. The Scales Project, a cross-national dataset on the interpretation of thermal perception scales. Scientific data 6, 1 (2019), 1–10.
- Schweiker and Wagner (2016) Marcel Schweiker and Andreas Wagner. 2016. The effect of occupancy on perceived control, neutral temperature, and behavioral patterns. Energy and Buildings 117 (2016), 246–259.
- Seppänen et al. (1999) OA Seppänen, WJ Fisk, and MJ Mendell. 1999. Association of ventilation rates and CO2 concentrations with health andother responses in commercial and institutional buildings. Indoor air 9, 4 (1999), 226–252.
- Shao et al. (2017) Wei Shao, Flora D Salim, Tao Gu, Ngoc-Thanh Dinh, and Jeffrey Chan. 2017. Traveling officer problem: Managing car parking violations efficiently using sensor data. IEEE Internet of Things Journal 5, 2 (2017), 802–810.
- Shao et al. (2018) Wei Shao, Yu Zhang, Bin Guo, Kai Qin, Jeffrey Chan, and Flora D Salim. 2018. Parking Availability Prediction with Long Short Term Memory Model. In International Conference on Green, Pervasive, and Cloud Computing. Springer, 124–137.
- Shivakumar and Georgiou (2018) Prashanth Gurunath Shivakumar and Panayiotis Georgiou. 2018. Transfer Learning from Adult to Children for Speech Recognition: Evaluation, Analysis and Recommendations. arXiv preprint arXiv:1805.03322 (2018).
- Song et al. (2019) Hui Song, AK Qin, and Flora D Salim. 2019. Evolutionary model construction for electricity consumption prediction. Neural Computing and Applications (2019), 1–18.
- Suykens and Vandewalle (1999) Johan AK Suykens and Joos Vandewalle. 1999. Least squares support vector machine classifiers. Neural processing letters 9, 3 (1999), 293–300.
- Toe and Kubota (2013) Doris Hooi Chyee Toe and Tetsu Kubota. 2013. Development of an adaptive thermal comfort equation for naturally ventilated buildings in hot–humid climates using ASHRAE RP-884 database. Frontiers of Architectural Research 2, 3 (2013), 278–291.
- Tomek (1976) Ivan Tomek. 1976. Two modifications of CNN. IEEE Trans. Systems, Man and Cybernetics 6 (1976), 769–772.
- van Hoof (2008) Joost van Hoof. 2008. Forty years of Fanger’s model of thermal comfort: comfort for all? Indoor air 18 3 (2008), 182–201.
- von Grabe and Winter (2008) Jörn von Grabe and Stefan Winter. 2008. The correlation between PMV and dissatisfaction on the basis of the ASHRAE and the McIntyre scale—Towards an improved concept of dissatisfaction. Indoor and Built Environment 17, 2 (2008), 103–121.
- Wang et al. (2018) Jindong Wang, Yiqiang Chen, Lisha Hu, Xiaohui Peng, and S Yu Philip. 2018. Stratified transfer learning for cross-domain activity recognition. In 2018 IEEE International Conference on Pervasive Computing and Communications (PerCom). IEEE, 1–10.
- Wang et al. (2017) Xianjing Wang, Jonathan Liono, Will Mcintosh, and Flora D Salim. 2017. Predicting the city foot traffic with pedestrian sensor data. In Proceedings of the 14th EAI International Conference on Mobile and Ubiquitous Systems: Computing, Networking and Services. ACM, 1–10.
- Wilson (1972) Dennis L Wilson. 1972. Asymptotic properties of nearest neighbor rules using edited data. IEEE Transactions on Systems, Man, and Cybernetics 3 (1972), 408–421.
- Xu and Veeramachaneni (2018) Lei Xu and Kalyan Veeramachaneni. 2018. Synthesizing tabular data using generative adversarial networks. arXiv preprint arXiv:1811.11264 (2018).
- Ye (2018) Juan Ye. 2018. SLearn: Shared learning human activity labels across multiple datasets. In 2018 IEEE International Conference on Pervasive Computing and Communications (PerCom). IEEE, 1–10.
- Yong and Djamila (2019) Tay Lee Yong and Harimi Djamila. 2019. Exploring Köppen-Geiger Climate Classification of the ASHRAE RP-884 Database. International Journal of Recent Technology and Engineering 7, 6 (2019), 854–860.
- Zhang et al. (2020) Lili Zhang, Dong Wei, Yuyao Hou, Junfei Du, Zu’an Liu, Guomin Zhang, Long Shi, et al. 2020. Outdoor Thermal Comfort of Urban Park—A Case Study. Sustainability 12, 5 (2020), 1961.
- Zhang et al. (2018) Wei Zhang, Weizheng Hu, and Yonggang Wen. 2018. Thermal Comfort Modeling for Smart Buildings: A Fine-Grained Deep Learning Approach. IEEE Internet of Things Journal (2018).
- ZHAO et al. (2010) Xue-zhu ZHAO, Xiu WANG, and Xue-feng ZHU. 2010. Research of Samples Selection in Eye Detection Based on Adaboost Algorithm [J]. Computer Technology and Development 2 (2010).