Timing the Early Assembly of the Milky Way with the H3 Survey
Abstract
The archaeological record of stars in the Milky Way opens a uniquely detailed window into the early formation and assembly of galaxies. Here we use 11,000 main-sequence turn-off stars with well-measured ages, [Fe/H], [/Fe], and orbits from the H3 Survey and Gaia to time the major events in the early Galaxy. Located beyond the Galactic plane, , this sample contains three chemically distinct groups: a low metallicity population, and low- and high- groups at higher metallicity. The age and orbit distributions of these populations show that: 1) the high- group, which includes both disk stars and the in-situ halo, has a star-formation history independent of eccentricity that abruptly truncated Gyr ago (); 2) the low metallicity population, which we identify as the accreted stellar halo, is on eccentric orbits and its star formation truncated Gyr ago (); 3) the low- population is primarily on low eccentricity orbits and the bulk of its stars formed less than 8 Gyr ago. These results suggest a scenario in which the Milky Way accreted a satellite galaxy at that merged with the early disk by . This merger truncated star formation in the early high- disk and perturbed a fraction of that disk onto halo-like orbits. The merger enabled the formation of a chemically distinct, low- disk at . The lack of any stars on halo-like orbits at younger ages indicates that this event was the last significant disturbance to the Milky Way disk.
1 Introduction
Our cosmological paradigm predicts that Milky Way-like galaxies assembled half or more of their stars by (e.g., Moster et al., 2013; Behroozi et al., 2013). Modern hydrodynamical simulations show that the physical processes driving this evolution, including gas accretion, mergers, and feedback, operate on relatively short timescales and are often manifested on sub-kpc spatial scales (e.g., Sawala et al., 2016; Hopkins et al., 2018; Pillepich et al., 2019). These scales are currently inaccessible to direct observations of galaxies at redshifts (e.g., Nelson et al., 2016; Tacchella et al., 2018). A promising alternative is to use the archaeological record to gain insight into the formation and evolution of the early Milky Way.
Recent data from the Gaia observatory (Gaia Collaboration et al., 2018) has revealed that the Milky Way likely underwent a significant merger at (1:10 total mass ratio; Belokurov et al., 2018; Helmi et al., 2018; Mackereth et al., 2019; Kruijssen et al., 2020). Stars accreted in this merger dominate the inner halo of the Galaxy (Naidu et al., in preparation), however, the exact timing of this event and its role in sculpting the Galactic disk is less clear (cf. Gallart et al., 2019; Belokurov et al., 2019; Vincenzo et al., 2019).
In this Letter we use a large sample of main-sequence turn-off stars from the “Hectochelle in the Halo at High Resolution” (H3) Spectroscopic Survey (§2) to identify the main components of the Milky Way (§3) and precisely measure their star-formation histories (§4). In §5 we use these histories to provide the most detailed accounting of the Milky Way’s early assembly.
2 Data
We use data from the H3 Survey (Conroy et al., 2019), which is collecting spectra of distant (Gaia parallax mas), bright () stars at high Galactic latitude () with MMT/Hectochelle (Szentgyorgyi et al., 2011). Stellar parameters including radial velocities, distances, [Fe/H] and [/Fe] abundance ratios, and ages are determined with the Bayesian MINESweeper code (Cargile et al., 2019). Briefly, MINESweeper fits spectra and photometry using MIST stellar evolution models (Choi et al., 2016) and stellar spectral models adapted from The Payne framework (Ting et al., 2019). In addition to the directly measured surface abundances, MINESweeper reports the inferred initial abundances, and . Here we use the initial abundances, as they are the predicted natal abundances accounting for diffusive and mixing processes during stellar evolution (Dotter et al., 2017). As our main goal is to deduce age differences between different populations of stars in the Milky Way, in this work we computed stellar parameters assuming a uniform age prior between Gyr. This is in contrast to the fiducial H3 stellar parameter pipeline (Cargile et al., 2019) and existing frameworks for estimating stellar parameters (e.g., Das & Sanders, 2019), which adopt a Galactic model that specifies (often strong) priors for stellar ages in different components of the Galaxy.
We combined H3 radial velocities and distances with Gaia DR2 proper motions (Gaia Collaboration et al., 2018) to calculate orbits of stars in our sample. For orbit integrations we assumed a static Milky Way, with the bulge, disk, and halo components defined in the gala v1.1 package (Price-Whelan, 2017), and adopted the astropy v4.0 default reference frame (Astropy Collaboration et al., 2013) to convert the heliocentric to Galactocentric coordinates. We used the orbital eccentricity, defined as , where , are the apocenter and pericenter, respectively, to dynamically classify orbits.
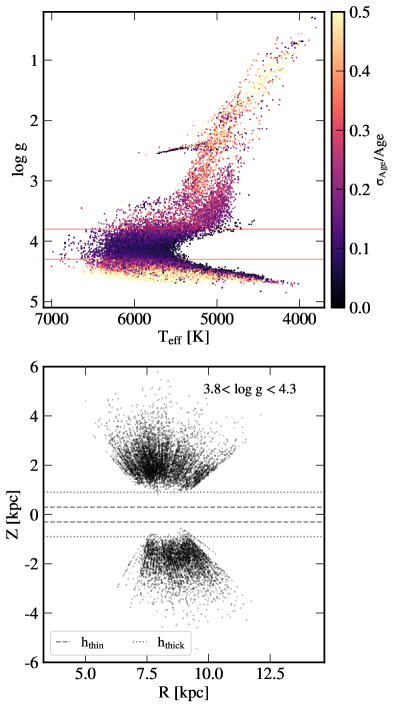
To date, the H3 survey has observed stars, but in this work we focus on the precisely measured subset of stars with spectral signal-to-noise ratio . The top panel of Figure 1 shows the inferred temperature and surface gravity for these high stars, color-coded by the relative age uncertainty. Ages are most precisely measured for stars near the main sequence turn-off (MSTO). To achieve a precise chronology of the Galaxy, we select MSTO stars with . The median and 90th percentile age uncertainties of our adopted sample are 10% and 16%, respectively.
The spatial distribution of our sample is shown in cylindrical Galactocentric coordinates in the bottom panel of Figure 1. The H3 targeting strategy and the high cut result in our sample spanning , beyond the scale-heights of the geometric thin and thick disks (dashed and dotted lines, respectively, Jurić et al., 2008).
3 Chemistry and dynamics
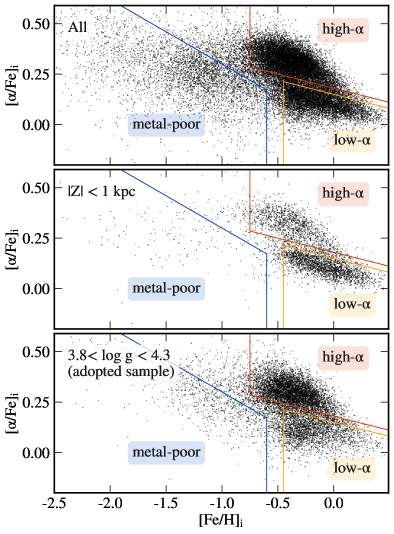
It has long been known that the Milky Way harbors chemically distinct stellar populations (e.g., Gilmore et al., 1989). We therefore begin by exploring the chemistry of H3 stars in Figure 2. The vs. abundance ratios for all high stars in H3 (top panel of Figure 2) reveal three distinct populations: a metal-poor population with a wide distribution of [/Fe] abundances, and, at high metallicities, distinct high- and low- populations. These populations are chemically well-separated, and we define simple selection criteria for each; metal-poor (delineated in blue): and ; high- (red): and ; and low- (orange): and .
The middle panel of Figure 2 shows the abundances of all high stars near the Galactic plane ( kpc). In this sample, the metal-rich populations are sharply defined and form declining sequences of [/Fe] with [Fe/H], in broad agreement with other observations (e.g., Adibekyan et al., 2012; Bensby et al., 2014) and chemical evolution models (e.g., Kobayashi et al., 2006).
The abundance pattern of our MSTO sample is shown in the bottom panel of Figure 2 and features all three of the identified populations. The low-metallicity and high- populations have similar patterns to those in the Galactic plane (middle) and in the sample overall (top). However, the low- population in MSTO stars has a noticeably larger [/Fe] spread than in the plane. This may be related to the MSTO sample’s location above the Galactic plane and will be investigated in the future.
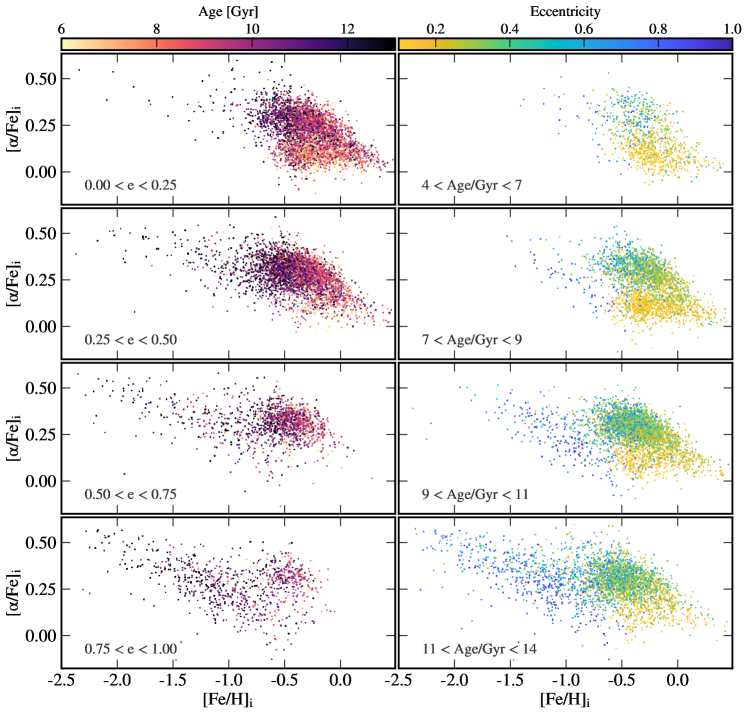
Precise stellar ages enable us to directly trace the chemical and dynamical evolution of the Milky Way. The left column of Figure 3 shows vs. colored by age in bins of orbital eccentricity . High- metal-rich stars can be found at all eccentricities, in contrast to the low- population, which is confined to circular orbits (), and the metal-poor population, which is found on fairly eccentric orbits (). In general, metallicity increases with time, but the low- sequence is younger than the high- sequence at the same metallicity. The age distribution of each component is independent of eccentricity, which has implications for the formation of the Galaxy (see § 5).
The right column of Figure 3 shows how these populations evolved in time, with each panel containing a narrow range of ages, color-coded by eccentricity. Different chemical populations correspond to different distributions of eccentricities, as most clearly highlighted in the bottom two panels. Comparison of different panels shows that the mapping between the chemistry and eccentricity of a population holds at all ages.
4 Chronology
In this section we present star formation histories for several of the Milky Way’s structural components. Motivated by eccentricity patterns in the [/Fe] vs. [Fe/H] space (Figure 3), and previous chemo-dynamical studies of the Galaxy (e.g., Hayden et al., 2015; Bonaca et al., 2017), we define: (1) the low- disk as low- stars with low eccentricity , (2) the high- disk as high- stars with low eccentricity , (3) the in-situ halo as high- stars with high eccentricity , and (4) the accreted halo as metal-poor stars with high eccentricity . These selections result in 1818, 4631, 266, and 438 stars in each group, respectively. We expect these selections, as well as our earlier MSTO sample selection, to be largely unbiased in age, and therefore interpret the distribution of stellar ages in each component as its star formation history.
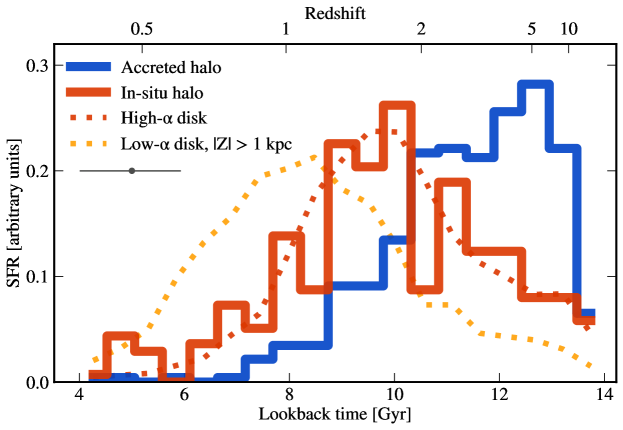
Figure 4 presents the star-formation history beyond the Galactic plane. Each component is normalized to unity. The accreted halo (blue line) is ancient, with an approximately constant star-formation rate until 10 Gyr ago, followed by a sharp decline. The in-situ halo (red solid line) had a rising SFR that peaked 10 Gyr ago, after the decline in the accreted halo. Remarkably, the high- disk (red dotted line) has a very similar star-formation history to the in-situ halo. The two-sample K-S statistic for their ages is 0.07—consistent with being drawn from the same distribution. The low- disk (orange dotted line) formed last, with the largest increase in star formation coinciding with the drop in star formation of the accreted halo.
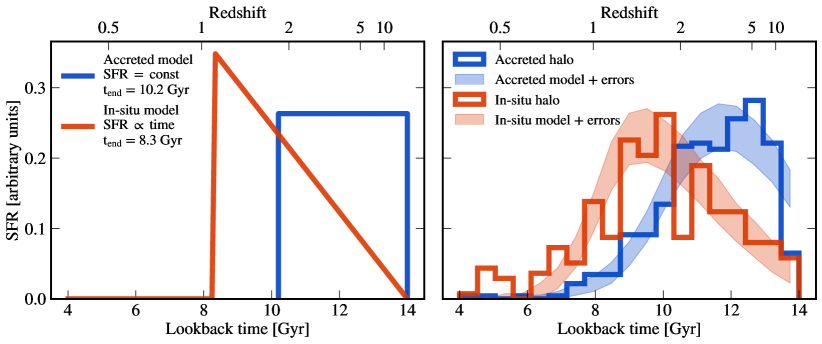
Figure 4 suggests that the accreted halo is older than the in-situ halo, but to quantify the difference in their ages we need to account for the measurement uncertainties. We fit the age at which each component stopped forming stars, , assuming a constant star-formation rate for the accreted halo, and a star-formation rate that rises linearly with time for the in-situ halo. We chose these one-parameter models for their simplicity. For a trial , we drew random samples of ages reflecting the total number of stars in a component, convolved them with the corresponding age uncertainties, and repeated the procedure 50 times. We compared the median binned distribution of sampled ages to the observed distribution, and constrained by sampling the posterior distribution with 64 walkers advanced for 2048 steps using the affine-invariant sampler emcee (Foreman-Mackey et al., 2013). After discarding the first 500 burn-in steps, we report the median as the best-fit value, and the percentile range as its uncertainty. The accreted halo stopped forming stars Gyr ago, while the in-situ halo halted star-formation Gyr ago. The best-fit models are shown as solid lines in the left panel of Figure 5 (blue and red for the accreted and in-situ halo, respectively), and their error convolutions are the shaded regions in the right panel (representing the percentile range). The best-fit models provide an excellent match to the observed star-formation histories (solid lines, right). Despite individual age uncertainties of 1 Gyr, our data show that the in-situ halo stopped forming stars Gyr after the accreted halo—an age difference detected at .
5 Discussion
In this work we used data from the H3 Survey and Gaia to measure main-sequence turn-off ages for stars located kpc beyond the Galactic plane. We identified the accreted halo as metal-poor stars on eccentric orbits and found they have uniformly old ages, consistent with a sudden truncation Gyr ago. Metal-rich, [/Fe]-enhanced stars orbit with eccentricities ranging from circular to radial, and we associated these extremes with the high- disk and the in-situ halo, respectively. These components have the same age distribution, consistent with a linearly rising star-formation rate until Gyr ago, followed by a sudden truncation. The youngest component, that formed the majority of its stars in the last 10 Gyr, is the low- disk, defined as metal-rich, low [/Fe] stars which are all on close-to-circular orbits.
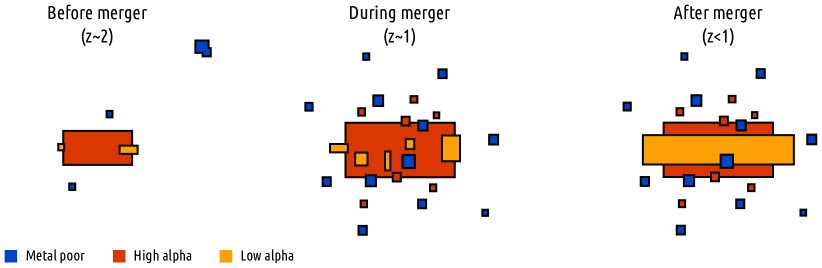
These results suggest the following timeline for the early assembly of the Milky Way (Figure 6). During the first Gyr, stars were forming in a high- disk. Approximately 10 Gyr ago, a smaller, more metal-poor galaxy was accreted into the Milky Way system. The satellite lost its gas, which truncated its own star formation, and provided a reservoir of low-metallicity gas that started fueling star formation in a diluted low- disk. The satellite orbit gradually decayed, and eventually merged with the Milky Way galaxy 8 Gyr ago. The merger disrupted star formation in the primordial Milky Way’s disk and heated a fraction of its stars to high eccentricity orbits (the in-situ halo). This scenario is broadly consistent with studies that timed the formation of the Milky Way’s low and high- disks (e.g., Haywood et al., 2013; Buder et al., 2019), its accreted halo (Belokurov et al., 2018; Helmi et al., 2018; Chaplin et al., 2020), and those which argued that the in-situ halo stars were kicked out of the disk (e.g., Zolotov et al., 2009; Purcell et al., 2010; Bonaca et al., 2017; Gallart et al., 2019; Belokurov et al., 2019). Below we detail where our results depart from earlier work.
The first key conclusion from this work is that the in-situ halo has the same chemistry and star formation history as the high- disk. Previous studies found that the in-situ halo is older than the disk (e.g., Gallart et al., 2019; Belokurov et al., 2019). At least a part of this discrepancy can be traced to the selection of disk stars: simple cuts on height above the Galactic plane (Gallart et al., 2019) or [Fe/H] metallicity (Belokurov et al., 2019) allow for a significant fraction of younger low- disk stars. The age-and-chemistry similarity disfavors models in which the in-situ halo formed kinematically decoupled from the disk, for example, out of gas accreted from infalling satellites (e.g., Font et al., 2011; Cooper et al., 2015). The star formation history of the in-situ halo and the high- disk extends over Gyr. This fact rules out models in which the thick disk formed in a merger-triggered starburst (e.g., Fantin et al., 2019), and limits the fraction of the in-situ halo born in galactic outflows (Yu et al., 2020). Lastly, the sharp decline of star formation disfavors secular scenarios for the formation of the thick disk and the in-situ halo as its high-eccentricity tail (e.g., Schönrich & Binney, 2009; Loebman et al., 2011).
The second key conclusion emerging from the presented data is that the star formation in the in-situ halo ended Gyr after the accreted halo stopped forming stars. This is in contrast to previous age estimates from Gaia photometry that inferred nearly coeval populations (Gallart et al., 2019), and from a variety of ground-based spectroscopy that found the in-situ halo to be Gyr younger than the accreted halo (Belokurov et al., 2019). These studies interpreted similar ages as evidence that a single event—the last massive merger— shut star formation in the accreted and the in-situ halo. Our age estimates, based on a self-consistent analysis of a single spectroscopic dataset, present a more nuanced scenario. The 2 Gyr difference between the end of star formation in the in-situ and accreted halo points to different quenching mechanisms. In our proposed scenario, the satellite galaxy lost its gas shortly after infall, which shut down its own star formation. The satellite’s orbit decayed over 2 Gyr and eventually merged with the Milky Way at , which quenched in-situ star formation in the high- disk. We note that a simple estimate of the dynamical friction timescale for a 1:10 merger at yields an inspiral time of 2 Gyr. Another possibility is that the satellite stopped forming stars on its own accord 2 Gyr before merging with the Milky Way and quenching the in-situ star formation. An independent estimate of the merger timeline (e.g., from properties of accreted globular clusters, Kruijssen et al., 2020) might distinguish between these scenarios, and probe star formation in a galaxy an order of magnitude lower mass than currently observable at these redshifts (e.g., Whitaker et al., 2014).
Finally, we note the surprising existence of stars older than 10 Gyr in the low- disk. Careful inspection of these stars reveals no issues with the data or derived parameters. One concern is subtle contamination due to unresolved binaries, which would make the system appear redder and brighter, and bias the inference towards older ages; multi-epoch spectroscopy is required to rule out this possibility. If confirmed as ancient stars, this would add further complexity to the formation of the early Galaxy.
We close by placing these results in the context of independent constraints on the assembly history of Milky Way-like galaxies. In this work we have argued that the high- disk formed by (8 Gyr ago), and subsequent star formation has happened largely in the low- disk. Haywood et al. (2016) has shown that the mass in the central region of the Milky Way (bulge and/or bar) was also largely assembled by . In a recent review, Bland-Hawthorn & Gerhard (2016) give the following masses for these components: , , and . Therefore, approximately % of the Milky Way stellar mass was assembled by . As the bulge region harbors some stars younger than 8 Gyr, and the low- disk may contain stars older than 8 Gyr, we treat the 40% number as tentative without a more detailed accounting of the star-formation history. Nonetheless, this fraction is in excellent agreement with studies that connect Milky Way-like progenitors across redshift (e.g., van Dokkum et al., 2013; Behroozi et al., 2013; Moster et al., 2013). The Milky Way appears to have grown its mass in a manner that is typical for its mass. This fact bodes well for making strong connections between the archaeological record of our Galaxy and studies of the high-redshift Universe.
It is a pleasure to thank Kim-Vy Tran and Shy Genel for insightful conversations. YST is supported by the NASA Hubble Fellowship grant HST-HF2-51425.001 awarded by the Space Telescope Science Institute. We thank the Hectochelle operators Chun Ly, ShiAnne Kattner, Perry Berlind, and Mike Calkins, and the CfA and U. Arizona TACs for their continued support of the H3 Survey. Observations reported here were obtained at the MMT Observatory, a joint facility of the Smithsonian Institution and the University of Arizona. The computations in this Letter were run on the FASRC Cannon cluster supported by the FAS Division of Science Research Computing Group at Harvard University.
MMT(Hectochelle), Gaia
References
- Adibekyan et al. (2012) Adibekyan, V. Z., Sousa, S. G., Santos, N. C., et al. 2012, A&A, 545, A32
- Astropy Collaboration et al. (2013) Astropy Collaboration, Robitaille, T. P., Tollerud, E. J., et al. 2013, A&A, 558, A33
- Behroozi et al. (2013) Behroozi, P. S., Wechsler, R. H., & Conroy, C. 2013, ApJ, 770, 57
- Belokurov et al. (2018) Belokurov, V., Erkal, D., Evans, N. W., Koposov, S. E., & Deason, A. J. 2018, MNRAS, 478, 611
- Belokurov et al. (2019) Belokurov, V., Sanders, J. L., Fattahi, A., et al. 2019, arXiv e-prints, arXiv:1909.04679
- Bensby et al. (2014) Bensby, T., Feltzing, S., & Oey, M. S. 2014, A&A, 562, A71
- Bland-Hawthorn & Gerhard (2016) Bland-Hawthorn, J., & Gerhard, O. 2016, Annual Review of Astronomy and Astrophysics, 54, 529
- Bonaca et al. (2017) Bonaca, A., Conroy, C., Wetzel, A., Hopkins, P. F., & Kereš, D. 2017, ApJ, 845, 101
- Buder et al. (2019) Buder, S., Lind, K., Ness, M. K., et al. 2019, A&A, 624, A19
- Cargile et al. (2019) Cargile, P. A., Conroy, C., Johnson, B. D., et al. 2019, arXiv e-prints, arXiv:1907.07690
- Chaplin et al. (2020) Chaplin, W. J., Serenelli, A. M., Miglio, A., et al. 2020, Nature Astronomy, 7
- Choi et al. (2016) Choi, J., Dotter, A., Conroy, C., et al. 2016, ApJ, 823, 102
- Conroy et al. (2019) Conroy, C., Bonaca, A., Cargile, P., et al. 2019, ApJ, 883, 107
- Cooper et al. (2015) Cooper, A. P., Parry, O. H., Lowing, B., Cole, S., & Frenk, C. 2015, MNRAS, 454, 3185
- Das & Sanders (2019) Das, P., & Sanders, J. L. 2019, MNRAS, 484, 294
- Diemer (2018) Diemer, B. 2018, ApJS, 239, 35
- Dotter et al. (2017) Dotter, A., Conroy, C., Cargile, P., & Asplund, M. 2017, ApJ, 840, 99
- Fantin et al. (2019) Fantin, N. J., Côté, P., McConnachie, A. W., et al. 2019, ApJ, 887, 148
- Font et al. (2011) Font, A. S., McCarthy, I. G., Crain, R. A., et al. 2011, MNRAS, 416, 2802
- Foreman-Mackey et al. (2013) Foreman-Mackey, D., Hogg, D. W., Lang, D., & Goodman, J. 2013, PASP, 125, 306
- Gaia Collaboration et al. (2018) Gaia Collaboration, Brown, A. G. A., Vallenari, A., et al. 2018, A&A, 616, A1
- Gallart et al. (2019) Gallart, C., Bernard, E. J., Brook, C. B., et al. 2019, Nature Astronomy, 3, 932
- Gilmore et al. (1989) Gilmore, G., Wyse, R. F. G., & Kuijken, K. 1989, ARA&A, 27, 555
- Hayden et al. (2015) Hayden, M. R., Bovy, J., Holtzman, J. A., et al. 2015, ApJ, 808, 132
- Haywood et al. (2013) Haywood, M., Di Matteo, P., Lehnert, M. D., Katz, D., & Gómez, A. 2013, A&A, 560, A109
- Haywood et al. (2016) Haywood, M., Di Matteo, P., Snaith, O., & Calamida, A. 2016, A&A, 593, A82
- Helmi et al. (2018) Helmi, A., Babusiaux, C., Koppelman, H. H., et al. 2018, Nature, 563, 85
- Hopkins et al. (2018) Hopkins, P. F., Wetzel, A., Kereš, D., et al. 2018, MNRAS, 480, 800
- Hunter (2007) Hunter, J. D. 2007, Computing in Science and Engineering, 9, 90
- Jones et al. (2001–) Jones, E., Oliphant, T., Peterson, P., et al. 2001–, SciPy: Open source scientific tools for Python, , . http://www.scipy.org/
- Jurić et al. (2008) Jurić, M., Ivezić, Ž., Brooks, A., et al. 2008, ApJ, 673, 864
- Kobayashi et al. (2006) Kobayashi, C., Umeda, H., Nomoto, K., Tominaga, N., & Ohkubo, T. 2006, ApJ, 653, 1145
- Kruijssen et al. (2020) Kruijssen, J. M. D., Pfeffer, J. L., Chevance, M., et al. 2020, arXiv e-prints, arXiv:2003.01119
- Loebman et al. (2011) Loebman, S. R., Roškar, R., Debattista, V. P., et al. 2011, ApJ, 737, 8
- Mackereth et al. (2019) Mackereth, J. T., Schiavon, R. P., Pfeffer, J., et al. 2019, MNRAS, 482, 3426
- Moster et al. (2013) Moster, B. P., Naab, T., & White, S. D. M. 2013, MNRAS, 428, 3121
- Nelson et al. (2016) Nelson, E. J., van Dokkum, P. G., Förster Schreiber, N. M., et al. 2016, ApJ, 828, 27
- Pérez & Granger (2007) Pérez, F., & Granger, B. E. 2007, Computing in Science and Engineering, 9, 21. http://ipython.org
- Pillepich et al. (2019) Pillepich, A., Nelson, D., Springel, V., et al. 2019, MNRAS, 490, 3196
- Price-Whelan (2017) Price-Whelan, A. M. 2017, The Journal of Open Source Software, 2, 388
- Price-Whelan et al. (2018) Price-Whelan, A. M., Sipócz, B. M., Günther, H. M., et al. 2018, AJ, 156, 123
- Purcell et al. (2010) Purcell, C. W., Bullock, J. S., & Kazantzidis, S. 2010, MNRAS, 404, 1711
- Sawala et al. (2016) Sawala, T., Frenk, C. S., Fattahi, A., et al. 2016, MNRAS, 457, 1931
- Schönrich & Binney (2009) Schönrich, R., & Binney, J. 2009, MNRAS, 399, 1145
- Szentgyorgyi et al. (2011) Szentgyorgyi, A., Furesz, G., Cheimets, P., et al. 2011, PASP, 123, 1188
- Tacchella et al. (2018) Tacchella, S., Carollo, C. M., Förster Schreiber, N. M., et al. 2018, ApJ, 859, 56
- Ting et al. (2019) Ting, Y.-S., Conroy, C., Rix, H.-W., & Cargile, P. 2019, ApJ, 879, 69
- van Dokkum et al. (2013) van Dokkum, P. G., Leja, J., Nelson, E. J., et al. 2013, ApJ, 771, L35
- Vincenzo et al. (2019) Vincenzo, F., Spitoni, E., Calura, F., et al. 2019, MNRAS, 487, L47
- Walt et al. (2011) Walt, S. v. d., Colbert, S. C., & Varoquaux, G. 2011, Computing in Science and Engg., 13, 22. http://dx.doi.org/10.1109/MCSE.2011.37
- Whitaker et al. (2014) Whitaker, K. E., Franx, M., Leja, J., et al. 2014, ApJ, 795, 104
- Yu et al. (2020) Yu, S., Bullock, J. S., Wetzel, A., et al. 2020, MNRAS, arXiv:1912.03316
- Zolotov et al. (2009) Zolotov, A., Willman, B., Brooks, A. M., et al. 2009, ApJ, 702, 1058