Chandra High Energy Transmission Gratings Spectra of V3890 Sgr
Abstract
The recurrent nova (RN) V3890 Sgr was observed during the 7th day after the onset of its most recent outburst, with the Chandra ACIS-S camera and High Energy Transmission Gratings (HETG). A rich emission line spectrum was detected, due to transitions of Fe-L and K-shell ions ranging from neon to iron. The measured absorbed flux is erg cm-2 s-1 in the 1.4-15 Å range (0.77-8.86 keV). The line profiles are asymmetric, blue-shifted and skewed towards the blue side, as if the ejecta moving towards us are less absorbed than the receding ones. The full width at half maximum of most emission lines is 1000-1200 km s-1, with some extended blue wings. The spectrum is thermal and consistent with a plasma in collisional ionization equilibrium with column density 1.3 cm-2 and at least two components at temperatures of about 1 keV and 4 keV, possibly a forward and a reverse shock, or regions with differently mixed ejecta and red giant wind. The spectrum is remarkably similar to the symbiotic RNe V745 Sco and RS Oph, but we cannot distinguish whether the shocks occurred at a distance of few AU from the red giant, or near the giant’s photosphere, in a high density medium containing only a small mass. The ratios of the flux in lines of aluminum, magnesium and neon relative to the flux in lines of silicon and iron probably indicate a carbon-oxygen white dwarf (CO WD).
a
1 Introduction
Recurrent Novae (RNe), like all novae, are interacting binaries with a WD that accretes matter from its companion and undergoes a thermonuclear runaway. They are called “recurrent” because they have been observed in outburst more than once, although all novae are thought to have repeated outbursts on different, secular time scales (e.g. Prialnik, 1986). Only a small number of RNe are known, 10 in the Galaxy (see review by Orio, 2015), 3 in the Large Magellanic Cloud (Mróz et al., 2016; Bode et al., 2016) with a recent additional candidate (Iłkiewicz et al., 2019), 12 in M31 with 4 additional candidates (Shafter et al., 2015). Of the 10 known Galactic RNe, 4 are “symbiotic novae”, relatively rare novae in long orbital period systems with a red giant companion.
V3890 Sgr is one of the symbiotic RNe, and it was observed in outburst for the third time on 2019-08-27.87 (it was reported by A. Pereira, see Strader et al., 2019). Previous outbursts occurred in 1962 and 1990, spaced 28 years apart. The last quiescent optical photometric observation was made less than a day before the outburst detection (Strader et al., 2019), so the outburst time is fairly well constrained. Table 1 summarizes the known physical parameters for V3890 Sgr. The current outburst of V3890 Sgr may have been faster, with shorter t2 and t3 (times to drop 2 and and 3 magnitudes from maximum optical luminosity, respectively), than the previous one, according to the AAVSO publicly available light curve. However, it is possible that the initial phases in the previous eruptions of 1962 and 1990 were missed, so that t2 and t3 may not have been well constrained. The time to decay by 6 magnitudes was about the same in each outburst (Strope et al., 2010, and references therein).
For a useful comparison, Table 1 also includes the known parameters for the other three Galactic symbiotic RNe, which have been observed and scrutinized in the past much more extensively than V3890 Sgr, especially RS Oph. We note that all four objects have an M spectral type companion and are fast novae with short t2 and t3. We also know that the orbital periods exceed one year in RS Oph and V745 Sco. Symbiotic RNe are somewhat outliers among novae in several ways. The WD mass, m(WD), has been estimated to be very high for RS Oph, V745 Sco and T CrB. As for most RNe, the maximum absolute optical magnitude cannot be empirically related to the time for a decay of 2 or 3 magnitudes via the maximum-magnitude-rate-of-decay relationship (MMRD; see della Valle & Livio, 1995). The ejected material in V3890 Sgr, as well in the other symbiotic RNe in Table 1, had high velocity, reaching at least 4000 km s -1. this fact is not explained yet by the models of the thermonuclear runaway (TNR), which indicate slower ejecta than observed for several RNe, both symbiotic and otherwise (Yaron et al., 2005). The short interoutburst times imply high accretion rates, M⊙ yr-1, necessary to build enough pressure at the base of the envelope and start the TNR again every few years or tens of years (e.g. Yaron et al., 2005). RS Oph and T CrB are thought to be disk accretors, like generally many other symbiotics, although this does not imply that all symbiotics with a disk fill their Roche Lobe. In fact, most symbiotics do not fill it, although several of them, never observed in nova outburst, show signatures of semi-steady nuclear burning (see Orio et al., 2007; Orio, 2013; Mikołajewska, 2012) requiring even higher than in RNe. Such high is not reached with Bondi-Hoyle accretion (Bondi & Hoyle, 1944), yet in a few cases the systems’ parameters are known with sufficient precision to rule out Roche Lobe filling. Often ellipsoidal variations are observed, implying that some symbiotics are tidally distorted and for this reason some material indeed flows through the inner Lagrangian point L1 (see Mikołajewska, 2012, and references therein). In other symbiotics, including the well studied RS Oph, no tidal variations are observed, yet there are signatures of a disk. Mohamed et al. (2013) suggested that the stellar wind of the RS Oph giant flows through the L1 point because it is gravitationally focused and flows in a spiral shock on the equatorial plane.
Because of the circumstellar red giant wind, the nova ejecta in symbiotic novae impact colder and slowly moving material (with velocity of the order of about only 10 km s-1), causing strong shocks, that are observed in X-rays. Like other symbiotic novae, symbiotic RNe should also emit significant gamma-ray flux, as observed in the first nova detected with Fermi-LAT, V407 Cyg, which is also a symbiotic (Abdo et al., 2010). However, V745 Sco, the first symbiotic RN in outburst in the Fermi era, was only marginally detected with Fermi (see Cheung et al., 2014; Orio et al., 2015, and references and discussion therein).
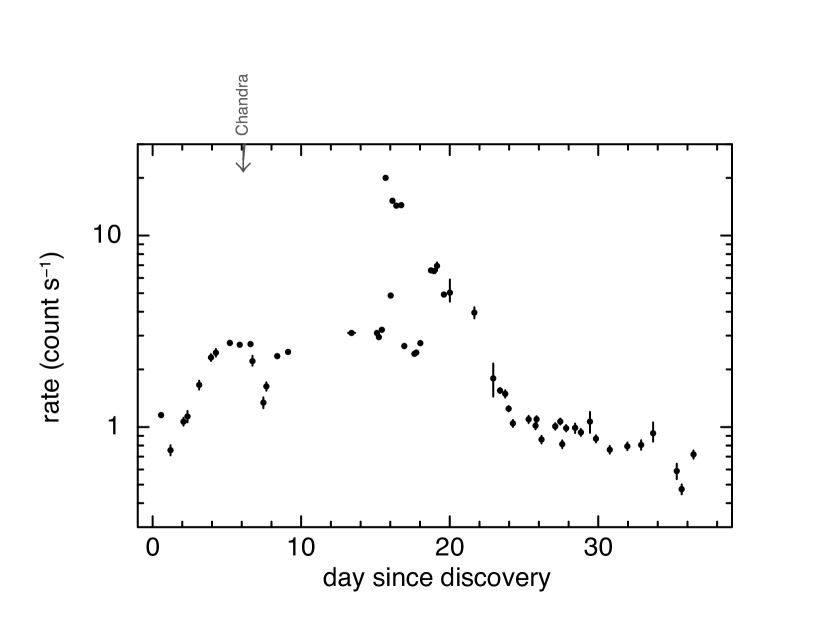
The new outburst of V3890 Sgr has been monitored at all wavelengths with many different instruments, also because RNe with high mass WDs (see Table 1) are interesting as possible progenitors of SNe Ia while they are still “single degenerates” (e.g. Starrfield et al., 2019). Early optical and near infrared spectra have been described, among others, by Strader et al. (2019); Evans et al. (2019); Rudy et al. (2019a); Munari & Walter (2019a, b); Pavana et al. (2019a); Rudy et al. (2019b); Woodward et al. (2019). An ultraviolet spectrum was obtained by Kuin et al. (2019) and Swift also provided the UV light curve. In Fig. 1 we present the “early” Swift X-Ray Telescope (XRT) light curve. Hard X-rays were immediately detected with the Swift XRT (Sokolovsky et al., 2019) and the nova was a gamma ray source (Buson et al., 2019), as expected. Already on the second day after the eruption, the Swift X-ray spectrum showed a hard X-ray source that could be fitted as a thermal plasma with kT=7.9 keV (Sokolovsky et al., 2019). No connection can be made between the measured X-ray emission and the gamma ray emission, since also some non-thermal X-ray flux is expected when gamma-rays are observed (Vurm & Metzger, 2018) and only a thermal spectrum was observed with Swift by Sokolovsky et al. (2019). A radio detection was announced by Pavana et al. (2019b) with likely thermal emission, but also non-thermal, synchrotron emission was later detected (Pavana et al., 2019b; Polisensky et al., 2019), consistent with the gamma-ray detection.
Munari & Walter (2019c) obtained the reddening to the nova from the interstellar features in the optical spectra, deriving E(B-V)=0.56, and note that the comparison with interstellar reddening maps indicates a distance to the nova in excess of 4.5 kpc.
In this article, we present the Chandra High Energy Transmission Gratings’ (HETG) X-ray spectrum observed on the 7th day after the onset of the optical outburst, as illustrated in Fig. 1, which allowed us to observe the hard X-ray emission from the ejecta. In Fig. 1 we indicate the date of the Chandra observation, to place it in the context of the nova evolution. We note that the hydrogen burning WD was observed as a luminous supersoft X-ray source (SSS) only shortly later, 8.4 days after the outburst on 2019 September 5.25, when the ejecta had become transparent to soft X-rays (Page et al., 2019). We note that an additional high resolution X-ray spectrum was obtained with XMM-Newton for the supersoft X-ray phase (Ness et al., 2019) and is the subject of another article, currently being prepared.
In Section 2 we describe the data we obtained; Section 3 contains an analysis of the spectrum with proposed models to fit the data; in Section 4 we compare the Chandra HETG spectra observed for two of the other symbiotic RNe and for a classical nova, V959 Mon. They were all observed at a similar evolutionary post-outburst phase. We also briefly discuss what the upper limits on quiescent X-ray emission imply for the cooling time of the ejecta and the secular evolution of the binary. Section 5 contains our conclusions.
| Name | m(WD) | m(giant) | spectral | d | Porb | t(rec) | Vmax | v(ej) | t2 | t3 | t6 | times(SSS) |
|---|---|---|---|---|---|---|---|---|---|---|---|---|
| M⊙ | M⊙ | type | kpc | days | years | km s-1 | days | days | days | days | ||
| V3890 Sgr | M5 III (1,2) | 4.36 | (see 3) | 28 | 7 | 4200 (4) | 6 | 14 | 28 | 8-20-26 (**) | ||
| 4.5 (5) | 2 | 5 | 27 | |||||||||
| RS Oph | 1.2-1.4 (6) | 0.68-0.80 (6) | M0-2 III (6) | 2.29 | 453.6 (6) | 10(*) | 4.8 | 4200 (7) | 7 | 14 | 88 | 26-58-86 (8) |
| 1.6 (9) | ||||||||||||
| V745 Sco | 1.3 (10) | M62 III (1) | 7.28 | 26? | 9.6 (1) | 4000 (11) | 2 | 4 | 4-6-7 (12) | |||
| 7.81.8 (10) | ||||||||||||
| T CrB | 1.20.2 (13) | 0.7 (13) | M4 III (14) | 0.822 | 227.67 (15) | 80 | 2 | 4 | 6 | 15 | ||
| 1.370.13 (14) | 1.120.23 (16) |
Note. — (1) Harrison et al. (1993); (2) Anupama & Mikołajewska (1999); (3) Mróz et al. (2014) - These authors find that the proposed orbital periods of V3890 Sgr and V745 Sco in Schaefer (2010) cannot be confirmed; (4) Strader et al. (2019); (6) Brandi et al. (2009); (7) Buil (2006) ; (8) Bode (1987) and references therein (9) Osborne et al. (2011); (10) Shara et al. (2018); (11) Banerjee et al. (2014); (12) Page et al. (2015); (13) Belczynski & Mikolajewska (1998); (14) (Mürset & Schmid, 1999); (15) Lines et al. (1988); (16) Stanishev et al. (2004).
(*) However, the last outburst of RS Oph occurred only after 21 years and no new outburst has been recorded in the last 13.5 years.
(**) Page et al. 2020, in preparation
2 The observed spectrum
The Chandra exposure of V3890 Sgr was performed on 2019 September 03 (starting 6.4 days after the initial detection at optical wavelength) with the ACIS-S camera and the High Energy Transmission Gratings (HETG). Both the medium energy grating MEG and the high energy grating HEG were used, with a respective absolute wavelength accuracy of 0.0006 Å and 0.011 Å. The exposure time was 30 ks, and we measured a count rate 0.21390.0027 cts s-1 in the zeroth order ACIS-S camera. Half of the incident radiation is dispersed to the gratings in this observation mode, and the count rates were 0.53780.0061 cts s-1 in the HEG summed first orders (energy range 0.8-10 keV), and 1.04500.0063 in the MEG summed first orders (energy range 0.4-10 keV). We extracted the spectra with the CIAO software (Fruscione et al., 2006) version 4.9.1 and the CALDB calibration package version 4.8.3. We integrated the flux in the ranges where most of the flux is and the value of S/N is high, obtaining 1.01 erg cm-2 s-1 in the 1.5-14 Å range (0.89–8.27 keV) for the HEG, and 1.03 erg cm-2 s-1 in the 1.8-16 Å (0.75–6.89 keV) range for the MEG. Spectral fitting was done with the HEASOFT XSPEC tool, version 12.6, after the data were binned by signal-to-noise with the GRPPHA tool (see Dorman & Arnaud, 2001, and references therein).
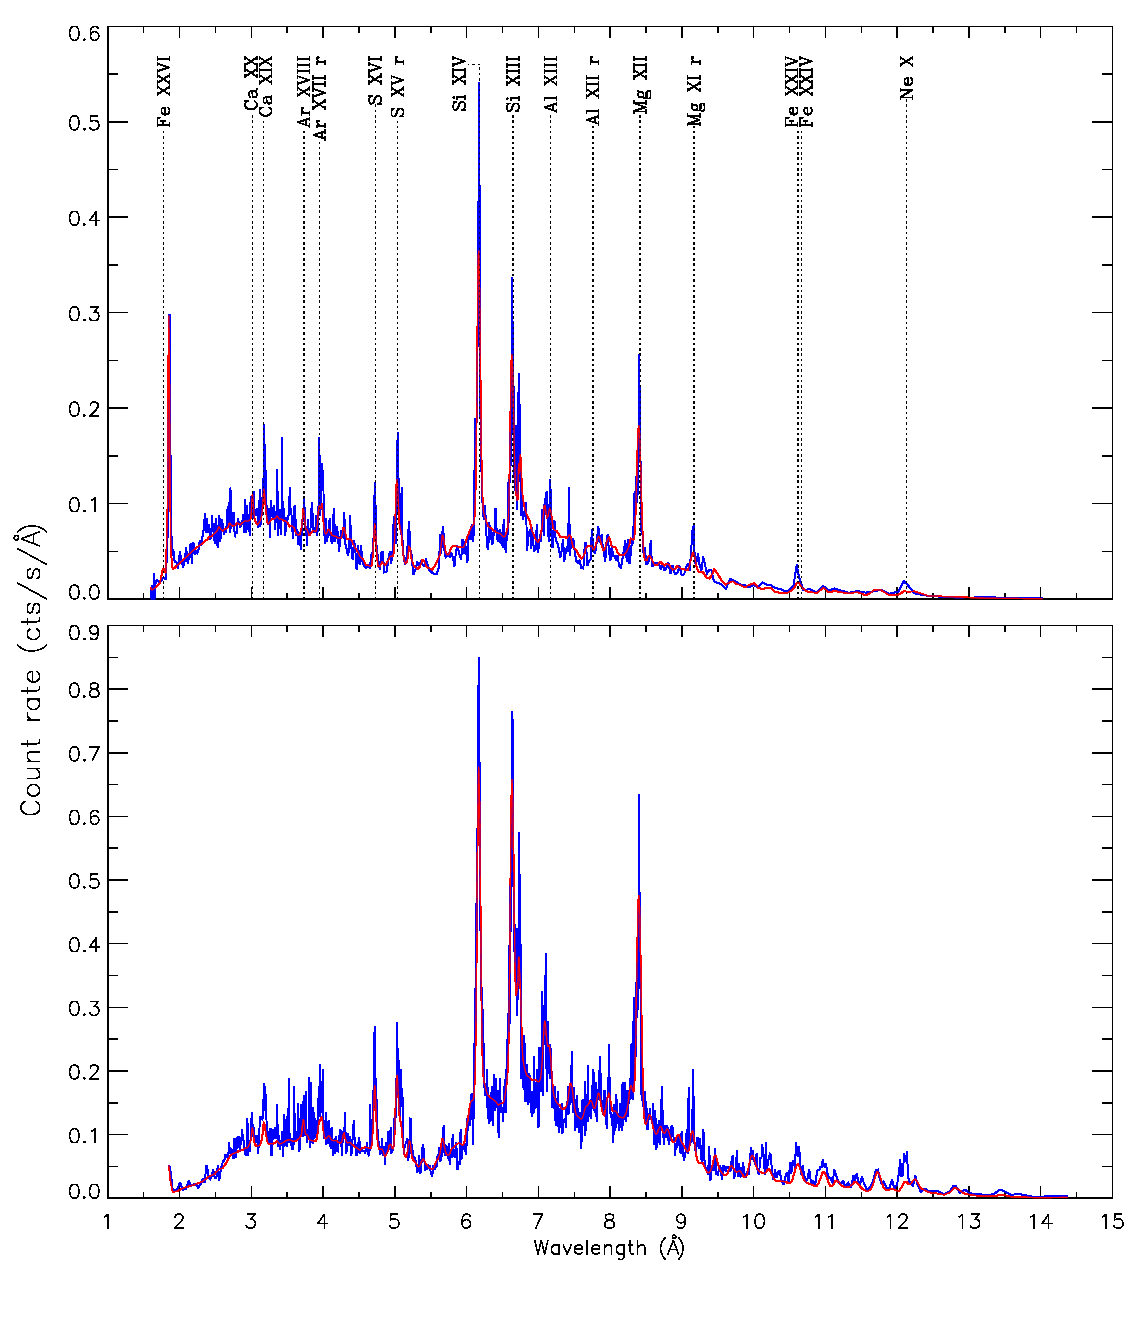
The HEG and MEG spectra are shown in Fig. 2; the prominent emission lines are marked on the HEG spectrum. Here we adopted the count rate on y-axis for comparison with Drake et al. (2016) and other papers with HETG figures in the literature that use these units. The two spectra are in perfect agreement when plotted with units of flux in the y-axis, which we use in the next figures. We notice prominent H-like and He-like lines of elements ranging from Ne to Fe, and some additional Fe-L shell lines.
3 Spectral fit and interpretation
A thermal plasma model with a single temperature is not sufficient for a statistically acceptable fit, but Fig. 2 shows also the best, and statistically acceptable, spectral fit obtained with two BVAPEC components of thermal plasma in collisional ionization equilibrium (CIE) (Astrophysical Plasma Emission Code, or APEC, with variable abundances and velocity broadening in XSPEC, see Smith et al., 2001, and references therein). We used the TBABS prescription for the absorbing, equivalent column density of hydrogen atoms (Wilms et al., 2000) and the solar abundances listed in Asplund et al. (2009). We found that statistics were suitable to assess the goodness of the fit. The parameters of two models and the reduced value are given in Table 2. In both cases, the lines components are modeled as blue-shifted by several hundred km s-1 and broadened. We constrained the broadening velocity of the cooler component not to exceed that of the hotter one, because we assume that the broadening indicates turbulence. We note that this constraint yields the same best fit value as in the case the broadening velocity is allowed to vary independently for the two components (and the broadening velocity of the cooler component turns out to be larger). In the first model, we also constrained all abundances to solar values. The two components of the fit are at 0.99 keV and 3.99 keV, respectively. The column density is N(H)= 1.32 cm-3. The total flux is overestimated in this fit by about 5%, and the unabsorbed flux at the source is calculated to be 2.62 erg cm2 s-1. This fit, shown in Fig. 2, underestimates the flux in several lines, especially He-like ones, albeit by a small amount. However, we could not obtain a better fit by adding more components at different temperature.
In the second model in Table 2, we kept two components, but allowed all the abundances of elements with significant emission lines in the spectrum, that is Ne, Mg, Al, Si, S, Ar, Ca and Fe, to vary independently from each other, and also independently for each component. However, the cooler component, which may contribute much less than the hot one to the continuum, but has to account for at least four emission lines for each element (H-like, and He-like triplets), is largely unconstrained in the fit with all these parameters. The 90% statistical uncertainties of the emission measure and abundances are very large without any a-priori assumptions; our data are not sufficiently good for so many free parameters. Nevertheless, in Table 2 we also give the best fit parameters we obtained with this second model, again constraining the broadening velocity of the cooler component not to exceed that of the hotter component. The flux was overestimated by almost 8%, but we obtained a lower value of per degrees of freedom. The two components are at temperatures close to those of the previous case, 0.97 keV and 4.06 keV respectively. This best fit is obtained with very enhanced abundances for the cooler component, and very high absorption. We obtain instead about nearly solar abundances for the hotter component, except for Al, which turns out to be very depleted. The best fit value of N(H) is lower than in the previous model, 8.3 cm-3, and the unabsorbed flux is 2.04 erg cm-2 s-1. We stress, however, that given the large uncertainties, the only clear conclusion is that the fit improves if we assume that the cool component has enhanced metal abundances, and that the hot one is consistent with near-solar values.
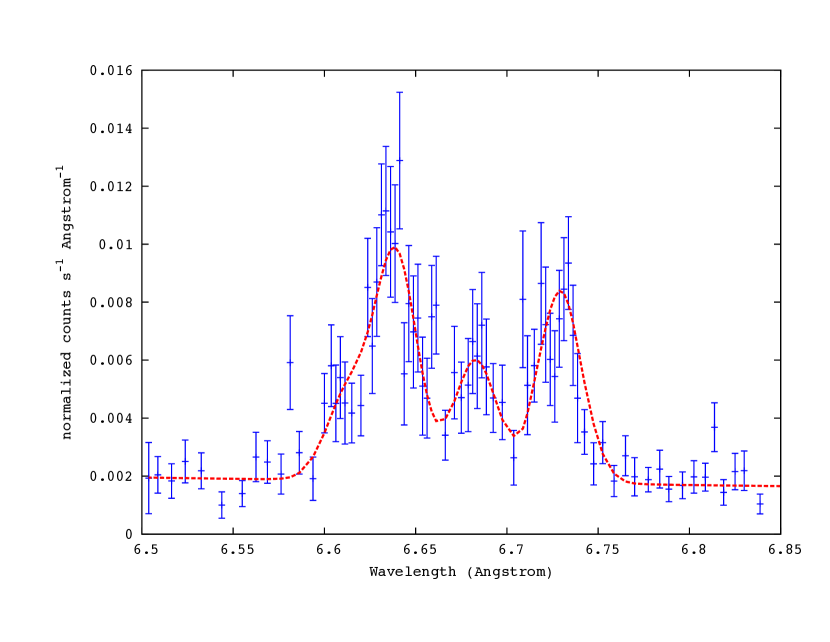
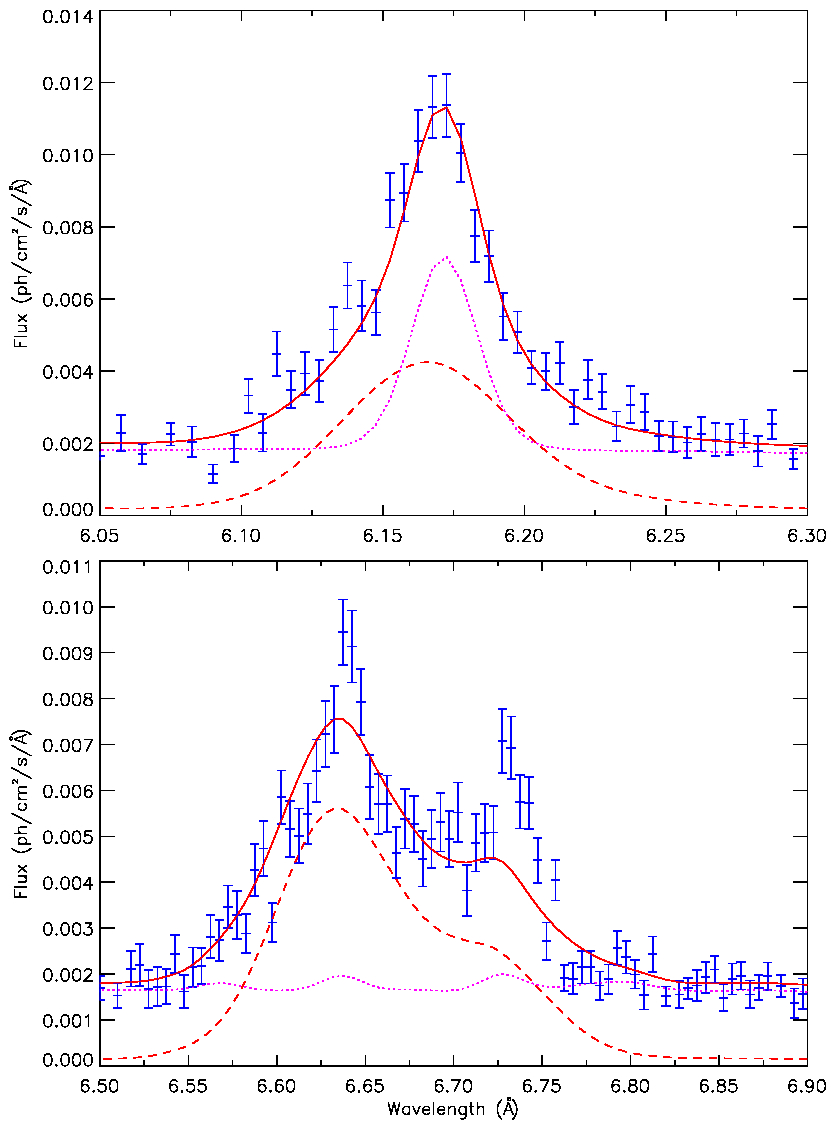
We came to the conclusion that a CIE is a suitable model by examining helium-like triplets in the spectrum. For each ion, the flux in the “r” recombination line, in the “i” intercombination line and “f” forbidden line gives the so called G ratio, , which indicates whether the plasma is in CIE. Generally, G4 indicates a contribution of photoionization (Gabriel & Jordan, 1969; Bautista & Kallman, 2000; Porquet et al., 2010) as long as this diagnostic is used in a regime where the forbidden line is not sensitive to the density, that is, at extremely high densities (compatible with values of electron density n cm-3 in this early post-maximum phase, a value that was inferred at optical wavelengths by, Neff et al., 1978, among others). As Fig. 3 shows for the Si triplet, the He-like lines were detected with relatively low signal-to-noise, so that the intercombination line is barely observable. It also overlaps with the r and f line, hindering a precise measurement. We thus estimated the ratio with a fit of three Gaussians to the three lines, tieing their broadening velocity to the same value. An example is shown in Fig. 3. The resulting flux estimates and their statistical uncertainties are reported in Table 3. Using the flux values reported in the Table, we calculated =0.94 for S XV, =1.21 for Si XIII, =0.88 for Mg XI, and =0.73 for Na X (the statistical uncertainty is given at the 90% confidence level). Even if our uncertainties are relatively high, these values are all compatible with a plasma in CIE.
The fluxes given in Table 3 are for lines that could be measured with some precision, after subtracting the continuum flux from a nearby region with no emission lines. We can compare the fluxes with those obtained by Peretz et al. (2016) for V959 Mon, known as a nova on an ONe WD. We find that the ratio of the flux of lines Al, Mg and Ne (elements expected to be enhanced in novae on ONe WDs), relative to the flux of the Si lines, are much smaller than in V959 Mon, despite plasma temperatures of about the same value. The ratio of the flux in the H-line of Si XIV to that of Al XIII is about 1.3 in V959 Mon, while is about 13 in V3890 Sgr. For Mg XII this ratio is about 1 in V959 Mon and 2.5 for V3890 Sgr (Table 1 of the above authors reports fluxes in units of incident photons cm-2 s-1, and in order to compare them with our units of erg cm-2 s-1 they have to be divided by the wavelength in Å and multiplied by a factor of ). We suggest that these very different flux ratios are a strong indication in favor of classifying the WD in V3890 Sgr as a CO rather than an ONe one. This is corroborated by the outburst UV spectra of the symbiotic RN RS Oph (which is very similar to V3890 Sgr in many respects), that also indicate a massive CO WD (Mikołajewska & Shara, 2017).
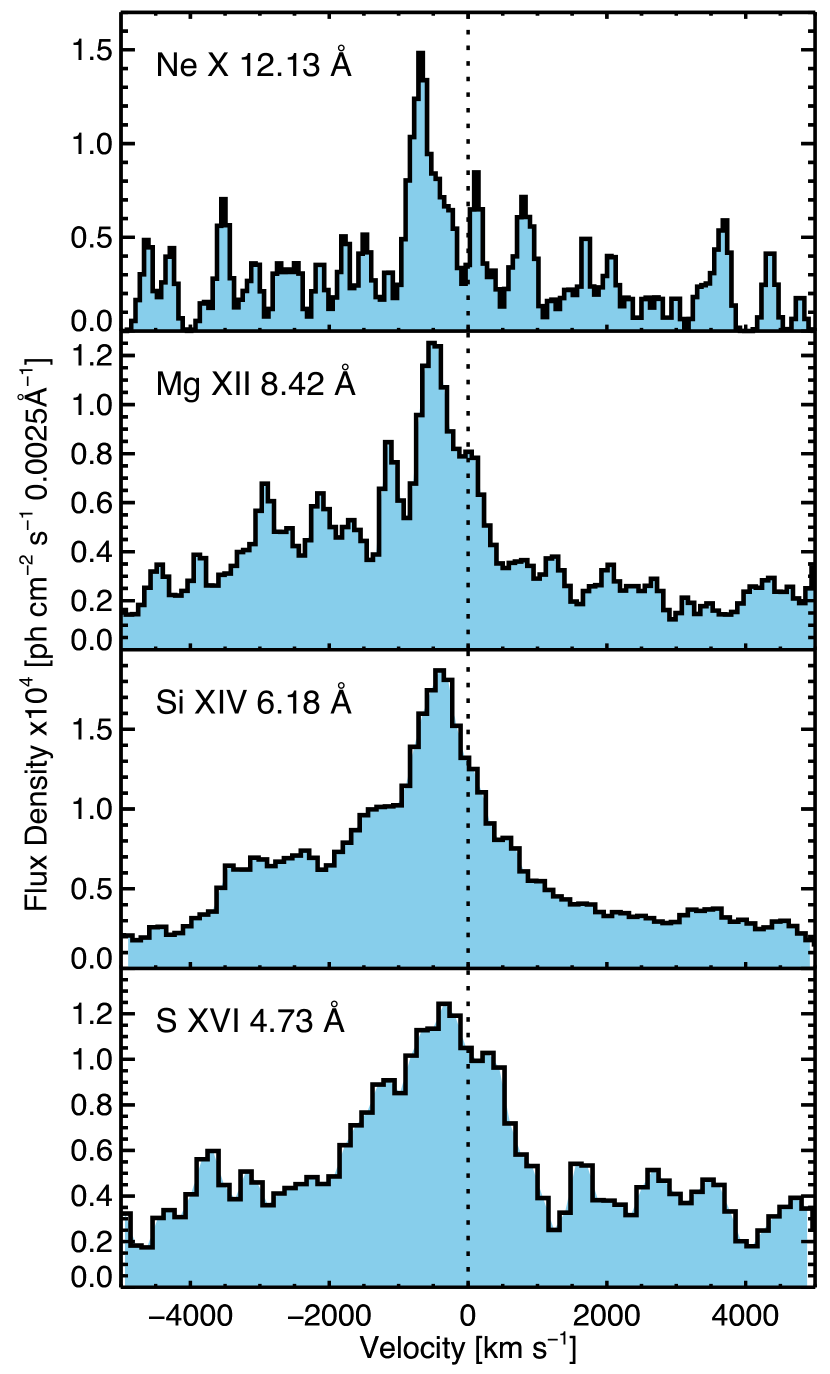
As Fig. 4 illustrates for four H-like lines, the lines we measure deviate from a simple Gaussian profile: they are asymmetric and skewed towards the blue. A possible interpretation is that the red-shifted (receding material) is more absorbed than the blue-shifted material, which is moving towards the observer. The ejecta that are receding with respect to us are observed through more foreground layers of ejected plasma. Such an absorption effect is clearly observed in the emission lines of supernova ejecta that form dust (Gehrz & Ney, 1990), and was found also in the spectrum of RS Oph (Nelson et al., 2008; Drake et al., 2009), V745 Sco (Drake et al., 2016; Orlando et al., 2017) and V959 Mon, a classical nova with a large luminosity in “hard” X-rays, before the supersoft X-ray phase (Peretz et al., 2016). In the high resolution X-ray grating spectra of RS Oph the apparent blue-shift was also found to increase with higher wavelength and lower ionization stage, as expected for absorption, which is stronger at higher wavelength. Fig. 4 shows that this effect seems to be the same in V3890 Sgr, albeit less evident than in RS Oph.
Another major cause of the skewed profile, certainly overlapping with the differential absorption effect, is indicated by the global fit presented in Table 2. In fact for the H-like lines, that have quite different profiles and strengths from the He-like lines, the complex profile can be attributed to at least two components moving at somewhat different velocity, and with different line broadening. Consistently with the models in Table 2, we interpret this as due to one of the two plasma components that is sufficiently hot to be almost completely ionized. The hot component does not contribute to the flux of the He-like lines, as shown by the line profile and fit in the lower right panel of Fig. 5. Unlike the H-like lines, the He-like triplets are fitted assuming only the contribution of the cooler component, although we remark that the global model more successfully reproduces the H-like lines than the the He-like ones. However, we had to bin the data by signal-to-noise of at least 20 in order to obtain a statistically significant fit in XSPEC, and with this binning the less strong “i” line appears smoothed out, so the global fit in XSPEC is done only using the “r” and “f” lines.
However, the “erosion” phenomenon due to differential absorption makes the models with standard software like those in XSPEC uncertain, because the velocities of the two plasma components cannot be precisely estimated without a detailed dynamical model taking into account the effect of the intrinsic nova absorption in the ejecta along the line of sight (e.g. the hydrodynamical model of Orlando et al., 2009, 2017). Despite these uncertainties, it is quite clear that at least two components at different temperature are needed to explain the spectrum of V3890 Sgr, as in the X-ray spectra of the ejecta of other novae previously observed. The first spectrum obtained for V959 Mon in 2012 (albeit at a much later post-outburst epoch) was fitted with two plasma components at about the same temperatures as in Table 2, and the H-like lines indicated the contribution of a hot, almost fully ionized component at different velocity than a cooler plasma in which the He-like lines were formed. Mukai et al. (2019) have recently remarked that the two thermal plasma components that are suitable to fit the V959 Mon spectrum may be due to the reverse and forward shock; however the data quality of Peretz et al. (2016) was not sufficient to estimate the velocity of the hotter component. It was consistent with a positive value, versus the negative velocity of the cooler component.
Finally, there may be an undetected supersoft component in V3890 Sgr. Two Swift XRT exposures were performed during the Chandra observation; the first lasted only 450 s and the second 430 s, but the source was sufficiently bright for spectral fits.
3.1 Possibility of a very clumpy medium
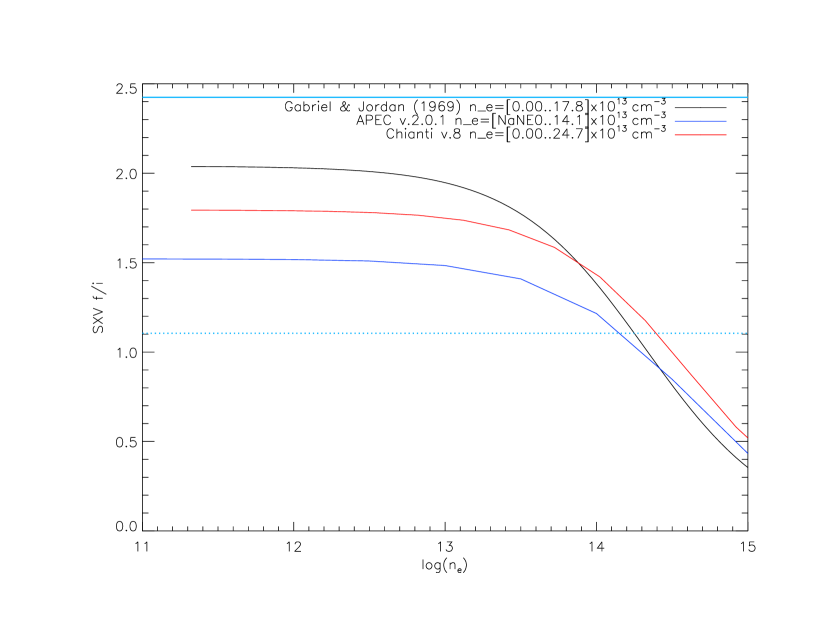
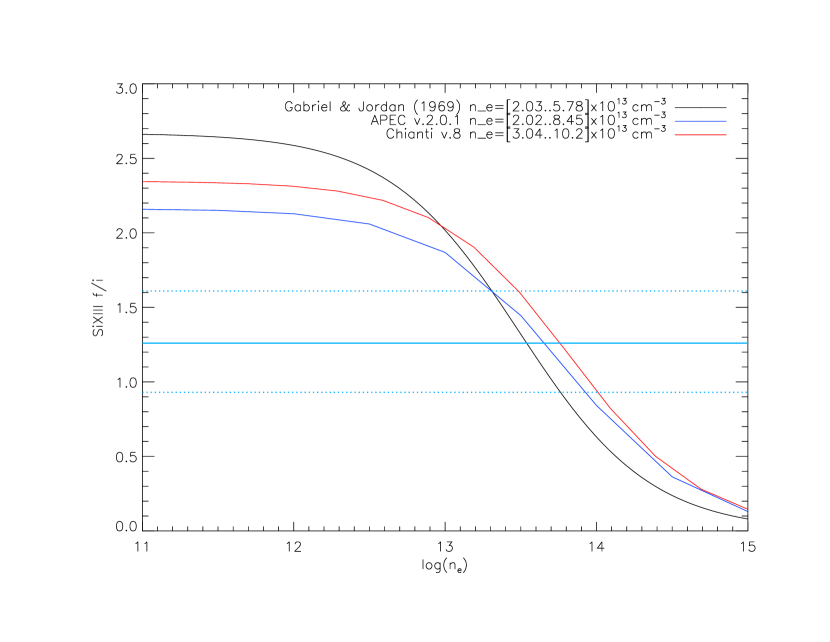
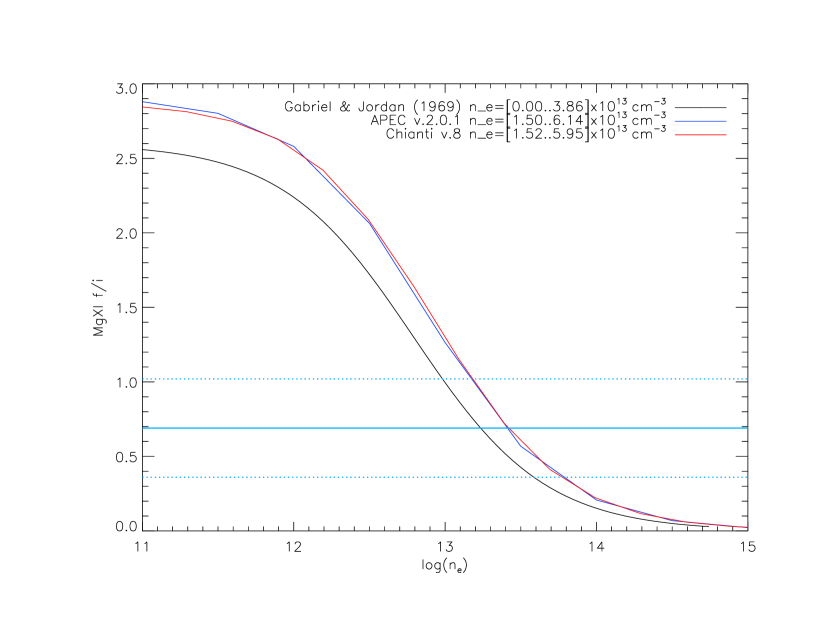
Another diagnostic that can be obtained from the He-like triplets is , ratio of the fluxes in the and line of each triplet. When this ratio is low, the density is high enough that the collisional de-excitation rate from the upper level of the transition to the upper level of the transition is competitive with the radiative decay rate in the line: the line emission is thus reduced in favor of the transitions. With our fit for the Si XIII triplet, we obtain a value . We also find values of 2.42 for S XV, and 0.69 for Mg XI (the uncertainty represents the 90% confidence level). For the CIE calculations pertinent to different databases, assuming a negligible radiation field, so that there is no strong UV flux causing radiative photoexcitation increasing the flux in the line, in Fig. 6 we show that the values we obtain for Si XIII and Mg XI, and even their lower limits, indicate electron density higher than a few ne cm-3 for all triplets. While for the SXV triplet, the calculated ratio indicates an electron density value above that examined in the databases, the 90% confidence level lower limit is consistent with n cm-3. We could not measure a significant value for Na X; the error bars are very large.
Electron density above 1013 cm-3 appears very high compared with typical electron densities derived from optical spectra, which usually do not exceed 109 cm-3 even at early phases. Neff et al. (1978) estimated a value n cm-3 on the 9th day after the outburst for Nova Cyg 1975 (V1500 Cyg), but they found inhomogeneity in the ejecta and concluded they were measuring upper limits for this and other parameters. Moore & Bildsten (2012) calculated a post-shock electron density of the order of 109 cm-3 for the post-shock material in symbiotic recurrent novae assuming a spherically symmetric expansion. The models by Orlando et al. (2009, 2017) also imply post-shock electron density of 10 cm-3. However, we know that in two classical novae, U Sco (Orio, 2013) and V959 Mon (Peretz et al., 2016), the high resolution X-ray spectra imply much higher density, at an epoch when the contribution of photoexcitation to the i line was already negligible. Whether this critical assumption on the photoexcitation contribution is also valid for V3890 Sgr depends critically on the WD temperature on the day of observation, and on the distance at which the shocks occurred from the WD.
According to model calculations for the similar symbiotic nova RS Oph (private communication by Prialnik, see also Hillman et al., 2014) the photospheric radius of the WD is about 3.5 cm during the whole period before the SSS emerges, then it shrinks to a value around 0.01 R⊙ ( cm) within less than a day. The effective temperature before the shrinking leading to the SSS is about 30,000 K; it moves to values above 200,000 K within few hours. In order to assess the importance of photoexcitation we need to compare its rate with the decay rate of the forbidden line. This is slow, and for Si XIII it is 3.5 s-1. The expression for the photoexcitation rate is 0.026 where fij = 0.054 is the oscillator strength for the transition between the upper levels of the forbidden and intercombination lines, and Fν(16eV) is the UV flux at 16 eV at a given distance from the WD. In our specific case, the conclusion is uncertain because it is not straightforward to evaluate the photospheric effective temperature of the central source in V3890 Sgr at the particular time of our Chandra exposure. In fact, the WD was detected as an SSS only two days later, so the WD radius may have already been shrinking, while the ejecta may have still been largely absorbing the supersoft X-rays. There is a very large difference between the luminosity at 16 eV of a blackbody-like source emitting 1038 erg s-1 with temperature of 30,000 K, about about 1037 erg s-1, and the luminosity at 16 eV of a source with blackbody temperature above 200,000 K (as inferred with the Swift XRT observation 2 days after our spectrum was taken). If our source was already at such a high temperature, while the ejecta were not yet quite transparent to the X-rays, the peak of the luminosity must have already been in the X-rays and the 16 eV luminosity would have been negligible.
If instead the effective temperature during our observation was still 30,000 K and dropped only on the following day, the calculation indicates that the UV flux was still significant. In this case, the distance at which the photoexcitation rate equals the decay rate of the Si XIII forbidden line in astronomical units is 17.9 AU. In the model of Orlando et al. (2009) for RS Oph, the red giant is at 1.5 AU from the WD, and the peak of the flux is at 4 AU from the red giant, so the distance from the WD would be inferior, only 5.5 AU. The photoexcitation rate in such a case turns out to be about 10 times larger than the decay rate of the forbidden line. The contribution of the UV source at a distance of a few AU would have still been very significant and ne cannot be derived from the ratio of the triplets’ lines.
It is interesting to note that for V745 Sco the ratios indicated n cm-3 (Drake et al., 2009), while in RS Oph only the ratio derived from Mg XI may have been due to electron density above 1010 cm-3, but the error bar was so large that the authors did not comment on it (Nelson et al., 2008). In this respect, the X-ray spectrum of V3890 Sgr differs from the two other symbiotic RNe with similar orbital properties. If the WD photosphere had already moved towards a peak of emission in the extreme UV and was not a UV source any more, the high electron density we derive for V3890 Sgr is comparable to the high values obtained for the classical novae U Sco and V959 Mon.
What are the implications of an electron density of a few 1013 cm-3? One caveat is the very short radiative cooling time. The ratio of the thermal energy of the plasma to the radiative loss rate (at the plasma temperatures we estimated with the spectral fit) imply a radiative cooling time of only 1 s, instead of several days as in the model of Moore & Bildsten (2012). This means that there must be a constant supply of ejected mass during all the time this thermal spectrum was measured, including the later and earlier Swift XRT observations. Even with the maximum nova wind velocity estimated of about 4000 km s-1, a spherically symmetric shocked region would be very thin, of order of only 4000 km.
The value of the total emission measure EM= that we obtain by adding the emission measure of the two model components in Table 2 is EM=1.81 d(kpc)2 cm3 in the solar abundance model and EM=9.76 d(kpc)2 cm3 in the model with variable abundances. Assuming d=4.4 kpc, we find that EM=1.9–3.5 cm-3. If we assume that the X-ray emitting ejecta traveled at constant velocity for a week, and that they fill a spherical volume V, V=5.9 cm3, therefore our value of the emission measure yields n cm-3, which is 6 orders of magnitude smaller than estimated above using the Si XIII triplet, and cannot be reconciled with slower expansion velocity or a more refined calculation. We can only conclude that the volume filled by the shocked plasma is a very small fraction of the volume that homogeneous ejecta with a filling factor of 1 would fill.
Following the reasoning of Peretz et al. (2016) and, like these authors, assuming for simplicity a fully ionized gas with ne=np (where np is the proton density) and approximately solar composition, the mass of the emitting plasma is
| (1) |
where is the mean proton number, , and is the mean atomic weight (we assumed , see also Peretz et al., 2016). For cm-3, a simple calculation indicates that the emitting mass is M⊙ assuming a 4.4 kpc distance, which is a very small fraction of M M⊙ estimated for instance for RS Oph by O’Brien et al. (1992) (we suggest that the total Mej is likely to be of the same order for all symbiotic RNe, including V3890 Sgr (see also model calculations by Yaron et al., 2005)). This indicates that the X-ray emitting material is not uniformly distributed, but is rather concentrated in one small region, or in a number of clumps occupying a small volume. We note that, for densities of the order assumed by Orlando et al. (2009, 2017) the shocked mass in this observation turns out to be instead of a few 10-8 M⊙. Very clumpy emitting material was inferred for the non-symbiotic T Pyx (Tofflemire et al., 2013), U Sco (Orio et al. 2013) and for V959 Mon (Peretz et al., 2016). In Section 5, we discuss also the possibility that the shocks at the stage at which we observed this symbiotic nova were occurring in a very small region, namely close to the the red giant.
| Parameter | Value |
|---|---|
| Solar Abundances | |
| N(H) (cm-2) | 1.320.05 |
| T1 (keV) | 0.990.02 |
| v1 (km s-1) | 73890 |
| v1 (km s-1) | 1023 |
| EM1 (cm3) | 8.58 d(kpc)2 |
| Flux1,abs (erg cm-2 s-1) | 2.56 |
| Flux1,unabs (erg cm-2 s-1) | 1.26 |
| T2 (keV) | 3.99 |
| v2 (km s-1) | -522 |
| v2 (km s-1) | 1023 |
| EM2 (cm3) | 9.55 d(kpc)2 |
| Flux2,abs (erg cm-2 s-1) | 7.79 |
| Flux2,unabs (erg cm-2 s-1) | 1.36 |
| 1.28 | |
| Variable Abundances | |
| N(H) (cm-2) | 8.3 |
| T1 (keV) | 0.97 |
| v1 (km s-1) | -867 |
| v1 (km s-1) | 632 |
| EM1 (cm3) | 0.06 d(kpc)2 |
| Flux1,abs (erg cm-2 s-1) | 1.98 |
| Flux1,unabs (erg cm-2 s-1) | 6.20 |
| T2 (keV) | 4.06 |
| v2 (km s-1) | -794 |
| v2 (km s-1) | 1572 |
| EM2 (cm3) | 9.7 d(kpc)2 |
| Flux2,abs (erg cm-2 s-1) | 8.77 |
| Flux2,unabs (erg cm-2 s-1) | 1.42 |
| 1.12 | |
| \textAbundances | |
| [Ne/Ne⊙] | 21 – 10.0 |
| Mg/Mg⊙ | 141 – 1.0 |
| Al/Al⊙ | 172 – 0.0+1.0 |
| Si/Si⊙ | 171 – 1.5 |
| S/S⊙ | 236 – 1.8 |
| Ar/Ar⊙ | 411 – 1.60.6 |
| Ca/Ca⊙ | 969 – 1.6 |
| Fe/Fe⊙ | 110 – 1.20.14 |
| Ion | Rest | Observed | Flux |
|---|---|---|---|
| (Å) | (Å) | (erg cm-2 s-1) | |
| S XVI | 4.727 | 4.720 | 9.233.15 |
| Si XIV | 6.180 | 6.176 | 15.64 |
| Al XIII | 7.171 | 7.165 | 1.180.59 |
| Mg XII | 8.419 | 8.412 | 6.210.47 |
| Ne X | 12.123 | 12.119 | 5.4 |
| S XV r | 5.039 | 5.032 | 7.73 |
| S XV i | 5.063/5.067 | 2.12 | |
| S XV f | 5.10 | 5.101 | 5.14 |
| Si XIII r | 6.648 | 6.639 | 7.71 |
| Si XIII i | 6.685/6.688 | 4.13 | |
| Si XIII f | 6.740 | 6.730 | 5.19 |
| Mg XI r | 9.169 | 9.155 | 2.36 |
| Mg XI i | 9.228/9.231 | 1.23 | |
| Mg XI f | 9.314 | 9.300 | 0.85 |
| Na X r | 11.003 | 10.954 | 2.06 |
| Na X i | 11.080/11.083 | 0.68 | |
| Na X f | 11.192 | 11.143 | 0.83 |
4 Comparison with the Chandra HETG spectra of other novae
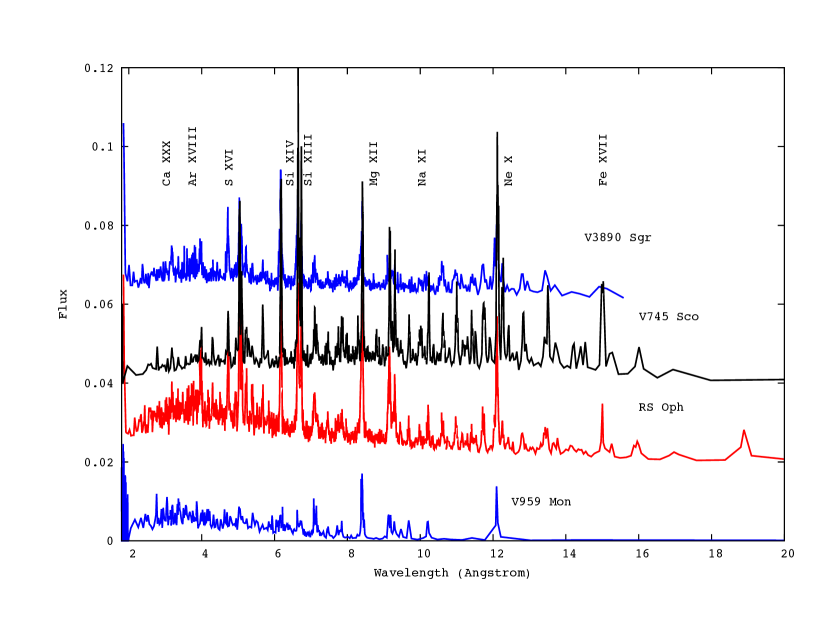
The known physical parameters of V3890 Sgr have been compared with the other Galactic symbiotic RNe in Table 1. A comparison of our spectra with those obtained in the early phases of other symbiotic RNe outbursts with the same gratings shown in Fig. 7, indicates rather remarkable similarities between this nova, the two other recurrent symbiotic novae that were observed with X-ray gratings, and the classical nova V959 Mon, which was also observed before the supersoft X-ray phase, when the central source outshines the spectrum of the ejecta. The HETG spectra of RS Oph were presented by Nelson et al. (2008); Ness et al. (2009), the one of V745 Sco by Drake et al. (2016), and that of V959 Mon by Peretz et al. (2016). Table 4 lists the X-ray flux, absorbed and unabsorbed X-ray luminosity of these novae when their ejecta were observed with X-ray gratings. V745 Sco had an extremely short SSS phase and the central source was contributing to the X-ray flux copiously on day 10 in the Swift XRT range, so the actual flux from the ejecta is between the value derived from Swift+NuSTAR and NuSTAR alone (3-79 keV range). When it was observed with the Chandra HETG on day 14, the central source had already turned off.
A a distance of 4.4 kpc, which is likely to be only a lower limit, V3890 Sgr on day 7 had a large X-ray luminosity, L erg s-1, and the unabsorbed luminosity was a factor of 2 to 3 higher. This X-ray luminosity is also comparable to that of RS Oph and V745 Sco. Like the gamma-ray luminosity, the X-ray luminosity due to the shocked ejecta also seems to be much larger for the symbiotic novae than for the short period ones. Short period novae in outburst before (or after) the supersoft X-ray phase do not exceed an X-ray luminosity of 1033 erg s-1 (Orio et al., 2001; Ness et al., 2007). Since symbiotic novae differ from the others because of the red giant companion, this is considered an indication that the impact with the red giant wind must be causing the shocks. An exception is the classical nova V959 Mon, which has a 7 hour orbital period and is not a symbiotic. It exploded when it was close to the Sun and could not be observed until much later, so the outburst day of the HETG observation is an estimate. This nova was discovered as a gamma-ray source with Fermi, and it may have been much more X-ray luminous previously. However, the hard X-ray luminosity about two months after the estimated optical maximum was still very high. If V959 Mon is not a RN (no previous outburst was ever reported), it is an exception among short period novae. This nova would have had time to accrete a larger envelope than RNe, ejecting a much larger mass that slowed the X-ray flux emergence and evolution, but it is difficult to explain the high X-ray luminosity without a new episode of mass ejection after the initial peak.
The spectra of V745 Sco and RS Oph differ from that of V3890 Sgr in the soft portion, where no significant emission lines of oxygen and nitrogen were measured. The APEC fits to the RS Oph and V745 Sco spectra in fact required more than only two components to explain the observed range of atomic transitions (Nelson et al., 2008; Drake et al., 2016). An important difference between V959 Mon and the symbiotic RNe are the ratios of lines of different species. The ratios of emission lines that are the strongest in oxygen-neon (ONe) novae, such as V959, indicate nucleosynthesis and elemental abundances predicted to be the result of a TNR on an ONe WD, where Ne-Na and Mg-Al cycles, that do not occur on CO WDs, operate in addition to the CNO cycle (José & Hernanz, 1998; Starrfield et al., 2009; Kelly et al., 2013). Atomic Mg (sum of three isotopes) is also overabundant in a superficial layer on ONe WDs. The emission lines of Si and Fe are stronger than those of Mg, Ne and Al in our spectrum of V3890 Sgr. V959 Mon instead has more abundant flux in the Mg, Ne and Al lines than in those of Si and Fe, even if the spectrum was fitted with two plasma components at approximately the same temperature we obtained in this paper for V3890 Sgr Peretz et al. (2016). If we compare V3890 Sgr to RS Oph and V745 Sco, the line flux ratios of the three symbiotic RNe spectra are instead about the same. Of course, if the material has mixed with the red giant wind, we do not expect to find “clean” signatures of the ashes burned on the WD, so a conclusion on the WD nature (whether it is of CO or ONe) does not always seem feasible for symbiotic-RNe on the basis of the X-ray emitted in the nova outflow, but the difference with the V959 Mon spectrum is rather striking.
4.1 Cooling time and X-ray flux at quiescence
A discussion of the cooling time of the ejecta in post-outburst symbiotic RNe is found in Moore & Bildsten (2012). These authors assume a spherical explosion and that shocks occur typically at a distance of few AU from the red giant and discuss the implications for a symbiotic RN ending its life in a type Ia supernova explosion. X-ray flux after the RN outburst should only be detectable for a “cooling time” found to vary from few days to few weeks. It is predicted to be about 2 weeks for RS Oph, and after this time the kinematics of the ejecta are dominated by momentum (rather than energy) conservation.
Sokoloski et al. (2006) observed that the X-ray flux from the ejecta of RS Oph was related to the time t in days since maximum as t-5/3. The Swift XRT archival observations of V3890 Sgr show that V3890 Sgr cooled much more slowly than RS Oph, since the flux on 2019 November 19 was still 6.7 erg cm-2 s-1 in the 0.3-10 keV range of the Swift XRT.
Another interesting measure is the X-ray flux at quiescence, and whether it originates in the boundary layer of an accretion disk and gives a measure of the accretion rate. After the 1990 outburst, V3890 Sgr was still detected in X-rays in the short ROSAT All-Sky-Survey exposures (Orio, 1993) about 5 months after maximum, but it was no longer detected in serendipitous pointings 11 and 17 months after the outburst (Orio et al., 2001). This is consistent also with an XMM-Newton exposure on 2010 April (archival observation by P.I. Sokoloski) in which we found an upper limit for the X-ray luminosity at 4.5 kpc of approximately 1031 erg s-1. V745 Sco, for comparison, was only marginally detected four years before the last outburst with XMM-Newton, with X-ray luminosity 6 erg s-1 in the 0.3-8.0 keV range (see Luna et al., 2014).
| Nova | Day | Flux | Luminosity | Lum. (unabs.) |
|---|---|---|---|---|
| (erg cm-2 s-1) | (erg s-1) | (erg s-1) | ||
| V3890 Sgr | 8 | 1.01 | 2.33 | 4.6-7 |
| RS Oph | 7 | 1.98 | 7 | |
| 14 | 6.09 | 1.86 | ||
| V745 Sco | 10 | (1.6F2.39) | (1.16L1.73) | |
| 16 | 4.21 | 3.05 | ||
| V959 Mon | 83 | 1.7 | 2.33 |
The X-ray flux of RS Oph at quiescence is variable, and on average it seems to have increased between 1991-1992 and 2007-2008 (Orio, 1993; Orio et al., 2001; Nelson et al., 2011). Orio (1993) found that the X-ray flux measured in 1991 was not consistent with the boundary layer of a disk with high , but an observation in April of 2008 with Chandra showed an X-ray flux that was marginally consistent with M⊙ yr-1 (Nelson et al., 2011), explaining the occurrence of outbursts every 10-20 years with model calculations with the same value (e.g. Yaron et al., 2005).
Only T CrB, which is at less than 1 kpc distance, emits significant, variable X-ray flux at quiescence that can be attributed to accretion (see Luna et al., 2008, 2013, 2018). It is also quite a variable and hard X-ray source, as expected for a disk boundary layer around a massive WD (Iłkiewicz et al., 2016; Luna et al., 2018). T CrB stands out, in comparison with the other symbiotic RNe, with its conspicuous hard X-ray flux at quiescence. It has never been observed in X-rays in outburst, and the next eruption would be an opportunity not to be missed.
5 Discussion and conclusions
On the 7th day after the optical maximum, V3890 Sgr was emitting an X-ray luminosity of 4.6-7 erg s-1 in the 0.7-9 keV range (depending on absorbing column density, and assuming a distance of 4.5 kpc, which is likely a lower limit). We attribute this emission to the plasma outflowing from the nova, and suggest that strong shocks formed when it impacted the circumbinary medium filled by the red giant wind. The same physical explanation has been suggested for other symbiotic novae, that typically emit much higher X-ray flux than short period systems. The spectrum of V3890 Sgr can be fitted with a model of thermal plasma in CIE, and shows prominent, asymmetric emission lines of Mg, Ne, Na, Si, S, Ar, Ca and Fe.
Our analysis provides the following important points:
1) The lines due to H-like transitions are stronger than the lines due to He-like transitions. This can be explained by at least two thermal plasma components, and in fact we obtain a fit to the spectrum with two components in collisional ionization equilibrium, at temperatures of approximately 1 keV and 4 keV, respectively. The hotter plasma is almost completely ionized and does not contribute to the emission lines due to He-like transitions. A possible interpretation is that the two components represent a forward and a reverse shock.
2) An alternative interpretation can be suggested by analogy with a model for RS Oph of Orlando et al. (2009): the two plasma components may represent, respectively, colder material that is not much mixed with the red giant wind, and hotter material that is instead heavily mixed and has been heated. In our model fit, there is in fact some evidence that the cooler plasma has enhanced metal abundances with respect to the hotter component, resembling two regions in the hydrodynamical model of Orlando et al. (2009) for RS Oph, which predicts that the zones containing mostly ejecta material are denser and colder, while in regions where shocked ejecta have mixed with circumstellar material the plasma is hotter and dominated by thermal conduction. For RS Oph, the authors were able to model the He-like resonance line profiles with the overlap of the two components, in a similar manner as in our Fig. 5 for the H-like lines. Applying this interpretation to V3890 Sgr, the higher abundances of the cold region indicated by the model with free abundances may be due to nova nucleosynthesis products in the ejecta. The hotter, mixed ejecta on day 5 for RS Oph would have contributed to 80% of the observed flux, which is similar to with our finding that the hotter plasma for V3890 Sgr on day 6 contributed to at least 70% of the observed flux.
3) Our APEC spectral model in XSPEC fits the data, but it is approximate and phenomenological, while only a detailed hydrodynamical model may quantify the effect of the differential absorption and disentangle the exact contribution of the two (or possibly more) different plasma regions to the line profiles. One reason for which the model is still too simplistic is that we have only one absorbing component with characteristics corresponding to the ISM along the line of sight. Instead, there also is significant intrinsic absorption of the nova ejecta (in fact, the column density was observed with the Swift XRT to decrease as the ejecta expanded; Page et al. 2020, in preparation). We suggest that only a detailed hydrodynamical model may explain the formation of the different emission lines in a rigorous way and account for profile and flux of each single line.
4) The X-ray spectrum of V3890 Sgr differs from that of the two symbiotic RNe with similar orbital parameters, RS Oph and V745 Sco, in the line ratios of the He-like triplets. The line ratios are quite smaller than in the spectra of the two previous symbiotic RN. The values we evaluated indicate high electron density (a few 1013 cm-3), unless there was still significant UV flux from the photosphere. Unfortunately, at the epoch the spectrum was taken, it is difficult to establish whether the emission of the WD photosphere was already peaking in the extreme UV or in the supersoft X-rays. If the density was indeed very high, the emission must have arisen from very clumpy ejecta constituting only a small fraction of the emitted material, of order 10-12 M⊙. This is not a completely unusual and new scenario; in fact similarly high electron density has been inferred for other novae (Orio, 2013; Tofflemire et al., 2013; Peretz et al., 2016), suggesting that in some novae the shocked material that emits X-rays may be emitted as dense “bullets”, in a clumpy rather than smooth outflow.
5) There are interesting caveats relative to the possibility of very high electron density. First of all, the cooling time of the shock would be much, much shorter than in the models of Orlando et al. (2009); Moore & Bildsten (2012) for RS Oph. It would be only about 1 s, so the shock must be continuously powered, requiring a constant mass outflow for a prolonged time. Second, and most important, in case of non-radiative shocks, the density ratio of pre- and post-shock material should be about 4. Even taking into account radiative cooling, the density gradient cannot have been as large as orders of magnitude, however the typical red giant wind electron density at 4 AU from the red giant (where Orlando et al. (2009) estimate that the shocks occurred in the RS Oph case) is only 109 cm-3 (see analytical formula in Moore & Bildsten, 2012). Even with the proposed equatorial density enhancement, the density is only of the order of 1010 cm-3. Since the density scales with the square of the distance from the red giant, perhaps the shocks in V3890 Sgr did not occur at a distance of a few AU from the red giant, but the site of X-ray emission was instead very close to the giant’s photosphere. In this case, the emitting region subtended a small solid angle and occupied a small volume.
With a spectrum taken at only one epoch, we cannot distinguish between the two possibilities: emission originating at distance from the star of a few AU, which implies that the line ratio is the product of a strong photoionizing source, and an actual electron density of order of 1013 cm-3. We know that two days after our spectrum was taken, the photoionizing flux was negligible, but the only other high resolution X-ray spectrum of V3890 Sgr was obtained only 11 days later (Ness et al., 2019, and Ness et al. 2020, in preparation) and unfortunately this second spectrum was taken too late. Although at this epoch the central supersoft X-ray source emitted negligible UV flux and did not photoexcite of the line, the flux had decreased and measurements of the ratios were not feasible. This highlights the fact that, in a fast symbiotic nova like V3890 Sgr, the cadence of the spectral exposures should be evaluated carefully in the future: multiple exposures, close in time, would be very useful. A second spectrum taken only few days later, when the central source was peaking in the X-rays and already clearly not contributing significant UV flux, may have solved the conundrum.
6) Even if we have highlighted this intriguing possibility that the V3890 Sgr spectrum may have originated in shocks within a small volume of dense emitting plasma, close to the red giant photosphere, instead of a site at a distance of a few AU from the red giant like in RS Oph and V745 Sco, the X-ray luminosity of V3890 Sgr is in the same range observed for the two other symbiotic RN observed in hard X-rays in the two weeks following the optical maximum, and it is about two orders of magnitude higher than in most short period classical novae. Another symbiotic nova, V407 Cyg, not known to be recurrent, also had very X-ray luminous ejecta (Orlando & Drake, 2012). Only the short period nova V959 Mon was observed to have an X-ray luminosity of a few 1034 erg s-1 3 months after optical maximum; all other short period novae have much less X-ray luminous ejecta. The early X-ray spectra of all three symbiotic RN observed so far with the X-ray gratings show remarkable similarities not only in the luminosity level, but also in line profiles, and (from initial estimates based on the line fluxes) probably in the chemical abundances of the emitting material.
7) The observed thermal X-ray emission cannot be directly linked to the measured gamma-ray flux for this nova. The gamma-rays would originate in the initially X-ray shocked plasma only if the thermal plasma was much hotter, and if there was also the contribution of a non-thermal component to the X-ray flux (Metzger et al., 2015). However, we would like to note that the possibility of a dense and clumpy plasma evoked by the high electron density gives some support to the idea that also possible initial shocks giving rise to the gamma-rays may be difficult to observe, because they would easily be “buried” within a large volume of non X-ray emitting, absorbing material (as suggested by Nelson et al., 2019).
8) The relative ratios of the flux in Al, Mg and Ne lines (typical of novae on ONe WDs) to the flux in lines of Si and Fe (which are not related specifically to ONe WDs), in the spectrum of V3890 Sgr, like in the other symbiotic RNe RS Oph and V745 Sco, are much lower than in a known ONe short period nova, V959 Mon. This suggests that V3890 Sgr hosts a CO WD.
In the future, obtaining high resolution emission line spectra of the ejecta of symbiotic RNe within a few days, should allow us to assess the possibility of high electron density, with all its implications for the emission site, emission measure, and the inferred clumpiness in the outflow. Perhaps in V3890 Sgr a first mechanism of shocks production in a small volume close to the red giant evolved into shocks occurring farther from the red giant at a later epoch, and in a medium of much lower density, as inferred in the observations of V745 Sco and RS Oph, and this may also explain the longer than predicted cooling time estimated with the Swift XRT. Further research is also encouraged in modeling our existing data, e.g. with a detailed hydrodynamical calculations to seek the most appropriate physical model.
High resolution X-ray spectroscopy of nova ejecta has a rich potential to lead to discoveries in nova physics. We suggest these observations should be done whenever this is possible, to widen the database and extend it also to non-symbiotic and classical novae. We foresee that the Jaxa/NASA/ESA X-Ray Imaging and Spectroscopic Mission XRISM (see Williams et al., 2019) will produce results with even higher S/N, and later Athena (see D’Andrea, 2019) will allow much shorter exposure times, thereby extending this type of work to many more novae at repeated epochs, to make comparison with outburst properties at other wavelengths and construct a coherent picture of the challenging puzzle of the nova physics.
References
- Abdo et al. (2010) Abdo, A. A., Ackermann, M., Ajello, M., et al. 2010, Science, 329, 817, doi: 10.1126/science.1192537
- Anupama & Mikołajewska (1999) Anupama, G. C., & Mikołajewska, J. 1999, A&A, 344, 177. https://arxiv.org/abs/astro-ph/9812432
- Asplund et al. (2009) Asplund, M., Grevesse, N., Sauval, A. J., & Scott, P. 2009, ARA&A, 47, 481, doi: 10.1146/annurev.astro.46.060407.145222
- Banerjee et al. (2014) Banerjee, D. P. K., Joshi, V., Venkataraman, V., et al. 2014, ApJ, 785, L11, doi: 10.1088/2041-8205/785/1/L11
- Bautista & Kallman (2000) Bautista, M. A., & Kallman, T. R. 2000, ApJ, 544, 581, doi: 10.1086/317206
- Belczynski & Mikolajewska (1998) Belczynski, K., & Mikolajewska, J. 1998, MNRAS, 296, 77, doi: 10.1046/j.1365-8711.1998.01301.x
- Bode (1987) Bode, M. F. 1987, in RS Ophiuchi (1985) and the Recurrent Nova Phenomenon, ed. M. F. Bode, 241
- Bode et al. (2016) Bode, M. F., Darnley, M. J., Beardmore, A. P., et al. 2016, ApJ, 818, 145, doi: 10.3847/0004-637X/818/2/145
- Bondi & Hoyle (1944) Bondi, H., & Hoyle, F. 1944, MNRAS, 104, 273, doi: 10.1093/mnras/104.5.273
- Brandi et al. (2009) Brandi, E., Quiroga, C., Mikołajewska, J., Ferrer, O. E., & García, L. G. 2009, A&A, 497, 815, doi: 10.1051/0004-6361/200811417
- Buil (2006) Buil, C. 2006, Central Bureau Electronic Telegrams, 403, 1
- Buson et al. (2019) Buson, S., Jean, P., & Cheung, C. C. 2019, The Astronomer’s Telegram, 13114, 1
- Cheung et al. (2014) Cheung, C. C., Jean, P., & Shore, S. N. 2014, The Astronomer’s Telegram, 5879, 1
- D’Andrea (2019) D’Andrea, M. 2019, arXiv e-prints, arXiv:1904.03307. https://arxiv.org/abs/1904.03307
- Del Zanna et al. (2015) Del Zanna, G., Dere, K. P., Young, P. R., Landi, E., & Mason, H. E. 2015, A&A, 582, A56, doi: 10.1051/0004-6361/201526827
- della Valle & Livio (1995) della Valle, M., & Livio, M. 1995, ApJ, 452, 704, doi: 10.1086/176342
- Dorman & Arnaud (2001) Dorman, B., & Arnaud, K. A. 2001, Astronomical Society of the Pacific Conference Series, Vol. 238, Redesign and Reimplementation of XSPEC, ed. J. Harnden, F. R., F. A. Primini, & H. E. Payne, 415
- Drake et al. (2009) Drake, J. J., Laming, J. M., Ness, J. U., et al. 2009, ApJ, 691, 418, doi: 10.1088/0004-637X/691/1/418
- Drake et al. (2016) Drake, J. J., Delgado, L., Laming, J. M., et al. 2016, ApJ, 825, 95, doi: 10.3847/0004-637X/825/2/95
- Evans et al. (2019) Evans, A., Banerjee, D. P. K., Geballe, T. R., et al. 2019, The Astronomer’s Telegram, 13088, 1
- Fruscione et al. (2006) Fruscione, A., McDowell, J. C., Allen, G. E., et al. 2006, Society of Photo-Optical Instrumentation Engineers (SPIE) Conference Series, Vol. 6270, CIAO: Chandra’s data analysis system, 62701V, doi: 10.1117/12.671760
- Gabriel & Jordan (1969) Gabriel, A. H., & Jordan, C. 1969, MNRAS, 145, 241, doi: 10.1093/mnras/145.2.241
- Gehrz & Ney (1990) Gehrz, R. D., & Ney, E. P. 1990, Proceedings of the National Academy of Science, 87, 4354, doi: 10.1073/pnas.87.11.4354
- Harrison et al. (1993) Harrison, T. E., Johnson, J. J., & Spyromilio, J. 1993, AJ, 105, 320, doi: 10.1086/116429
- Hillman et al. (2014) Hillman, Y., Prialnik, D., Kovetz, A., Shara, M. M., & Neill, J. D. 2014, MNRAS, 437, 1962, doi: 10.1093/mnras/stt2027
- Iłkiewicz et al. (2019) Iłkiewicz, K., Mikołajewska, J., Miszalski, B., et al. 2019, A&A, 624, A133, doi: 10.1051/0004-6361/201834165
- Iłkiewicz et al. (2016) Iłkiewicz, K., Mikołajewska, J., Stoyanov, K., Manousakis, A., & Miszalski, B. 2016, MNRAS, 462, 2695, doi: 10.1093/mnras/stw1837
- José & Hernanz (1998) José, J., & Hernanz, M. 1998, ApJ, 494, 680, doi: 10.1086/305244
- Kelly et al. (2013) Kelly, K. J., Iliadis, C., Downen, L., José, J., & Champagne, A. 2013, ApJ, 777, 130, doi: 10.1088/0004-637X/777/2/130
- Kuin et al. (2019) Kuin, P., Darnley, M., Drake, J., et al. 2019, The Astronomer’s Telegram, 13072, 1
- Lines et al. (1988) Lines, H. C., Lines, R. D., & McFaul, T. G. 1988, AJ, 95, 1505, doi: 10.1086/114746
- Luna et al. (2014) Luna, G. J. M., Pillitteri, I., Mukai, K., & Sokoloski, J. L. 2014, The Astronomer’s Telegram, 5881, 1
- Luna et al. (2008) Luna, G. J. M., Sokoloski, J. L., & Mukai, K. 2008, Astronomical Society of the Pacific Conference Series, Vol. 401, High Energy X-ray Emission from Recurrent Novae in Quiescence: T CrB, ed. A. Evans, M. F. Bode, T. J. O’Brien, & M. J. Darnley, 342
- Luna et al. (2013) Luna, G. J. M., Sokoloski, J. L., Mukai, K., & Nelson, T. 2013, A&A, 559, A6, doi: 10.1051/0004-6361/201220792
- Luna et al. (2018) Luna, G. J. M., Mukai, K., Sokoloski, J. L., et al. 2018, A&A, 619, A61, doi: 10.1051/0004-6361/201833747
- Metzger et al. (2015) Metzger, B. D., Finzell, T., Vurm, I., et al. 2015, MNRAS, 450, 2739, doi: 10.1093/mnras/stv742
- Mikołajewska (2012) Mikołajewska, J. 2012, Baltic Astronomy, 21, 5, doi: 10.1515/astro-2017-0352
- Mikołajewska & Shara (2017) Mikołajewska, J., & Shara, M. M. 2017, ApJ, 847, 99, doi: 10.3847/1538-4357/aa87b6
- Mohamed et al. (2013) Mohamed, S., Booth, R., & Podsiadlowski, P. 2013, in IAU Symposium, Vol. 281, Binary Paths to Type Ia Supernovae Explosions, ed. R. Di Stefano, M. Orio, & M. Moe, 195–198, doi: 10.1017/S1743921312014998
- Moore & Bildsten (2012) Moore, K., & Bildsten, L. 2012, ApJ, 761, 182, doi: 10.1088/0004-637X/761/2/182
- Mróz et al. (2014) Mróz, P., Poleski, R., Udalski, A., et al. 2014, MNRAS, 443, 784, doi: 10.1093/mnras/stu1181
- Mróz et al. (2016) Mróz, P., Udalski, A., Poleski, R., et al. 2016, ApJS, 222, 9, doi: 10.3847/0067-0049/222/1/9
- Mukai et al. (2019) Mukai, K., Nelson, T. J., Chomiuk, L., et al. 2019, in AAS/High Energy Astrophysics Division, AAS/High Energy Astrophysics Division, 403.06
- Munari & Walter (2019a) Munari, U., & Walter, F. M. 2019a, The Astronomer’s Telegram, 13081, 1
- Munari & Walter (2019b) —. 2019b, The Astronomer’s Telegram, 13099, 1
- Munari & Walter (2019c) —. 2019c, The Astronomer’s Telegram, 13069, 1
- Mürset & Schmid (1999) Mürset, U., & Schmid, H. M. 1999, A&AS, 137, 473, doi: 10.1051/aas:1999105
- Neff et al. (1978) Neff, J. S., Smith, V. V., & Ketelsen, D. A. 1978, ApJS, 38, 89, doi: 10.1086/190548
- Nelson et al. (2011) Nelson, T., Mukai, K., Orio, M., Luna, G. J. M., & Sokoloski, J. L. 2011, ApJ, 737, 7, doi: 10.1088/0004-637X/737/1/7
- Nelson et al. (2008) Nelson, T., Orio, M., Cassinelli, J. P., et al. 2008, ApJ, 673, 1067, doi: 10.1086/524054
- Nelson et al. (2019) Nelson, T., Mukai, K., Li, K.-L., et al. 2019, ApJ, 872, 86, doi: 10.3847/1538-4357/aafb6d
- Ness et al. (2007) Ness, J. U., Schwarz, G. J., Retter, A., et al. 2007, ApJ, 663, 505, doi: 10.1086/518084
- Ness et al. (2009) Ness, J. U., Drake, J. J., Starrfield, S., et al. 2009, AJ, 137, 3414, doi: 10.1088/0004-6256/137/2/3414
- Ness et al. (2019) Ness, J. U., Orio, M., Starrfield, S., et al. 2019, The Astronomer’s Telegram, 13124, 1
- O’Brien et al. (1992) O’Brien, T. J., Bode, M. F., & Kahn, F. D. 1992, MNRAS, 255, 683, doi: 10.1093/mnras/255.4.683
- Orio (1993) Orio, M. 1993, A&A, 274, L41
- Orio (2013) —. 2013, The Astronomical Review, 8, 71, doi: 10.1080/21672857.2013.11519714
- Orio (2015) Orio, M. 2015, in The Golden Age of Cataclysmic Variables and Related Objects - III (Golden2015), 64
- Orio et al. (2001) Orio, M., Covington, J., & Ögelman, H. 2001, A&A, 373, 542, doi: 10.1051/0004-6361:20010537
- Orio et al. (2015) Orio, M., Rana, V., Page, K. L., Sokoloski, J., & Harrison, F. 2015, MNRAS, 448, L35, doi: 10.1093/mnrasl/slu195
- Orio et al. (2007) Orio, M., Zezas, A., Munari, U., Siviero, A., & Tepedelenlioglu, E. 2007, ApJ, 661, 1105, doi: 10.1086/514806
- Orlando & Drake (2012) Orlando, S., & Drake, J. J. 2012, MNRAS, 419, 2329, doi: 10.1111/j.1365-2966.2011.19880.x
- Orlando et al. (2009) Orlando, S., Drake, J. J., & Laming, J. M. 2009, A&A, 493, 1049, doi: 10.1051/0004-6361:200810109
- Orlando et al. (2017) Orlando, S., Drake, J. J., & Miceli, M. 2017, MNRAS, 464, 5003, doi: 10.1093/mnras/stw2718
- Osborne et al. (2011) Osborne, J. P., Page, K. L., Beardmore, A. P., et al. 2011, ApJ, 727, 124, doi: 10.1088/0004-637X/727/2/124
- Page et al. (2019) Page, K. L., Beardmore, A. P., Osborne, J. P., et al. 2019, The Astronomer’s Telegram, 13084, 1
- Page et al. (2015) Page, K. L., Osborne, J. P., Kuin, N. P. M., et al. 2015, MNRAS, 454, 3108, doi: 10.1093/mnras/stv2144
- Pavana et al. (2019a) Pavana, M., Anupama, G. C., & Kumar, S. P. 2019a, The Astronomer’s Telegram, 13245, 1
- Pavana et al. (2019b) Pavana, M., Roy, N., Anupama, G. C., Singh, K. P., & Girish, V. 2019b, The Astronomer’s Telegram, 13092, 1
- Peretz et al. (2016) Peretz, U., Orio, M., Behar, E., et al. 2016, ApJ, 829, 2, doi: 10.3847/0004-637X/829/1/2
- Polisensky et al. (2019) Polisensky, E., Linford, J. D., Giacintucci, S., et al. 2019, The Astronomer’s Telegram, 13185, 1
- Porquet et al. (2010) Porquet, D., Dubau, J., & Grosso, N. 2010, Space Sci. Rev., 157, 103, doi: 10.1007/s11214-010-9731-2
- Prialnik (1986) Prialnik, D. 1986, ApJ, 310, 222, doi: 10.1086/164677
- Rudy et al. (2019a) Rudy, R., Subasavage, J., Crawford, K., et al. 2019a, The Astronomer’s Telegram, 13059, 1
- Rudy et al. (2019b) —. 2019b, The Astronomer’s Telegram, 13059, 1
- Schaefer (2010) Schaefer, B. E. 2010, ApJS, 187, 275, doi: 10.1088/0067-0049/187/2/275
- Shafter et al. (2015) Shafter, A. W., Henze, M., Rector, T. A., et al. 2015, ApJS, 216, 34, doi: 10.1088/0067-0049/216/2/34
- Shara et al. (2018) Shara, M. M., Prialnik, D., Hillman, Y., & Kovetz, A. 2018, ApJ, 860, 110, doi: 10.3847/1538-4357/aabfbd
- Smith et al. (2001) Smith, R. K., Brickhouse, N. S., Liedahl, D. A., & Raymond, J. C. 2001, ApJ, 556, L91, doi: 10.1086/322992
- Sokoloski et al. (2006) Sokoloski, J. L., Luna, G. J. M., Mukai, K., & Kenyon, S. J. 2006, Nature, 442, 276, doi: 10.1038/nature04893
- Sokolovsky et al. (2019) Sokolovsky, K. V., Orio, M., Page, K. L., et al. 2019, The Astronomer’s Telegram, 13050, 1
- Stanishev et al. (2004) Stanishev, V., Zamanov, R., Tomov, N., & Marziani, P. 2004, A&A, 415, 609, doi: 10.1051/0004-6361:20034623
- Starrfield et al. (2019) Starrfield, S., Bose, M., Iliadis, C., et al. 2019, arXiv e-prints, arXiv:1910.00575. https://arxiv.org/abs/1910.00575
- Starrfield et al. (2009) Starrfield, S., Iliadis, C., Hix, W. R., Timmes, F. X., & Sparks, W. M. 2009, ApJ, 692, 1532, doi: 10.1088/0004-637X/692/2/1532
- Strader et al. (2019) Strader, J., Chomiuk, L., Aydi, E., et al. 2019, The Astronomer’s Telegram, 13047, 1
- Strope et al. (2010) Strope, R. J., Schaefer, B. E., & Henden, A. A. 2010, AJ, 140, 34, doi: 10.1088/0004-6256/140/1/34
- Tofflemire et al. (2013) Tofflemire, B. M., Orio, M., Page, K. L., et al. 2013, ApJ, 779, 22, doi: 10.1088/0004-637X/779/1/22
- Vurm & Metzger (2018) Vurm, I., & Metzger, B. D. 2018, ApJ, 852, 62, doi: 10.3847/1538-4357/aa9c4a
- Williams et al. (2019) Williams, B. J., Kelley, R., & Petre, R. 2019, in AAS/High Energy Astrophysics Division, AAS/High Energy Astrophysics Division, 303.01
- Wilms et al. (2000) Wilms, J., Allen, A., & McCray, R. 2000, ApJ, 542, 914, doi: 10.1086/317016
- Woodward et al. (2019) Woodward, C. E., Banerjee, D. P. K., Evans, A., Geballe, T. R., & Starrfield, S. 2019, The Astronomer’s Telegram, 13096, 1
- Yaron et al. (2005) Yaron, O., Prialnik, D., Shara, M. M., & Kovetz, A. 2005, ApJ, 623, 398, doi: 10.1086/428435