Discovering the most elusive radio relic in the sky: Diffuse Shock Acceleration caught in the act?
Abstract
The origin of radio relics is usually explained via diffusive shock acceleration (DSA) or re-acceleration of electrons at/from merger shocks in galaxy clusters. The case of acceleration is challenged by the low predicted efficiency of low-Mach number merger shocks, unable to explain the power observed in most radio relics. In this Letter we present the discovery of a new giant radio relic around the galaxy cluster Abell 2249 () using LOFAR. It is special since it has the lowest surface brightness of all known radio relics. We study its radio and X-ray properties combinig LOFAR data with uGMRT, JVLA and XMM. This object has a total power of W Hz-1 and integrated spectral index . We infer for this radio relic a lower bound on the magnetisation of G, a shock Mach number of , and a low acceleration efficiency consistent with DSA. This result suggests that a missing population of relics may become visible thanks to the unprecedented sensitivity of the new generation of radio telescopes.
keywords:
galaxies: clusters: general - magnetic fields - acceleration of particles1 Introduction
Radio relics are elongated, arc-shaped diffuse synchrotron sources extened over Mpc, usually found at the periphery of clusters of galaxies with ongoing mergers, showing with steep spectrum (, where the flux density is defined as and is the spectral index) steepening towards the cluster centre (e.g. van Weeren et al., 2019, for a review). Radio relics are strongly polarized at high frequencies, with a polarization fraction that can go up to at 1.4 GHz and at 5 GHz (van Weeren et al., 2010; Kierdorf et al., 2017; Loi et al., 2017). Several radio relics have also been found to trace the position of shock waves, as detected as discontinuities in the X-ray brightness profiles of the intra-cluster medium (ICM) (Akamatsu & Kawahara, 2013; Botteon et al., 2018). Merger shock waves are believed to be generated when clusters of galaxies collide, and then propagate along the direction of the merger. Shocks are more easily seen edge-on as projection boosts their surface brightness, and the same observational bias should also apply to radio relics. The kinetic energy dissipated at shocks should be related to the powering of the radio emission, via Diffusive Shock Acceleration (DSA, Bell 1978; Jones & Ellison 1991), as originally proposed by Ensslin et al. (1998). However, the Mach numbers that are independently inferred from discontinuities observed in X-rays are generally too weak () to account for the required electron acceleration efficiency by DSA in relics (e.g. Botteon et al., 2020, hereafter B+20). Moreover, shock waves in the intracluster medium should also accelerate protons that would create -ray emission in the collision with the thermal protons of the ICM. These -rays have not been detected (Ackermann et al., 2016), which translates into limits on the maximum acceleration efficiency of protons in structure formation shocks (, Vazza et al. 2016). This conundrum can be by-passed when invoking a pre-existing population of mildly non-thermal electrons that get re-accelerated by the shocks (Pinzke et al., 2013; Kang & Ryu, 2015; Markevitch et al., 2005). In a few cases, Active Galactic Nuclei could have supplied the relativistic electrons in the upstream region of the shock that creates the relic (Bonafede et al., 2014; van Weeren et al., 2017; Stuardi et al., 2019). Both acceleration and reacceleration processes operate in the ICM and should contribute to the population of radio relics. We note that we adopted a flat-CDM cosmology with and throughout the paper.
1.1 General properties of Abell 2249
In this work we present the discovery of a giant radio relic found at the periphery of the galaxy cluster Abell 2249 (hereafter A2249; RA 257.44080, DEC 34.45566). Its galaxies and ICM features have been studied in details at various wavelengths by a number of authors: the cluster mean redshift is z=0.0838 (Laganá et al., 2019; Lopes et al., 2018; Bulbul et al., 2016); the velocity dispersion of its constituent galaxies is between (Lopes et al., 2018) and km s-1 (Oh et al., 2018). Laganá et al. 2019 provided detailed XMM-Newton maps of temperature (peaking in the 4-7 keV energy band), pseudo-pressure, pseudo-entropy and metallicity in the central region, within the first kpc from the cluster centre. They classified A2249 as a non-cool-core (NCC) disturbed cluster, although Oh et al. 2018 and Lopes et al. 2018 did not find evidence for merging from the spectroscopic redshift distribution of cluster members. However, a Dressler & Shectman three-dimensional test of the galaxy redshifts suggests that the cluster is disturbed (Lopes et al., 2018). The radius of the cluster is R Mpc depending on the mass estimate which is debated between the values M, in units of , derived from radial velocity distribution, Chandra and Planck data respectively (Lopes et al., 2018; Zhu et al., 2016; Planck Collaboration et al., 2016). In this article we will adopt the Planck value. At larger radii R Mpc and M (Lopes et al., 2018; Oh et al., 2018).
2 Observation and data reduction
2.1 Radio observations
The low frequency observations of the A2249 field was carried out with the LOw Frequency ARray (LOFAR). The LOFAR HBA (MHz) observation was carried out during Cycle 9 (Proposal Id:LC9_020). The centre of the pointing was not at the cluster centre, but at coordinates 17:01:13 +33:20:15 (RA, DEC), at a distance of 2.1 degrees. The on-source time is 8 hr with two scans of 10 min each on the flux calibrator 3C295. A first calibration and imaging run was performed using the LOFAR data reduction pipeline (v2.2111https://github.com/mhardcastle/ddf-pipeline) involving both direction-independent (de Gasperin et al., 2019) and -dependent calibration of the data (Shimwell et al., 2017). Exploiting the sky models derived from the pipeline, we subtracted from the uv-data all sources outside a 1.9 region centred on the relic. This was done using the PYthon Blob Detector and Source Finder (pybdsf; Mohan & Rafferty 2015). The resulting data was then self-calibrated through nine iteration steps and then imaged using WSClean v2.4 (Offringa et al., 2014).
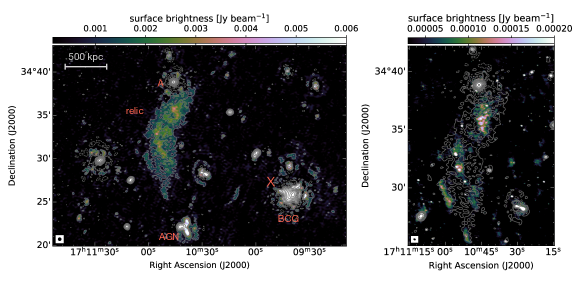
We produced images at (Fig. 1, left panel) and resolution using a Briggs weighting scheme with robust -0.5.
The image at higher (lower) resolution has a rms noise floor of .
We determined and applied a correction factor (van Weeren
et al., 2016; Hardcastle
et al., 2016, see also) to match the LOFAR HBA flux densities of point-like sources with the ones derived from the TIFR GMRT Sky Survey (TGSS; Intema et al. 2017). We assume flux uncertainties of 20% , similar to the LOFAR Two-meter Sky Survey images (Shimwell
et al., 2019).
We also observed the cluster with the upgraded Giant Meter Radio Telescope (uGMRT), in Band-4 covering a frequency range of 550-950 MHz (proposal DDT-C100). The data were flagged and calibrated using CASA. We then ran several rounds of direction-dependent self-calibration using the LOFAR DDF-pipeline (see above). The image reaches a noise level of at 700 MHz.
We have also analysed two short snapshot observations at 1.46 GHz from the VLA archive. About 8 min (four 2-min scans well spaced in time) and 25 min (single scan) in C and D configuration were available (project codes AS220 and AG294, respectively). We obtained a combined image of the intersecting part of the bands after standard calibration of the two individual datasets. The pointing was set on the brightest central galaxy (BCG), which is about 15 off the relic position. This highly affected the local sensitivity. The combined C+D image (not shown) allowed a resolution of about 30 and presents a number of separate patches of diffuse emission with peaks just above the local 3 in the region of the relic, with roughly the same morphology of the uGMRT image.
2.2 X-ray: XMM observation
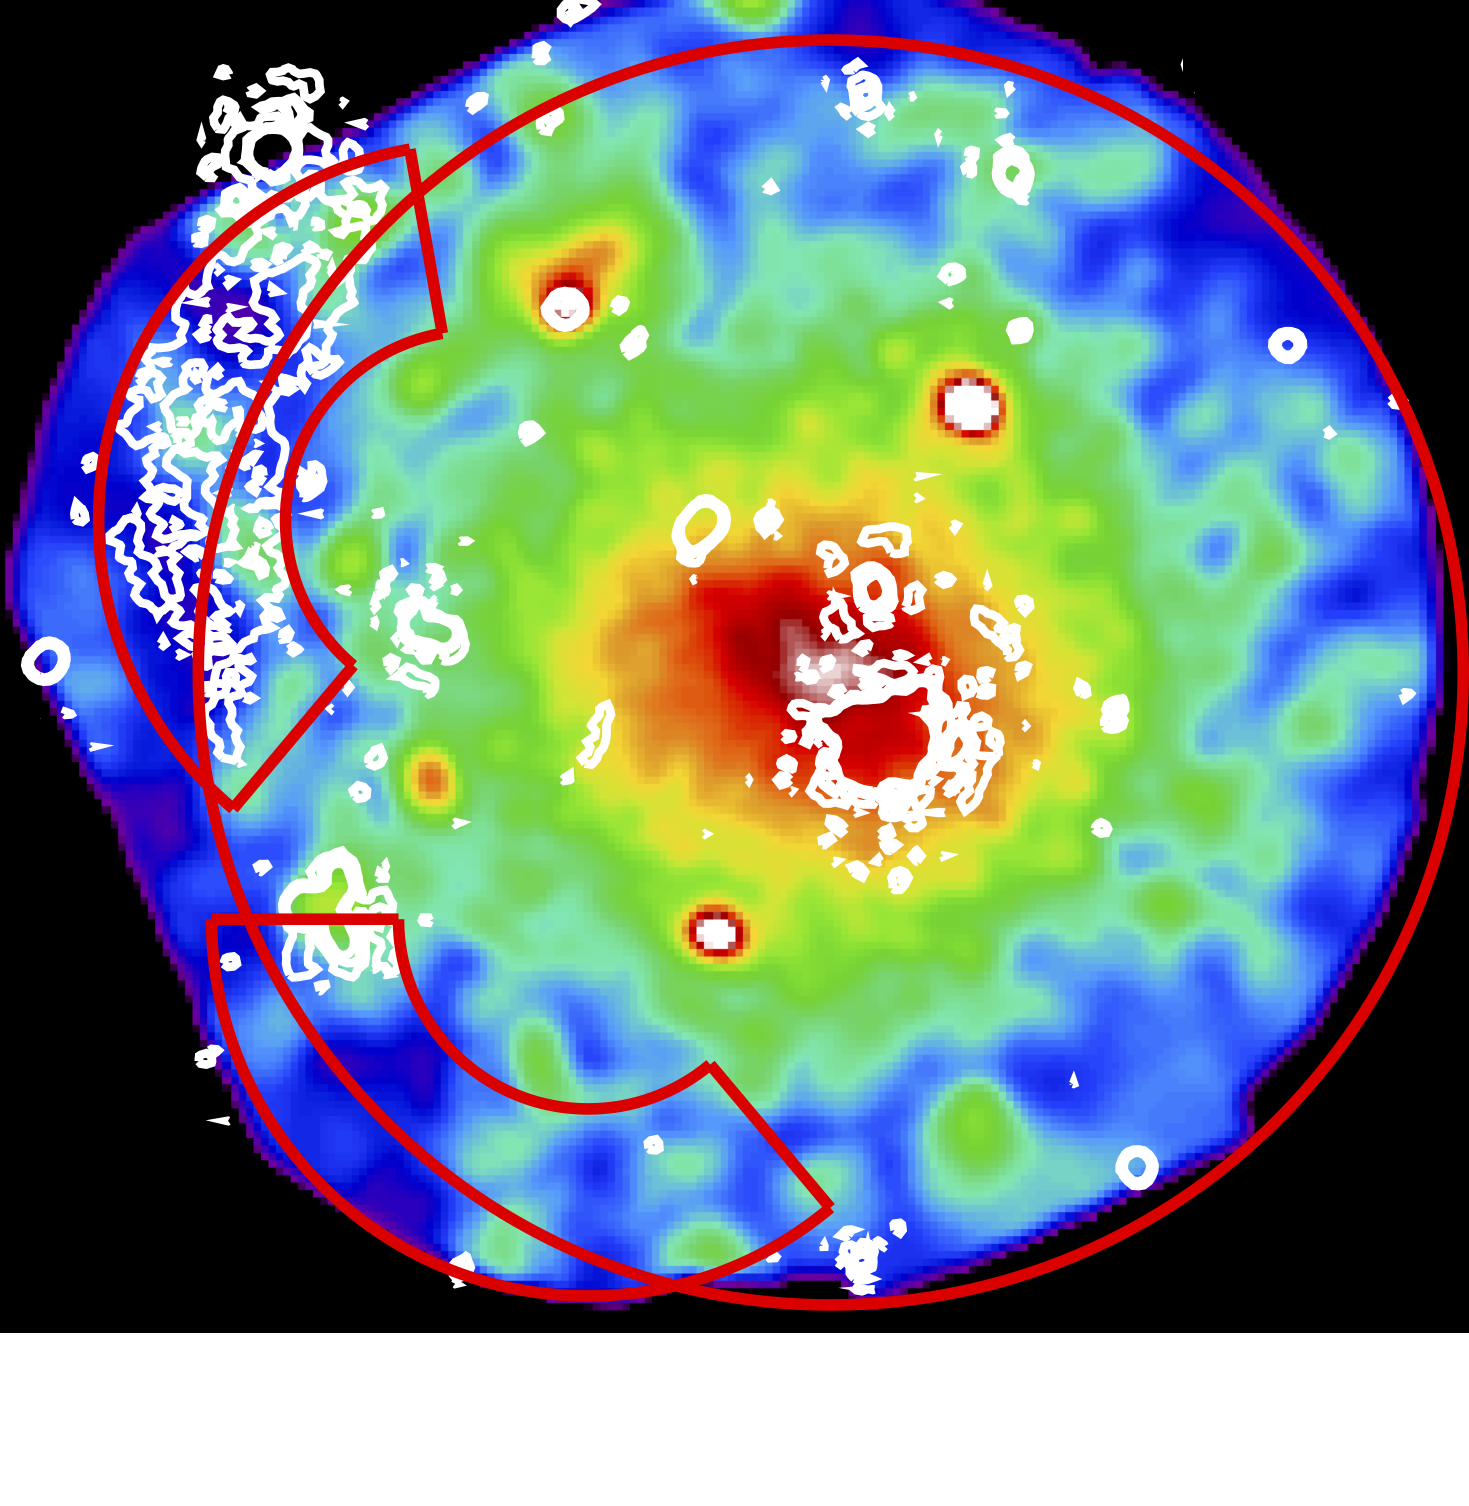
A2249 (also known under the name PSZ2 G057.61+34.93) has been observed as part of the XMM Heritage Cluster Project222http://xmm-heritage.oas.inaf.it, a large and unbiased sample of 118 clusters, detected with a high signal-to-noise ratio in the Second Planck SZ Catalogue. We reduced the data with SAS v . The observation with OBSID 0827010501 has a total clean exposure time of ks with MOS1, with MOS2 and with pn after filtering for soft proton flares (81% of the total time for MOS and 93% for the pn). We estimated the amount of residual soft protons following the procedure described in Cova et al. (2019) and found it to be negligible. For a full description of data reduction, image production and spectral extraction we refer to Ghirardini et al. (2019). In the right panel of Fig. 1 we show the XMM image in the 0.7-1.2 keV band with the overlay of the radio contours at 150 MHz with resolution and the regions used for the spectral analysis. Given that the emission of the cluster is filling the entire field of view of XMM for the estimate of the sky background components in a similar way to Snowden et al. (2008) we used a spectrum from the ROSAT All-Sky Survey extracted from an anulus between 0.5 and 1 degree from the source. We fixed the Galactic to cm-2 at HI LAB value (Kalberla et al., 2005) given the negligible difference with the value ( cm-2) which estimates the possible contribution of molecular hydrogen (Willingale et al., 2013).
| Symbol | value | description |
|---|---|---|
| flux density at 144 MHz | ||
| luminosity at 144 MHz | ||
| flux density at 700 MHz | ||
| integrated spectral index | ||
| between 144 and 700 MHz | ||
| relic solid angle at 144 MHz | ||
| projected radial cluster distance | ||
| LAS | 13.2 | largest angular scale |
| LLS(zA2249) | 1.3 Mpc | largest linear scale |
3 Results
Morphology
The extended diffuse emission at 144 MHz (Fig. 1) is arc-shaped and oriented perpendicular to the radial direction from the cluster centre, in the North-East-East sector of A2249, spanning an angular radial range from the cluster centre. The relic width is maximal at its the mean azimuthal direction and is minimal at the azimuthal ends of the diffuse emission, giving the radio relic a shape very similar to a crescent moon or the popular Italian sweet bun named "cornetto". The brightest part of the relic at 144 MHz is found at an angular radial distance of , that is a linear distance of 1.40 Mpc at the redshift of A2249. The relic’s largest angular scale (LAS) is , corresponding to a physical size of 1.3 Mpc at the redshift of the cluster. The northern end of the diffuse emission coincides with a bright unresolved radio source (A, Fig. 1 left panel), of at 144 MHz. Visible in the south-west direction is the BCG of A2249. Deconvolution artefacts remained around the bright sources A and BCG. The relic also shows elongated patches of emission of a few arcminutes, in analogy with the filamentary structures described in other radio relics (Owen et al., 2014; Pearce et al., 2017; Rajpurohit et al., 2018), whose origin is still unclear. The image at 700 MHz also shows diffuse emission at the relic position above , with a similar morphology as at lower frequency, as well as a large density of point sources (Fig. 1 central panel).
Radio spectrum & luminosity
The flux density and luminosity of the Cornetto relic at 144 MHz are and , respectively. The integrated spectral index, calculated from the ratio of the total flux densities at 144 and 700 MHz in the relic region (determined at 144 MHz) is . The observed quantities are summarized in Tab. 1.
Assuming to be constant we extrapolated the luminosity at 1.4 GHz to be W Hz-1. The Cornetto relic (red star, Fig. 2) is found to lie below the observed scaling relation between the radio power at 1.4 GHz and the largest linear size (LLS) of a sample of know radio relics presented in Nuza et al. (2017), extracted from the NRAO VLA Sky Survey (NVSS, Condon et al. 1998). From archival VLA images we find three different regions across the relic with matching contours between 144 MHz and 1.4 GHz. We computed the integrated power for these three regions and plotted them in Fig. 2 (red circles). The correlation in Fig. 2 has already been shown to be determined largely by the NVSS sensitivity (Nuza et al., 2017). The LOFAR observations presented here seem to open the window to a population of faint and diffuse relics that have not been seen to date.

X-ray properties at the position of the relic
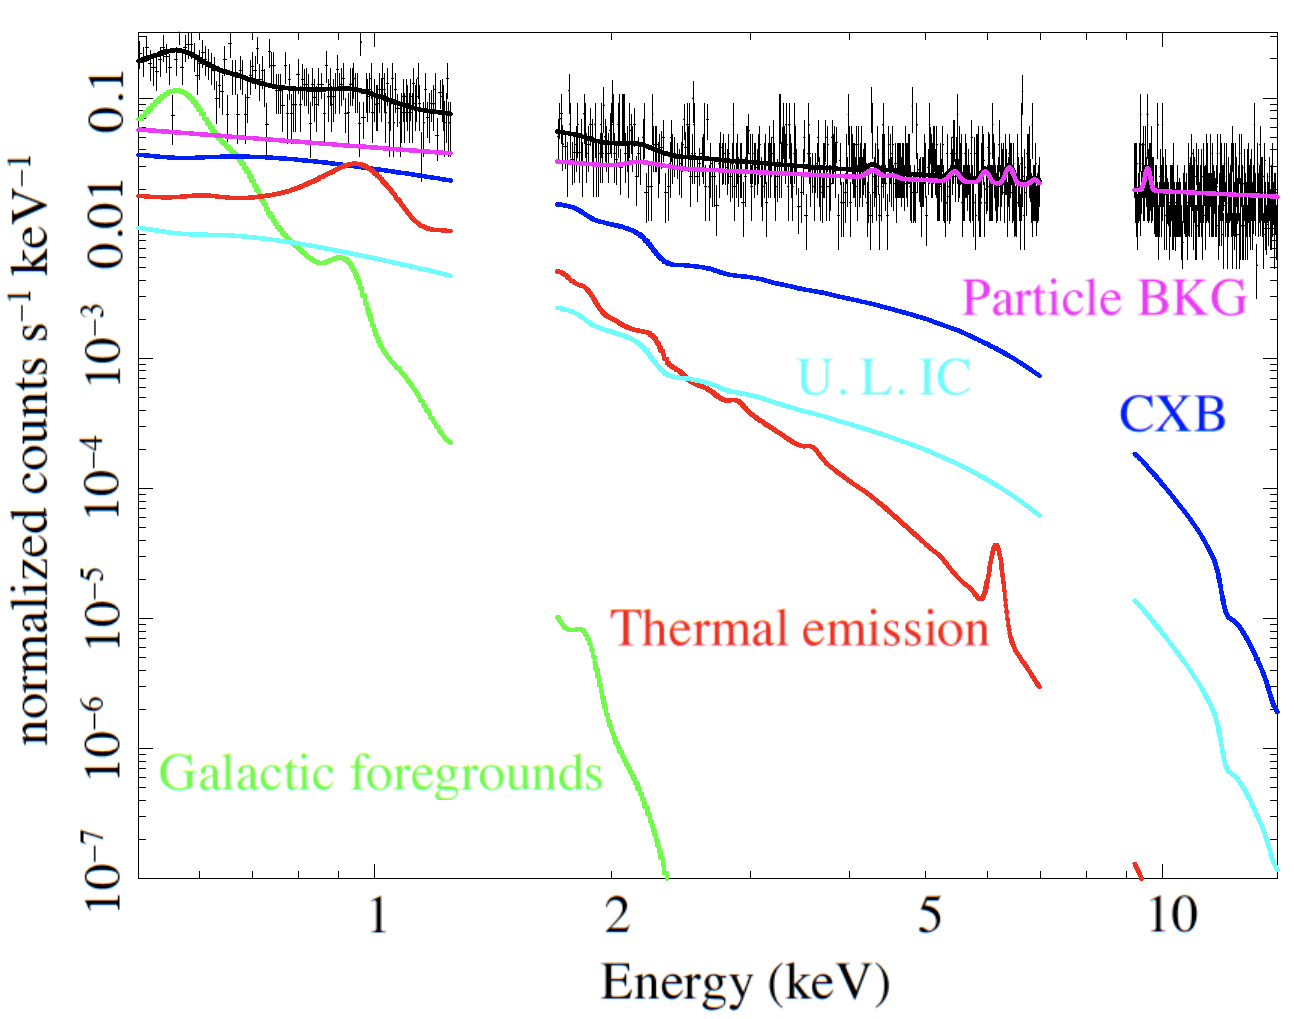
We extracted XMM MOS and pn spectra from an angular sector which covers the relic radio emission as shown in Fig. 1, right panel. The region extends beyond R500 and therefore the thermal emission is below the background. The temperature obtained is prone to large systematic errors and we therefore rely on the value obtained within the full annulus of keV together with an electron density . Assuming that temperature we modeled the expected IC emission as a power law with fixed photon index of 2.15 as derived from the radio spectral index and extrapolated a 90% upper limit of erg cm-2 s-1 in the 20-80 keV range. The X-ray spectrum in the relic region and its modeling is shown in Fig. 3. It is equivalent to the spectrum extracted from a region at the same radial distance from the cluster but avoiding the relic emission (see Fig. 1), confirming that any IC emission is clearly subdominant.
4 Modelling of physical properties
Based on our observations we study the origin of the relic in A2249 and infer limits on its magnetic field.
Diffusive Shock Acceleration
Assuming DSA, the power emitted by the Cornetto relic can be related to its shock properties (e.g. Hoeft et al., 2008, hereafter HB08; B+20):
| (1) |
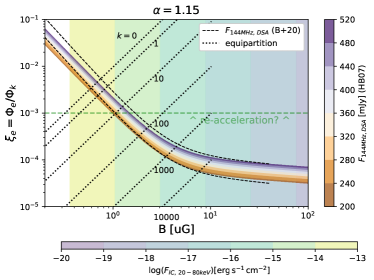
where is the surface area of the relic, calculated as LLS (we assume again LLS). is the downstream electron density, is the (yet unknown) fixed fraction of the kinetic energy flux injected at the shock front into suprathermal electrons, is the downstream electron temperature and is the equivalent field of the Cosmic Microwave Background evaluated at the redshift of A2249. The normalisation equals to when in units of [7 keV k], in units of 1.4 GHz and in [G].
Considering the values in Tab. 1, an integrated spectral index (holding a Mach number ) and the quantities derived from the XMM-Newton observations keV and , we can constrain the () parameter space to reproduce (DSA curves in Fig. 4). For completenss, we also consider the formulation of the model as found in B+20, which enforces the relativistic invariance in the HB08 model, which is particularly relevant for weak shocks. We obtain a magnetic field of G for and G for . The values for agree with models for DSA from shocks with Mach numbers (Kang & Ryu, 2015). Larger efficiencies are hard to reconcile with DSA and (in other objects) are used to argue for the existence of a pre-existing electron population that may have been re-accelerated by an earlier episode of shock acceleration. Re-acceleration has been invoked for most radio relics (all observed at frequencies MHz) for which an underlying shock wave has been detected in X-rays at their location, with the exception is the radio relic in the El Gordo galaxy cluster (B+20). Instead, the efficiency required to power the Cornetto relic can be explained by DSA electrons from the thermal pool, by a few G magnetic fields.
Equipartition
Synchrotron radiation provides information on both the electron’s energy distribution and the magnetic field strength, , in the medium. A simplistic assumption to disentangle the contribution of relativistic cosmic-rays (CRs) from magnetic fields is to assume equipartition between their energy densities in the plasma (e.g. Brunetti et al., 1997; Beck & Krause, 2005). In this case, the total energy density of magnetic fields and of CRs also approaches a minimum value. Classical equipartition formulae use parameters of the spectral energy distribution of electrons that is not affected by energy losses. In the case of radio relics instead, the spectrum of electrons emitting downstream results from the combination injection, transport and energy losses. We thus derive equipartition conditions assuming that the magnetic field in radio relics gets the same energy density of particles downstream, that is :
| (2) |
where is the ratio of energy budget between and , and are the gas density and shock velocity computed for the media respectively upstream (u) and downstream (d) of the shock front. The jump conditions have been derived from the shock Mach number . With this approach is directly comparable with the values derived from DSA.
The results for and are degenerate, however the equipartition assumption alone constraints the parameter space between the curves for (indicating a plasma where the energy budget is only given by ) and G resulting from . Combined with equipartition argument the efficiency selects the value of k.
Inverse Compton scattering
Based on the observed radio flux and assuming a power-law distribution of relativistic electrons, we can estimate the hard X-ray emission from Inverse Compton (IC) scatter from the same electron population responsible for the observed radio emission (e.g. Govoni & Feretti, 2004). Then we can compare this to recent upper limits obtained using XMM-Newton observations in the 0.1-12 keV band. We quote the flux estimates extrapolated in the 20-80 keV band for ease of comparison with previous estimates (e.g. Cova et al., 2019). The IC flux upper limit extrapolated in the keV band sets a lower limit on G. A magnetic field strength of (as suggested above assuming ) or lower would result in IC emission larger than the upper limit derived for A523 by Cova et al. (2019). For comparison, and (implying for DSA) produces , i.e. about one order of magnitudes below present- day upper limits. The lower limit from IC combined with the limit G from energy arguments implies efficiencies . Larger values would violate equipartition.
5 Conclusions
In this Letter we presented the discovery of extended, diffuse radio relic in A2249, found at low frequencies (120-168 MHz) with LOFAR. We have also observed the new relic (called Cornetto relic) at 700 MHz with the uGMRT and found patches of emission in coincidence of the brightest parts of the relic also in VLA archival data at 1.4 GHz. The magnetic field at the relic is estimated to be G, depending on model assumptions and the electron acceleration efficiency of the putative merger shock. The limits have been set from the absence of Inverse Compton emission in the keV energy band.
The Cornetto relic is among the largest relics discovered to-date (13.2’, corresponding to 1.26 Mpc) as well as the faintest one with such extent, once extrapolated at 1.4 GHz, lying at least a factor below the observed scaling relation between the radio power at 1.4 GHz and the LLS of radio relics.
Its low luminosity is well explained by DSA for the inferred plasma and shock parameters, unlike most other radio relics that require a higher electron acceleration efficiency and invoke past acceleration events acting on the seed electron population already present in the ICM thermal pool.
This discovery, only made possible by the unprecedented sensitivity of LOFAR to large angular scales at low frequencies, may hint to a population of low-power, faint and diffuse radio relics, for which re-acceleration has not taken place (or not yet) or is inefficient with respect to standard DSA. This can be explored by the new generation low-frequency arrays (e.g. LOFAR, SKA-low).
Acknowledgements
We thank our anonymous reviewer for the helpful scientific feedback. NTL, KR and FV acknowledge financial support from the ERC Starting Grant "MAGCOW", no. 714196. AB, CS and EB acknowledge financial support from the ERC Starting Grant "DRANOEL", no. 714245. NTL thanks Silvia Gandolfi and Raffaele Moretti for extensive support. We thank Dan Wik for useful discussions about IC emission. MB acknowledges support from the Deutsche Forschungsgemeinschaft under Germany’s Excellence Strategy - EXC 2121 "Quantum Universe" - 390833306. FG and MR acknowledge financial contribution from the agreement ASI-INAF n.2017-14-H. Radio imaging made use of WSClean v2.6 (Offringa et al., 2014) and CASA (https://casa.nrao.edu). This paper is based (in part) on data obtained with the International LOFAR Telescope (obs. ID LC9_020, PI F.V) and analysed using LOFAR-IT infrastructure. LOFAR (van Haarlem et al. 2013) is the Low Frequency Array designed, constructed by ASTRON and collectively operated by the ILT foundation.
References
- Ackermann et al. (2016) Ackermann M., et al., 2016, ApJ, 819, 149
- Akamatsu & Kawahara (2013) Akamatsu H., Kawahara H., 2013, PASJ, 65, 16
- Beck & Krause (2005) Beck R., Krause M., 2005, Astronomische Nachrichten, 326, 414
- Bell (1978) Bell A. R., 1978, MNRAS, 182, 147
- Bonafede et al. (2014) Bonafede A., Intema H. T., Brüggen M., Girardi M., Nonino M., Kantharia N., van Weeren R. J., Röttgering H. J. A., 2014, ApJ, 785, 1
- Botteon et al. (2018) Botteon A., Gastaldello F., Brunetti G., 2018, MNRAS, 476, 5591
- Botteon et al. (2020) Botteon A., Brunetti G., Ryu D., Roh S., 2020, A&A, 634, A64
- Brunetti et al. (1997) Brunetti G., Setti G., Comastri A., 1997, A&A, 325, 898
- Bulbul et al. (2016) Bulbul E., Markevitch M., Foster A., Miller E., Bautz M., Loewenstein M., Rand all S. W., Smith R. K., 2016, ApJ, 831, 55
- Condon et al. (1998) Condon J. J., Cotton W. D., Greisen E. W., Yin Q. F., Perley R. A., Taylor G. B., Broderick J. J., 1998, AJ, 115, 1693
- Cova et al. (2019) Cova F., et al., 2019, A&A, 628, A83
- Ensslin et al. (1998) Ensslin T. A., Biermann P. L., Klein U., Kohle S., 1998, A&A, 332, 395
- Ghirardini et al. (2019) Ghirardini V., et al., 2019, A&A, 621, A41
- Govoni & Feretti (2004) Govoni F., Feretti L., 2004, International Journal of Modern Physics D, 13, 1549
- Hardcastle et al. (2016) Hardcastle M. J., et al., 2016, MNRAS, 462, 1910
- Hoeft et al. (2008) Hoeft M., Brüggen M., Yepes G., Gottlöber S., Schwope A., 2008, MNRAS, 391, 1511
- Intema et al. (2017) Intema H. T., Jagannathan P., Mooley K. P., Frail D. A., 2017, A&A, 598, A78
- Jones & Ellison (1991) Jones F. C., Ellison D. C., 1991, Space Sci. Rev., 58, 259
- Kalberla et al. (2005) Kalberla P. M. W., Burton W. B., Hartmann D., Arnal E. M., Bajaja E., Morras R., Pöppel W. G. L., 2005, A&A, 440, 775
- Kang & Ryu (2015) Kang H., Ryu D., 2015, ApJ, 809, 186
- Kierdorf et al. (2017) Kierdorf M., Beck R., Hoeft M., Klein U., van Weeren R. J., Forman W. R., Jones C., 2017, A&A, 600, A18
- Laganá et al. (2019) Laganá T. F., Durret F., Lopes P. A. A., 2019, MNRAS, 484, 2807
- Loi et al. (2017) Loi F., et al., 2017, MNRAS, 472, 3605
- Lopes et al. (2018) Lopes P. A. A., Trevisan M., Laganá T. F., Durret F., Ribeiro A. L. B., Rembold S. B., 2018, MNRAS, 478, 5473
- Markevitch et al. (2005) Markevitch M., Govoni F., Brunetti G., Jerius D., 2005, ApJ, 627, 733
- Mohan & Rafferty (2015) Mohan N., Rafferty D., 2015, PyBDSF: Python Blob Detection and Source Finder (ascl:1502.007)
- Nuza et al. (2017) Nuza S. E., Gelszinnis J., Hoeft M., Yepes G., 2017, MNRAS, 470, 240
- Offringa et al. (2014) Offringa A. R., et al., 2014, MNRAS, 444, 606
- Oh et al. (2018) Oh S., et al., 2018, ApJS, 237, 14
- Owen et al. (2014) Owen F. N., Rudnick L., Eilek J., Rau U., Bhatnagar S., Kogan L., 2014, ApJ, 794, 24
- Pearce et al. (2017) Pearce C. J. J., et al., 2017, ApJ, 845, 81
- Pinzke et al. (2013) Pinzke A., Oh S. P., Pfrommer C., 2013, MNRAS, 435, 1061
- Planck Collaboration et al. (2016) Planck Collaboration et al., 2016, A&A, 594, A27
- Rajpurohit et al. (2018) Rajpurohit K., et al., 2018, ApJ, 852, 65
- Shimwell et al. (2017) Shimwell T. W., et al., 2017, A&A, 598, A104
- Shimwell et al. (2019) Shimwell T. W., et al., 2019, A&A, 622, A1
- Snowden et al. (2008) Snowden S. L., Mushotzky R. F., Kuntz K. D., Davis D. S., 2008, A&A, 478, 615
- Stuardi et al. (2019) Stuardi C., et al., 2019, MNRAS, p. 2080
- Vazza et al. (2016) Vazza F., Brüggen M., Wittor D., Gheller C., Eckert D., Stubbe M., 2016, MNRAS, 459, 70
- Willingale et al. (2013) Willingale R., Starling R. L. C., Beardmore A. P., Tanvir N. R., O’Brien P. T., 2013, MNRAS, 431, 394
- Zhu et al. (2016) Zhu Z., et al., 2016, ApJ, 816, 54
- de Gasperin et al. (2019) de Gasperin F., et al., 2019, A&A, 622, A5
- van Weeren et al. (2010) van Weeren R. J., Röttgering H. J. A., Brüggen M., Hoeft M., 2010, Science, 330, 347
- van Weeren et al. (2016) van Weeren R. J., et al., 2016, ApJS, 223, 2
- van Weeren et al. (2017) van Weeren R. J., et al., 2017, Nature Astronomy, 1, 0005
- van Weeren et al. (2019) van Weeren R. J., de Gasperin F., Akamatsu H., Brüggen M., Feretti L., Kang H., Stroe A., Zandanel F., 2019, Space Sci. Rev., 215, 16