Magnetic phase diagram of the linear quantum ferro-antiferromagnet Cs2Cu2Mo3O12
Abstract
A single-crystal sample of the frustrated quasi-one-dimensional quantum magnet Cs2Cu2Mo3O12 is investigated by magnetic and thermodynamic measurements. A combination of specific heat and magnetic torque measurements maps out the entire - phase diagram for three orientations. Remarkably, a new phase emerges below the saturation field, irrespective of the crystal orientation. It is suggested that the presaturation phase represents spin-nematic order or other multi-magnon condensate. The phase diagrams within the long-range-ordered dome are qualitatively different for each geometry. In particular, multiple transitions are identified in the field along the chain direction.
I Introduction
Quantum magnets with competing antiferromagnetic (AFM) and ferromagnetic (FM) bonds may demonstrate very peculiar behavior, especially in applied magnetic fields. This is true for even the simplest chain model with (FM) nearest-neighbor and (AFM) next-nearest-neighbor exchange constants Tonegawa and Harada (1989); Igarashi (1989); Tonegawa et al. (1990); Chubukov (1991). The FM coupling gives rise to an attraction between magnons in the high-field fully polarized phase, and sometimes stabilizes multi-magnon bound states in that regime Heidrich-Meisner et al. (2006); Kecke et al. (2007); Vekua et al. (2007); Hikihara et al. (2008); Sudan et al. (2009); Zhitomirsky and Tsunetsugu (2010). As the magnetic field is lowered, such bound states may condense before a conventional AFM ordering occurs via single-magnon Bose-Einstein condensate (BEC) Batyev and Braginski (1984). The result is an entire zoo of possible -magnon condensates. These presaturation phases are characterized by exotic symmetry breaking patterns giving rise to unconventional states such as spin-nematic (quadrupolar), octupolar or hexadecapolar order Heidrich-Meisner et al. (2006); Kecke et al. (2007); Vekua et al. (2007); Hikihara et al. (2008); Sudan et al. (2009); Heidrich-Meisner et al. (2009); Zhitomirsky and Tsunetsugu (2010); Sato et al. (2013), spin density waves (SDW) Hikihara et al. (2008); Sudan et al. (2009); Sato et al. (2013); Nishimoto et al. (2015), as well as various chiral structures Kolezhuk and Vekua (2005); Hikihara et al. (2008); Sudan et al. (2009); Heidrich-Meisner et al. (2009). The challenge is to find and explore these exotic states of spin matter experimentally. To date, only a handful have been found in real FM-AFM spin-chain materials: LiCuVO4 Svistov et al. (2011); Masuda et al. (2011); Mourigal et al. (2012); Nawa et al. (2013); Büttgen et al. (2014); Orlova et al. (2017); Gen et al. (2019), PbCuSO4(OH)2 Willenberg et al. (2012); Schäpers et al. (2013); Willenberg et al. (2016); Feng et al. (2018); Heinze et al. (2019), NaCuMoO4(OH) Nawa et al. (2014, 2017); Asai et al. (2020), and -TeVO4 Pregelj et al. (2015); Weickert et al. (2016); Pregelj et al. (2019).
The focus of the present study is on another candidate species, namely the linear chain molybdate Cs2Cu2Mo3O12 Solodovnikov and Solodovnikova (1997); Hase et al. (2005). This rather complex system has been extensively studied, but only using powder samples. Previous work includes thermodynamic and magnetic measurements Hase et al. (2005); Fujimura et al. (2016), high pressure studies Hamasaki et al. (2007), NMR Hoshino et al. (2014); Goto et al. (2017); Yagi et al. (2018); Matsui et al. (2018), and muon spin relaxation measurements Goto et al. (2017); Matsui et al. (2018). The material orders magnetically in three dimensions at K Fujimura et al. (2016), but its low dimensionality and high degree of frustration are beyond doubt. The exchange constants have been estimated as K and K Hase et al. (2005). Particularly intriguing are NMR results which seem to indicate a nematic Tomonaga-Luttinger liquid (TLL) state at high magnetic field Hoshino et al. (2014); Goto et al. (2017).
Further progress can only be achieved using single-crystal experiments. Recent studies of this type were key to understanding the rich physics of the isostructural Rb2Cu2Mo3O12 Hayashida et al. (2019). In the present work, we report comprehensive single-crystal magneto-thermodynamic measurements on Cs2Cu2Mo3O12. We map out the entire - phase diagram down to 0.1 K and up to the full saturation for three field directions. The Cs compound appears to be considerably more exotic than its Rb counterpart. The most intriguing finding is a distinctive presaturation phase in all field geometries. It has all characteristics of a multi-magnon condensate. Another is an entire cascade of magnetic phase transitions in a magnetic field applied along the chain axis.
II Experimental details
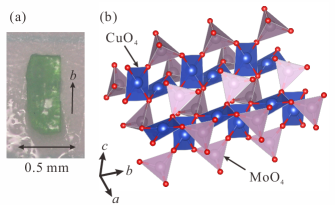
A single-crystal sample of Cs2Cu2Mo3O12 with mass g was grown by a spontaneous crystallization in a flux method Solodovnikov and Solodovnikova (1997). Green transparent crystals were obtained as shown in Fig. 1(a). The crystal structure [monoclinic , Å, Å, Å, , , ] was validated using single-crystal x-ray diffraction on a Bruker APEX-II instrument. It was found to be totally consistent with the previous report Solodovnikov and Solodovnikova (1997). The magnetic properties are due to Cu2+ cations. As illustrated in Fig. 1(b), CuO4 plaquettes form one-dimensional chains along the crystallographic axis. The individual chains are paired via MoO4 bridges. The resulting chain-pairs are separated from one another by the Cs+ ions.
All measurements were carried out using the 3He-4He dilution refrigerator insert for the Quantum Design Physical Property Measurement System (PPMS). The magnetic field was applied along the crystallographic , , and directions. Heat capacity data were collected on a standard Quantum Design relaxation calorimetry option in the range of K K and T T. Magnetization measurements were carried out on a home-made Faraday force magnetometer Blosser et al. (2020). Field scans were collected at and K up to T. The absolute values of magnetization were obtained in a calibration measurement at K using the Vibrating Sample Magnetometer (VSM) option for the PPMS.
For magnetic torque measurements the crystal was mounted on a CuBe-made cantilever. For the and configurations, we mounted the crystal on a silver-foil sample holder to fix the crystal orientation. We measured the cantilever deflection by observing a change in electric capacitance . The magnetic field was swept continuously from 11 to 0 T, and temperatures set from 0.1 to 2.2 K in 0.1 K steps. The used sweeping rates were 2.5 Oe/s at 0.1 K, 5 Oe/s at 0.2 K, 10 Oe/s at 0.3 and 0.4 K , and 20 Oe/s for the rest of the temperature range. The raw data at each temperature were combined so that the number of the data points is the same for all scans. The temperature was unstable at low field because sweeping the field heated up the sample holder. The data whose temperature stability is within K are displayed in the figures.
III Results and discussion
III.1 Specific heat
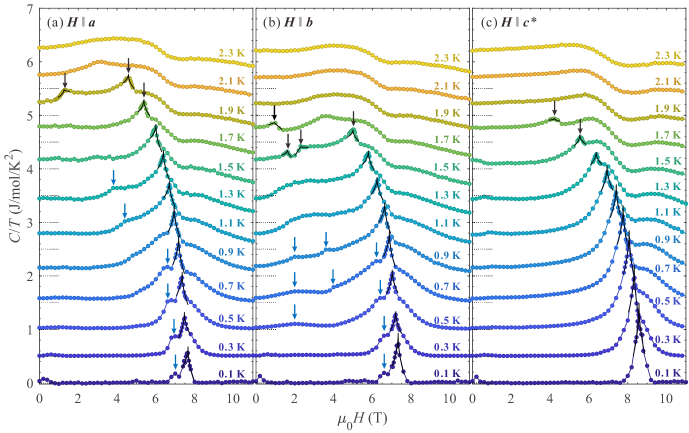
Typical measured field dependent heat capacity scans are shown in Fig. 2. Sharp lambda anomalies indicated by solid curves are observed below 2.2 K for all orientations. These are attributed to a phase transition from the paramagnetic state to the three-dimensional long-range ordered phase (3D LRO). The obtained critical fields at 0.1 K are anisotropic: T for the axis, T for the axis, and T for the axis. In addition to the sharp lambda peaks, broad but prominent double-hump features are observed near the critical fields for all geometries. These show the typical behavior of , quantum criticality Korepin and Slavnov (1990); Sachdev et al. (1994), and are observed in other one-dimensional magnets Rüegg et al. (2008); Breunig et al. (2017); Blosser et al. (2018) and the isostructural Rb compound Hayashida et al. (2019).
At higher temperatures, the lambda anomalies for each field geometry exhibit qualitatively different behavior. For , an additional peak appears at 1.9 K and at 1.4 T [Fig. 2(a)]. This peak shifts to higher field with increasing temperature, and merges with the other peak at 2.1 K. For , double peaks are observed at 1.5 K and around 2 T [Fig. 2(b)]. With increasing temperature, these peaks shift to lower and higher fields, respectively. The peak at the high field merges with another lambda peak. Finally, no additional peak is observed at the boundary for [Fig. 2(c)].
Characteristic kinks are observed within the domes of the 3D LRO phase as indicated by blue arrows in Fig. 2. For and , small kinks are found beside the sharp lambda-anomalies below 0.8 K. These indicate the existence of a presaturation phase, as we discuss later in the phase diagram. Furthermore, we observe temperature-dependent kinks around 4 T for and , and temperature-independent ones at 2 T for . In contrast with the and configurations, the specific heat scans in the LRO dome for are rather simple. Tiny kinks are found in the range of 1.0 K 1.5 K below 1 T, but we suspect that they are experimental artifacts because there is no indication of them in the magnetic torque measurements, as we show later. Note that small peaks at 0.1 K and 0.2 T for all the geometries are due to nuclear specific heat.
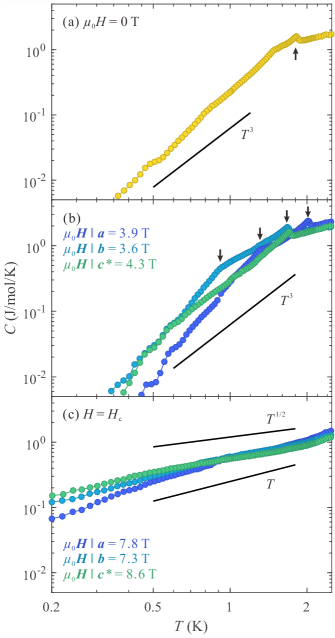
Temperature dependence of the specific heat at zero field is shown in Fig. 3(a). Note the logarithmic scale on both axes. At zero field, the lambda anomaly is clearly observed at K, which is consistent with what is reported in the powder data Fujimura et al. (2016). In the LRO state, the specific heat decays as a power law. Its thermal dependence is close to , as expected for three-dimensional spin-waves with a linear gapless dispersion.
In applied fields, across the domes of the 3D LRO phase, constant- temperature scans of the specific heat show distinct lambda-anomalies at the phase boundary, as shown in Fig. 3(b). In addition, kinks are observed at 1.3 K for the axis and at 0.9 K for axis. The specific heat data rapidly decay below the kinks, suggesting the existence of thermally activated behavior with a gap. In contrast, the specific heat for follows a power law in almost the entire temperature range. This behavior is attributed to a gapless or slightly gapped magnetic state. The specific heat at the critical fields is strongly enhanced due to quantum fluctuations, as shown in Fig. 3(c). Since it decays as a power law, a gapless magnetic state is formed. It is important to note that their thermal behavior at the lowest temperatures does not follow a -law which one would expect for a gapless parabolic dispersion in one dimension. The observed behavior is distinct from what is observed at the upper critical fields in Rb2Cu2Mo3O12 Hayashida et al. (2019).
III.2 Magnetization
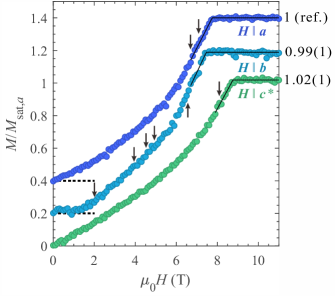
Magnetization curves for the three field geometries at K are shown in Fig. 4. The magnetization for the direction is strongly suppressed at low fields, and a plateau of zero magnetization exists below 2 T. On the other hand, the magnetization for the and axes increases linearly from zero field. This behavior is interpreted as a spin-flop reorientation. It suggests anisotropic exchange interactions, being the crystallographic direction the magnetic easy-axis.
The magnetization at K saturates at T for the axis, T for the axis, and T for the axis, in agreement with the critical fields observed in the specific heat data. In spite of the anisotropic saturation fields, the saturation magnetization for all geometries is very isotropic. This indicates that the -factor of the Cu2+ ion is isotropic even though the spin interactions are anisotropic. It is also important to note that we see a linear increase of magnetization at saturation. This behavior is typical of two- or three-dimensional systems, which is distinct from the square-root singularity found in Rb2Cu2Mo3O12 Hayashida et al. (2019) and predicted in general for one-dimensional materials Bonner and Fisher (1964). It is likely that exchange interactions between the chains are not negligible. On the other hand, the linear approach to saturation may be a feature of the magnetic order in the presaturation phase absent in the Rb compound.
III.3 Magnetic torque
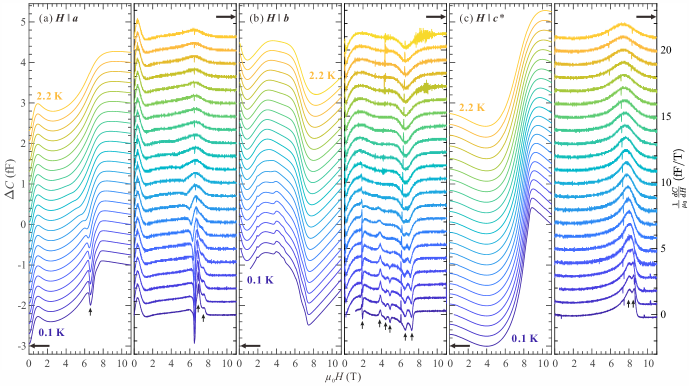
The raw data and their derivative for the three configurations are shown in Fig. 5. The magnetic torque curves are greatly dependent on the magnetic field directions and very complicated, evidencing the existence of various magnetic states in the LRO dome. To pinpoint the phase transitions, we fit our data to empirical distorted Lorentzian functions, as described in Ref. (Feng et al., 2018). Note that dips at 1 T for and are due to paramagnetic components from the silver-foil sample holder and the CuBe-made cantilever. Very sharp and temperature-independent features in the derivative of the data are not related to the sample.
First of all, characteristic double peaks are observed at the saturation field in the derivatives for the all three geometries. While the peaks at higher field correspond to the saturation field, the other ones suggest a transition to a presaturation phase. Upon increasing temperature, the two peaks merge together, and form one broad peak. This broad feature probably reflects a cross-over from the partially magnetized to the fully polarized state.
For , a dip in is identified at T as shown in the left panel of Fig. 5(a). It shifts to lower fields and its amplitude decreases with increasing temperature. The most structured curves are observed for . We see four additional anomalies at 1.9, 3.8, 4.5, and 4.9 T in the derivative of the data, as indicated by arrows in the right panel of Fig. 5(b). The sharp anomaly at 1.9 T is independent of temperature. We ascribe it to the spin-flop transition observed in magnetization. The peak at 3.8 T coincides with the kink observed at 4 T in the specific heat. However, no signature is found in other measurements that match the dips at 4.5 and 4.9 T. In contrast, the magnetic torque scans for [Fig. 5(c)] are rather simple, and no feature is identified except for the presaturation phase. Note that no anomaly is found below 1 T, where we found the tiny kinks in the range of 1.0 K 1.5 K in specific heat data for .
III.4 Phase diagram
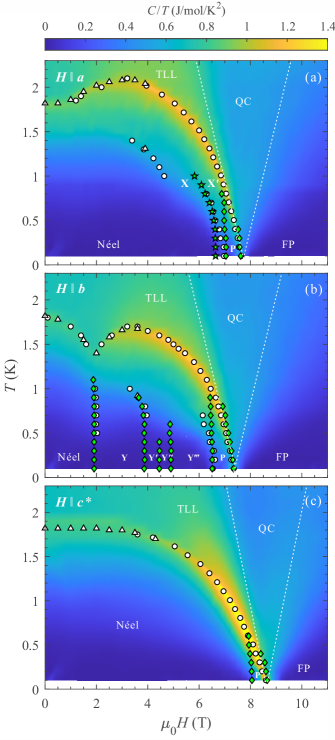
The magnetic phase diagrams are constructed using the constant-temperature field scans of the specific heat, as shown in Figs. 6(a) to 6(c) over false-color plots. The symbols indicate the observed peaks and kinks in specific heat and magnetic torque measurements. The boundaries of the LRO dome are remarkably anisotropic at high temperatures. The maximal ordering temperature is visibly enhanced for , and a bicritical point splitting into two phases is found at 2 T for . The phase boundary for is much simpler than for the other directions.
The most striking feature is the emergence of a narrow presaturation phase. In contrast to the anisotropic behavior at low fields, this phase is independent of the geometry. This indicates that the presaturation phase is relevant to the physics of the isotropic - spin- chain that predicts a spin-nematic order or a spin-density wave state due to a formation of bound magnon pairs Heidrich-Meisner et al. (2006); Kecke et al. (2007); Vekua et al. (2007); Hikihara et al. (2008); Sudan et al. (2009); Heidrich-Meisner et al. (2009); Zhitomirsky and Tsunetsugu (2010); Sato et al. (2013); Nishimoto et al. (2015). It is noted that the NMR study found the spin-nematic TLL state above 7.3 T in the paramagnetic phase Hoshino et al. (2014); Goto et al. (2017). Therefore, it is suggested that a spin nematic order is developed in the presaturation phase in Cs2Cu2Mo3O12.
Another unusual feature is the existence of complex magnetic transitions in the intermediate fields for as shown in Fig. 6(b). First, the spin-flop transition at 2 T splits the LRO dome into two regions. Due to the easy-axis anisotropy and the frustration, it is likely that the transition occurs from a collinear Néel state to an incommensurate structure. In addition, it is noteworthy that multiple transitions are found in the high field phase. Up to five different regions are identified at low temperatures. Since we do not see any indications in the magnetization for these transitions (see Fig. 4), they may be attributed to the transverse component of the spin. On the contrary, the phase diagrams for the other geometries are simpler than that for . For , two transitions are identified at 4 and 6.5 T below the presaturation phase [Fig. 6(a)]. There is no clear indication of an additional transition for [Fig. 6(c)].
We compare the measured phase diagrams to the ones in other FM-AFM spin chain materials. Spin-density wave states Masuda et al. (2011); Mourigal et al. (2012); Nawa et al. (2013); Willenberg et al. (2016); Heinze et al. (2019); Nawa et al. (2017); Asai et al. (2020); Pregelj et al. (2019) and presaturation phases suggesting a spin nematic order Büttgen et al. (2014); Orlova et al. (2017); Gen et al. (2019); Willenberg et al. (2012); Schäpers et al. (2013); Willenberg et al. (2016); Feng et al. (2018); Heinze et al. (2019); Pregelj et al. (2015); Weickert et al. (2016); Pregelj et al. (2019) have been previously found. The observed presaturation phase for Cs2Cu2Mo3O12 exists in a narrow range between and , which approximately coincides with those ranges for LiCuVO4 Gen et al. (2019) and -TeVO4 Pregelj et al. (2019). The most significant difference is that the collinear Néel state is formed at zero field in Cs2Cu2Mo3O12, whereas a spin spiral order was found in the other candidate materials Masuda et al. (2011); Mourigal et al. (2012); Nawa et al. (2013); Willenberg et al. (2012, 2016); Heinze et al. (2019); Nawa et al. (2017); Asai et al. (2020); Pregelj et al. (2015, 2019). Thus, Cs2Cu2Mo3O12 is a rare FM-AFM spin chain material with an easy-axis anisotropy.
A FM-AFM spin chain with an easy-axis anisotropy has been less studied than that with an easy-plane anisotropy Igarashi (1989); Tonegawa et al. (1990); Heidrich-Meisner et al. (2009). In the Ising limit of the anisotropy, fully polarized ferromagnetic and up-up-down-down antiferromagnetic phases appear below and above , respectively. When a weak easy-plane anisotropy is introduced, a partially polarized ferromagnetic phase is formed between the fully polarized ferromagnetic and up-up-down-down phases Igarashi (1989); Tonegawa et al. (1990). In addition, it has been proven that an easy-axis anisotropy enhances a multimagnon bound state Heidrich-Meisner et al. (2009). However, the detailed phase diagram with a weak easy-axis anisotropy, which is the case in the present result, remains unclear. Further experimental and theoretical investigation of the ground state and spin model is crucial to elucidate the presaturation phase and multiple transitions in Cs2Cu2Mo3O12.
IV Conclusion
Magnetic and thermodynamic measurements using a single-crystal sample provide several important findings for the nature of the quantum magnetism in Cs2Cu2Mo3O12. (i) The -like behavior of the specific heat in zero field as well as the linear magnetization near saturation may indicate that inter-chain interactions are more important than in the Rb-based system. (ii) The observed spin-flop transition indicates easy--axis magnetic anisotropy and a collinear magnetic structure at zero field. The anisotropy is that of interactions, since the saturation magnetization is remarkably isotropic. (iii) A novel presaturation phase is found for all geometries. We speculate that it represents spin-nematic order or other multi-magnon condensate. (iv) In the LRO dome, multiple transitions are identified applying the field along the direction. Further work on the spin model is necessary to elucidate the unique magnetic states in Cs2Cu2Mo3O12.
Acknowledgements
This work was supported by Swiss National Science Foundation under Division II.
References
- Tonegawa and Harada (1989) T. Tonegawa and I. Harada, J. Phys. Soc. Jpn. 58, 2902 (1989).
- Igarashi (1989) J.-I. Igarashi, J. Phys. Soc. Jpn. 58, 4600 (1989).
- Tonegawa et al. (1990) T. Tonegawa, I. Harada, and J.-i. Igarashi, Prog. Theor. Phys. Suppl. 101, 513 (1990).
- Chubukov (1991) A. V. Chubukov, Phys. Rev. B 44, 4693 (1991).
- Heidrich-Meisner et al. (2006) F. Heidrich-Meisner, A. Honecker, and T. Vekua, Phys. Rev. B 74, 020403(R) (2006).
- Kecke et al. (2007) L. Kecke, T. Momoi, and A. Furusaki, Phys. Rev. B 76, 060407(R) (2007).
- Vekua et al. (2007) T. Vekua, A. Honecker, H.-J. Mikeska, and F. Heidrich-Meisner, Phys. Rev. B 76, 174420 (2007).
- Hikihara et al. (2008) T. Hikihara, L. Kecke, T. Momoi, and A. Furusaki, Phys. Rev. B 78, 144404 (2008).
- Sudan et al. (2009) J. Sudan, A. Lüscher, and A. M. Läuchli, Phys. Rev. B 80, 140402(R) (2009).
- Zhitomirsky and Tsunetsugu (2010) M. E. Zhitomirsky and H. Tsunetsugu, EPL (Europhysics Letters) 92, 37001 (2010).
- Batyev and Braginski (1984) E. G. Batyev and L. S. Braginski, Sov. Phys. JETP 60, 781 (1984).
- Heidrich-Meisner et al. (2009) F. Heidrich-Meisner, I. P. McCulloch, and A. K. Kolezhuk, Phys. Rev. B 80, 144417 (2009).
- Sato et al. (2013) M. Sato, T. Hikihara, and T. Momoi, Phys. Rev. Lett. 110, 077206 (2013).
- Nishimoto et al. (2015) S. Nishimoto, S.-L. Drechsler, R. Kuzian, J. Richter, and J. van den Brink, Phys. Rev. B 92, 214415 (2015).
- Kolezhuk and Vekua (2005) A. Kolezhuk and T. Vekua, Phys. Rev. B 72, 094424 (2005).
- Svistov et al. (2011) L. E. Svistov, T. Fujita, H. Yamaguchi, S. Kimura, K. Omura, A. Prokofiev, A. I. Smirnov, Z. Honda, and M. Hagiwara, JETP Lett. 93, 21 (2011).
- Masuda et al. (2011) T. Masuda, M. Hagihala, Y. Kondoh, K. Kaneko, and N. Metoki, J. Phys. Soc. Jpn. 80, 113705 (2011).
- Mourigal et al. (2012) M. Mourigal, M. Enderle, B. Fåk, R. K. Kremer, J. M. Law, A. Schneidewind, A. Hiess, and A. Prokofiev, Phys. Rev. Lett. 109, 027203 (2012).
- Nawa et al. (2013) K. Nawa, M. Takigawa, M. Yoshida, and K. Yoshimura, J. Phys. Soc. Jpn. 82, 094709 (2013).
- Büttgen et al. (2014) N. Büttgen, K. Nawa, T. Fujita, M. Hagiwara, P. Kuhns, A. Prokofiev, A. P. Reyes, L. E. Svistov, K. Yoshimura, and M. Takigawa, Phys. Rev. B 90, 134401 (2014).
- Orlova et al. (2017) A. Orlova, E. L. Green, J. M. Law, D. I. Gorbunov, G. Chanda, S. Krämer, M. Horvatić, R. K. Kremer, J. Wosnitza, and G. L. J. A. Rikken, Phys. Rev. Lett. 118, 247201 (2017).
- Gen et al. (2019) M. Gen, T. Nomura, D. I. Gorbunov, S. Yasin, P. T. Cong, C. Dong, Y. Kohama, E. L. Green, J. M. Law, M. S. Henriques, J. Wosnitza, A. A. Zvyagin, V. O. Cheranovskii, R. K. Kremer, and S. Zherlitsyn, Phys. Rev. Research 1, 033065 (2019).
- Willenberg et al. (2012) B. Willenberg, M. Schäpers, K. C. Rule, S. Süllow, M. Reehuis, H. Ryll, B. Klemke, K. Kiefer, W. Schottenhamel, B. Büchner, B. Ouladdiaf, M. Uhlarz, R. Beyer, J. Wosnitza, and A. U. B. Wolter, Phys. Rev. Lett. 108, 117202 (2012).
- Schäpers et al. (2013) M. Schäpers, A. U. B. Wolter, S.-L. Drechsler, S. Nishimoto, K.-H. Müller, M. Abdel-Hafiez, W. Schottenhamel, B. Büchner, J. Richter, B. Ouladdiaf, M. Uhlarz, R. Beyer, Y. Skourski, J. Wosnitza, K. C. Rule, H. Ryll, B. Klemke, K. Kiefer, M. Reehuis, B. Willenberg, and S. Süllow, Phys. Rev. B 88, 184410 (2013).
- Willenberg et al. (2016) B. Willenberg, M. Schäpers, A. U. B. Wolter, S.-L. Drechsler, M. Reehuis, J.-U. Hoffmann, B. Büchner, A. J. Studer, K. C. Rule, B. Ouladdiaf, S. Süllow, and S. Nishimoto, Phys. Rev. Lett. 116, 047202 (2016).
- Feng et al. (2018) Y. Feng, K. Y. Povarov, and A. Zheludev, Phys. Rev. B 98, 054419 (2018).
- Heinze et al. (2019) L. Heinze, G. Bastien, B. Ryll, J.-U. Hoffmann, M. Reehuis, B. Ouladdiaf, F. Bert, E. Kermarrec, P. Mendels, S. Nishimoto, S.-L. Drechsler, U. K. Rößler, H. Rosner, B. Büchner, A. J. Studer, K. C. Rule, S. Süllow, and A. U. B. Wolter, Phys. Rev. B 99, 094436 (2019).
- Nawa et al. (2014) K. Nawa, Y. Okamoto, A. Matsuo, K. Kindo, Y. Kitahara, S. Yoshida, S. Ikeda, S. Hara, T. Sakurai, S. Okubo, H. Ohta, and Z. Hiroi, J. Phys. Soc. Jpn. 83, 103702 (2014).
- Nawa et al. (2017) K. Nawa, M. Yoshida, M. Takigawa, Y. Okamoto, and Z. Hiroi, Phys. Rev. B 96, 174433 (2017).
- Asai et al. (2020) S. Asai, T. Oyama, K. Nawa, A. Nakao, K. Munakata, K. Kuwahara, M. Hagihala, S. Itoh, Z. Hiroi, and T. Masuda, Phys. Rev. B 101, 144437 (2020).
- Pregelj et al. (2015) M. Pregelj, A. Zorko, O. Zaharko, H. Nojiri, H. Berger, L. C. Chapon, and D. Arčon, Nat. Comm. 6, 7255 (2015).
- Weickert et al. (2016) F. Weickert, N. Harrison, B. L. Scott, M. Jaime, A. Leitmäe, I. Heinmaa, R. Stern, O. Janson, H. Berger, H. Rosner, and A. A. Tsirlin, Phys. Rev. B 94, 064403 (2016).
- Pregelj et al. (2019) M. Pregelj, A. Zorko, M. Klanjšek, O. Zaharko, J. S. White, O. Prokhnenko, M. Bartkowiak, H. Nojiri, H. Berger, and D. Arčon, Phys. Rev. B 100, 094433 (2019).
- Solodovnikov and Solodovnikova (1997) S. F. Solodovnikov and Z. A. Solodovnikova, J. Struct. Chem. 38, 765 (1997).
- Hase et al. (2005) M. Hase, K. Ozawa, O. Suzuki, H. Kitazawa, G. Kido, H. Kuroe, and T. Sekine, J. Appl. Phys. 97, 10B303 (2005).
- Fujimura et al. (2016) A. Fujimura, Y. Yasui, Y. Yanagisawa, I. Terasaki, Y. Kono, S. Kittaka, and T. Sakakibara, IEEE Transactions on Magnetics 52, 1 (2016).
- Hamasaki et al. (2007) T. Hamasaki, H. Kuroe, T. Sekine, T. Naka, M. Hase, N. Maeshima, Y. Saiga, and Y. Uwatoko, Journal of Magnetism and Magnetic Materials 310, e394 (2007).
- Hoshino et al. (2014) Y. Hoshino, S. Atarashi, T. Goto, M. Hase, and T. Sasaki, JPS Conf. Proc. 3, 014012 (2014).
- Goto et al. (2017) T. Goto, A. Yagi, K. Matsui, I. Watanabe, T. Sasaki, and M. Hase, J. Phys.: Conf. Ser. 828, 012017 (2017).
- Yagi et al. (2018) A. Yagi, K. Matsui, T. Goto, M. Hase, and T. Sasaki, J. Phys.: Conf. Ser. 969, 012125 (2018).
- Matsui et al. (2018) K. Matsui, T. Goto, J. Angel, I. Watanabe, T. Sasaki, and M. Hase, JPS Conf. Proc. 21, 011008 (2018).
- Hayashida et al. (2019) S. Hayashida, D. Blosser, K. Y. Povarov, Z. Yan, S. Gvasaliya, A. N. Ponomaryov, S. A. Zvyagin, and A. Zheludev, Phys. Rev. B 100, 134427 (2019).
- Blosser et al. (2020) D. Blosser, L. Facheris, and A. Zheludev, arXiv:2002.10168 [cond-mat.mtrl-sci] (2020).
- Korepin and Slavnov (1990) V. E. Korepin and N. A. Slavnov, Commun. Math. Phys. 129, 103 (1990).
- Sachdev et al. (1994) S. Sachdev, T. Senthil, and R. Shankar, Phys. Rev. B 50, 258 (1994).
- Rüegg et al. (2008) C. Rüegg, K. Kiefer, B. Thielemann, D. F. McMorrow, V. Zapf, B. Normand, M. B. Zvonarev, P. Bouillot, C. Kollath, T. Giamarchi, S. Capponi, D. Poilblanc, D. Biner, and K. W. Krämer, Phys. Rev. Lett. 101, 247202 (2008).
- Breunig et al. (2017) O. Breunig, M. Garst, A. Klümper, J. Rohrkamp, M. M. Turnbull, and T. Lorenz, Science Advances 3, eaao3773 (2017).
- Blosser et al. (2018) D. Blosser, V. K. Bhartiya, D. J. Voneshen, and A. Zheludev, Phys. Rev. Lett. 121, 247201 (2018).
- Bonner and Fisher (1964) J. C. Bonner and M. E. Fisher, Phys. Rev. 135, A640 (1964).