Chat activity is a better predictor than chat sentiment on software developers productivity
Abstract.
Recent works have proposed that software developers’ positive emotion has a positive impact on software developers’ productivity. In this paper we investigate two data sources: developers chat messages (from Slack and Hipchat) and source code commits of a single co-located Agile team over 200 working days. Our regression analysis shows that the number of chat messages is the best predictor and predicts productivity measured both in the number of commits and lines of code with of 0.33 and 0.27 respectively. We then add sentiment analysis variables until AIC of our model no longer improves and gets values of 0.37 (commits) and 0.30 (lines of code). Thus, analyzing chat sentiment improves productivity prediction over chat activity alone but the difference is not massive. This work supports the idea that emotional state and productivity are linked in software development. We find that three positive sentiment metrics, but surprisingly also one negative sentiment metric is associated with higher productivity.
1. Introduction
In recent times, there has been an increasing interest towards affect of software developers, and calls for studies in the field of behavioural software engineering (Lenberg et al., 2015), and psychoempirical software engineering (Graziotin et al., 2015). Particularly, previous studies have examined happiness and unhappiness of software developers in relation to their productivity and problem solving skills (Graziotin et al., 2014; Graziotin et al., 2017). These studied have found that in general positive emotional state are associated with higher productivity in software engineering.
While a lot of work related to sentiment analysis in software engineering has focused on data available software repositories, such as issue trackers and Q&A websites, sentiment analysis of instant or chat messaging between software developers is scarce. This is surprising as chat due to its interactive and non-documentary purpose seems like the likeliest candidate to contain expressions of sentiment and emotion. Tools related to chat and instant messaging for software developers are also commonly mentioned studies related to global software development (gsd) and distributed development tools and processes (Lanubile et al., 2010; Portillo-Rodríguez et al., 2012). Yet, papers focusing on chat usage are scarce.
Some previous work of chat usage in software engineering exists but for different purposes than productivity and sentiment analysis. Alkadhi et al. (Alkadhi et al., 2017) analyzed chat messages for rationale, defined as messages containing discussions about issues, alternatives and argumentation leading to the decisions related to software development. In their study, only 9% of messages contained rationale, but they were able to filter out messages without rationale with precision and recall above 0.9. Chatterjee et al. (Chatterjee et al., 2019) have studied Q&A, ”Question and Answer”, communications in Slack chat environment. They demonstrate that that using repository mining and machine learning techniques, it is possible to extract these questions and answer conversations to produce conversations similar to those found in StackOverflow111https://stackoverflow.com/. Instant messaging of software developers over the IRC protocol (Oikarinen and Reed, 1993) have been studied by Shibab et al. (Shihab et al., 2009), observing how meetings are in open source software development projects and giving some insights on the contents discussions.
Metrics related to social interaction between software developers used in prediction models have been gathered in a mapping study by Wiese et al. (Wiese et al., 2014). One of the metrics identified from prior literature is the number of messages sent. In our prior work, we have linked number of chat messages sent to affective states and well-being (Kuutila et al., 2018).
In this paper, we look at the relationships between software developer commit activity, chat activity and the sentiments expressed in instant messaging systems in a single co-located team. More specifically, we predict the commit activity of individual developers using various measures of their chat activity and answer the following two research questions:
- RQ1:
-
How well can each chat activity metric predict developer productivity?
- RQ2:
-
How well can multiple chat activity metrics predict developer productivity?
2. Methodology
Data extraction
For the purposes of this study, we were provided access to a single software project’s Git repository, and to a JSON dump of the chat room used by developers from a local Finnish company. All of the developers working on the project are paid, and usually worked in the same location during office hours. The specific tool used for communication changed during our study from Hipchat222http://www.businessinsider.com/atlassian-launches-hipchat-successor-stride-2017-9 to Slack333https://slack.com/. The observed period is around eight months, and contains 200 working days, 7976 commits, over a million code lines changed and 30704 chat messages sent from eight different developers. We used data only from working days, from Monday to Friday.
Commit activity metrics
For the purposes of this study, we extracted the list of commits from the Git repository using Perceval (Dueñas et al., 2018). For each chat participant we computed the number of commits made (ncommits) and the number of lines of code modified (nloc). These are widely used as proxy measures for productivity in prior literature (Mockus et al., 2002; Boehm et al., 1981). The developers were instructed to commit small commits often by the project managers, and thus had multiple commits per day. This is why we decided to include commits in the analysis.
Sentiment analysis of chat messages
Because the chat messages used in the analyzed project are written in Finnish, we only had access to elementary sentiment analysis techniques. We translated lexicons used in software engineering context for measuring arousal (Mäntylä et al., 2017) and valence to Finnish. The valence lexicon has been constructed in the same way as the arousal lexicon. Chat logs were lemmatized using the open source software Voikko (Pitkänen, 2012), and then scored on valence and arousal using the translated lexicons. For this study, we centered the values of valence and arousal to 0, hence low valence and arousal scores are shown in values under 0 and high valence and arousal in scores over 0. We use this information in variables sent low valence %, sent high valence %, sent low arousal % and sent high arousal %. Hence, variable sent low valence % contains the percentage of messages containing at least one word with a valence score below 0 and the variable sent high valence % the percentage of messages containing at least one word with a valence score above 0. The same holds true for variables sent low arousal % and sent high arousal %. Similarly, we also computed the maximum and minimum arousal and valence scores for each day for each developer, and these are found in the variables sent minimum valence, sent maximum valence, sent minimum arousal and sent maximum arousal. During a day in which only high valence or arousal words were used, the minimum would be a positive number.
Emoticons and emojis in chat messages
We extracted emoticons and emojis that were used in the chat messages. Emoticons are textual representations of human emotion using only keyboard characters such as letters, number or punctuation marks. Emojis refer to ”picture characters” or pictographs (Miller et al., 2016). Similar to some of the authors’ previous work (Claes et al., 2018), we manually classified the emoticons to the basic emotions of Plutchik’s wheel of emotions (Plutchik, 1991): joy, sadness, surprise, confusion and anger. From these, we calculated the percentage of messages containing emoticons (and emojis), the percentage of messages containing emoticons and emojis related to joy and the percentage of messages containing emoticons and emojis related to surprise, sadness, or confusion. Due to the low number of emoticons and emojis for the latter group of emotions, we combined them in one variable named sadconfusionsurprise. We provide the translated lexicons, the list of emoticons used and their classification in a GitHub repository444https://github.com/M3SOulu/semotion2020.
Prediction models
We answer RQ1 by building different regression models using R555https://www.rdocumentation.org/packages/stats/versions/3.6.2/topics/glm. Each model uses as predictors a single chat metrics and a weekday variable as dummies to control for possible weekly seasonality. We evaluate them using .
For RQ2, we build a multivariate regression model iteratively using a step-up approach (Yamashita et al., 2007) evaluated using Akaike Information Criterion (AIC) (Akaike, 1998). Starting from the model with the dummy weekly control variables, we add chat variables as predictors by selecting the one that produces the lowest AIC when added to the model. The iterative process stops once the AIC does not decrease.
3. Results
| ncommitslog | nloclog | ||
|---|---|---|---|
| 1 | nchatlog | (+)0.330 | (+)0.268 |
| 2 | emoticon % | (+)0.038 | (+)0.036 |
| 3 | emot joy % | (+)0.117 | (+)0.098 |
| 4 | emot sadconfusionsurprise % | (+)0.092 | (+)0.062 |
| 5 | sent high valence % | (+)0.034 | (+)0.039 |
| 6 | sent low valence % | (+)0.043 | (+)0.042 |
| 7 | sent min valence | (-)0.147 | (-)0.108 |
| 8 | sent max valence | (+)0.127 | (+)0.103 |
| 9 | sent high arousal % | (+)0.100 | (+)0.100 |
| 10 | sent low arousal % | (+)0.143 | (+)0.130 |
| 11 | sent minimum arousal | (-)0.196 | (-)0.158 |
| 12 | sent maximum arousal | (+)0.175 | (+)0.146 |
| Added variable | AIC | p-value | |
|---|---|---|---|
| weekdays | 5030.2 | 0.003 | - |
| nchatlog | 4396 | 0.330 | ¡ 2e-16 |
| emot sadconfusionsurprise % | 4353.5 | 0.348 | 2.88e-11 |
| sent max valence | 4328.1 | 0.360 | 1.75e-07 |
| sent low arousal % | 4315.5 | 0.365 | 0.000138 |
| sent high valence % | 4312.2 | 0.367 | 0.022 |
| emot joy % | 4310.5 | 0.369 | 0.054 |
| Added variable | AIC | p-value | |
|---|---|---|---|
| weekdays | 8339.8 | 0.001 | |
| nchatlog | 7843.7 | 0.268 | ¡ 2e-16 |
| sent max valence | 7822.8 | 0.279 | 1.83e-06 |
| sent high valence % | 7801.7 | 0.289 | 1.60e-06 |
| emot sadconfusionsurprise % | 7785.9 | 0.297 | 2.60e-05 |
| sent low arousal % | 7778.4 | 0.301 | 0.002 |
| emot joy % | 7778.1 | 0.302 | 0.133 |
RQ1 - How well can each chat activity metric predict developer productivity?
Table 1 shows values for models predicting productivity measures, number of commits and number of lines of code changed. All models are controlled for weekly seasonality by introducing binary weekday variables to the regression equation. In both cases, the highest values are achieved by number of chat messages sent. Other predictors achieving an for prediction of number of commits of over 0.1 are the percentage of joy emoticons, minimum and maximum valence, as well as all variables related to arousal scores. For the prediction of number of lines of code, the other predictors achieving an of over 0.1 are minimum and maximum valence, as well as all variables related to arousal
RQ2 - How well can multiple chat activity metrics predict developer productivity?
. Table 2 shows the a multivariate model predicting number of commits with variables related to chat activity and sentiment. After number of chat messages, the next predictor added to the model was the percentage of emoticons related to sadness, confusion and surprise present in messages. Variables added after that are maximum valence, percentage of low arousal words, percentage of high valence words, and the last one variable to lower the AIC-value is the percentage of joy emoticons.
Table 3 shows the a multivariate model predicting number of lines of code changed with variables related to chat activity and sentiment. The model produced is very similar to the one predicting commits, they both hold the same variables but in slightly different order.
To summarize three positive emotion metrics (sent max valence, sent high valence %, emot joy%) are associated with increased productivity. However, a negative emotion metric (emot sadconfusionsurprise %) is also associated with increased productivity. Thus the former results support the idea that positive emotion is associated with higher productivity. The latter result adds the element that also negative emotion can be associated with more productivity. We could speculate that as long as there is emotion whether positive or negative then there is productivity. Finally, we were surprised to find that when a higher percentage of messages express low arousal then productivity is higher. Perhaps, low arousal messages express confidence that is associated with productivity, for instance, ”Relax I’ll fix it”.
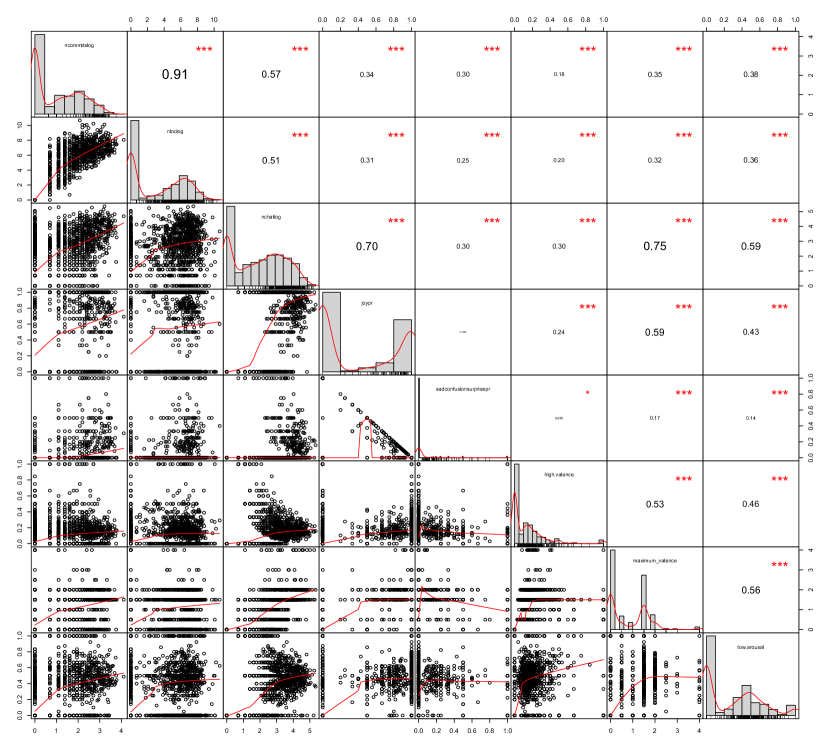
Lastly, we have gathered all variables presented in tables 2 and 3, to a correlation matrix, which also presents variable distribution and scatter plots. This is presented in Figure 1.
4. Conclusions
It can be said that the chatting activities of the developers has predictive power on their productivity. The best predictor of productivity was the number of chat messages sent. In line with previous work, three positive sentiment metrics were associated with higher productivity but to our surprise so was a single negative emotion metric.
After talking with the developers, it was noted that the chat was overwhelmingly used for discussing aspects related to the project being developed. A separate channel for discussions related to leisure existed, and it is not part of the data analysis efforts for this study. Hence, perhaps much of the developer’s activity level is shown in the number of messages sent.
Previous work on sentiment analysis in the software engineering context has noted the differing results based on the tools used to measure sentiment (Jongeling et al., 2017). In our case, the usage of the Finnish language in the chat logs dictated the usage of lexicon matching and made the analysis more difficult. Thus, future works with more advanced sentiment analysis tools should be performed.
Acknowledgements.
This work has been supported by Academy of Finland grant 298020. The first author has been supported by Kaute-foundation.References
- (1)
- Akaike (1998) Hirotogu Akaike. 1998. Information theory and an extension of the maximum likelihood principle. In Selected papers of hirotugu akaike. Springer, 199–213.
- Alkadhi et al. (2017) Rana Alkadhi, Teodora Lata, Emitza Guzmany, and Bernd Bruegge. 2017. Rationale in development chat messages: an exploratory study. In 2017 IEEE/ACM 14th International Conference on Mining Software Repositories (MSR). IEEE, 436–446.
- Boehm et al. (1981) Barry W Boehm et al. 1981. Software engineering economics. Vol. 197. Prentice-hall Englewood Cliffs (NJ).
- Chatterjee et al. (2019) Preetha Chatterjee, Kostadin Damevski, Lori Pollock, Vinay Augustine, and Nicholas A Kraft. 2019. Exploratory study of slack Q&A chats as a mining source for software engineering tools. In 2019 IEEE/ACM 16th International Conference on Mining Software Repositories (MSR). IEEE, 490–501.
- Claes et al. (2018) Maëlick Claes, Mika Mäntylä, and Umar Farooq. 2018. On the use of emoticons in open source software development. In Proceedings of the 12th ACM/IEEE International Symposium on Empirical Software Engineering and Measurement. ACM, 50.
- Dueñas et al. (2018) Santiago Dueñas, Valerio Cosentino, Gregorio Robles, and Jesus M Gonzalez-Barahona. 2018. Perceval: Software project data at your will. In Proceedings of the 40th International Conference on Software Engineering: Companion Proceeedings. ACM, 1–4.
- Graziotin et al. (2017) Daniel Graziotin, Fabian Fagerholm, Xiaofeng Wang, and Pekka Abrahamsson. 2017. Unhappy developers: Bad for themselves, bad for process, and bad for software product. In 2017 IEEE/ACM 39th International Conference on Software Engineering Companion (ICSE-C). IEEE, 362–364.
- Graziotin et al. (2014) Daniel Graziotin, Xiaofeng Wang, and Pekka Abrahamsson. 2014. Happy software developers solve problems better: psychological measurements in empirical software engineering. PeerJ 2 (2014), e289.
- Graziotin et al. (2015) Daniel Graziotin, Xiaofeng Wang, and Pekka Abrahamsson. 2015. Understanding the affect of developers: theoretical background and guidelines for psychoempirical software engineering. In Proceedings of the 7th International Workshop on Social Software Engineering. 25–32.
- Jongeling et al. (2017) Robbert Jongeling, Proshanta Sarkar, Subhajit Datta, and Alexander Serebrenik. 2017. On negative results when using sentiment analysis tools for software engineering research. Empirical Software Engineering 22, 5 (2017), 2543–2584.
- Kuutila et al. (2018) Miikka Kuutila, Mika V Mäntylä, Maëlick Claes, Marko Elovainio, and Bram Adams. 2018. Using experience sampling to link software repositories with emotions and work well-being. In Proceedings of the 12th ACM/IEEE International Symposium on Empirical Software Engineering and Measurement. 1–10.
- Lanubile et al. (2010) Filippo Lanubile, Christof Ebert, Rafael Prikladnicki, and Aurora Vizcaíno. 2010. Collaboration tools for global software engineering. IEEE software 27, 2 (2010), 52–55.
- Lenberg et al. (2015) Per Lenberg, Robert Feldt, and Lars Göran Wallgren. 2015. Behavioral software engineering: A definition and systematic literature review. Journal of Systems and software 107 (2015), 15–37.
- Mäntylä et al. (2017) Mika V Mäntylä, Nicole Novielli, Filippo Lanubile, Maëlick Claes, and Miikka Kuutila. 2017. Bootstrapping a lexicon for emotional arousal in software engineering. In 2017 IEEE/ACM 14th International Conference on Mining Software Repositories (MSR). IEEE, 198–202.
- Miller et al. (2016) Hannah Jean Miller, Jacob Thebault-Spieker, Shuo Chang, Isaac Johnson, Loren Terveen, and Brent Hecht. 2016. “Blissfully Happy” or “Ready toFight”: Varying Interpretations of Emoji. In Tenth International AAAI Conference on Web and Social Media.
- Mockus et al. (2002) Audris Mockus, Roy T Fielding, and James D Herbsleb. 2002. Two case studies of open source software development: Apache and Mozilla. ACM Transactions on Software Engineering and Methodology (TOSEM) 11, 3 (2002), 309–346.
- Oikarinen and Reed (1993) Jarkko Oikarinen and Darren Reed. 1993. Internet relay chat protocol. (1993).
- Pitkänen (2012) Harri Pitkänen. 2012. Voikko - Free linquistic software and data for Finnish. https://voikko.puimula.org/
- Plutchik (1991) Robert Plutchik. 1991. The emotions. University Press of America.
- Portillo-Rodríguez et al. (2012) Javier Portillo-Rodríguez, Aurora Vizcaíno, Mario Piattini, and Sarah Beecham. 2012. Tools used in Global Software Engineering: A systematic mapping review. Information and Software Technology 54, 7 (2012), 663–685.
- Shihab et al. (2009) Emad Shihab, Zhen Ming Jiang, and Ahmed E Hassan. 2009. Studying the use of developer IRC meetings in open source projects. In 2009 IEEE International Conference on Software Maintenance. IEEE, 147–156.
- Wiese et al. (2014) Igor Scaliante Wiese, Filipe Roseiro Côgo, Reginaldo Ré, Igor Steinmacher, and Marco Aurélio Gerosa. 2014. Social metrics included in prediction models on software engineering: a mapping study. In Proceedings of the 10th International Conference on Predictive Models in Software Engineering. 72–81.
- Yamashita et al. (2007) Toshie Yamashita, Keizo Yamashita, and Ryotaro Kamimura. 2007. A stepwise AIC method for variable selection in linear regression. Communications in Statistics—Theory and Methods 36, 13 (2007), 2395–2403.