Non-linear interlinkages and key objectives amongst the Paris Agreement and the Sustainable Development Goals
Abstract
The United Nations’ ambitions to combat climate change and prosper human development are manifested in the Paris Agreement and the Sustainable Development Goals (SDGs), respectively. These are inherently inter-linked as progress towards some of these objectives may accelerate or hinder progress towards others. We investigate how these two agendas influence each other by defining networks of 18 nodes, consisting of the 17 SDGs and climate change, for various groupings of countries. We compute a non-linear measure of conditional dependence, the partial distance correlation, given any subset of the remaining 16 variables. These correlations are treated as weights on edges, and weighted eigenvector centralities are calculated to determine the most important nodes.
We find that SDG 6, clean water and sanitation, and SDG 4, quality education, are most central across nearly all groupings of countries. In developing regions, SDG 17, partnerships for the goals, is strongly connected to the progress of other objectives in the two agendas whilst, somewhat surprisingly, SDG 8, decent work and economic growth, is not as important in terms of eigenvector centrality.
1 Inter-linked human and natural worlds
The state-of-the-art in sustainability is described by two United Nations (UN) landmark agendas, the Paris Agreement (UN, 2015a) and the Sustainable Development Goals (SDGs) (UN, 2015b). Whilst the former focuses on preventing a global climate crisis with far reaching consequences by limiting global warming to 1.5 to 2°C above pre-industrial levels, the purpose of the latter is to end poverty, protect the planet and ensure that all people enjoy peace and prosperity by 2030. Any action for the progress on either agenda often has an influence on the other (UN Climate Change, 2019), reflecting the complexity of the human and natural worlds.
This inter-linked nature gives rise to opportunities for the creation of synergistic interventions: civil, corporate and institutional actions can efficiently create impact across both agendas, thereby improving the world profoundly. On the other hand, this inter-linked construct can also be subject to trade-offs between objectives, i.e., progress towards one agenda constrains progress towards the other. In this work, we aim to discover how climate change, as measured by local temperature rises, and the 17 SDGs are inter-linked by learning the structure of undirected graphs over these variables from their (conditional) dependencies.
Adding climate change as an \nth18 variable is motivated by the observation that temperature rises (or any other direct metrics of climate change) are not actually tracked within SDG 13 (climate action). Indicators of SDG 13 only track inputs (such as investment), means (such as plans and strategies), and impacts (number of people affected by disasters), but they do not account for outputs, such as changes in temperature or green house gas emissions.111Only recently (and after performing the present analysis) have ”total greenhouse gas emissions” been added as an output-quantifying indicator (13.2.2).
We use distance correlation (Székely et al., 2007) as a measure of non-linear dependence between variables of possibly varying dimensions. To account for possible interactions, each pair of variables is conditioned on any subset of the remaining variables, and the minimum resulting distance correlation is taken as the weight on an edge between these two variables. Subsequently, the weighted eigenvector centrality of every node is calculated to measure its importance within the network.
In summary, the contributions of this paper include: first, the application of a non-linear measure of (conditional) dependence to SDG data, thereby relaxing the linearity assumption on the nature of interlinkages between the SDGs, compared to the work of Lusseau & Mancini (2019); and secondly, the use of eigenvector centrality as a relative measure which also takes the importance of a node’s neighbours into account, as opposed to simple degree centrality as used by McGowan et al. (2019).
2 Methodology
We use data provided by the World Bank (2020b) and the UN (2020) in form of time-series for various indicators, which measure progress towards their associated SDGs, in conjunction with temperature recordings (World Bank, 2020a).222For detailed descriptions of indicators, see https://sustainabledevelopment.un.org/sdgs In total, these three sources provide 379 time-series, which are available on a country-level with annual measurements from 2000 to 2016333We impute missing values (especially for the time 2000-2005) using a weighted average across countries (where data is available) with weights inversely proportional to the Euclidean distance between indicators.. Apart from measurements for the 17 SDGs, we introduce climate change as an additional variable which we define by annual average temperature per country. We consider these 18 variables as the set of nodes of an undirected graph . We learn the graph structure by computing partial distance covariances (Székely et al., 2014) between any pair of nodes, given any subset of the remaining 16 nodes. This yields a sparsely-connected undirected graph with weighted edges capturing non-linear dependencies between variables. Using these weights, we compute weighted eigenvector centralities (Newman, 2018, p.159; Appendix A.2) to find the most important nodes. Code to reproduce our findings and visualisations of networks may be found online at https://github.com/felix-laumann/SDG-dataset.
2.1 Distance covariance
Let and be two random vectors with finite first moments, i.e., . The distance covariance between and , denoted by , is a measure of dependence between and with the following important properties: (i) , with equality if and only if and are independent, i.e., it is a non-parametric measure that—unlike, e.g., standard correlation—is able to pick up complex non-linear dependencies; (ii) , i.e., it is symmetric; and (iii) unlike many other dependence measures is well-defined even for . This last point makes it particularly useful for our setting where, due to the different numbers of indicators per SDG, dimensionality varies considerably between variables.
Formally, the distance covariance between and is defined as
| (1) |
where , and where the characteristic function of a random variable is denoted as with .
The corresponding distance correlation is the normalised distance covariance, computed by
| (2) |
Properties of include: (i) ; and (ii) if and only if there exists a vector , a non-zero real number , and an orthogonal matrix such that .
2.2 Partial distance covariance
As we deal with graphs of 18 nodes, any pairwise covariance may occur through the remaining 16 nodes. Thus, we condition any pair of nodes on any subset of the remaining 16 nodes. The pairwise distances and the distance matrix for are computed equivalently to and for and as explained in Appendix A.1.1. For any number of samples from , we define a Hilbert space over distance matrices computed on these points, with inner products as defined in Appendix A.1.2 (Székely et al., 2014). With this, we can compute partial distance covariances for random vectors of varying dimensions as follows.
Let , and be elements of the Hilbert space corresponding to the distance matrices computed using the samples , , and , respectively. The projection of onto and the complementary orthogonal projection are defined by
| (3) |
respectively. The sample partial distance covariance is then defined as
| (4) |
Finally, we can normalise these covariances to arrive at the sample partial distance correlations
| (5) |
which serve as weights on edges between any two nodes.
3 Results
We apply this methodology to the data set of the aforementioned 379 indicators for various groupings of countries, for which countries are assumed to be independent samples. This assumption allows us to see the indicators’ non-stationary time-series as -dimensional probability distributions, where . Whilst we only describe the networks of a few groupings in this section, we would like to refer to Appendix B for results on all groupings.
| Global South | Global North | ||
|---|---|---|---|
| SDG 6 | 0.48 | SDG 6 | 0.43 |
| SDG 4 | 0.42 | SDG 4 | 0.40 |
| SDG 7 | 0.38 | SDG 9 | 0.33 |
| SDG 17 | 0.37 | SDG 3 | 0.32 |
| SDG 3 | 0.26 | SDG 17 | 0.29 |
| SDG 15 | 0.25 | SDG 7 | 0.27 |
| Western Asia | Northern Europe | ||
|---|---|---|---|
| SDG 6 | 0.48 | SDG 4 | 0.38 |
| SDG 4 | 0.36 | SDG 3 | 0.35 |
| SDG 17 | 0.34 | SDG 6 | 0.30 |
| SDG 3 | 0.33 | SDG 16 | 0.30 |
| SDG 16 | 0.32 | SDG 7 | 0.29 |
| SDG 7 | 0.26 | SDG 9 | 0.28 |
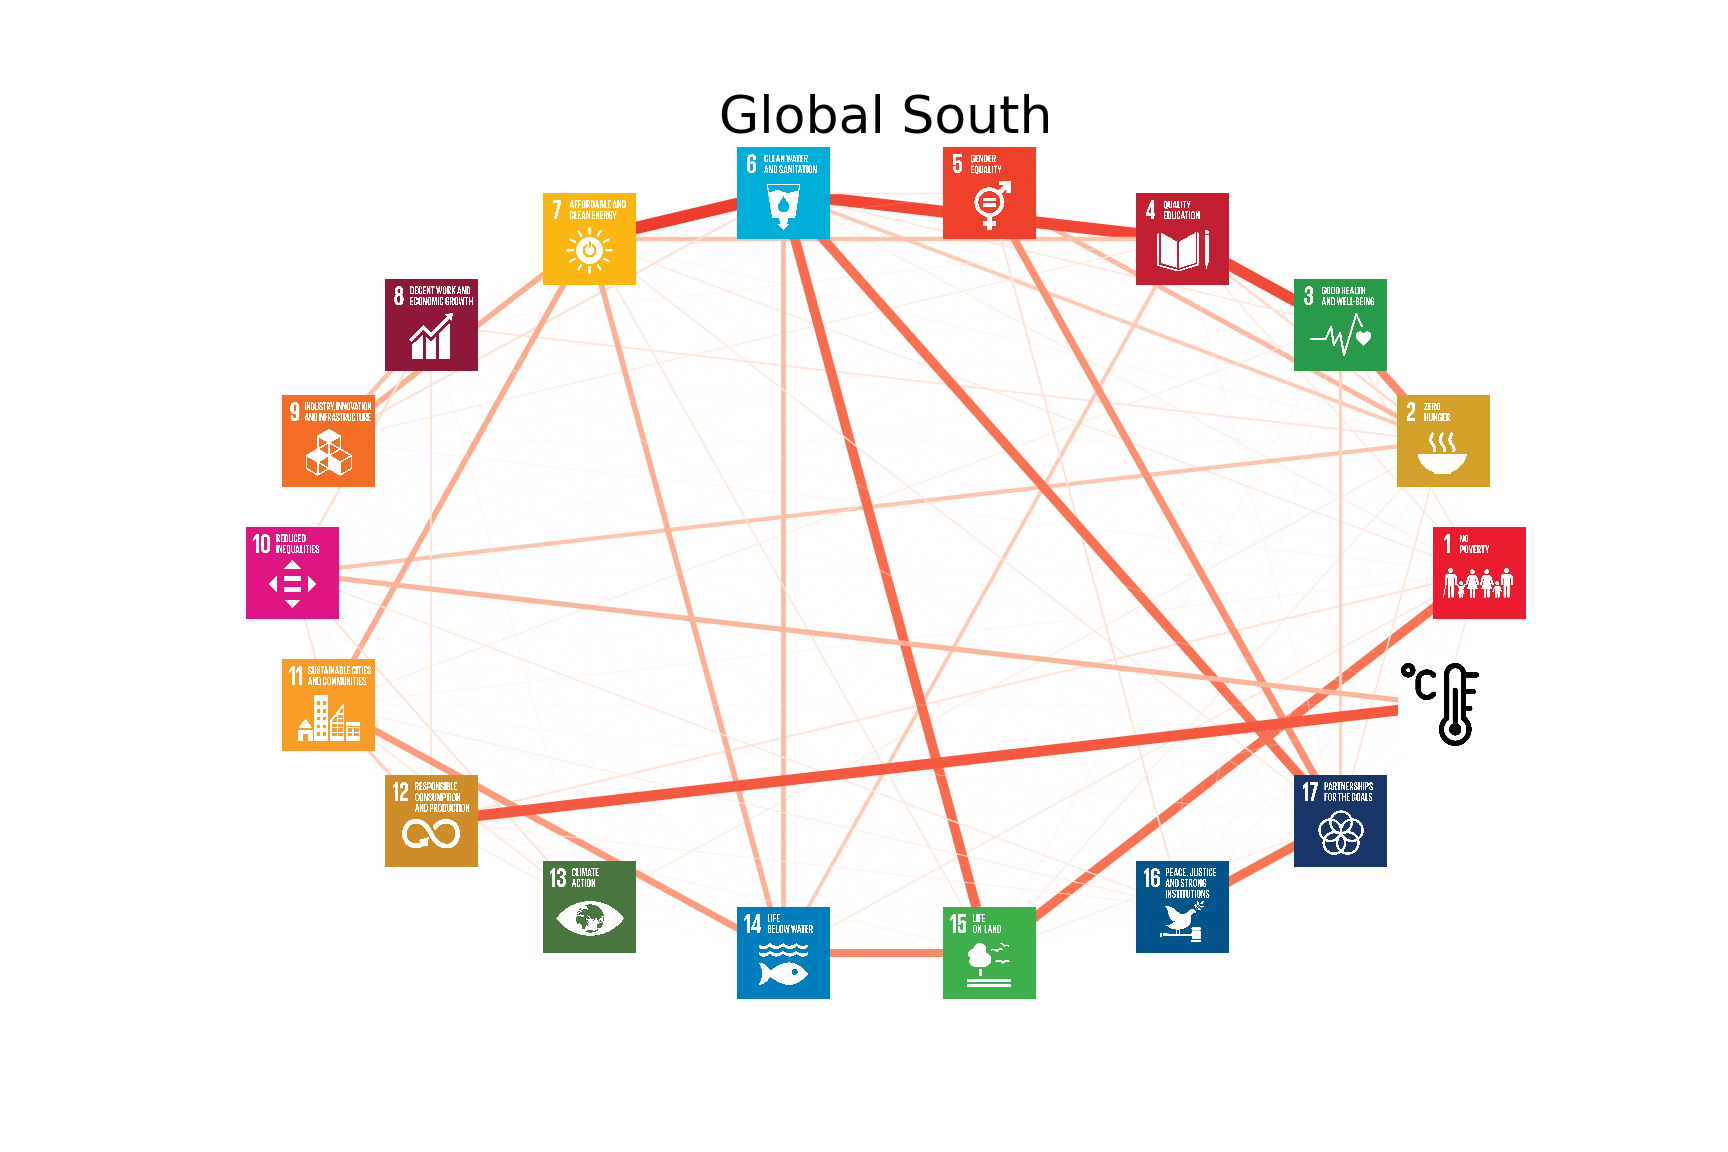
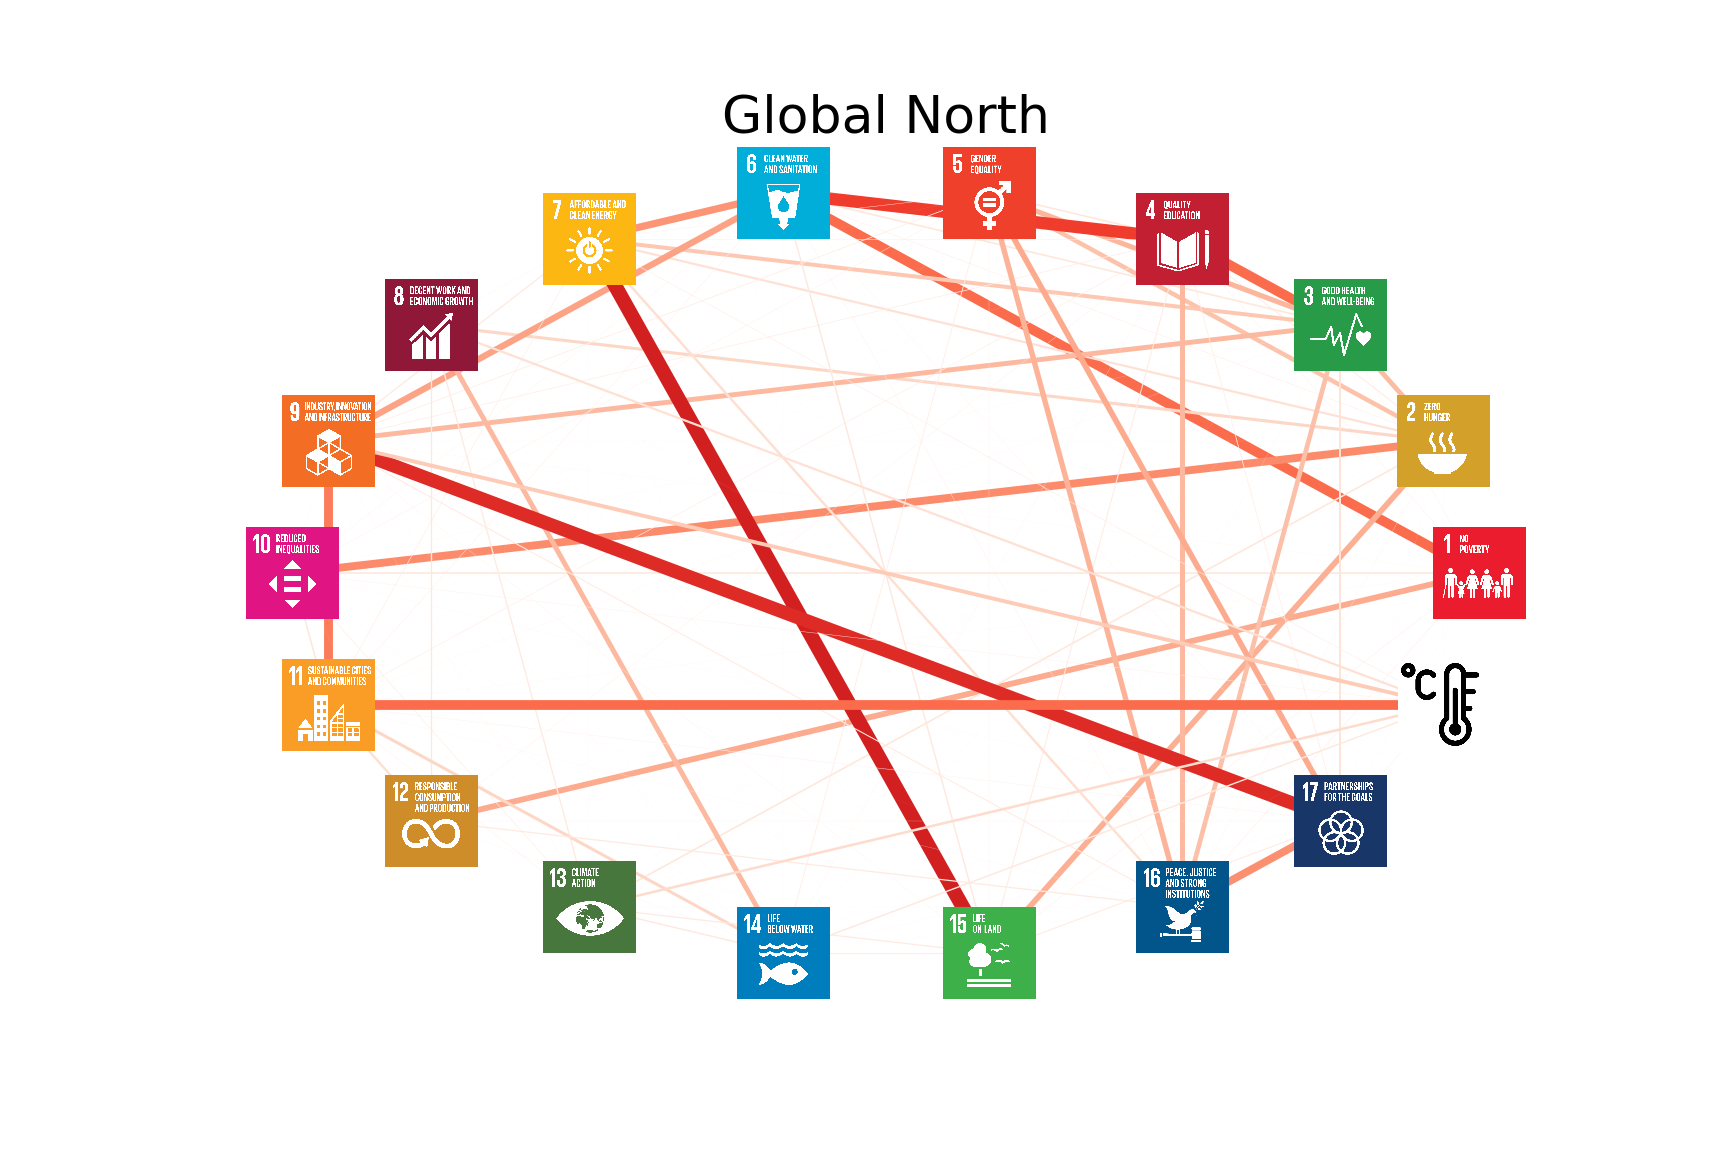
Firstly, we compare the Global South and the Global North (see Figure 1). The accompanied eigenvector centralities are shown in Table 1. In both groupings, SDG 6, clean water and sanitation, followed closely by SDG 4, quality education, are the most central objectives of the 18 variables. In the Global South, temperature rises are more strongly dependent on variables than in the Global North, which broadly aligns with King & Harrington (2018) who find that geographical areas in the Global South are more vulnerable to climate change than regions in the Global North. Further, SDG 1, no poverty, is strongly linked to SDG 14, life below water, in the Global South. This may be explained by the dependence of small island developing states (SIDS)—all of which lie in the Global South—on marine life to provide for their citizens’ living.
Contrarily, the Global North strongly depends on SDG 9, industry, innovation and infrastructure, to maintain its citizens’ high levels of living standards and to further progress towards other SDGs, as well as climate change mitigation and adaptation. Moreover, SDG 7, clean and affordable energy, is closely related to SDG 15, life on land, which could result from the increasing area of biodiverse land populated by wind turbines, solar panels, or water dams (e.g., Hernandez et al., 2015).
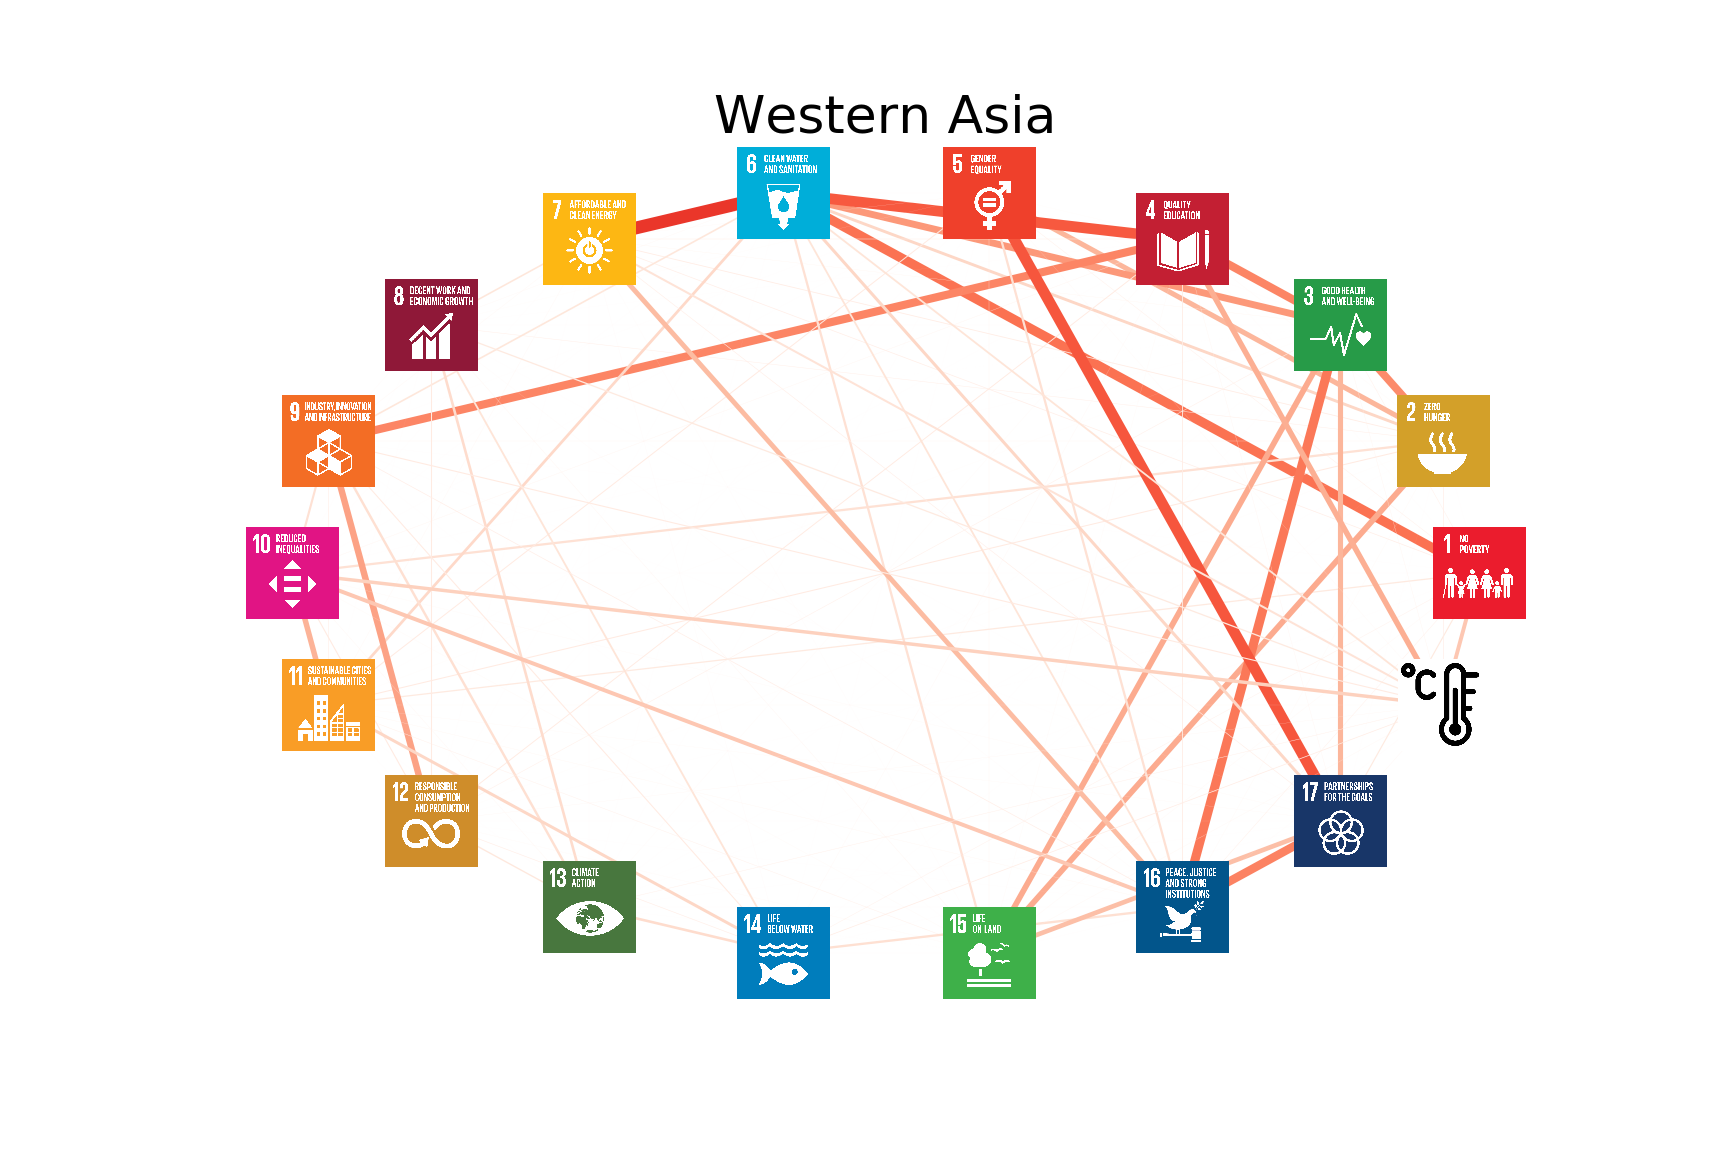
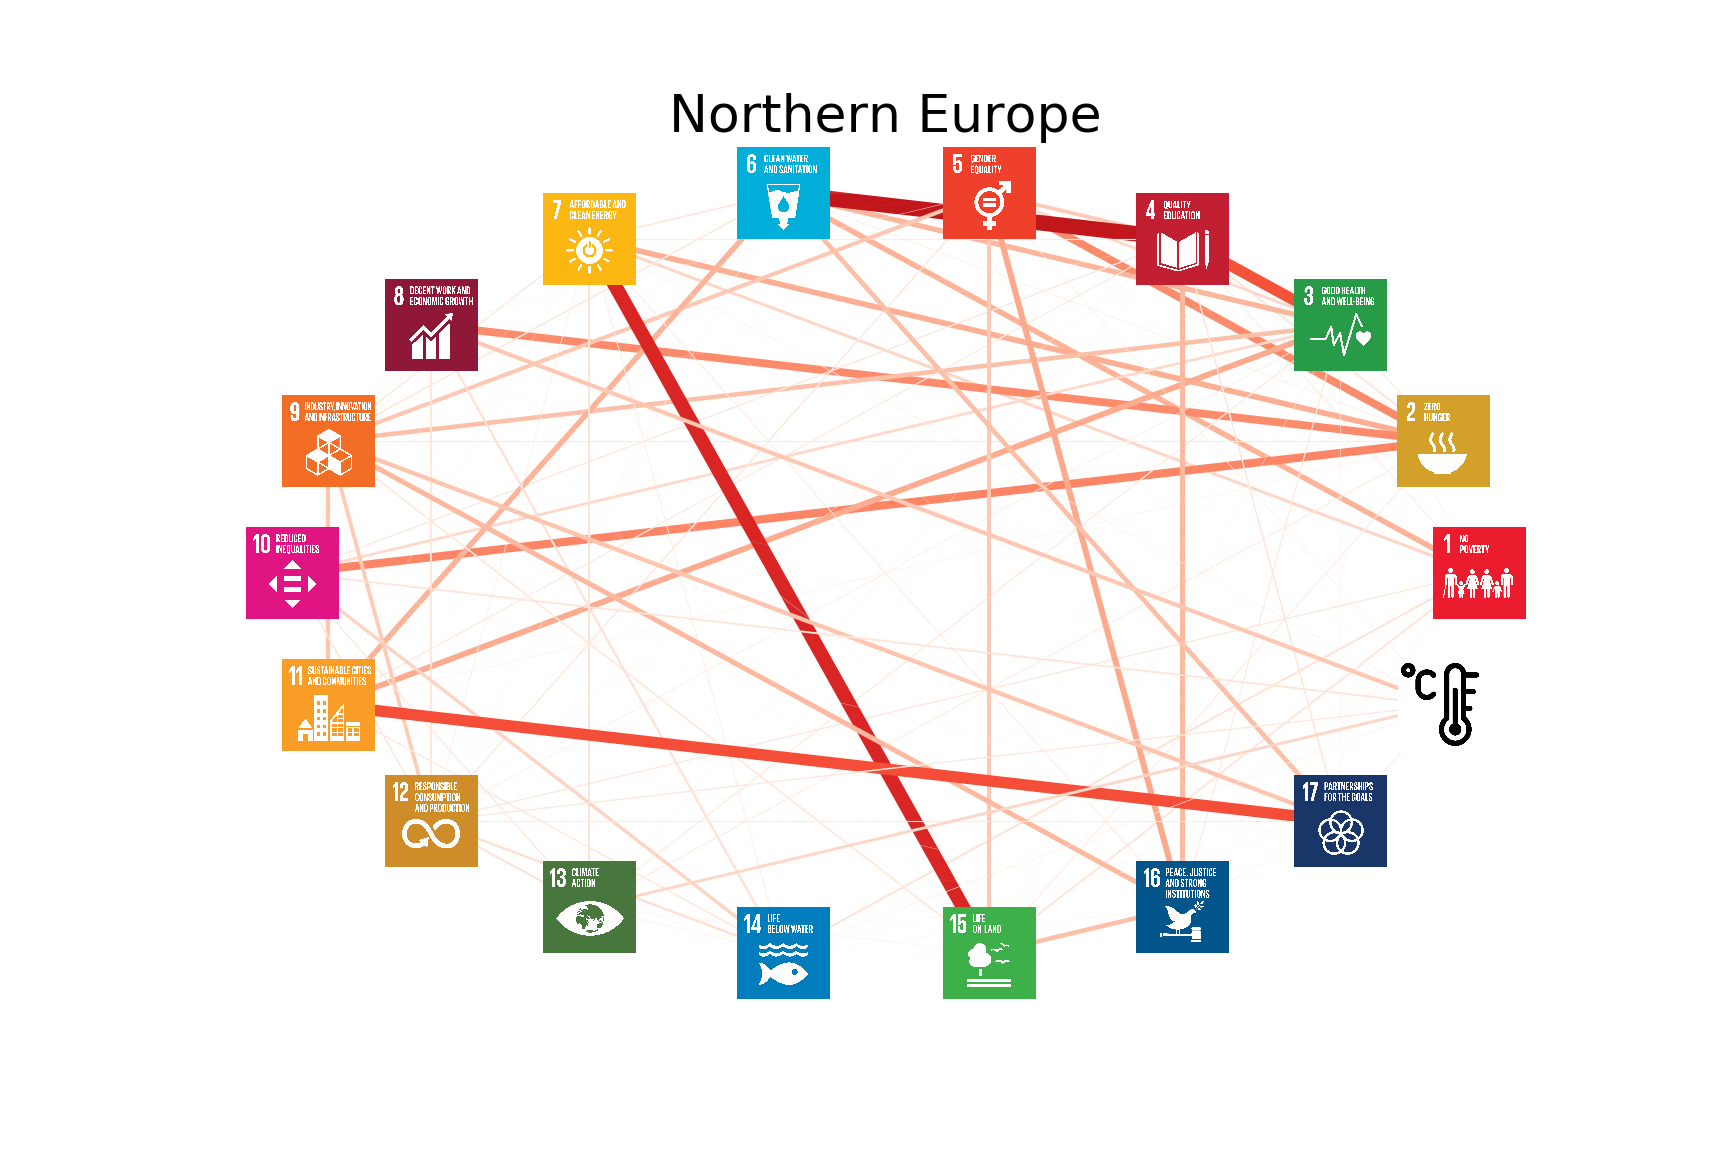
Next, we compare two geographical regions, Western Asia and Northern Europe, shown in Figure 2 with accompanied eigenvector centralities in Table 1. In Western Asia, SDG 6 together with SDG 4 are again the two most central nodes, but SDG 16, peace, justice and strong institutions, is also important, likely to be associated with the unstable political circumstances in this area during the period of recorded measurements. Additionally, SDG 5, gender equality, is strongly linked to SDG 17, partnerships for the goals, which coincides with the remarkably low percentage of women in managerial positions in Western Asia.444In Saudi Arabia, for example, only 5 to 9% of managerial positions were held by women from 2000 to 2015, whereas this number fluctuated between 32 and 36% in the United Kingdom in the same period (UN (2020), indicator 5.5.2)
In contrast, Northern Europe does not see a remarkable difference between the centralities of SDGs 6 and 4 to all others, but finds SDGs 4, 6, 3, and 17 with almost equivalently high centralities. As in the Global North, industry, innovation and infrastructure are of particular importance to progress towards the SDGs, and we fine that clean and affordable energy is closely linked to life on land.
We note, however, that most edges found in our network analysis are not statistically significant at , using the test of Székely et al. (2014). This is likely linked to the high dimensionality of the data and the short recording period. The present work is thus only a first step, and further analysis is needed to better understand non-linear interlinkages between the SDGs and climate change.
4 Conclusions
We report findings of our work in progress towards discovering dependencies amongst the Sustainable Development Goals (SDGs) and climate change. As a first step, we compute partial distance correlations between the 17 SDGs and climate change, as measured by indicators associated to the SDGs and annual average temperature, respectively. Using these measurements of non-linear dependence as edge weights in a network over these variables, we determine eigenvector centralities to unveil which variables are of particular importance, given the available data. Our results indicate that SDG 6, clean water and sanitation, together with SDG 4, quality education, are the most central nodes in nearly all continents and other groupings of countries. In contrast to many contemporary policies, our preliminary results suggest that economic growth, as measured by SDG 8, appears not to play as central of a role for sustainable development or mitigating climate change as other SDGs.
References
- Hernandez et al. (2015) Rebecca R Hernandez, Madison K Hoffacker, Michelle L Murphy-Mariscal, Grace C Wu, and Michael F Allen. Solar energy development impacts on land cover change and protected areas. Proceedings of the National Academy of Sciences, 112(44):13579–13584, 2015.
- King & Harrington (2018) Andrew D King and Luke J Harrington. The inequality of climate change from 1.5 to 2 c of global warming. Geophysical Research Letters, 45(10):5030–5033, 2018.
- Lusseau & Mancini (2019) David Lusseau and Francesca Mancini. Income-based variation in sustainable development goal interaction networks. Nature Sustainability, 2(3):242–247, 2019.
- McGowan et al. (2019) Philip JK McGowan, Gavin B Stewart, Graham Long, and Matthew J Grainger. An imperfect vision of indivisibility in the sustainable development goals. Nature Sustainability, 2(1):43–45, 2019.
- Newman (2018) Mark Newman. Networks. Oxford University Press, 2018.
- Székely et al. (2007) Gábor J Székely, Maria L Rizzo, Nail K Bakirov, et al. Measuring and testing dependence by correlation of distances. The Annals of Statistics, 35(6):2769–2794, 2007.
- Székely et al. (2014) Gábor J Székely, Maria L Rizzo, et al. Partial distance correlation with methods for dissimilarities. The Annals of Statistics, 42(6):2382–2412, 2014.
- UN (2015a) UN. Paris Agreement. http://unfccc.int/files/essential_background/convention/application/pdf/english_paris_agreement.pdf, 2015a.
- UN (2015b) UN. The 2030 Agenda for Sustainable Development. https://sustainabledevelopment.un.org/content/documents/21252030%20Agenda%20for%20Sustainable%20Development%20web.pdf, 2015b.
- UN (2020) UN. Sustainable Development Goals indicators. https://unstats.un.org/sdgs/indicators/database/, 2020. Accessed: 2020-01-28.
- UN Climate Change (2019) UN Climate Change. Global Conference on Strengtheining Synergies, Conference Summary. https://sustainabledevelopment.un.org/content/documents/25256WEB_version.pdf, 2019.
- World Bank (2020a) World Bank. Climate Change Knowledge Portal. https://climateknowledgeportal.worldbank.org/download-data, 2020a. Accessed: 2020-01-28.
- World Bank (2020b) World Bank. Sustainable Development Goals. https://datacatalog.worldbank.org/dataset/sustainable-development-goals, 2020b. Accessed: 2020-01-28.
Appendix A Appendix A
A.1 Distance covariance estimators
A.1.1 Biased estimators
Suppose that we have access to a sample of pairs . First, define the pairwise distances: and . Next, define the corresponding distance matrices, denoted by and , as follows:
| (6) |
and
| (7) |
Having computed these, the sample distance covariance can be estimated by
| (8) |
which converges almost surely to the population distance covariance as (Székely et al., 2014).
A.1.2 Unbiased estimators
Unbiased estimators of the distance covariance are denoted as . Firstly, we must redefine our distance matrices and , which we call and as
| (9) |
and
| (10) |
Finally, we can compute the unbiased estimator for as the dot product :
| (11) |
A.2 Eigenvector centrality
For any graph , let be the adjacency matrix of graph with equal to the weight on the edge between node and . The eigenvector centrality of node is a measure relative to all other nodes in , defined as
| (12) |
where is the greatest eigenvalue in the eigenvector equation , subject to . Consequently, this centrality measure is an extension of the widely used degree centrality by considering the centrality of its neighbours besides its own.
Appendix B Appendix B
B.1 Networks of groupings
![[Uncaptioned image]](/html/2004.09318/assets/networks/Northern_Africa_circular_network_logos.png)
![[Uncaptioned image]](/html/2004.09318/assets/networks/Eastern_Africa_circular_network_logos.png)
![[Uncaptioned image]](/html/2004.09318/assets/networks/Middle_Africa_circular_network_logos.png)
![[Uncaptioned image]](/html/2004.09318/assets/networks/Southern_Africa_circular_network_logos.png)
![[Uncaptioned image]](/html/2004.09318/assets/networks/Western_Africa_circular_network_logos.png)
![[Uncaptioned image]](/html/2004.09318/assets/networks/Sub-Saharan_Africa_circular_network_logos.png)
![[Uncaptioned image]](/html/2004.09318/assets/networks/Africa_circular_network_logos.png)
![[Uncaptioned image]](/html/2004.09318/assets/networks/Caribbean_circular_network_logos.png)
![[Uncaptioned image]](/html/2004.09318/assets/networks/Central_America_circular_network_logos.png)
![[Uncaptioned image]](/html/2004.09318/assets/networks/South_America_circular_network_logos.png)
![[Uncaptioned image]](/html/2004.09318/assets/networks/Latin_America_and_the_Caribbean_circular_network_logos.png)
![[Uncaptioned image]](/html/2004.09318/assets/networks/North_America_circular_network_logos.png)
![[Uncaptioned image]](/html/2004.09318/assets/networks/Americas_circular_network_logos.png)
![[Uncaptioned image]](/html/2004.09318/assets/networks/Central_Asia_circular_network_logos.png)
![[Uncaptioned image]](/html/2004.09318/assets/networks/Eastern_Asia_circular_network_logos.png)
![[Uncaptioned image]](/html/2004.09318/assets/networks/South-eastern_Asia_circular_network_logos.png)
![[Uncaptioned image]](/html/2004.09318/assets/networks/Southern_Asia_circular_network_logos.png)
![[Uncaptioned image]](/html/2004.09318/assets/networks/Asia_circular_network_logos.png)
![[Uncaptioned image]](/html/2004.09318/assets/networks/Eastern_Europe_circular_network_logos.png)
![[Uncaptioned image]](/html/2004.09318/assets/networks/Southern_Europe_circular_network_logos.png)
![[Uncaptioned image]](/html/2004.09318/assets/networks/Western_Europe_circular_network_logos.png)
![[Uncaptioned image]](/html/2004.09318/assets/networks/Europe_circular_network_logos.png)
![[Uncaptioned image]](/html/2004.09318/assets/networks/Australia_and_New_Zealand_circular_network_logos.png)
![[Uncaptioned image]](/html/2004.09318/assets/networks/Oceania_excl_AUS_NZ_circular_network_logos.png)
![[Uncaptioned image]](/html/2004.09318/assets/networks/Oceania_incl_AUS_NZ_circular_network_logos.png)
![[Uncaptioned image]](/html/2004.09318/assets/networks/World_circular_network_logos.png)
![[Uncaptioned image]](/html/2004.09318/assets/networks/Least_Developed_Countries_LDC_circular_network_logos.png)
![[Uncaptioned image]](/html/2004.09318/assets/networks/Land_Locked_Developing_Countries_LLDC_circular_network_logos.png)
![[Uncaptioned image]](/html/2004.09318/assets/networks/Small_Island_Developing_States_SIDS_circular_network_logos.png)
![[Uncaptioned image]](/html/2004.09318/assets/networks/G20_circular_network_logos.png)
![[Uncaptioned image]](/html/2004.09318/assets/networks/Emerging_Markets_BRICS_N_11_circular_network_logos.png)
![[Uncaptioned image]](/html/2004.09318/assets/networks/OPEC_circular_network_logos.png)
![[Uncaptioned image]](/html/2004.09318/assets/networks/Low_Income_circular_network_logos.png)
![[Uncaptioned image]](/html/2004.09318/assets/networks/Lower_middle_Income_circular_network_logos.png)
![[Uncaptioned image]](/html/2004.09318/assets/networks/Upper_middle_Income_circular_network_logos.png)
![[Uncaptioned image]](/html/2004.09318/assets/networks/High_Income_circular_network_logos.png)
B.2 Eigenvector centralities
![[Uncaptioned image]](/html/2004.09318/assets/centrality/Northern_Africa_eigenvector_centrality.png)
![[Uncaptioned image]](/html/2004.09318/assets/centrality/Eastern_Africa_eigenvector_centrality.png)
![[Uncaptioned image]](/html/2004.09318/assets/centrality/Middle_Africa_eigenvector_centrality.png)
![[Uncaptioned image]](/html/2004.09318/assets/centrality/Southern_Africa_eigenvector_centrality.png)
![[Uncaptioned image]](/html/2004.09318/assets/centrality/Western_Africa_eigenvector_centrality.png)
![[Uncaptioned image]](/html/2004.09318/assets/centrality/Sub-Saharan_Africa_eigenvector_centrality.png)
![[Uncaptioned image]](/html/2004.09318/assets/centrality/Africa_eigenvector_centrality.png)
![[Uncaptioned image]](/html/2004.09318/assets/centrality/Caribbean_eigenvector_centrality.png)
![[Uncaptioned image]](/html/2004.09318/assets/centrality/Central_America_eigenvector_centrality.png)
![[Uncaptioned image]](/html/2004.09318/assets/centrality/South_America_eigenvector_centrality.png)
![[Uncaptioned image]](/html/2004.09318/assets/centrality/Latin_America_and_the_Caribbean_eigenvector_centrality.png)
![[Uncaptioned image]](/html/2004.09318/assets/centrality/North_America_eigenvector_centrality.png)
![[Uncaptioned image]](/html/2004.09318/assets/centrality/Americas_eigenvector_centrality.png)
![[Uncaptioned image]](/html/2004.09318/assets/centrality/Central_Asia_eigenvector_centrality.png)
![[Uncaptioned image]](/html/2004.09318/assets/centrality/Eastern_Asia_eigenvector_centrality.png)
![[Uncaptioned image]](/html/2004.09318/assets/centrality/South-eastern_Asia_eigenvector_centrality.png)
![[Uncaptioned image]](/html/2004.09318/assets/centrality/Southern_Asia_eigenvector_centrality.png)
![[Uncaptioned image]](/html/2004.09318/assets/centrality/Western_Asia_eigenvector_centrality.png)
![[Uncaptioned image]](/html/2004.09318/assets/centrality/Asia_eigenvector_centrality.png)
![[Uncaptioned image]](/html/2004.09318/assets/centrality/Eastern_Europe_eigenvector_centrality.png)
![[Uncaptioned image]](/html/2004.09318/assets/centrality/Northern_Europe_eigenvector_centrality.png)
![[Uncaptioned image]](/html/2004.09318/assets/centrality/Southern_Europe_eigenvector_centrality.png)
![[Uncaptioned image]](/html/2004.09318/assets/centrality/Western_Europe_eigenvector_centrality.png)
![[Uncaptioned image]](/html/2004.09318/assets/centrality/Europe_eigenvector_centrality.png)
![[Uncaptioned image]](/html/2004.09318/assets/centrality/Australia_and_New_Zealand_eigenvector_centrality.png)
![[Uncaptioned image]](/html/2004.09318/assets/centrality/Oceania_excl_AUS_NZ_eigenvector_centrality.png)
![[Uncaptioned image]](/html/2004.09318/assets/centrality/Oceania_incl_AUS_NZ_eigenvector_centrality.png)
![[Uncaptioned image]](/html/2004.09318/assets/centrality/World_eigenvector_centrality.png)
![[Uncaptioned image]](/html/2004.09318/assets/centrality/Global_North_eigenvector_centrality.png)
![[Uncaptioned image]](/html/2004.09318/assets/centrality/Global_South_eigenvector_centrality.png)
![[Uncaptioned image]](/html/2004.09318/assets/centrality/Least_Developed_Countries_LDC_eigenvector_centrality.png)
![[Uncaptioned image]](/html/2004.09318/assets/centrality/Land_Locked_Developing_Countries_LLDC_eigenvector_centrality.png)
![[Uncaptioned image]](/html/2004.09318/assets/centrality/Small_Island_Developing_States_SIDS_eigenvector_centrality.png)
![[Uncaptioned image]](/html/2004.09318/assets/centrality/G20_eigenvector_centrality.png)
![[Uncaptioned image]](/html/2004.09318/assets/centrality/Emerging_Markets_BRICS_N_11_eigenvector_centrality.png)
![[Uncaptioned image]](/html/2004.09318/assets/centrality/OPEC_eigenvector_centrality.png)
![[Uncaptioned image]](/html/2004.09318/assets/centrality/Low_Income_eigenvector_centrality.png)
![[Uncaptioned image]](/html/2004.09318/assets/centrality/Lower_middle_Income_eigenvector_centrality.png)
![[Uncaptioned image]](/html/2004.09318/assets/centrality/Upper_middle_Income_eigenvector_centrality.png)
![[Uncaptioned image]](/html/2004.09318/assets/centrality/High_Income_eigenvector_centrality.png)
B.3 Groupings of countries
| Northern Africa | Eastern Africa | Middle Africa | Southern Africa | Western Africa | Sub-Saharan Africa | Africa | Caribbean | Central America | South America | Latin America and the Caribbean | North America | Americas | Central Asia | Eastern Asia | South-eastern Asia | Southern Asia | Western Asia | Asia | Eastern Europe | Northern Europe | Southern Europe | Western Europe | Europe | Australia and New Zealand | Oceania (excl. AUS + NZ) | Oceania (incl. AUS + NZ) |
|---|---|---|---|---|---|---|---|---|---|---|---|---|---|---|---|---|---|---|---|---|---|---|---|---|---|---|
| Algeria | Burundi | Angola | Botswana | Benin | Burundi | Algeria | Antigua and Barbuda | Belize | Argentina | Antigua and Barbuda | Canada | Antigua and Barbuda | Kazakhstan | China | Brunei Darussalam | Afghanistan | Armenia | Kazakhstan | Belarus | Denmark | Albania | Austria | Belarus | Australia | Fiji | Australia |
| Egypt, Arab Rep. | Comoros | Cameroon | Lesotho | Burkina Faso | Comoros | Egypt, Arab Rep. | Bahamas, The | Costa Rica | Bolivia | Bahamas, The | Greenland | Bahamas, The | Kyrgyz Republic | Korea, Dem. People’s Rep. | Cambodia | Bangladesh | Azerbaijan | Kyrgyz Republic | Bulgaria | Estonia | Bosnia and Herzegovina | Belgium | Bulgaria | New Zealand | Papua New Guinea | New Zealand |
| Morocco | Djibouti | Central African Republic | Namibia | Cote d’Ivoire | Djibouti | Morocco | Barbados | El Salvador | Brazil | Barbados | United States | Barbados | Tajikistan | Japan | Indonesia | Bhutan | Bahrain | Tajikistan | Czech Republic | Finland | Croatia | France | Czech Republic | Solomon Islands | Fiji | |
| Tunisia | Eritrea | Chad | South Africa | Gambia, The | Eritrea | Tunisia | Cuba | Guatemala | Chile | Cuba | Cuba | Turkmenistan | Mongolia | Lao PDR | India | Cyprus | Turkmenistan | Hungary | Iceland | Greece | Germany | Hungary | Vanuatu | Papua New Guinea | ||
| Ethiopia | Congo, Rep. | Ghana | Ethiopia | Burundi | Dominica | Honduras | Colombia | Dominica | Dominica | Uzbekistan | Malaysia | Iran, Islamic Rep. | Georgia | Uzbekistan | Poland | Ireland | Italy | Liechtenstein | Poland | Micronesia, Fed. Sts. | Solomon Islands | |||||
| Kenya | Congo, Dem. Rep. | Guinea-Bissau | Kenya | Comoros | Grenada | Mexico | Ecuador | Grenada | Grenada | Myanmar | Maldives | Iraq | China | Moldova | Latvia | Malta | Luxembourg | Moldova | Palau | Vanuatu | ||||||
| Madagascar | Equatorial Guinea | Liberia | Madagascar | Djibouti | Haiti | Nicaragua | Guyana | Haiti | Haiti | Philippines | Nepal | Israel | Korea, Dem. People’s Rep. | Romania | Lithuania | Montenegro | Netherlands | Romania | Kiribati | Micronesia, Fed. Sts. | ||||||
| Malawi | Gabon | Mali | Malawi | Eritrea | Jamaica | Panama | Paraguay | Jamaica | Jamaica | Singapore | Pakistan | Jordan | Japan | Russian Federation | Norway | Portugal | Switzerland | Russian Federation | Samoa | Palau | ||||||
| Mauritius | Sao Tome and Principe | Mauritania | Mauritius | Ethiopia | Puerto Rico | Peru | Puerto Rico | Puerto Rico | Thailand | Sri Lanka | Kuwait | Mongolia | Slovak Republic | Sweden | Serbia | Slovak Republic | Tonga | Kiribati | ||||||||
| Mozambique | Niger | Mozambique | Kenya | Trinidad and Tobago | Suriname | Trinidad and Tobago | Trinidad and Tobago | Timor-Leste | Lebanon | Brunei Darussalam | Ukraine | United Kingdom | Slovenia | Ukraine | Tuvalu | Samoa | ||||||||||
| Rwanda | Nigeria | Rwanda | Madagascar | Uruguay | Belize | Belize | Vietnam | Oman | Cambodia | Spain | Denmark | Tonga | ||||||||||||||
| Seychelles | Senegal | Seychelles | Malawi | Venezuela, RB | Costa Rica | Costa Rica | Qatar | Indonesia | Estonia | Tuvalu | ||||||||||||||||
| Somalia | Sierra Leone | Somalia | Mauritius | El Salvador | El Salvador | Saudi Arabia | Lao PDR | Finland | ||||||||||||||||||
| South Sudan | Togo | South Sudan | Mozambique | Guatemala | Guatemala | Syrian Arab Republic | Malaysia | Iceland | ||||||||||||||||||
| Uganda | Uganda | Rwanda | Honduras | Honduras | Turkey | Myanmar | Ireland | |||||||||||||||||||
| Tanzania | Tanzania | Seychelles | Mexico | Mexico | United Arab Emirates | Philippines | Latvia | |||||||||||||||||||
| Zambia | Zambia | Somalia | Nicaragua | Nicaragua | Yemen, Rep. | Singapore | Lithuania | |||||||||||||||||||
| Zimbabwe | Zimbabwe | South Sudan | Panama | Panama | Thailand | Norway | ||||||||||||||||||||
| Angola | Uganda | Argentina | Argentina | Timor-Leste | Sweden | |||||||||||||||||||||
| Cameroon | Tanzania | Bolivia | Bolivia | Vietnam | United Kingdom | |||||||||||||||||||||
| Central African Republic | Zambia | Brazil | Brazil | Afghanistan | Albania | |||||||||||||||||||||
| Chad | Zimbabwe | Chile | Chile | Bangladesh | Bosnia and Herzegovina | |||||||||||||||||||||
| Congo, Rep. | Angola | Colombia | Colombia | Bhutan | Croatia | |||||||||||||||||||||
| Congo, Dem. Rep. | Cameroon | Ecuador | Ecuador | India | Greece | |||||||||||||||||||||
| Equatorial Guinea | Central African Republic | Guyana | Guyana | Iran, Islamic Rep. | Italy | |||||||||||||||||||||
| Gabon | Chad | Paraguay | Paraguay | Maldives | Malta | |||||||||||||||||||||
| Sao Tome and Principe | Congo, Rep. | Peru | Peru | Nepal | Montenegro | |||||||||||||||||||||
| Botswana | Congo, Dem. Rep. | Suriname | Suriname | Pakistan | Portugal | |||||||||||||||||||||
| Lesotho | Equatorial Guinea | Uruguay | Uruguay | Sri Lanka | Serbia | |||||||||||||||||||||
| Namibia | Gabon | Venezuela, RB | Venezuela, RB | Armenia | Slovenia | |||||||||||||||||||||
| South Africa | Sao Tome and Principe | Canada | Azerbaijan | Spain | ||||||||||||||||||||||
| Benin | Botswana | Greenland | Bahrain | Austria | ||||||||||||||||||||||
| Burkina Faso | Lesotho | United States | Cyprus | Belgium | ||||||||||||||||||||||
| Cote d’Ivoire | Namibia | Georgia | France | |||||||||||||||||||||||
| Gambia, The | South Africa | Iraq | Germany | |||||||||||||||||||||||
| Ghana | Benin | Israel | Liechtenstein | |||||||||||||||||||||||
| Guinea-Bissau | Burkina Faso | Jordan | Luxembourg | |||||||||||||||||||||||
| Liberia | Cote d’Ivoire | Kuwait | Netherlands | |||||||||||||||||||||||
| Mali | Gambia, The | Lebanon | Switzerland | |||||||||||||||||||||||
| Mauritania | Ghana | Oman | ||||||||||||||||||||||||
| Niger | Guinea-Bissau | Qatar | ||||||||||||||||||||||||
| Nigeria | Liberia | Saudi Arabia | ||||||||||||||||||||||||
| Senegal | Mali | Syrian Arab Republic | ||||||||||||||||||||||||
| Sierra Leone | Mauritania | Turkey | ||||||||||||||||||||||||
| Togo | Niger | United Arab Emirates | ||||||||||||||||||||||||
| Nigeria | Yemen, Rep. | |||||||||||||||||||||||||
| Senegal | ||||||||||||||||||||||||||
| Sierra Leone | ||||||||||||||||||||||||||
| Togo |
-
•
World contains all listed countries.
| Global North | Global South | LDC | LLDC | SIDS | G20 | Emerging Markets | OPEC | Low Income | Lower middle Income | Upper middle Income | High Income |
|---|---|---|---|---|---|---|---|---|---|---|---|
| Albania | Fiji | Yemen, Rep. | Afghanistan | Antigua and Barbuda | Australia | Bangladesh | Algeria | Afghanistan | Angola | Albania | Antigua and Barbuda |
| Austria | Micronesia, Fed. Sts. | Afghanistan | Armenia | Bahamas, The | Canada | Egypt, Arab Rep. | Angola | Benin | Bangladesh | Algeria | Australia |
| Belarus | Tonga | Burundi | Azerbaijan | Barbados | Saudi Arabia | Indonesia | Equatorial Guinea | Burkina Faso | Bhutan | Argentina | Austria |
| Belgium | Vanuatu | Angola | Bhutan | Belize | United States | Iran, Islamic Rep. | Gabon | Burundi | Bolivia | Armenia | Bahamas, The |
| Bosnia and Herzegovina | Tuvalu | Benin | Bolivia | Comoros | India | Mexico | Iran, Islamic Rep. | Central African Republic | Cambodia | Azerbaijan | Bahrain |
| Bulgaria | Solomon Islands | Mozambique | Botswana | Cuba | Russian Federation | Nigeria | Iraq | Chad | Cameroon | Belarus | Barbados |
| Croatia | Samoa | Burkina Faso | Burkina Faso | Dominica | South Africa | Pakistan | Kuwait | Congo, Dem. Rep. | Comoros | Belize | Belgium |
| Cyprus | Papua New Guinea | Niger | Burundi | Dominican Republic | Turkey | Philippines | Libya | Eritrea | Congo, Rep. | Bosnia and Herzegovina | Canada |
| Czech Republic | Palau | Central African Republic | Central African Republic | Fiji | Argentina | Turkey | Nigeria | Ethiopia | Cote d’Ivoire | Botswana | Chile |
| Denmark | Kiribati | Chad | Chad | Grenada | Brazil | Korea, Dem. People’s Rep. | Saudi Arabia | Gambia | Djibouti | Brazil | Croatia |
| Estonia | Bangladesh | Lesotho | Ethiopia | Guinea-Bissau | Mexico | Vietnam | United Arab Emirates | Guinea | Egypt, Arab Rep. | Bulgaria | Malta |
| Finland | Bhutan | Liberia | Kazakhstan | Guyana | France | Brazil | Congo, Dem. Rep. | Guinea-Bissau | El Salvador | China | Cyprus |
| France | Cambodia | Congo, Dem. Rep. | Kyrgyz Republic | Haiti | Germany | Russian Federation | Venezuela, RB | Haiti | Ghana | Colombia | Czech Republic |
| Greece | China | Djibouti | Lao PDR | Jamaica | Italy | India | Liberia | Honduras | Costa Rica | Denmark | |
| Germany | India | Togo | Lesotho | Kiribati | United Kingdom | China | Madagascar | India | Cuba | Estonia | |
| Greenland | Indonesia | Equatorial Guinea | Malawi | Maldives | China | South Africa | Malawi | Indonesia | Dominica | Finland | |
| Hungary | Lao PDR | Eritrea | Mali | Mauritius | Indonesia | Mali | Kenya | Dominican Republic | France | ||
| Iceland | Malaysia | Ethiopia | Moldova | Palau | Japan | Mozambique | Kiribati | Ecuador | Germany | ||
| Ireland | Myanmar | Gambia | Mongolia | Papua New Guinea | Korea, Dem. People’s Rep. | Nepal | Kyrgyz Republic | Equatorial Guinea | Greece | ||
| Italy | Mongolia | Madagascar | Nepal | Puerto Rico | Niger | Lao PDR | Fiji | Greenland | |||
| Latvia | Nepal | Malawi | Niger | Samoa | Rwanda | Lesotho | Gabon | Hungary | |||
| Liechtenstein | Pakistan | Mali | Paraguay | Sao Tome and Principe | Sierra Leone | Mauritania | Georgia | Iceland | |||
| Lithuania | Philippines | Rwanda | Rwanda | Seychelles | Somalia | Moldova | Grenada | Ireland | |||
| Luxembourg | Sri Lanka | Senegal | South Sudan | Singapore | South Sudan | Mongolia | Guatemala | Israel | |||
| Malta | Thailand | Sierra Leone | Tajikistan | Solomon Islands | Syrian Arab Republic | Morocco | Guyana | Italy | |||
| Montenegro | Timor-Leste | Mauritania | Turkmenistan | Suriname | Tajikistan | Myanmar | Iran, Islamic Rep. | Japan | |||
| Netherlands | Vietnam | Guinea-Bissau | Uganda | Timor-Leste | Tanzania | Nicaragua | Iraq | Korea, Dem. People’s Rep. | |||
| Norway | Maldives | Guinea | Uzbekistan | Tuvalu | Togo | Nigeria | Jamaica | Kuwait | |||
| Poland | Grenada | Comoros | Zambia | Vanuatu | Uganda | Pakistan | Jordan | Latvia | |||
| Portugal | Dominica | Sao Tome and Principe | Zimbabwe | Yemen, Rep. | Papua New Guinea | Kazakhstan | Liechtenstein | ||||
| Romania | Barbados | Zambia | Philippines | Lebanon | Lithuania | ||||||
| Serbia | Antigua and Barbuda | Uganda | Sao Tome and Principe | Libya | Luxembourg | ||||||
| Slovakia | Cuba | Tanzania | Senegal | Malaysia | Netherlands | ||||||
| Slovenia | Bahamas, The | South Sudan | Solomon Islands | Maldives | New Zealand | ||||||
| Spain | Puerto Rico | Sudan | Sudan | Mauritius | Norway | ||||||
| Sweden | Jamaica | Bhutan | Timor-Leste | Mexico | Oman | ||||||
| Switzerland | Algeria | Cambodia | Tunisia | Montenegro | Palau | ||||||
| Ukraine | Angola | Bangladesh | Ukraine | Namibia | Panama | ||||||
| United Kingdom | Benin | Haiti | Uzbekistan | Paraguay | Poland | ||||||
| Canada | Botswana | Kiribati | Vanuatu | Peru | Portugal | ||||||
| United States | Burkina Faso | Lao PDR | Vietnam | Romania | Puerto Rico | ||||||
| Azerbaijan | Cameroon | Myanmar | Zambia | Russian Federation | Qatar | ||||||
| Georgia | Central African Republic | Nepal | Zimbabwe | Samoa | Saudi Arabia | ||||||
| Israel | Chad | Vanuatu | Serbia | Seychelles | |||||||
| Russian Federation | Congo | Tuvalu | South Africa | Singapore | |||||||
| Turkey | Cote d’Ivoire | Solomon Islands | Sri Lanka | Slovak Republic | |||||||
| Australia | Congo, Dem. Rep. | Timor-Leste | Suriname | Slovenia | |||||||
| New Zealand | Djibouti | Thailand | Spain | ||||||||
| Korea, Dem. People’s Rep. | Egypt, Arab Rep. | Tonga | Sweden | ||||||||
| Japan | Equatorial Guinea | Turkey | Switzerland | ||||||||
| Singapore | Eritrea | Turkmenistan | Trinidad and Tobago | ||||||||
| Ethiopia | Tuvalu | United Arab Emirates | |||||||||
| Gabon | Venezuela, RB | United Kingdom | |||||||||
| Gambia, The | United States | ||||||||||
| Ghana | Uruguay | ||||||||||
| Kenya | |||||||||||
| Lesotho | |||||||||||
| Liberia | |||||||||||
| Libya | |||||||||||
| Madagascar | |||||||||||
| Malawi | |||||||||||
| Mali | |||||||||||
| Morocco | |||||||||||
| Mozambique | |||||||||||
| Namibia | |||||||||||
| Niger | |||||||||||
| Nigeria | |||||||||||
| Rwanda | |||||||||||
| Senegal | |||||||||||
| Sierra Leone | |||||||||||
| Somalia | |||||||||||
| South Africa | |||||||||||
| South Sudan | |||||||||||
| Sudan | |||||||||||
| Syrian Arab Republic | |||||||||||
| Togo | |||||||||||
| Tunisia | |||||||||||
| Uganda | |||||||||||
| Tanzania | |||||||||||
| Zambia | |||||||||||
| Zimbabwe | |||||||||||
| Seychelles | |||||||||||
| Sao Tome and Principe | |||||||||||
| Mauritius | |||||||||||
| Mauritania | |||||||||||
| Guinea-Bissau | |||||||||||
| Guinea | |||||||||||
| Comoros | |||||||||||
| Burundi | |||||||||||
| Belize | |||||||||||
| Bahamas, The | |||||||||||
| Argentina | |||||||||||
| Bolivia | |||||||||||
| Brazil | |||||||||||
| Chile | |||||||||||
| Colombia | |||||||||||
| Costa Rica | |||||||||||
| Cuba | |||||||||||
| Dominican Republic | |||||||||||
| Ecuador | |||||||||||
| El Salvador | |||||||||||
| Guatemala | |||||||||||
| Haiti | |||||||||||
| Honduras | |||||||||||
| Jamaica | |||||||||||
| Mexico | |||||||||||
| Panama | |||||||||||
| Paraguay | |||||||||||
| Peru | |||||||||||
| Puerto Rico | |||||||||||
| Suriname | |||||||||||
| Trinidad and Tobago | |||||||||||
| Uruguay | |||||||||||
| Venezuela, RB | |||||||||||
| Nicaragua | |||||||||||
| Guyana | |||||||||||
| Grenada | |||||||||||
| Dominica | |||||||||||
| Barbados | |||||||||||
| Antigua and Barbuda | |||||||||||
| Iraq | |||||||||||
| Afghanistan | |||||||||||
| Armenia | |||||||||||
| Bahrain | |||||||||||
| Iran, Islamic Rep. | |||||||||||
| Jordan | |||||||||||
| Kazakhstan | |||||||||||
| Kuwait | |||||||||||
| Kyrgyz Republic | |||||||||||
| Lebanon | |||||||||||
| Oman | |||||||||||
| Qatar | |||||||||||
| Saudi Arabia | |||||||||||
| Tajikistan | |||||||||||
| Turkmenistan | |||||||||||
| United Arab Emirates | |||||||||||
| Uzbekistan | |||||||||||
| Yemen, Rep. |
-
•
LDC: Least Developed Countries
-
•
LLDC: Land Locked Developing Countries
-
•
SIDS: Small Island Developing States
-
•
Emerging Markets: BRICS + N-11