The Bright Reverse Shock Emission in the Optical Afterglows of Gamma-ray Bursts in a Stratified Medium
Abstract
The reverse shock (RS) model is generally introduced to interpret the optical afterglows with the rapid rising and decaying, such as the early optical afterglow of GRB 990123 (which is also called optical flash). In this paper, we collected 11 gamma-ray bursts (GRBs) early optical afterglows, which have such signatures of dominant RS emission. Since the temporal slopes of the optical flashes are determined by both the medium density distribution index and the electron spectral index , we apply the RS model of the thin shell case to the optical flashes and determine the ambient medium of the progenitors. We find that the value is in the range of 0 - 1.5. The value in this paper is consistent with the result in Yi et al. (2013), where the forward shock (FS) model was applied to some onset bumps. However, the method adopted in this paper is only applicable to GRB afterglows with significant sharp rising and decaying RS emission. Our results indicate that the RS model can also be applied to confirm the circumburst medium, further implying that GRBs may have diverse circumburst media.
Subject headings:
gamma ray: bursts — radiation mechanism: non-thermal1. Introduction
A growing number of gamma-ray burst (GRB) afterglows have been detected with the new observational detectors since 1997, e.g., the UV-Optical Telescope (UVOT) and X-ray Telescope (XRT) onboard Swift (Gehrels et al. 2004; Burrows et al. 2005; Roming et al. 2015). According to the fireball model, GRB afterglows are produced by the external shock with the surrounding medium through the synchrotron emission (Mészáros & Rees 1997; Wijers et al. 1997; Sari et al. 1998; Piran 1999; Zhang 2007). Different GRB afterglows have greatly improved our understanding on the physical origin of GRBs. Therefore, afterglows provide an important clue to the nature of the GRB source and ambient medium, especially for the early afterglow, as it connects the tail of prompt emission with the subsequent afterglow. For example, the observed plateaus and flares in afterglows imply the long-lasting or restart of the central engine of GRBs (Dai & Lu 1998a, b; Burrows et al. 2005; Zhang et al. 2006; Nousek et al. 2006; Dai et al. 2006; Wang & Dai 2013; Wu et al. 2013; Yi et al. 2015, 2016, 2017; Si et al. 2018).
Since long GRBs are produced via the core collapse of massive stars, the circumburst medium of long GRBs may be an interstellar wind. However, Schulze et al. (2011) found that the most of afterglow light curves were compatible with a constant density medium (ISM case). Only some afterglows show evidence of an interstellar wind profile at late times. Therefore, we cannot determine the ambient medium types of GRBs. Besides, there is also no effective method to determine the circumburst medium. Interestingly, Yi et al. (2013) successfully applied the forward shock (FS) model with a power-law density distribution to 19 onset afterglows and confirmed the circumburst medium for those GRBs. They found that the value of the ambient medium distribution index is in the range of 0.4 - 1.4, with a typical value of (also see Liang et al. 2013). Therefore, GRBs may have different ambient media. In this paper, we apply the reverse shock (RS) model to the optical flash and determine the circumburst medium types of GRBs with optical flashes. We use the temporal and spectral indices to determine the values of and , the method same as Yi et al. (2013), where the FS model was applied to the afterglow onset sample.
The paper is organized as follows. In the section 2, the FS and RS model are applied. Our optical flash sample selection criteria are presented in Section 3. Next, we investigate 11 optical flash afterglows in detail. Our conclusions and discussion are presented in Section 5.
2. Reverse Shock and Forward Shock
We consider a relativistic fireball shell with an initial kinetic energy and the initial Lorentz factor , which expands into the ambient medium with the proton number density . We consider a general power-law density distribution , where is the radius, =1 and is the radius at . Much work has been done for different types of circumburst medium, such as, an ISM (Sari et al. 1998; Gao et al. 2013; De Colle et al. 2012), and an interstellar wind (Dai & Lu 1998c; Chevalier & Li 2000; Wu et al. 2003, 2005; Zou et al. 2005; De Colle et al. 2012). During the shell spreading into the environment medium, two shocks are produced: a RS that propagates into the shell, and a FS that propagates into the ambient medium (Sari & Piran 1995; Mészáros & Rees 1997; Sari et al. 1998; Kobayashi 2000; Yi et al. 2013, 2014).
The RS emission is mostly discussed for two situations: the thick shell and the thin shell. However, it has been suggested that the observed afterglows could be described well in the thin shell case rather than the thick shell case (Japelj et al. 2014; Gao et al. 2015). So we apply the RS of the thin shell case to the optical light curves in this paper. According to the observations, optical afterglows with the prominent RS emission can be divided into two different types. Type I afterglows show that RS and FS emissions are obvious , and the peak time of RS is earlier than FS emission. Type II afterglows show that the RS component meets the FS emission after the FS peak time, suggesting slow evolution at the late time (Zhang et al. 2003; Gomboc et al. 2009; Harrison & Kobayashi 2013; Japelj et al. 2014; Gao et al. 2015).
The synchrotron emission from the shocked ambient medium has been discussed in the literature (for more details about the FS emission see Sari et al. 1998, 1999; Granot & Sari 2002; Yi et al. 2013; Gao et al. 2013; Zhou et al. 2020). For the shocked fireball shell emission in the thin shell case, two characteristic frequencies and peak flux density of the RS at the crossing time for are (Kobayashi 2000; Yi et al. 2013)
| (1) |
| (2) |
and
| (3) |
where the Compton parameter , , , , , , and are applied. The scalings laws before and after the reverse shock crossing time are111Considering the high pressure for the shocked shell after the RS crossing time, the evolution of the shocked shell is dominated by adiabatic expansion. Therefore, the evolution of () is considered to be the same as () for both thick shell and thin shell cases after the RS crossing the shell, which is different from Kobayashi (2000).
| (4) |
and
| (5) |
The different theoretical light curves of RS emission are shown in Figs. 1 and 2.
The FS model predicts a smooth early onset bump in the afterglow light curves when the fireball shell is decelerated by the environment medium (Sari et al. 1998; Molinari et al. 2007; Liang et al. 2010). Such an onset feature generally has a smooth rising and decaying slopes. The rising index is generally less than 3, and mostly between 1 and 2 in a statistical sense (Liang et al. 2010). Therefore, only some observed onset bumps are consistent with the theoretical expectations in the ISM case. From Eqs. 67 and 68 of Yi et al. (2013), the values and are determined by the rising and decaying slopes of the FS. This implies that different slopes of light curves may have different circumburst medium ().
From the above discussion, we know that the FS model cannot explain the light curves with the rising index larger than 3. Therefore, in this paper, we apply the RS model to the optical light curves with rapidly rising and decaying, and determine the type of circumburst medium of GRBs with optical flashes. In a general power-law density distribution , the RS theoretical flux density before and after the crossing time are:
| (6) |
and
| (7) |
As shown in Eqs. 6 and 7, the temporal slopes before and after the crossing time are determined by both the medium density profile and the electron spectral index . Therefore, the types of the ambient medium density profile and the distribution of the electrons affect the RS rise and decay indexes.
To understand the nature of RS and FS emissions, we compare the typical parameters in both shocks. Since theoretical models predict that mildly magnetized baryonic outflows of GRBs will produce strong RS emission (Zhang & Kobayashi 2005; Gomboc et al. 2009). In order to produce an obvious optical flash, there should be a strong RS emission that outshines the FS component, especially at the early time. Thus we can derive the ratio of characteristic frequencies and peak flux density of RS () and FS (), which is also seen in Kobayashi & Zhang (2003) and Zhang et al. (2003),
| (8) |
| (9) |
and
| (10) |
where , , and is the initial Lorentz factor.
3. Optical Sample Selection and Light Curve Fitting
Due to small durations of short GRBs, their very early afterglow emissions are hardly detected. Consequently, the reverse shock emission with rapid rising and decaying features rarely appears at the optical band for short GRBs. However, observations of radio afterglows show a reverse shock feature from some short and long GRBs (Lloyd-Ronning et al. 2017; Lloyd-Ronning 2018; Lamb et al. 2019), although the rise was not observed. Since short GRBs are usually found to arise from binary compact star mergers, their circumburst medium is generally considered as a constant density medium. Hence, afterglows from short GRBs are excluded in our sample. Furthermore, because of peaks at very late times, we don’t consider radio afterglows to constrain the circumburst medium of GRBs.
Many early optical afterglow light curves have been detected. It has been expected that different optical afterglows may have different emission components (Rykoff et al. 2009; Kann et al. 2010; Liang et al. 2010; Panaitescu, & Vestrand 2011; Li et al. 2012). As the FS model cannot explain the light curves with the rapidly rising and decaying, the RS model is usually applied to interpret those afterglows, such as the optical afterglow of GRB 990123, which is due to the emission of a RS propagating into the fireball shell (Sari & Prian 1999a; Kobayashi 2000, 2003; Wu et al. 2003; Zhang et al. 2003; Harrison & Kobayashi 2013). Recently, some GRBs with the RS signatures are collected and discussed for the RS emission in a constant ISM environment (Japelj et al. 2014; Gao et al. 2015). In fact, the rising and decaying slopes are used to determine the values of and (Eqs. 6 and 7 for RS in this paper; Eqs. 67 and 68 for FS of Yi et al. 2013 ), therefore, different environment media may have different slopes of light curves. Considering only the ISM case, it may not be the real conditions for different GRBs.
In this paper, we widely search for the peculiar features of the GRB afterglows and two criteria are employed: (1) a remarkable rising and decaying feature appears in an optical afterglow light curve; (2) the rising slope is generally larger than 3. We select 11 optical afterglows at an early time, which have such features in dominant RS emission. We find that there is a remarkable FS signature after the peak of the light curve. Thus, we use the RS plus FS model to fit the 11 light curves. The fitting results are reported in Fig. 3 and Table 1.
11 optical light curves dominated by RS emission at early times, roughly speaking, could be divided into two different types. GRB 041219A is regarded as type I and the other sources belong to type II. Theoretical models predict that mildly magnetized baryonic outflows of GRBs produce strong reverse shock emission (Zhang & Kobayashi 2005; Gomboc et al. 2009). Therefore, to produce type I and type II optical light curves, there should be a strong RS emission that outshines the FS component, especially at early times, the ratio parameters and are required. Table 2 shows the ratio of RS and FS parameters. Our results show that if a remarkable RS component appears in an optical afterglow, should be larger than . The larger / , the more obvious RS component. Our results are also consistent with those of Japelj et al. (2014) and Gao et al. (2015).
4. Case Study
We apply the RS model to the optical flashes and confirm the circumburst medium of the selected GRBs. However, since a remarkable FS signature gradually appears after the peak of the light curve, we also use the FS model to fit the late evolution parts of light curves. Because of the pollution of the FS emission after the peak time of the flash, we adopt the rising slope, rather than the decaying slope, connecting with the optical spectrum to determine the environment medium of GRBs for different emission regimes (see Eqs. 6 and 7). We suppose it is reliable to determine the ambient medium distribution index () using the temporal slopes and spectral behavior. Here we suppose that a power law form for the energy distribution of the shocked electrons with the Lorentz factor of electrons larger than the minimum Lorentz factor, as introduced in Sari et al. (1998), to keep the energy of the electrons to be finite, so the index is supposed in this paper. Please also see the description of a power-law accelerated electron in Higgins. et al. (2019). In our numerical fit, the least- method is applied to those optical afterglows. However, since those optical light curves in our paper are composed of two or more power-law segments along with some erratic pulses, jet breaks, plateaus or rebrightening features and so on, it is hard to fit well for the whole light curve of each GRB. Here, we make our fits only around the rising and decaying phases when using both RS + FS emission, and exclude the mixed components such as erratic pulses, jet breaks, plateaus, or rebrightening features. Because of the poor limit conditions, and many parameters of the fitting models (RS and FS), we cannot confirm all the parameters exactly except for and . Therefore we attempt to give reasonable fitting parameters for each GRB. The results are shown in Table. 1. The case of is not considered, because it is almost unlikely in optical spectra. We ignore synchrotron self-absorption in the optical emission, since it is unimportant at most times for optical afterglows (also see Japelj et al. 2014).
4.1. GRB 990123
GRB 990123 is one of the brightest GRBs detected by BeppoSAX. This famous GRB was intensively studied by many authors, who generally supposed that this optical flash should be attributed to the RS emission (Castro-Tirado et al. 1999; Sari & Piran 1999b; Dai & Lu 1999; Wang et al. 2000; Fan et al. 2002; Panaitescu & Kumar 2004; Nakar et al. 2005). Some authors considered the circumburst medium being an ISM case (Fan et al. 2002; Nakar et al. 2005; Japeij et al. 2014), and applied the RS model in the ISM case to fit the optical flash. In our study, we fit the optical flash with an empirical smooth broken power-law function, and the rising index of GRB 990123 is about . However, the theoretical rising slope of the RS is 5 or 6 in the ISM case, much steeper than the real value of GRB 990123. We take the value of to be free and apply the RS model of this paper to this case, and then there are two possible values for the power-law index of the energy distribution with the optical spectral index (Maiorano et al. 2005). In the first case, the value for . The value of is not in a reasonable range (we suppose ), therefore the model of is unsuitable for GRB 990123. In the second case, the value for , and the rising index is , therefore . The values of and are both in their reasonable ranges, so we suggest that the circumburst medium of GRB 990123 could not be an ISM case and determine the value of .
4.2. GRB 041219A
GRB 041219A is an extraordinary GRB and thought to produce emission from two different physical processes, the internal emission from the central engine of GRB itself and external RS - FS emission that are emerged in the very early optical and near-infrared emission (Blake et al. 2005; Fan et al. 2005; Götz et al. 2011). This is also the only one afterglow regarded as type I in this paper, both showing obvious RS and FS light curve peaks. Because of the lack of the optical spectrum for this GRB, according to the analysis of Blake et al. (2005) and Fan et al. (2005), we apply with the emission regime , and confirm with the rising slope .
4.3. GRBs 060607A and 061007
GRBs 060607A and 061007 are long and fairly hard GRBs detected by Swift/BAT. Some authors considered the two GRBs as the afterglow onsets and determined the initial Lorentz factor with the peak time and isotropic energy (Molinari et al. 2007; Jin & Fan 2007; Ziaeepour et al. 2008; Covino et al. 2008; Liang et al. 2010). However, the optical light curves of GRBs 060607A and 061007 have very sharp rising and , respectively, which is inconsistent with the FS model. For the case, is not suitable for GRB 060607A, since with the optical spectral index (Nysewander et al. 2009). While for , and we also determine the value of . For the GRB 061007, the value with the optical spectral index (Zafar et al. 2011) for , while and for .
4.4. GRB 081007
According to Jin et al. (2013), the optical flash of GRB 081007 has rising and decaying indices of about 3 and respectively, followed by the broken power-law lines with the slope indices of and . The X-ray afterglow is nearly the same as the optical light curve after 300 s. By using the RS and FS model to fit the light curve, we find the RS model can fit the optical flash but the FS emission is inconsistent with the afterglow after the peak time of the flash. Since this GRB presents a transition to a shallow decay phase with the decay index of about 0.60, the standard FS model cannot account for the shallow decay phase dominated by the continued energy injection (Dai & Lu 1998a, b; Zhang & Mészáros 2001; Dai 2004; Zhang 2013; Lü & Zhang 2014; Hou et al. 2014), which is also seen the fit result of GRB 081007 from Japelj et al. (2014), they also used the single RS emission to the optical afterglow of the early time. Therefore, we only use the RS model to fit the optical flash, and the rising index of GRB 081007 is . We exclude the emission regime of for the optical index (Japelj et al. 2014). We find and for .
4.5. GRB 081008
GRB 081008 is also one of the GRBs dominated by the RS at early times in this paper, in which case the rising index (Yuan et al. 2010). We use the two different conditions of Eqs. (6) and (7) to confirm the values and with the optical spectral index (Yuan et al. 2010). For , the index . As mentioned above, we mainly consider the range for , and therefore, we do not apply this emission regime to explain GRB 081008. Then the indices and are obtained for .
4.6. GRB 090102
The optical light curve of GRB 090102 is basically similar to the optical afterglow of GRB 990123, which has a sharp rise and decay evolution after the peak of light curve. The observed optical data are taken from Klotz et al. (2009) and Gendre et al. (2010). The value of is not suitable for with , and therefore, we obtain and with for .
4.7. GRB 110205A
GRB 110205A was a very bright burst detected by Swift/BAT. The optical data also show the various radiation features expected in the fireball model, internal emission, external RS and FS emission (Gendre et al. 2012). There is a very obvious internal component in the early time of the optical light curve (see the Fig. 1 of Gendre et al. 2012), then we apply the RS - FS model after 400 s. The rising index and the optical spectral index (Gendre et al. 2012). Considering a reasonable range of , we apply the to the GRB, and determine and .
4.8. GRB 130427A
GRB 130427A was detected by several space instruments, which is a bright and energetic GRB followed by the multi-wavelength afterglow including the GeV emission (Tam et al. 2013; Liu et al. 2013; Fan et al. 2013; Kouveliotou et al. 2013; Perley et al. 2014; Vestrand et al. 2014; Ackermann et al. 2014). GRB 130427A was also found to be accompanied by bright, broad-lined Type Ic supernovae (SN 2013cq) (Xu et al. 2014). There is an obvious optical flash detected at very early times, and described well by RS and FS emissions with an interstellar wind environment () for the thin-shell model (Laskar et al. 2013; Perley et al. 2014; Vestrand et al. 2014), while some authors also applied the ISM case to describe the optical afterglow (Panaitescu et al. 2013; Maselli et al. 2014). We use our model to confirm the type of environment with the rising index and the optical spectral index (Vestrand et al. 2014). We obtain for , and obtain , which is almost the same as Kouveliotou et al. (2013).
4.9. GRB 140512A
The optical afterglow of GRB 140512A was detected by 0.8 m TNT in white and R bands started at s after the BAT trigger (Huang et al. 2016). Huang et al. (2016) reported the observations of a very bright optical lightcurve. The RS-dominated optical emission of GRB 140512A at early times with the rising index and the spectral index . Therefore, the electron spectral index in the reasonable range, and for .
4.10. GRB 161023A
GRB 161023A was an exceptionally luminous GRB with redshift z = 2.710, and its afterglow reached a peak magnitude of r= 12.6 mag (de Ugarte Postigo et al. 2018). The first four data points show the sharp temporal before 100 s, which are likely the tail of the gamma-ray emission, and behave in a way similar to the prompt emission of GRB 161023A. The rising slope of optical lightcurve is too steep to be consistent with the expected values for an FS. Therefore, it is possible that the early optical peak is dominated by the RS emission. The optical spectral slope and the rising slope of GRB 161023A, and then the electron spectral index and for case. The slope of the density profile , implying the circumburst environment of GRB 161023A may be a homogeneous interstellar medium, which is consistent well with the theoretical afterglow model in an ISM in the thin shell case (Kobayashi 2000; Yi et al. 2013).
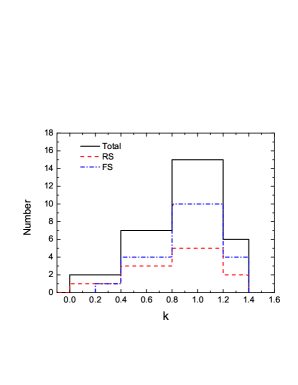
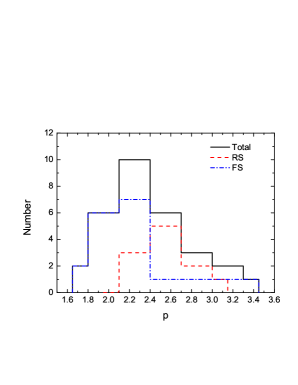
We apply the RS model with the uncertain density index to the optical sample, and determine in the range of . Fig. 4 shows the distributions of the characteristics of and . In this figure, the blue dash-dotted lines are the results determined by the RS, and the data of the red dashed lines are taken from Yi et al. (2013). We find the distribution of determined by the RS is consistent with the results confirmed by the FS model, implying this is an effective method to constrain the environment medium and GRBs may have different circumburst media.
5. Conclusions and Discussion
GRBs are generally believed to be produced from relativistic jets, even though the components of the jets are magnetized or standard baryonic materials that have been not well confirmed. If a highly magnetized jet appears in a GRB () (Giannios et al. 2008), the RS emission would be significantly suppressed or disappeared. However, the afterglows with onset features are consistent with the standard baryonic fireball model well (where ). Therefore, for simplicity, we assume the jet is mildly magnetized. In fact, our results also show that Type I and Type II optical afterglows would have mildly magnetized baryonic jets. There should be a strong RS emission that outshines the FS component. Especially at the early time, the ratio parameters and are required.
We have extensively searched for the optical afterglows with the signatures of dominant RS emission from early afterglow light curves, and 11 GRBs are collected. The RS plus FS model was applied to fit the selected sample. We found the distribution of determined by the RS model are in the range of , which is consistent with the results confirmed by the FS emission from Yi et al. (2013). The RS model was also used to determine the circumburst medium of GRBs. The ambient density distribution usually follows for the wind environment, as discussed that long GRBs are associated with core-collapse of the massive stars. However, the results of this paper, connecting with the consequence of Yi et al. (2013), reveal that the circumburst medium of GRBs may have different forms between an ISM and an interstellar wind. It implies that the progenitors of some long GRBs may experience a different mass-loss evolution.
We found that the values of k are concentrated between 0 and 2, peaking at around 1. We notice this result is shown in both the early optical afterglows (this work) and in the late afterglows (Yi et al. 2013). This indicates it might be a common feature, the circumburst environment is neither an ISM nor a wind. The environment is inconsistent with the late evolution of a massive star. At the end of a massive star, the nuclear burning becomes more and more violent, and the stellar wind becomes more massive and faster. It turns out a much steeper slope of the environment density. On the contrary, the environment may indicate a binary merger origin, of which one is a neutron star or a black hole and the other is a white dwarf or a CO-core star (Rueda et al. 2018). To identify this scenario, gravitational waves might be a unique tool. As the gravitational wave frequency from merging may not lie on the LIGO’s kHz band, the future lower frequency detectors such as DECIGO (Kawamura et al. 2008), Tianqin (Luo et al. 2016), and LISA (Amaro-Seoane et al. 2017) might be ideal instruments to identify the single origin or binary origin of long GRBs. Considering the variety of GRBs, there might be both origins.
Acknowledgments
We would like to thank an anonymous referee for valuable comments. We also thank Ruo-Yu Liu and En-Wei Liang for useful comments and help. This work is supported by the National Natural Science Foundation of China (Grant Nos. 11703015, 11725314, U1738132, 11833003), the National Key Research and Development Program of China (Grant No. 2017YFA0402600) and the Natural Science Foundation of Shandong Province (Grant No. ZR2017BA006).
References
- Ackermann et al. (2014) Ackermann, M., Ajello, M., Asano, K., et al. 2014, Science, 343, 42
- Amaro-Seoane et al. (2017) Amaro-Seoane, P., Audley, H., Babak, S., et al. 2017, arXiv:1702.00786
- Blake et al. (2005) Blake, C. H., Bloom, J. S., Starr, D. L., et al. 2005, Nature, 435, 181
- Burrows et al. (2005) Burrows D. N., et al., 2005a, SSRv, 120, 165
- Burrows et al. (2005) Burrows, D. N., Romano, P., Falcone, A., et al. 2005b, Science, 309, 1833
- Castro-Tirado et al. (1999) Castro-Tirado, A. J., Zapatero-Osorio, M. R., Caon, N., et al. 1999, Science, 283, 2069
- Chevalier & Li (2000) Chevalier, R. A., & Li, Z.-Y. 2000, ApJ, 536, 195
- Covino et al. (2008) Covino, S., Vergani, S. D., Malesani, D., et al. 2008, Chinese Journal of Astronomy and Astrophysics Supplement, 8, 356
- Dai & Lu (1998) Dai, Z. G., & Lu, T. 1998a, A&A, 333, L87
- Dai & Lu (1998) Dai, Z. G., & Lu, T. 1998b, Physical Review Letters, 81, 4301
- Dai & Lu (1998) Dai, Z. G., & Lu, T. 1998c, MNRAS, 298, 87
- Dai & Lu (1999) Dai, Z. G., & Lu, T. 1999, ApJ, 519, L155
- Dai (2004) Dai, Z. G. 2004, ApJ, 606, 1000
- Dai et al. (2006) Dai, Z. G., Wang, X. Y., Wu, X. F., & Zhang, B. 2006, Science, 311, 1127
- De Colle et al. (2012) De Colle, F., Ramirez-Ruiz, E., Granot, J., & Lopez-Camara, D. 2012, ApJ, 751, 57
- de Ugarte Postigo et al. (2018) de Ugarte Postigo, A., Thöne, C. C., Bolmer, J., et al. 2018, A&A, 620, A119
- Fan, et al. (2002) Fan Y.-Z., Dai Z.-G., Huang Y.-F., Lu T., 2002, ChJAA, 2, 449
- Fan et al. (2005) Fan, Y. Z., Zhang, B.,& Wei, D. M. 2005, ApJ, 628, L25
- Fan et al. (2013) Fan, Y.-Z., Tam, P. H. T., Zhang, F.-W., et al. 2013, ApJ, 776, 95
- Götz et al. (2011) Götz, D., Covino, S., Hascoët, R., et al. 2011, MNRAS, 413, 2173
- Gao, et al. (2013) Gao H., Lei W.-H., Zou Y.-C., Wu X.-F., Zhang B., 2013, NewAR, 57, 141
- Gao et al. (2015) Gao, H., Wang, X.-G., Mészáros, P., & Zhang, B. 2015, ApJ, 810, 160
- Gehrels et al. (2004) Gehrels N., et al., 2004, ApJ, 611, 1005
- Gendre et al. (2012) Gendre, B., Atteia, J. L., Boër, M., et al. 2012, ApJ, 748, 59
- Gendre et al. (2010) Gendre, B., Klotz, A., Palazzi, E., et al. 2010, MNRAS, 405, 2372
- Giannios et al. (2008) Giannios, D., Mimica, P., & Aloy, M. A. 2008, A&A, 478, 747
- Gomboc et al. (2009) Gomboc, A., Kobayashi, S., Mundell, C. G., et al. 2009, American Institute of Physics Conference Series, 1133, 145
- Granot, & Sari (2002) Granot, J., & Sari, R. 2002, ApJ, 568, 820
- Harrison & Kobayashi (2013) Harrison, R., & Kobayashi, S. 2013, ApJ, 772, 101
- Higgins et al. (2019) Higgins, A. B., van der Horst, A. J., Starling, R. L. C., et al. 2019, MNRAS, 484, 5245
- Hou et al. (2014) Hou, S. J., Geng, J. J., Wang, K., et al. 2014, ApJ, 785, 113
- Huang et al. (2016) Huang, X.-L., Xin, L.-P., Yi, S.-X., et al. 2016, ApJ, 833, 100
- Japelj et al. (2014) Japelj, J., Kopač, D., Kobayashi, S., et al. 2014, ApJ, 785, 84
- Jin & Fan (2007) Jin, Z. P., & Fan, Y. Z. 2007, MNRAS, 378, 1043
- Jin et al. (2013) Jin, Z.-P., Covino, S., Della Valle, M., et al. 2013, ApJ, 774, 114
- Kann et al. (2010) Kann, D. A., Klose, S., Zhang, B., et al. 2010, ApJ, 720, 1513
- Kawamura et al. (2006) Kawamura, S., Nakamura, T., Ando, M., et al. 2006, Classical and Quantum Gravity, 23, S125
- Klotz et al. (2009) Klotz, A., Gendre, B., Boer, M., & Atteia, J. L. 2009, GRB Coordinates Network, 8764, 1
- Kobayashi (2000) Kobayashi, S. 2000, ApJ, 545, 807
- Kobayashi & Zhang (2003) Kobayashi, S., & Zhang, B. 2003, ApJ, 582, L75
- Kouveliotou et al. (2013) Kouveliotou, C., Granot, J., Racusin, J. L., et al. 2013, ApJ, 779, L1
- Lamb et al. (2019) Lamb, G. P., Tanvir, N. R., Levan, A. J., et al. 2019, ApJ, 883, 48
- Lü & Zhang (2014) Lü, H.-J., & Zhang, B. 2014, ApJ, 785, 74
- Laskar et al. (2013) Laskar, T., Berger, E., Zauderer, B. A., et al. 2013, ApJ, 776, 119
- Liang et al. (2013) Liang, E.-W., Li, L., Gao, H., et al. 2013, ApJ, 774, 13
- Liang et al. (2010) Liang, E.-W., Yi, S.-X., Zhang, J., et al. 2010, ApJ, 725, 2209
- Liu et al. (2013) Liu, R.-Y., Wang, X.-Y., & Wu, X.-F. 2013, ApJ, 773, L20
- Lloyd-Ronning (2018) Lloyd-Ronning, N. 2018, Galaxies, 6, 103
- Lloyd-Ronning, & Fryer (2017) Lloyd-Ronning, N. M., & Fryer, C. L. 2017, MNRAS, 467, 3413
- Luo et al. (2016) Luo, J., Chen, L.-S., Duan, H.-Z., et al. 2016, Classical and Quantum Gravity, 33, 035010
- Maiorano et al. (2005) Maiorano, E., Masetti, N., Palazzi, E., et al. 2005, A&A, 438, 821
- Maselli et al. (2014) Maselli, A., Melandri, A., Nava, L., et al. 2014, Science, 343, 48
- Mészáros & Rees (1997) Mészáros, P., & Rees, M. J. 1997, ApJ, 476, 232
- Mészáros & Rees (1999) Mészáros, P., & Rees, M. J. 1999, MNRAS, 306, L39
- Molinari et al. (2007) Molinari, E., Vergani, S. D., Malesani, D., et al. 2007, A&A, 469, L13
- Nakar & Piran (2005) Nakar, E., & Piran, T. 2005, ApJ, 619, L147
- Nousek et al. (2006) Nousek, J. A., Kouveliotou, C., Grupe, D., et al. 2006, ApJ, 642, 389
- Nysewander et al. (2009) Nysewander, M., Reichart, D. E., Crain, J. A., et al. 2009, ApJ, 693, 1417
- Panaitescu & Kumar (2004) Panaitescu, A., & Kumar, P. 2004, MNRAS, 353, 511
- Panaitescu, & Vestrand (2011) Panaitescu, A., & Vestrand, W. T. 2011, MNRAS, 414, 3537
- Panaitescu et al. (2013) Panaitescu, A., Vestrand, W. T., & Woźniak, P. 2013, MNRAS, 436, 3106
- Perley et al. (2014) Perley, D. A., Cenko, S. B., Corsi, A., et al. 2014, ApJ, 781, 37
- Piran (1999) Piran, T. 1999, Phys. Rep., 314, 575
- Roming et al. (2005) Roming, P. W. A., Kennedy, T. E., Mason, K. O., et al. 2005, Space Sci. Rev., 120, 95
- Rueda, et al. (2018) Rueda J. A., et al., 2018, JCAP, 2018, 006
- Rykoff et al. (2009) Rykoff, E. S., Aharonian, F., Akerlof, C. W., et al. 2009, ApJ, 702, 489
- Sari & Piran (1999) Sari, R., & Piran, T. 1999a, ApJ, 520, 641
- Sari & Piran (1999) Sari, R., & Piran, T. 1999b, ApJ, 517, L109
- Sari & Piran (1995) Sari, R., & Piran, T. 1995, ApJ, 455, L143
- Sari et al. (1998) Sari, R., Piran, T., & Narayan, R. 1998, ApJ, 497, L17
- Schulze et al. (2011) Schulze, S., Klose, S., Björnsson, G., et al. 2011, A&A, 526, A23
- Si et al. (2018) Si, S.-K., Qi, Y.-Q., Xue, F.-X., et al. 2018, ApJ, 863, 50
- Tam et al. (2013) Tam, P.-H. T., Tang, Q.-W., Hou, S.-J., Liu, R.-Y., & Wang, X.-Y. 2013, ApJ, 771, L13
- Vestrand et al. (2014) Vestrand, W. T., Wren, J. A., Panaitescu, A., et al. 2014, Science, 343, 38
- Wang & Dai (2013) Wang, F. Y., & Dai, Z. G. 2013, Nature Physics, 9, 465
- Wang et al. (2000) Wang, X. Y., Dai, Z. G., & Lu, T. 2000, MNRAS, 319, 1159
- Wijers et al. (1997) Wijers, R. A. M. J., Rees, M. J., & Meszaros, P. 1997, MNRAS, 288, L51
- Wu et al. (2005) Wu, X. F., Dai, Z. G., Huang, Y. F., & Lu, T. 2005, ApJ, 619, 968
- Wu et al. (2003) Wu, X. F., Dai, Z. G., Huang, Y. F., & Lu, T. 2003, MNRAS, 342, 1131
- Wu et al. (2013) Wu, X.-F., Hou, S.-J., & Lei, W.-H. 2013, ApJ, 767, L36
- Xu et al. (2013) Xu, D., de Ugarte Postigo, A., Leloudas, G., et al. 2013, ApJ, 776, 98
- Yi et al. (2013) Yi, S.-X., Wu, X.-F., & Dai, Z.-G. 2013, ApJ, 776, 120
- Yi et al. (2014) Yi, S.-X., Gao, H., & Zhang, B. 2014, ApJ, 792, LL21
- Yi et al. (2017) Yi, S.-X., Yu, H., Wang, F. Y., & Dai, Z.-G. 2017, ApJ, 844, 79
- Yi et al. (2016) Yi, S.-X., Xi, S.-Q., Yu, H., et al. 2016, ApJS, 224, 20
- Yi et al. (2015) Yi, S.-X., Wu, X.-F., Wang, F.-Y., & Dai, Z.-G. 2015, ApJ, 807, 92
- Yuan et al. (2010) Yuan, F., Schady, P., Racusin, J. L., et al. 2010, ApJ, 711, 870
- Zafar et al. (2011) Zafar, T., Watson, D., Fynbo, J. P. U., et al. 2011, A&A, 532, A143
- Zhang (2013) Zhang, B. 2013, ApJ, 763, L22
- Zhang (2007) Zhang B., 2007, ChJAA, 7, 1
- Zhang et al. (2006) Zhang, B., Fan, Y. Z., Dyks, J., et al. 2006, ApJ, 642, 354
- Zhang & Kobayashi (2005) Zhang, B., & Kobayashi, S. 2005, ApJ, 628, 315
- Zhang et al. (2003) Zhang, B., Kobayashi, S., & Mészáros, P. 2003, ApJ, 595, 950
- Zhang & Mészáros (2001) Zhang, B., & Mészáros, P. 2001, ApJ, 552, L35
- Zhou et al. (2020) Zhou, Q.-Q., Yi, S.-X., Huang, X.-L., et al. 2020, International Journal of Modern Physics D, accepted
- Ziaeepour et al. (2008) Ziaeepour, H., Holland, S. T., Boyd, P. T., et al. 2008, MNRAS, 385, 453
- Zou et al. (2005) Zou, Y. C., Wu, X. F., & Dai, Z. G. 2005, MNRAS, 363, 93


| GRB | erg) | cm) | Refs. | |||||||||
|---|---|---|---|---|---|---|---|---|---|---|---|---|
| 990123 | 0.60 0.04 | 70 | 9 | 200 | 0.71 0.12 | 2.20 0.08 | 0.05 | 0.25 | 0.002 | 0.015 | 1 | |
| 041219A | … | 0.28 | 0.9 | 135 | 0.80 0.10 | 2.40 | 0.09 | 0.03 | 0.004 | 0.045 | 2, 3 | |
| 060607A | 0.56 0.04 | 16 | 0.7 | 120 | 0.69 0.08 | 2.12 0.08 | 0.05 | 0.10 | 0.003 | 0.05 | 4 | |
| 061007 | 0.78 0.02 | 350 | 1 | 160 | 0.76 0.03 | 2.56 0.04 | 0.04 | 0.06 | 0.002 | 0.12 | 5 | |
| 081007 | 0.86 0.07 | 79 | 0.1 | 100 | 1.16 0.07 | 2.72 0.14 | 0.02 | 0.10 | … | … | 6 | |
| 081008 | 1.10 0.05 | 100 | 0.25 | 130 | 1.26 0.05 | 3.20 0.10 | 0.02 | 0.06 | 0.0015 | 0.075 | 7 | |
| 090102 | 0.74 0.22 | 80 | 17 | 155 | 0.94 0.32 | 2.48 0.44 | 0.02 | 0.06 | 5E-4 | 0.052 | 8 | |
| 110205A | 0.84 0.01 | 90 | 0.5 | 80 | 0.86 0.03 | 2.68 0.02 | 0.06 | 0.03 | 0.004 | 0.006 | 9 | |
| 130427A | 0.70 0.05 | 400 | 40 | 155 | 1.48 0.06 | 2.40 0.10 | 0.02 | 0.06 | 6E-4 | 0.052 | 10 | |
| 140521A | 0.86 0.01 | 18 | 8 | 90 | 1.15 0.03 | 2.72 0.02 | 0.05 | 0.015 | 0.0005 | 0.04 | 11 | |
| 161023A | 0.66 0.08 | 48 | 0.9 | 140 | 0.01 0.19 | 2.32 0.16 | 0.10 | 0.04 | 0.01 | 0.04 | 12 |
References. — (1) Maiorano et al. 2005; (2) Blake et al. 2005; (3) Fan et al. 2005; (4) Nysewander et al. 2009; (5) Zafar et al. 2011; (6) Japelj et al. 2014; (7) Yuan et al. 2010; (8) Gendre et al. 2010; (9) Gendre et al. 2012; (10) Vestrand et al. 2014; (11) Huang et al. 2016; (12) de Ugarte Postigo et al. 2018
| GRB | ||||||
|---|---|---|---|---|---|---|
| 990123 | 5.1 | 16.7 | 0.012 | 0.007 | 2562.5 | |
| 041219A | 4.8 | 0.6 | 1.622E-5 | 0.009 | 1850.9 | |
| 060607A | 4.2 | 2.0 | 3.485E-4 | 0.013 | 1301.9 | |
| 061007 | 4.7 | 0.5 | 8.939E-6 | 0.010 | 2129.1 | |
| 081008 | 4.0 | 0.8 | 1.263E-5 | 0.016 | 1824.5 | |
| 090102 | 6.9 | 1.2 | 8.292E-5 | 0.003 | 2970.4 | |
| 110205A | 4.0 | 4.2 | 0.002 | 0.016 | 913.1 | |
| 130427A | 6.1 | 1.1 | 1.933E-5 | 0.005 | 3521.2 | |
| 140521A | 10.2 | 0.4 | 1.68E-5 | 0.001 | 3076.4 | |
| 161023A | 3.2 | 1.1 | 1.2E-4 | 0.032 | 920.5 |