SCUBA-2 overdensities associated with candidate protoclusters selected from Planck data
Abstract
We measure the 850-m source densities of 46 candidate protoclusters selected from the Planck High-z catalogue (PHz) and the Planck Catalogue of Compact Sources (PCCS) that were followed up with Herschel-SPIRE and SCUBA-2. This paper aims to search for overdensities of 850-m sources in order to select the fields that are most likely to be genuine protoclusters. Of the 46 candidate protoclusters, 25 have significant overdensities (5 times the field counts), 11 have intermediate overdensities (3–5 times the field counts) and 10 have no overdensity (3 times the field counts) of 850-m sources. We find that the enhanced number densities are unlikely to be the result of sample variance. Compared with the number counts of another sample selected from Planck’s compact source catalogues, this [PHz+PCCS]-selected sample has a higher fraction of candidate protoclusters with significant overdensities, though both samples show overdensities of 850-m sources above intermediate level. Based on the estimated star-formation rate densities (SFRDs), we suggest that both samples can efficiently select protoclusters with starbursting galaxies near the redshift at which the global field SFRD peaks (). Based on the confirmation of overdensities found here, future follow-up observations on other PHz targets may greatly increase the number of genuine DSFG-rich clusters/protoclusters.
keywords:
galaxies: high-redshift – galaxies: starburst – submillimetre: galaxies1 Introduction
Protoclusters of galaxies are structures that are expected to collapse into galaxy clusters by , but that have yet to fully collapse at the observed epoch (Overzier, 2016). They are not yet virialised and so cannot be efficiently found using traditional galaxy cluster detection methods through X-ray emission or the Sunyaev-Zeldovich effect (SZE, Sunyaev & Zeldovich, 1980), which require the presence of hot (– K) gas, or through red sequence galaxies (Gladders & Yee, 2000). Current optical/near-infrared (NIR) surveys aiming to detect protoclusters, such as the Hyper Suprime-Cam Subaru Strategic Program (HSC-SSP, Douglas et al., 2010; Toshikawa et al., 2018), mainly study overdensities of Lyman-break galaxies (LBGs), Lyman- emitters (LAEs) or H- emitters (HAEs) with blind (unbiased) searches or around “biased tracers" such as QSOs or radio galaxies (Pentericci et al., 2000; Kurk et al., 2004; Verhamme et al., 2008; Tanaka et al., 2011; Hayashi et al., 2012; Husband et al., 2013; Casey et al., 2015). Such surveys have found hundreds of candidate protoclusters, but they are unlikely to recover the full protocluster population. Furthermore, optical/NIR surveys miss protoclusters whose member galaxies are havily dust-obscured, which is especially the case at .
If we look at the cores of galaxy clusters, there is an abundance of elliptical galaxies (Dressler, 1980; Binggeli et al., 1988; Goto et al., 2003). According to some galaxy formation models, these elliptical galaxies are the successors of dusty star-forming galaxies (DSFGs) at high redshifts (Farrah et al., 2006; Lapi et al., 2006; Fan et al., 2008; Cook et al., 2010; Lapi et al., 2011; Wang et al., 2013; Cai et al., 2013; Lapi et al., 2014; Toft et al., 2014; Aversa et al., 2015; Wilkinson et al., 2017). Adding the fact that protoclusters are the progenitors of galaxy clusters suggests that there should also be an abundance of DSFGs in protoclusters at high redshifts, which is supported by observations (Chapman et al., 2009; Daddi et al., 2009; Dannerbauer et al., 2014; Umehata et al., 2015; Casey et al., 2015; Bussmann et al., 2015; Gómez-Guijarro et al., 2019).
Even though there are already observations of protoclusters containing DSFGs, the sample is small compared to that of optical/NIR protocluster surveys. Negrello et al. (2005) developed a technique to detect protoclusters based on their FIR/submm emission. They proposed to use the fact that the FIR flux density in a low-resolution survey is the sum of many sources if they are clustered with a size similar to the beam. Following this technique, a number of studies have aimed at selecting protoclusters containing DSFGs using the Planck Early Release Compact Source Catalog (ERCSC, Planck Collaboration VII, 2011), the Catalogue of Compact Sources (PCCS, Planck Collaboration XXVIII, 2013), and the Second Planck Catalogue of Compact Sources (PCCS2, Planck Collaboration XXVI, 2015). These studies have produced a sample of candidate protoclusters (Herranz et al., 2013; Clements et al., 2014; Greenslade et al., 2018) and follow-up observations have been obtained (Clements et al., 2016; Cheng et al., 2019a). Greenslade et al. (2018), in particular, estimated the surface density of DSFG-rich candidate protoclusters to be , consistent with other studies (Clements et al., 2014).
MacKenzie et al. (2017) (hereafter M17) selected a number of candidate protoclusters with DSFGs from the Planck high-z source candidates list (PHz, Planck Collaboration Int. XXXIX, 2016), the PCCS, and follow-up Herschel-SPIRE observations (Planck Collaboration XXVII, 2015). M17 also completed follow-up observations of 46 candidate protoclusters using SCUBA-2 at 850 m, obtaining photometric redshifts, FIR luminosities, and star-formation rate density (SFRD) distributions. They found that their 850-m sample has a redshift peak between and 4, a typical FIR luminosity of , an SFRD peak at , and with an uncorrected number density of all sources in the candidate protoclusters being 6 times more than in the field.
Among these 46 candidate protoclusters, two (PLCKG006.1+61.8 and PHzG173.9+57.0, see Table 1) were also identified as the most overdense candidates in the Spitzer Planck Herschel Infrared Cluster survey (SPHerIC, Martinache et al., 2018) sample, which selects candidate clusters at using photometric data from Planck, Herschel and Spitzer/IRAC.
This paper extends the work of M17. Using their sample of 46 candidate protoclusters, we calculate each of their 850-m source densities, classify them based on the derived source densities, and look for the candidate protoclusters that are most overdense in 850 m sources. We also compare the source densities with those of 850 m observations of candidate protoclusters discussed in Cheng et al. (2019a) (hereafter C19), which were originally selected from the ERCSC, PCCS or PCCS2, and compare the two samples in terms of efficiency of selecting genuine protoclusters.
In Section 2 we present the selection of candidate protoclusters and our source extraction using SCUBA-2 data. In Section 3 the 850-m source densities are shown. We discuss our results and conclude in Section 4. Unless otherwise stated, we use the standard concordance cosmology with , and (Planck Collaboration VI, 2018).
2 Candidate protocluster selection, source extraction
Forty-six candidate protoclusters were selected and studied in M17. They were originally selected from the PHz and the PCCS catalogues, with colour cuts using their 857, 545, 353 and 217 GHz flux densities in order to remove cold Galactic cirrus and extragalactic radio sources. According to M17, only sources with an infrared excess, or and in the PHz catalogue, and and in the PCCS catalogue, were selected, where is the flux density.
Among these [PHz+PCCS]-selected sources, 228 were followed up with Herschel-SPIRE. Fifteen of these 228 sources were then idenfied as being gravitionally-enhanced submillimetre sources (GEMS), the so-called Planck dusty GEMS (Fu et al., 2012; Combes et al., 2012; Cañameras et al., 2015). After excluding the Galactic cirrus sources, the rest show overdensities of Herschel-SPIRE sources with flux densities peaking at 350 or 500m (Planck Collaboration XXVII, 2015). These sources are believed to be either high-z protoclusters or chance line-of-sight projections.
Sixty-one sources were observed with SCUBA-2. Ten of these are GEMS in Cañameras et al. (2015), with peak flux densities of 350 to 1140 mJy at 850 m. Forty-six are believed to be protoclusters due to their Herschel-SPIRE overdensities.
We extract the SCUBA-2 850m sources in the same way as in C19. We start from the highest S/N pixel in the S/N map and go down to the detection threshold of S/N=3.5. Connected pixels that have S/N3.5 are regarded as part of the same source. As discussed in C19, the detection threshold of 3.5 is chosen since the reliabilility is found to be above 80 at 3.5 (c.f. C19). The flux density and noise are recorded at the position of the pixel with the highest S/N within a source. Note that the flux density and noise are also deboosted following C19 and Geach et al. (2017) (hereafter Ge17), and a 5 calibration uncertainty is also included. This equivalently gives our source catalogue a minimum noise value of 1.04 mJy.
The 850-m source catalogue is essentially the same as that of M17, though in M17 they applied further constraints to exclude sources that are below signal-to-noise ratios of 4, and sources having 850-m flux density uncertainties above 4 mJy. In order to compare with the number count results in C19, we retain our 850-m source catalogue111The source catalogue can be downloaded from the online supplementary material., which follows the source extraction method in C19.
We test the completeness of our 850-m sources for each candidate protocluster by inserting artificial sources from 2 to 20 mJy into the flux density maps and use the same extraction method. The shapes of these artificial sources are approximated by 2D Gaussians with standard deviations as the SCUBA-2 beamsize at 850 m. In order to minimise the chances of sources overlapping, 10 sources are inserted in the map each time, and the process is repeated 1,500 times. We could not totally rule out overlappings of these artificial sources, given their extended 2D Gaussian shapes. Nonetheless, 10 sources is representative of the number of real sources in each map, so our artificial sources should have similar statistical characteristics to the real sources. Given the limiting map sizes, there are also chances of pixel repetitions when inserting these artifical sources for 1,500 times. Nonetheless, the repetitive pixels do not change the noise characteristics and thus the completeness level of each field, so do not change the conclusions made in this paper.
The fraction of extracted and inserted artifical sources in each candidate protocluster, as a function of flux density, is the completeness. Out of the 46 candidate protoclusters, 25 have completeness above 50, and 21 are below 50 , at 8 mJy. We mark these completeness candidates in the last column in Table 1 as “C". Out of these completeness candidates, 18 still have significant or intermediate overdensities (category II or III as discussed in Section 3), indicating they are likely to be genuine protoclusters with overdensities of 850 m sources even under lower completeness. Out of the completeness candidates, three have no overdensity of 850-m sources; they might still have overdensities of 850-m sources, but their lower completeness makes it difficult to confirm this.
We found that the higher rms in the flux density maps may explain the low completeness in some fields. The rms values for those 50 completeness fields at 8 mJy are on average twice the rms of the rest. At brighter flux densities, such as at 12 mJy, the number of candidate protoclusters having completeness level 50 decreases to two.
The reliability of our 850-m sources for each candidate protocluster is tested by inverting the flux density maps, following M17. After the maps are inverted, “negative" sources are extracted using the same method as for positive sources. Assuming that the negative sources are due to noise spikes and hence there should be the same number of “positive" noise spikes, the fraction of these negative sources and positive sources for each candidate protocluster, as a function of S/N, is therefore a measure of reliability. Out of the 46 candidate protoclusters, 32 have reliability above 80 at 3.5, and 14 have reliability below 80 at 3.5. We mark these reliability candidates in the last column of Table 1 as “R". Among those candidates, there are 11 that show significant or intermediate overdensities of 850-m sources (category II or III as discussed in Section 3). We note with caution that such overdensities might not be real, due to their lower reliability.
3 Number Counts of [PHZ+PCCS]-selected Candidate Protoclusters
We follow the cumulative number count analysis in C19 using the SCUBA-2 850-m source catalogue of the 46 candidate protocluster fields studied in M17. The number of sources is counted cumulatively from brighter to fainter flux density bins with binwidths of 2 mJy. Since the sensitivity varies across the map, we correct the number counts by dividing the number of sources by the effective area corresponding to different sensitivities (rather than the entire map area).
The cumulative number counts of the 46 candidate protoclusters from M17 are shown in Table 1. We quote the cumulative number counts from 4 to 12 mJy, which includes the majority of the sources, scaled to the area of each map (of approximately 0.03 deg2) and with the variable sensitivity corrected over the map. We estimate the probability of detecting the observed number of sources in each candidate protocluster at 6 or 8mJy, assuming that the sources are randomly distributed and following a Poisson distribution222 is the upper tail of the probability density function, following a Poisson distribution. The R function ppois(observed-1, lambda=expected, lower=FALSE) is used to calculate ., by comparing to the field results in Ge17.
| Name | 4 mJy | 6 mJy | 8 mJy | 10 mJy | 12 mJy |
|
Category | ||||
|---|---|---|---|---|---|---|---|---|---|---|---|
| Planck18p194 | 280.6 | 280.6 | 7.10.07 | 4.30.04 | 3.00.03 | 4.18 | 515 | 0.0515 | II | ||
| Planck18p735 | 240.6 | 240.6 | 1.10.01 | 1.10.01 | N/A | 0.86 | 4540 | 0.454 | I (R) | ||
| Planck24p194 | 170.5 | 170.5 | 6.30.08 | N/A | N/A | 0.02 | 700 | 0.07 | II | ||
| PLCKDUG045.7–41.2 | 8.40.1 | 8.40.1 | 8.40.1 | 4.50.04 | 1.10.01 | 9.97 | 365 | 0.0365 | II (R) | ||
| PLCKDUG059.1–67.1 | 9.80.1 | 9.80.1 | 9.80.1 | 6.20.05 | 3.00.03 | 2.13 | 242 | 0.0242 | III | ||
| PLCKDUG073.4–57.5 | 291.5 | 291.5 | 2.70.02 | 2.70.02 | 1.10.01 | 0.59 | 2883 | 0.2883 | I (R) | ||
| PLCKG006.1+61.8 | 120.4 | 120.4 | 120.4 | 120.4 | 100.1 | 1.17 | 87 | 0.0087 | III (C) | ||
| PLCKG009.8+72.6 | 422.3 | 422.3 | 130.2 | 7.00.07 | 2.00.02 | 1.75 | 31 | 0.0031 | III (R) | ||
| PLCKG056.7+62.6 | 131.2 | 131.2 | 131.2 | 3.70.04 | 3.70.04 | 1.75 | 31 | 0.0031 | III (C) | ||
| PLCKG068.3+31.9 | 215 | 215 | 215 | 9.60.6 | 7.10.2 | 4.58 | 0 | III (RC) | |||
| PLCKG075.1+33.2 | 9.00.6 | 9.00.6 | 9.00.6 | 9.00.6 | 4.80.08 | 2.13 | 365 | 0.0365 | III (RC) | ||
| PLCKG077.7+32.6 | 9.61.4 | 9.61.4 | 9.61.4 | 6.20.1 | 2.70.03 | 2.13 | 242 | 0.0242 | III (C) | ||
| PLCKG078.9+48.2 | 4.70.08 | 4.70.08 | 4.70.08 | 4.70.08 | 2.60.03 | 0.14 | 1331 | 0.1331 | I (C) | ||
| PLCKG082.5+38.4 | 237.0 | 237.0 | 9.10.2 | 4.50.04 | 3.10.03 | 2.13 | 242 | 0.0242 | III | ||
| PLCKG083.3+51.0 | 3159 | 3159 | 120.1 | 120.1 | 4.50.04 | 1.16 | 87 | 0.0087 | III (C) | ||
| PLCKG091.9+43.0 | 1763 | 1763 | 1763 | 9.10.2 | 9.10.2 | 4.46 | 0 | III (C) | |||
| PLCKG093.6+55.9 | 5.60.07 | 5.60.07 | 5.60.07 | 5.60.07 | 3.20.03 | 0.05 | 956 | 0.0956 | I (C) | ||
| PLCKG132.9–76.0 | 2.20.02 | 2.20.02 | 2.20.02 | 2.20.02 | 2.20.02 | 0.59 | 2883 | 0.2883 | I (C) | ||
| PLCKG144.1+81.0 | 6.90.3 | 6.90.3 | 6.90.3 | 6.90.3 | 1.10.01 | 0.02 | 700 | 0.07 | II (RC) | ||
| PLCKG160.7+41.0 | 2917 | 2917 | 2917 | 200.7 | 3.90.06 | 5.85 | 0 | III (C) | |||
| PLCKG162.1–59.3 | 371.5 | 371.5 | 3.50.04 | 1.00.01 | 1.00.01 | 0.32 | 1937 | 0.1937 | I | ||
| PLCKG165.8+45.3 | 203.5 | 203.5 | 203.5 | 6.60.1 | 4.80.06 | 4.90 | 0 | III (C) | |||
| PLCKG173.8+59.3 | 8.60.7 | 8.60.7 | 4.60.07 | 3.30.03 | 2.20.02 | 0.14 | 1331 | 0.1331 | I | ||
| PLCKG177.0+35.9 | 210.9 | 210.9 | 7.40.08 | 4.40.04 | 2.00.02 | 4.18 | 515 | 0.0515 | II (R) | ||
| PLCKG179.3+50.7 | 230.3 | 230.3 | 9.40.08 | 2.10.02 | 2.10.02 | 2.13 | 242 | 0.0242 | III | ||
| PLCKG186.3–72.7 | 150.9 | 150.9 | 8.80.1 | 4.80.05 | N/A | 9.97 | 365 | 0.0365 | II | ||
| PLCKG186.6+66.7 | 183.1 | 183.1 | 183.1 | 8.60.1 | 4.20.04 | 4.85 | 0 | III (C) | |||
| PLCKG188.6–68.9 | 300.8 | 300.8 | 210.2 | 4.20.04 | 2.00.02 | 4.58 | 0 | III | |||
| PLCKG191.3+62.0 | 9.90.4 | 9.90.4 | 9.90.4 | 9.90.4 | 7.40.1 | 2.13 | 242 | 0.0242 | III (C) | ||
| PLCKG191.8–83.4 | 340.8 | 340.8 | 200.2 | 3.30.03 | 1.00.01 | 4.90 | 0 | III | |||
| PLCKG201.1+50.7 | 230.7 | 230.7 | 7.90.09 | 1.00.01 | 1.00.01 | 4.18 | 515 | 0.0515 | II | ||
| PLCKG213.0+65.9 | 1617 | 1617 | 1617 | 110.6 | 3.90.08 | 3.88 | 0 | III (RC) | |||
| PLCKG223.9+41.2 | 342.5 | 180.2 | 8.50.07 | 4.00.04 | 3.00.03 | 9.97 | 365 | 0.0365 | II | ||
| PLCKG328.9+71.4 | 371.9 | 371.9 | 371.9 | 140.2 | 6.90.08 | 8.40 | 0 | III (RC) | |||
| PLCKG49.6–42.9 | 2132 | 7.80.2 | 3.70.03 | 1.10.01 | N/A | 0.32 | 1937 | 0.1937 | I | ||
| PLCKG84.0–71.5 | 6.60.1 | 6.60.1 | 6.60.1 | 6.60.1 | 3.50.04 | 0.02 | 700 | 0.07 | II (C) | ||
| PLCKHZG038.0–51.5 | 4012 | 4012 | 120.2 | 6.30.07 | 2.10.02 | 1.17 | 87 | 0.0087 | III | ||
| PLCKHZG067.2–63.8 | 220.4 | 220.4 | 9.70.09 | 7.30.06 | 4.10.03 | 2.13-4 | 242 | 0.0242 | III | ||
| PLCKHZG103.1–73.6 | 150.4 | 150.4 | 7.40.08 | N/A | N/A | 4.18 | 515 | 0.0515 | II (R) | ||
| PLCKHZG106.8–83.3 | 220.4 | 220.4 | 110.1 | 8.50.07 | 2.00.02 | 7.23 | 137 | 0.0137 | III | ||
| PLCKHZG119.4–76.6 | 240.4 | 240.4 | 7.90.07 | 5.20.05 | 2.00.02 | 4.18 | 515 | 0.0515 | II | ||
| PLCKHZG132.6–81.1 | 7.50.3 | 7.50.3 | 4.40.05 | 2.10.02 | 2.10.02 | 0.14 | 1331 | 0.1331 | I (R) | ||
| PLCKHZG171.1–78.7 | 200.5 | 200.5 | 200.5 | 4.30.04 | 4.30.04 | 4.90 | 0 | III (RC) | |||
| PLCKHZG173.9+57.0 | 7.71.7 | 7.71.7 | N/A | N/A | N/A |
|
1503 | 0.1503 | I | ||
| PLCKHZG176.6+59.0 | 120.4 | 120.4 | 120.4 | 120.4 | 5.10.05 | 1.17 | 87 | 0.0087 | III (C) | ||
| PLCKHZG214.1+48.3 | 148.7 | 148.7 | 148.7 | 110.2 | 110.2 | 2.44 | 0 | III (RC) | |||
|
22.60.34 | 0.610.05 | 0.210.03 |
We classify these 46 candidate protoclusters into three categories based on their observed source densities over each map area of approximately 0.03 deg2, following the method in C19.
(I) Those with an observed source density less than 3 times the expected number from Ge17, equivalently at 8 mJy or at 6 mJy, are regarded as not having an overdensity of SCUBA-2 sources.
(II) Those with observed source densities between 3 and 5 times the expected number from Ge17, equivalently at 8 mJy or at 6 mJy, are regarded as having an intermediate overdensity of SCUBA-2 sources.
(III) Those with observed source densities greater than or equal to 5 times the expected number from Ge17, equivalently at 8 mJy or at 6 mJy, are regarded as overdense in SCUBA-2 sources.
We find that there are 25 candidate protoclusters in M17 that can be regarded as being overdense in SCUBA-2 sources (category III, see column 7 in Table 1), and are thus the most likely to be bona fide protoclusters. There are 11 candidate protoclusters that contain a mild overdensity of SCUBA-2 sources (category II); these are still likely to be protoclusters, rich in 850-m sources but the SCUBA-2 observations may not be sensitive enough to confirm the overdensities. There are also 10 candidate protoclusters in M17 that do not appear to have an overdensity of SCUBA-2 sources (category I); nonetheless, they still have overdensities of Herschel-SPIRE sources (Planck Collaboration XXVII, 2015). For candidates in all these three categories, photometric data at other wavelengths and/or spectroscopic data will be needed to confirm their protocluster status.
The two candidate protoclusters in M17 having the largest overdensities are PLCKG328.9+71.4 and PLCKG160.7+41.0. There are 37 sources above 8 mJy in PLCKG328.9+71.4 (after sensitivity is corrected over the map) compared to the expected 1.97 sources according to Ge17. This gives an essentially vanishing probability. There are 29 sources above 8mJy in PLCKG160.7+41.0 (after sensitivity is corrected over the map), which also has negligible probability. Given that 36 out of 46 candidate protoclusters in M17 (78, Poissonian error) can be regarded as strongly or moderately overdense in SCUBA-2 sources, we suggest that the study of M17 selected candidate protoclusters through overdensities of 850-m sources similar to the selection in C19.
It is worth noticing that if considering only the PHz-selected candidate protoclusters (with names starting with “PLCKHZ" in Table 1), the fraction of candidates with significant overdensities (category III) can reach 60, comparable to that of the combined [PHz+PCCS]-selected candidates (54)
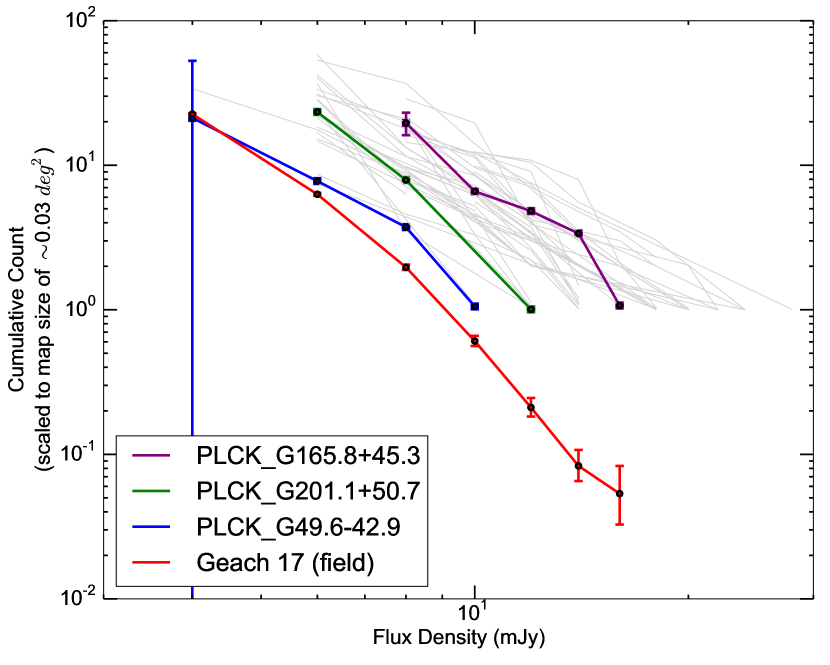
Figure 1 shows the cumulative number counts as a function of 850-m flux density for the M17 candidate protoclusters. The red curve shows the cumulative number counts from the S2CLS fields from Ge17, with Poissonian errors. Blue, green, and purple curves show the cumulative number counts of the M17 candidate protoclusters PLCKG49.6-42.9, PLCKG165.8+45.3 and PLCKG201.1+50.7, respectively, with errors propagated from the completeness errors. These candidate protoclusters are representative of categories (I) no overdensity, (II) intermediate overdensity, and (III) significant overdensity, respectively, based on our classification. The grey curves show the cumulative number counts of all other M17 candidate protoclusters. It can be seen that a majority of the candidate protoclusters are overdense compared to the field across a wide range of flux densities.
We estimate the probability that the overdensities are random positive fluctuations due to sample variance (Williams et al., 2011; Hickox et al., 2012; Wilkinson et al., 2017; Negrello et al., 2017) instead of real protoclusters following the method in C19. In C19, 10,000 random regions are selected in the map of S2CLS/COSMOS (see Ge17) and the same source extraction algorithm are performed. We count how many have more detected sources than individual candidate protocluster fields (). The probability of overdensities due to sample variance () is simply /10,000. We also quote and in Table 1.
We find that candidate protoclusters that are in category III (with significant overdensities of 850-m sources) have and those in category II (with intermediate overdensity) have . These results reveal that the overdensities of 850-m sources seen in these candidate protoclusters cannot be simply explained by sample variance. The values are also consistent with those in C19, who found for their most overdense candidate protoclusters. In Clements et al. (2016), it was found a for H12-00, one of the other candidate protoclusters with submm detections.
4 Comparison between [PHz+PCCS]- and [ERCSC+PCCS+PCCS2]-selected overdensities
In this study, we compare the 850-m number count results of the M17 candidate protoclusters with the 13 candidate protoclusters studied in C19. Those 13 candidate protoclusters were selected originally using the ERCSC, PCCS, and PCCS2 catalogues, and were identified as overdensities of Herschel sources in SPIRE bands in Herranz et al. (2013), Clements et al. (2014), and Greenslade et al. (2018).
Instead of the various colour cuts applied in the M17 catalogue, no colour cut was applied in the ERCSC, PCCS or PCCS2 catalogues on the candidate protocluster selection in the C19 sample. However, when selecting candidate protoclusters with overdensities of Herschel sources, Greenslade et al. (2018) applied a 25.4-mJy flux density cut for Herschel sources at 350m in order to uniformly compare the heterogeneous catalogues from Herschel.
We apply the categorisation in Section 3 according to the number counts of 850-m sources to classify the 13 candidate protoclusters in C19. Among the candidate protoclusters in C19, five (38) are in category (I) (no overdensity), four (31) are in category (II) (intermediate overdensity) and four (31) are in category (III) (significant overdensity). Among the 46 candidate protoclusters discussed in this study, 10 (22) are in category (I) (no overdensity); 11 (24) are in category (II) (intermediate overdensity); 25 (54) are in category (III) (significant overdensity).
A higher fraction of category (III) candidate protoclusters (with significant overdensities across the same map size) is seen in the sample discussed in this paper. We conclude that the M17 sample, selected from the PHz and PCCS catalogue and with additional colour cuts, has selected a higher fraction of overdensities of 850-m sources. Nonetheless, both candidate protoclusters selected in [PHz+PCCS] or [ERCSC+PCCS+PCCS2] can find overdensities of 850-m sources at or above the intermediate level (78 and 62, respectively).
In addition to the fact that the fraction of candidate protoclusters with significant overdensities is higher in the M17 sample than in the C19 sample, there is evidence that the M17 sample has higher average redshift and infrared luminosity. According to figure 6 of C19 and data from M17, sources from the M17-selected candidate protoclusters have a redshift peak at , whereas the C19 sample has a redshift peak at . In figure 7 of C19, the infrared luminosity of the M17 sample has a peak at whereas the C19 sample has a peak at . Using source catalogues from M17 and C19, we estimate the mean and standard deviation of redshifts to be and for the M17 and C19 samples, respectively. The means and standard deviations of infrared luminosities are and for the M17 and C19 samples, respectively.
We can test if the higher infrared luminosity in the M17 sample is due to them being at higher redshifts, at a fixed flux density at 850m. Template SEDs of known DSFGs (local ULIRG Arp220, Donley et al. (2007), Rangwala et al. (2011); average SMGs from the ALMA-LABOCA ECDFS Submm Survey (ALESS), da Cunha et al. (2015); the high-z source HFLS3 Riechers et al. (2013); and the Cosmic Eyelash Swinbank et al. (2010)) are used and their infrared luminosities are estimated from rest-frame 8 to 1,000 m at different redshifts, given fixed 850-m flux densities. We find that due to the negative K-correction, the infrared luminosity is in general constant at redshifts between . The difference in infrared luminosities between the C19 and M17 samples cannot simply be explained by them being at different redshifts. Hence we also conclude that with additional colour cuts (as discussed in Section 2), sources in the [PHz+PCCS]-selected candidate protoclusters (M17 sample) are more luminous and are on average at higher redshifts than sources in candidate protoclusters selected by ERCSC+PCCS+PCCS2 (C19 sample).
In addition to redshifts, M17 also estimated the far-infrared luminosities and star-formation rate densities (SFRDs) of the 850 m sources in the candidate protoclusters. They found that the SFRD distribution peaks at a redshift of , which is consistent with the peak of the cosmic SFRD in the field (Hopkins & Beacom, 2006; Bouwens et al., 2012). We conclude that the M17 sample is robust in selecting 850-m source overdensities, most of which are likely to be protoclusters of starbursting galaxies near the peak redshift of the field SFRD at .
As discussed in Section 2, among the 36 category (II) and (III) candidate protoclusters in the M17 sample discussed in this paper, 11 have reliability below 80 at 3.5 (with “R" at the “Category" column in Table 1). Adding the fact of the limiting number of sources, there are potential uncertainties when comparing between the M17 and C19 samples as discussed in the last few paragraphs. Future observations are needed to confirm the redshifts and infrared luminosities of these SCUBA-2 sources and their protocluster memberships.
5 Conclusions
Forty-six candidate protoclusters were selected in the Planck High-z catalogue (PHz) and the Planck Catalogue of Compact Sources (PCCS), and followed up with Herschel-SPIRE and SCUBA-2, as discussed in MacKenzie et al. (2017) (M17). We extract sources at 850-m using maps from these SCUBA-2 observations with S/N3.5, following the method used in Cheng et al. (2019b) (C19).
The cumulative number counts of 850-m sources in these cluster candidates are measured from 4 to 12 mJy and the probability () of the observed number of sources at 8 mJy or 6 mJy is compared with the field values, assuming the sources are randomly distributed. We find that out of 46 candidate protoclusters: 25 have significant overdensities of 850-m sources ( at 8 mJy or at 6 mJy); 11 have mild overdensities ( at 8 mJy or at 6 mJy); and 10 have no overdensity ( at 8 mJy or at 6 mJy). Approximately 78 percent of the candidate protoclusters have significant or mild overdensities of 850-m sources. Hence we conclude that M17, using the PHz and PCCS catalogues, is generally selecting protoclusters with overdensities of 850 m sources.
The fraction of candidate protoclusters with overdensities of 850-m sources may be underestimated, however, due to the insufficient depth in the M17 survey, for which 21 out of 46 candidate protocluster fields have completeness 50 at 8 mJy.
Comparing this result with the number counts in the C19 sample, which are originally selected from the Planck compact source catalogues (ERCSC+PCCS+PCCS2), the [PHz+PCCS]-selected sample has a higher fraction of candidate protoclusters with significant overdensities of 850-m sources (54 versus 31), has higher photometric redshift and infrared luminosity distributions, due to the additional colour cuts applied. However, the low reliability and small sample size raise some uncertainties when doing these comparisons, which can be improved with future follow-up observations. Nevertheless, both samples show overdensities of 850-m sources at or above the intermediate level (78 for the M17 sample and 62 for the C19 sample). Hence we conclude that both samples, selected using Planck and Herschel data, are robust in selecting overdensities of 850-m sources, which may be starbursting galaxies in protoclusters near the peak redshift of the cosmic star-formation rate density.
We also want to stress that the confirmation of the [Planck+SPIRE+SCUBA-2]-selected targets as genuine overdensities, as discussed in this paper, applies a subset of the bigger PHz list of more than 2,000 sources. There are approximately 10 times of more PHz sources without Herschel data, and more without SCUBA-2 data. Hence, follow-up observations using FIR/submm cameras of the rest of the PHz sample in the future may greatly increase the overall cluster/protocluster sample rich in DSFGs and FIR-bright sources, though we cannot totally rule out potential line-of-sight overdensities. Spectroscopic confirmations in the future are needed eventually to rule out this effect.
Acknowledgements
The James Clerk Maxwell Telescope is operated by the East Asian Observatory on behalf of the National Astronomical Observatory of Japan, Academia Sinica Institute of Astronomy and Astrophysics, the Korea Astronomy and Space Science Institute, and the Operation, Maintenance and Upgrading Fund for Astronomical Telescopes and Facility Instruments, budgeted from the Ministry of Finance (MOF) of China and administrated by the Chinese Academy of Sciences (CAS), as well as the National Key RD Program of China (No. 2017YFA0402700). Additional funding support is provided by the Science and Technology Facilities Council of the United Kingdom and participating universities in the United Kingdom and Canada.
The Herschel spacecraft was designed, built, tested, and launched under a contract to ESA managed by the Herschel/Planck Project team by an industrial consortium under the overall responsibility of the prime contractor Thales Alenia Space (Cannes), and including Astrium (Friedrichshafen) responsible for the payload module and for system testing at spacecraft level, Thales Alenia Space (Turin) responsible for the service module, and Astrium (Toulouse) responsible for the telescope, with in excess of a hundred subcontractors.
SPIRE was developed by a consortium of institutes led by Cardiff University (UK) and including: Univ. Lethbridge (Canada); NAOC (China); CEA, and LAM (France); IFSI, Univ. Padua (Italy); IAC (Spain); Stockholm Observatory (Sweden); Imperial College London, RAL, UCL-MSSL, UKATC, and Univ. Sussex (UK); and Caltech, JPL, NHSC, and Univ. Colorado (USA). This development has been supported by national funding agencies: CSA (Canada); NAOC (China); CEA, CNES, CNRS (France); ASI (Italy); MCINN (Spain); SNSB (Sweden); STFC, UKSA (UK); and NASA (USA).
H.D. acknowledges financial support from the Spanish Ministry of Science, Innovation and Universities (MICIU) under the 2014 Ramn y Cajal program RYC-2014-15686 and AYA2017-84061-P, the latter one cofinanced by FEDER (European Regional Development Funds).
GDZ gratefully acknowledges financial support from ASI/INAF agreement n. 2014-024-R.1 for the Planck-LFI Activity of Phase E2 and from the ASI/Physics Department of the university of Roma–Tor Vergata agreement n. 2016-24-H.0
JGN acknowledges financial support from the PGC 2018 project PGC2018-101948-B-I00 (MICINN, FEDER), PAPI-19-EMERG-11 (Universidad de Oviedo) and from the Spanish MINECO for the “Ramon y Cajal" fellowship (RYC-2013-13256).
E.I. acknowledges partial support from FONDECYT through grant N∘ 1171710.
M.J.M. acknowledges the support of the National Science Centre, Poland through the SONATA BIS grant 2018/30/E/ST9/00208.
D.R. acknowledges support from the National Science Foundation under grant numbers AST1614213 and AST1910107 and from the Alexander von Humboldt Foundation through a Humboldt Research Fellowship for Experienced Researchers.
References
- Aversa et al. (2015) Aversa R., Lapi A., de Zotti G., Shankar F., Danese L., 2015, ApJ, 810, 74
- Binggeli et al. (1988) Binggeli B., Sandage A., Tammann G. A., 1988, ARA&A, 26, 509
- Bouwens et al. (2012) Bouwens R. J., et al., 2012, ApJ, 754, 83
- Bussmann et al. (2015) Bussmann R. S., et al., 2015, ApJ, 812, 43
- Cañameras et al. (2015) Cañameras R., et al., 2015, A&A, 581, A105
- Cai et al. (2013) Cai Z.-Y., et al., 2013, ApJ, 768, 21
- Casey et al. (2015) Casey C. M., et al., 2015, ApJ, 808, L33
- Chapman et al. (2009) Chapman S. C., Blain A., Ibata R., Ivison R. J., Smail I., Morrison G., 2009, ApJ, 691, 560
- Cheng et al. (2019a) Cheng T., et al., 2019a, arXiv e-prints, p. arXiv:1909.08977
- Cheng et al. (2019b) Cheng T., et al., 2019b, MNRAS, 490, 3840
- Clements et al. (2014) Clements D. L., et al., 2014, MNRAS, 439, 1193
- Clements et al. (2016) Clements D. L., et al., 2016, MNRAS, 461, 1719
- Combes et al. (2012) Combes F., et al., 2012, A&A, 538, L4
- Cook et al. (2010) Cook M., Barausse E., Evoli C., Lapi A., Granato G. L., 2010, MNRAS, 402, 2113
- Daddi et al. (2009) Daddi E., et al., 2009, ApJ, 694, 1517
- Dannerbauer et al. (2014) Dannerbauer H., et al., 2014, A&A, 570, A55
- Donley et al. (2007) Donley J. L., Rieke G. H., Pérez-González P. G., Rigby J. R., Alonso-Herrero A., 2007, ApJ, 660, 167
- Douglas et al. (2010) Douglas L. S., Bremer M. N., Lehnert M. D., Stanway E. R., Milvang-Jensen B., 2010, MNRAS, 409, 1155
- Dressler (1980) Dressler A., 1980, ApJ, 236, 351
- Fan et al. (2008) Fan L., Lapi A., De Zotti G., Danese L., 2008, ApJ, 689, L101
- Farrah et al. (2006) Farrah D., et al., 2006, ApJ, 641, L17
- Fu et al. (2012) Fu H., et al., 2012, ApJ, 753, 134
- Geach et al. (2017) Geach J. E., et al., 2017, MNRAS, 465, 1789
- Gladders & Yee (2000) Gladders M. D., Yee H. K. C., 2000, AJ, 120, 2148
- Gómez-Guijarro et al. (2019) Gómez-Guijarro C., et al., 2019, ApJ, 872, 117
- Goto et al. (2003) Goto T., Yamauchi C., Fujita Y., Okamura S., Sekiguchi M., Smail I., Bernardi M., Gomez P. L., 2003, MNRAS, 346, 601
- Greenslade et al. (2018) Greenslade J., et al., 2018, MNRAS, 476, 3336
- Hayashi et al. (2012) Hayashi M., Kodama T., Tadaki K.-i., Koyama Y., Tanaka I., 2012, ApJ, 757, 15
- Herranz et al. (2013) Herranz D., et al., 2013, A&A, 549, A31
- Hickox et al. (2012) Hickox R. C., et al., 2012, MNRAS, 421, 284
- Hopkins & Beacom (2006) Hopkins A. M., Beacom J. F., 2006, ApJ, 651, 142
- Husband et al. (2013) Husband K., Bremer M. N., Stanway E. R., Davies L. J. M., Lehnert M. D., Douglas L. S., 2013, MNRAS, 432, 2869
- Kurk et al. (2004) Kurk J. D., Pentericci L., Overzier R. A., Röttgering H. J. A., Miley G. K., 2004, A&A, 428, 817
- Lapi et al. (2006) Lapi A., Shankar F., Mao J., Granato G. L., Silva L., De Zotti G., Danese L., 2006, ApJ, 650, 42
- Lapi et al. (2011) Lapi A., et al., 2011, ApJ, 742, 24
- Lapi et al. (2014) Lapi A., Raimundo S., Aversa R., Cai Z.-Y., Negrello M., Celotti A., De Zotti G., Danese L., 2014, ApJ, 782, 69
- MacKenzie et al. (2017) MacKenzie T. P., et al., 2017, MNRAS, 468, 4006
- Martinache et al. (2018) Martinache C., et al., 2018, A&A, 620, A198
- Negrello et al. (2005) Negrello M., González-Nuevo J., Magliocchetti M., Moscardini L., De Zotti G., Toffolatti L., Danese L., 2005, MNRAS, 358, 869
- Negrello et al. (2017) Negrello M., et al., 2017, MNRAS, 470, 2253
- Overzier (2016) Overzier R. A., 2016, A&ARv, 24, 14
- Pentericci et al. (2000) Pentericci L., et al., 2000, A&A, 361, L25
- Planck Collaboration Int. XXXIX (2016) Planck Collaboration Int. XXXIX 2016, A&A, 596, A100
- Planck Collaboration VI (2018) Planck Collaboration VI 2018, arXiv e-prints, p. arXiv:1807.06209
- Planck Collaboration VII (2011) Planck Collaboration VII 2011, A&A, 536, A7
- Planck Collaboration XXVI (2015) Planck Collaboration XXVI 2015, A&A, 594, A26
- Planck Collaboration XXVII (2015) Planck Collaboration XXVII 2015, A&A, 582, A30
- Planck Collaboration XXVIII (2013) Planck Collaboration XXVIII 2013, A&A, 571, A28
- Rangwala et al. (2011) Rangwala N., et al., 2011, ApJ, 743, 94
- Riechers et al. (2013) Riechers D. A., et al., 2013, Nature, 496, 329
- Sunyaev & Zeldovich (1980) Sunyaev R. A., Zeldovich I. B., 1980, ARA&A, 18, 537
- Swinbank et al. (2010) Swinbank A. M., et al., 2010, Nature, 464, 733
- Tanaka et al. (2011) Tanaka I., et al., 2011, PASJ, 63, 415
- Toft et al. (2014) Toft S., et al., 2014, ApJ, 782, 68
- Toshikawa et al. (2018) Toshikawa J., et al., 2018, PASJ, 70, S12
- Umehata et al. (2015) Umehata H., et al., 2015, ApJ, 815, L8
- Verhamme et al. (2008) Verhamme A., Schaerer D., Atek H., Tapken C., 2008, A&A, 491, 89
- Wang et al. (2013) Wang L., et al., 2013, MNRAS, 431, 648
- Wilkinson et al. (2017) Wilkinson A., et al., 2017, MNRAS, 464, 1380
- Williams et al. (2011) Williams C. C., et al., 2011, ApJ, 733, 92
- da Cunha et al. (2015) da Cunha E., et al., 2015, ApJ, 806, 110