∎
t1This work was supported by the Russian Science Foundation, grant 18-12-00258. \thankstexte1e-mail: st@ms2.inr.ac.ru
The local-filament pattern in the anomalous transparency of the Universe for energetic gamma rays\thanksreft1
Abstract
The propagation length of high-energy photons through the Universe is limited by pair production on the extragalactic background radiation. Previous studies reported discrepancies between predicted and observed attenuation, suggesting explanations in terms of new physics. However, these effects are dominated by a limited number of observed sources, while many do not show any discrepancy. Here, we consider the distribution in the sky of these apparently anomalous objects, selected in two very different approaches: the study of unphysical hardenings at distance-dependent energies in deabsorbed spectra of TeV blazars, and the observation of ultra-high-energy air showers from the directions of BL Lac type objects. In both cases, directions to the anomalous sources follow the projected local distribution of galaxies: all the distant sources, contributing to the anomalies, are seen through the local filament. This matches the prediction of the proposed earlier explanation of the anomalies based on mixing of photons with axion-like particles in the filament’s magnetic field. For ultra-high energies, this axion interpretation may be tested by the search of primary gamma rays.
1 Introduction
Distant active galaxies, blazars, are among the strongest sources in the very-high-energy (VHE; above GeV) gamma-ray band. They were detected even with the first modest instruments, despite the predicted Nikishov attenuation of the flux: energetic gamma rays from distant sources interact with soft photons constituting the extragalactic background light (EBL) and produce pairs. Though direct observations of EBL suffer from uncertainties, lower limits on the EBL are firm EBL-review ; EBL-recent-review and allow one to take the absorption into account. Gamma-ray spectra of some distant blazars, deabsorbed with these models, were found to be too hard compared to those of similar nearby objects. This problem was called “the infrared/TeV crisis” crisis in 2000. Several solutions have been proposed, see below, though there is still no generally accepted solution to the issue. Modern imaging atmospheric Cherenkov telescopes (IACTs) enlarged the amount of blazars detected in VHE to several dozens, opening the way to analyzing statistical samples. The anomalous behavior of a VHE blazar has been identified HornsMeyer ; gamma as hardening, that is an upward change of the spectral slope, in the spectrum deabsorbed with the ultimate lower-limit EBL. For blazars located at different distances from the observer , the absorption on EBL becomes important at different energies , and the hardenings are observed precisely at these energies , indicating an incorrect account of the absorption. This was termed “anomalous transparency of the Universe”. However, most recent studies, based on larger samples of blazars and better measured distances to them, indicate that the overall significance of the anomalous transparency seen in VHE blazars is modest gamma2 ; fermi2 ; veritas 111References Biteau ; magic ; hess reached similar conclusions from analyses treating spectra of one and the same object observed multiple times as statistically independent data, see e.g. Refs. gamma2 ; ST-PRD for discussions.. Spectra of many newly discovered blazars are consistent with the pair-production attenuation for low-EBL models, but several bright objects observed previously continue to demonstrate the anomaly. In addition, new sources with anomalous hardenings have been found, see Ref. gamma2 for the list and references.
On the same timescale of decades, another puzzling effect has been observed and widely discussed, the directional correlation of some of ultra-high-energy (UHE; above eV) cosmic-ray air showers with BL Lac type objects, a subclass of blazars. The correlation was found BLL for the published set of cosmic-ray events with the primary energy eV detected by the High Resolution Fly’s Eye (HiRes) fluorescence air-shower detector in the stereoscopic mode HiRes271 . Given the deflection of charged cosmic-ray particles in astrophysical magnetic fields, the observed directional coincidence implies neutral primaries. However, assuming standard physics, no neutral particle with that high energy can reach us from the distances at which BL Lacs are located TT-no-neutral (except for neutrinos; see e.g. Ref. BLL-UHE-nu for the discussion of a possible BL Lac – UHE cosmic rays – neutrino connection). Subsequently, the HiRes collaboration has confirmed BLL-HiRes the observation and has extended it to lower energies, eV (see also Ref. FarrarBL for an independent analysis of the same eV data by a different method, confirming the effect with a stronger estimated significance). The angular resolution of the HiRes experiment in the stereo mode, , remains unsurpassed, and the correlation has not been tested with data of modern fluorescence air-shower detectors yet.
Theoretical approaches to the explanation of the anomalous transparency exploit either the suppression of the pair production or the assumption that the observed photons do not come from the source but are born much closer to the observer. The first option is possible only in models with the Lorentz-invariance violation, see Ref. LIV-rev for a recent review. However, for the required parameters, the Lorentz-invariance violation would suppress also the development of air showers in the atmosphere and therefore make the VHE photons invisible for Cherenkov telescopes no-LIV1 ; no-LIV2 , contrary to observations (see however Ref. Hassan for a model overcoming the limit). The second option may be realized in two approaches, “cascade” and “conservation”. Cascades can develop in the cosmic background fields and radiation, starting either from a VHE photon Dzhatdoev or from an accompanying UHE proton emitted by the same source Kusenko (see also Refs. Essey:2010er ; Murase:2011cy ; Takami:2013gfa ; Tavecchio:2013fwa ; Zheng:2015gfw ; Tavecchio:2018nrt ); what we detect at the Earth may be secondary particles produced nearby. Conservation means that the photon converts near the source to some particle, which does not produce pairs on EBL, then this particle travels unattenuated and reconverts back to a photon close to us. A viable mechanism involves oscillations RaffeltStodolsky of photons to hypothetical axion-like particles (ALPs) in external magnetic fields DARMA ; Serpico ; Csaba ; ST-mini . Amazingly, the very same ALP-based mechanism can FRT explain in a consistent way the correlations of UHE showers with BL Lacs, which otherwise remain misterious.
The ALP-photon mixing requires magnetic fields, while the cascades get distorted by the fields so that secondary charged particles, and hence photons born in their interactions, no longer point to the original source of the high-energy emission. Therefore, the two scenarios predict opposite patterns of anisotropy in the distribution of the effect strength over the sky: in the cascade case, anomalies are expected to follow low-field regions, while in the ALP case, regions of higher field are favoured. It has been pointed out that the VHE anomalies may be explained by the ALP-gamma conversion in the Galactic magnetic field and the corresponding anisotropy might be related to the Galactic plane Serpico . For UHE photons, the conversion in the Galaxy is suppressed, but local extragalactic structures, small-scale filaments, provide for the required conditions; conversion of VHE photons in the filament field is also possible for certain ALP parameters FRT .
Several attempts to find deviations from isotropy in the anomalous transparency have been made. Ref. Furniss , based on the Fermi-LAT data, studied the correlation between VHE candidate sources and the line-of-sight “voidedness” parameter, reporting a weak indication that sources with hard spectra are seen through voids in the large-scale structure. Their analysis did not select the sources with anomalous spectra and probed the matter distribution in the distant Universe at , complementary to the Local supercluster we study here.
In Ref. Serpico , the distribution in the sky of a few distant VHE blazars, known at that time, was compared to the maps of the photon-ALP conversion probability calculated with three models of the Galactic magnetic field. Visually, a possible correlation with the high-probability regions was pointed out for one HMR of the field models. Subsequently, in Ref. ST-PRD , a similar study has been repeated with the same field model and an enlarged sample of VHE blazars, qualitatively confirming the trend. However, the model HMR of the field is outdated and the test is not perfect because it does not distinguish truly anomalous objects. More recent magnetic-field models predict Horns1207.0776 ; WBrun different patterns of the conversion probability in the Milky Way, so the anisotropy seen in Refs. ST-PRD ; Serpico , if real, is not related to the Galaxy. In Ref. FRT , it has been demonstrated that the cosmic rays correlating to BL Lac type objects do not follow the HiRes exposure, but no particular pattern was tested.
In the present work, we revisit the question of anisotropy in the anomalous transparency for both VHE and UHE cases and concentrate on the pattern associated with the local filament.
2 Analysis and results
2.1 Method
We use the weighted density of galaxies along the line of sight as a tracer of the local large-scale structure. The method was used extensively in the studies of cosmic-ray anisotropies at UHE, see e.g. Refs. UHE-LSS1 ; UHE-LSS2 ; UHE-LSS3 . The starting point is a flux-limited catalog of galaxies for which we use the 2MASS Redshift Survey (2MRS), Refs. 2MASS1 ; 2MASS2 . Weights sliding-old ; Hylke are chosen in such a way that the incompleteness of the catalog is compensated.
The 2MRS catalog traces the large-scale structure up to distances of 250 Mpc. Photons of different energies have different mean free paths with respect to the pair production, varying from a few Mpc for eV UHE gamma rays to a few Gpc for the most distant VHE sources observed at GeV. In the frameworks of the ALP scenario, nearby regions with magnetic field serve as secondary sources for reconverted photons. The flux from these secondary sources should be therefore suppressed by the inverse distance squared, so we introduce the weight, where is the luminosity distance to a particular galaxy. This means that nearby galaxies contribute more, so the weighted density is higher for the directions parallel to the local filament in which the Milky Way galaxy resides, a Mpc thick sausage extending from the Virgo cluster to the Fornax cluster, see e.g. Ref. local-filament .
The weighted density is determined as a function of the direction in the sky given by the Galactic coordinates as described in Appendix A; larger values of therefore trace the local large-scale structure. We stress that the local filament extends to Mpc from us while nearest blazars are Mpc away, hence their distribution is completely independent of the local structure traced by . Following Ref. UHE-LSS1 , we calculate two sets of values, for the set of directions which are associated with the anomalous transparency effects, and for the control sample of directions in the sky. The two sets of numbers, and , are then compared by means of the Kolmogorov-Smirnov test which gives the probability that they are derived from one and the same distribution.
This method requires to fix the angular smoothing scale when the function is calculated, see Appendix A. While in cosmic-ray studies the scale was determined by expected deflections of charged particles in cosmic magnetic fields, here we do not have such a guidance. While we are interested in the interpretation involving the filament’s magnetic fieds, they are poorly measured and we do not know to which extent the number density of galaxies traces the field. Hence we choose to treat the smoothing as a free parameter of the model, see A, and account for this freedom in a standard statistical approach TT-penalty described in C.
2.2 Results for TeV hardenings
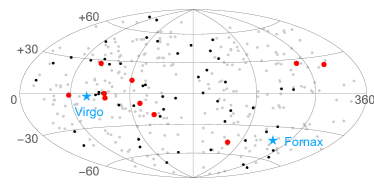
For the VHE blazars, we start with the data sets of Ref. gamma2 . There, a sample of blazars with known redshifts was constructed starting from the TeVCat catalog TeVCat for the sources observed by Imaging Atmospheric Cherenkov Telescopes (IACTs; 66 sources) and from the 3FHL catalog 3FHL for those observed with Fermi LAT (307 sources at )222Strict quality cuts applied in Ref. gamma2 removed several sources claimed as anomalous in previous studies.. Only 26 and 5 of them, respectively, were detected at considerable opacities, and 8 and 2 have hardenings (upward spectral breaks at the energy inconsistent with zero at 68% CL) in the spectra deabsorbed with the most recent EBL model KorochkinEBLmodel . These latter 10 objects, see Table 1 in Appendix B, are considered here as the signal sample of objects demonstrating anomalies, while the control sample is constructed of 1000 randomly selected sets of 8 of 66 IACT and 2 of 307 Fermi-LAT sources. The distribution of objects from the VHE samples in the sky are shown in Fig. 1.
The pre-trial Kolmogorov-Smirnov probability that the control and signal samples are derived from one and the same distribution is 0.013 and corresponds to the disk smoothing of (see Appendix A for details and Fig. 6 in Appendix C for the dependence of the local p-value on the smoothing). The post-trial probability is 0.028.
2.3 Results for EeV correlations
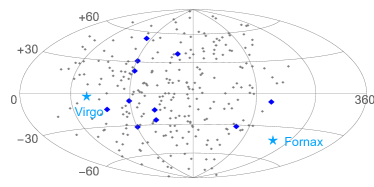
We now turn to the UHE case. Here, we start with Ref. BLL where a certain number of HiRes air showers with reconstructed primary energies above eV were found to correlate with BL Lac type objects. Of 156 sources selected in previous studies, 11 were found to be within from the shower arrival directions, while only 3 were expected assuming isotropy. This angle was determined from the angular resolution of the experiment, , by a Monte-Carlo simulation as maximizing the signal-to-noize ratio, assuming neutral primary particles from BL Lac’s. We consider these 11 directions as the signal sample , see Table 2 from Appendix B, for the list. The control sample is given by arrival directions of all 271 HiRes air showers in the sample HiRes271 , see Fig. 2.
The pre-trial Kolmogorov-Smirnov p-value for these two samples is , achieved for the Gaussian smoothing at the scale. The post-trial probability is .
Figure 3
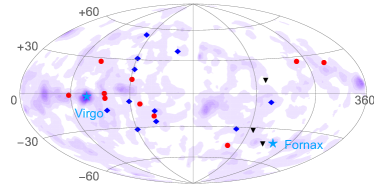
shows the distribution of anomalous directions in the sky superimposed on the density plot of the projected weighted galaxy distribution. In both VHE and UHE cases, the signal sample follows the regions of higher weighted densities. We address the difference in statistical significance between the two samples below. The two results represent independent tests of the anomalous transparency at different energies. We compare now combined signal and background samples, so that the signal distribution consists of directions of all 21 anomalous sources while the control sample is obtained by taking 1000 random subsamples, each consisting of 8 of 66 TeVCat blazars, 2 of 307 3FHL blazars and 11 of 271 HiRes arrival directions. This results in the pre-trial , again achieved for the Gaussian smoothing at the scale. The post-trial probability is . Were the statistics Gaussian, this would correspond to the significance of 4.0 standard deviations (post trial).
3 Discussion and conclusions
We see that, for both samples, the sources whose observation gave the base for claims of the anomalous transparency are seen along the local filament, through the regions of higher matter density, and probably higher magnetic fields. We tested explicitly that our results do not depend on the maximal distance cut in the catalog, so they are indeed dominated by the Local supercluster. Including only galaxies within the spheres of 20, 30, 50, 75, 100, 150 and 250 Mpc and repeating the statistical procedure, we obtained roughly the same statistical significance. While the resulting pre-trial p-value develops a shallow minimum around 30 Mpc, this gain in significance is almost precisely compensated by the extra distance-cut trial correction.
This correlation with the local matter distribution fits the predictions of the model of ALP-photon mixing FRT : a part of emitted photons convert to ALPs in the magnetic field of the filament containing the source and reconvert back to photons in the filament containing the observer. The maximal-mixing conditions FRT depend on the ALP mass , the ALP-photon coupling , the photon energy , the magnetic field and the size of the field-filled region . The observed anisotropy suggests that the conversion happens in the directions along the filament and not in the transverse direction, as it is graphically shown in Figure 4,
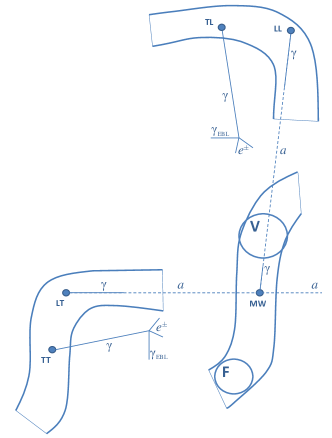
which illustrates the interpretation of our main result in terms of the photon-axion mixing333The author thanks O. Troitskaya for her help with this sketch., so 0.5 Mpc20 Mpc. The magnetic field in filaments MF-in-fil is poorly known. Computer simulations Dolag indicate that G in cluster outskirts. It is quite nontrivial to satisfy the maximal-mixing conditions for very different energies, eV (VHE) and eV (UHE), simultaneously, especially given that the ALP-photon mixing is suppressed by Quantum-Electrodynamics effects for large values of the product , see Ref. FRT for details. Remarkably, these conditions are indeed satisfied, for both energy bands, in the local filament for GeV-1 and eV. It is hardly posiible to estimate ALP parameters more precisely before a firm magnetic-field model is constructed. This parameter range is allowed (see e.g. Ref. ST-mini ) by present experimental and astrophysical limits444Previous claims of the exclusion of a part of this parameter space from the lack of irregularities in gamma-ray spectra of sources embedded in the magnetic field of galaxy clusters have been recently shown to suffer from orders-of-magnitude systematic uncertainties irreg .. It narrows the range previously invoked for the explanation of the anomalous transparency of the Universe, see e.g. Ref ST-PRD . At the same time, it is within the reach of experiments of the near future, including solar axion telescopes TASTE TASTE and IAXO IAXO , as well as the laboratory experiment ALPS-IIc ALPS-IIc .
Because of small fields of view of IACTs, no survey of a significant part of the sky is available at TeV energies. Of the three lists we used for construction of control samples, the 3FHL catalog and the list of HiRes stereo events represent complete samples (that is, follow a known sky coverage). However, the TeVCat sample is constructed on the base of individual observations while non-detections are normally not published and the sky coverage cannot be quantitatively determined. Hence, it is not complete in this sense and may be biased. For the present analysis, however, this possible bias is conservative. Indeed, the anomalous blazars are defined in our VHE sample as those whose deabsorbed spectra harden right at the energy where the deabsorption correction becomes essential. We assume that the true intrinsic spectra of blazars are either power-law or concave since no physical reason for convexity at these energies is known. Suppose now that there is a region in the sky in which direction the Universe is anomalously transparent at high energies, that is the standard deabsorption results in too high fluxes at high energies (hardenings). Then those spectra which are power-law would be reconstructed with upward breaks; they join our signal sample . Intrinsically concave spectra would not exhibit hardening after deabsorption, but these objects would look brighter than physically similar sources observed in other directions in the sky. These stronger high-energy fluxes would make them more probable to enter the sample which consists of detected objects only. Interestingly, this is right what we observe: in Fig. 1, objects from the TeVCat sample without anomalies, represented by black dots, also have a tendency to concentrate towards directions with larger values of . In this context it is interesting to note that all three gamma-ray bursts detected at VHE and listed in TeVCat are also seen in the direction of the local filament, see Fig. 3 (we did not study whether they exhibit any kind of anomalies in their spectra). While the tendency is much weaker for the objects without hardenings than the effect we find for , it explains the conservative character of the TeVCat selection bias: the control sample contains many “signal” objects. We believe that this is the reason for the p-value for to be considerably larger than that for .
Future tests of the observed effect at VHE are expected to overcome this conservative bias. This may be cured when a more complete sample of VHE blazars, incuding non-detections, will be available, for instance, from the Cherenkov Telescope Array CTA . Another option is to develop a more sensitive method for the Fermi-LAT data. This instrument has a small effective area, as compared to IACTs, and presently only five blazars are significantly detected by LAT at the energies where the absorption is important gamma2 . Other statistical methods than used here should be applied in order to benefit from the Fermi-LAT full sky coverage. In future, the sensitivity in the Fermi-LAT band might be improved with low-threshold high-altitude IACTs 5x5 , e.g. ALEGRO ALEGRO .
Similarly to the VHE case, the list of BL Lacs used in Refs. HiRes271 ; BLL-HiRes is not complete: they were selected from serendipituous studies. While it is hard to account for this incompleteness, it can hardly have any relation to the local filament.
Further tests of the BL Lac/UHE-shower correlations are necessary before a study of the anisotropy of the effect can be performed with new data. Poor angular resolution of modern UHE cosmic-ray experiments555The resolution of both the Pierre Auger Observatory (Auger) and the Telescope Array (TA) experiments are roughly twice worse than that of HiRes stereo. makes it hard to test the correlation found in the HiRes data, though this may be partly compensated by large statistics. Corresponding estimates are given in Ref. BLfuture , assuming that the particles which caused air showers correlated with BL Lacs are similar to the bulk of the cosmic-ray particles with respect to their detection. Though the actual angular resolution of modern experiments differs from the one assumed at that time, notably for the hybrid mode, these numbers can be easily corrected. Unfortunately, the exceptional character of air showers induced by primary photons (or by any other hypothetical unusual particles – standard cosmic rays cannot correlate with distant BL Lacs) makes this approximation only partially relevant, while moving beyond the approximation requires internal information about experiments.
Indeed, the correlation was found in the data of a fluorescent detector (FD) working in the stereo mode. In principle, it should be tested with similar data. But Auger does not have the FD stereo reconstruction at all, while TA has quite low angular resolution in stereo: new FD telescopes are at larger distances from each other, compared to HiRes. When surface detectors (SD) are involved, one should take into account their different responses to unusual air showers (which are implied by the HiRes observation: neutral particles are required). When a correlation study is performed, potentially unusual events are compared to the bulk of cosmic rays. If the energy assigned to a primary photon by means of the bulk reconstruction is underestimated by a factor of , then the background for the correlation studies would be times larger, where is the index of the power-law integral spectrum. A correct account of this effect, which is in addition direction-dependent, requires the use of detailed information about experiments which is not publicly available.
The only attempt to test the HiRes BL Lac correlations with independent data was reported by Auger at a conference in 2007 Auger-BL . The Auger SD data were examined and no correlations with southern-sky BL Lacs were found. This analysis, in addition to the low statistics used, faces the SD problem discussed above. For instance, for photon-induced showers, the low response of water tanks leads to underestimation of the energies of primary photons, Billoir ; Nuhuil ; see Ref. FRT for a discussion. Large-statistics tests of the BL Lac correlations with the TA data are a necessary prerequisite for further studies of the effect reported here at UHE.
An important implication of the ALP explanation of the UHE correlations is that the correlated air showers are initiated by primary photons. Ref. BLfuture determines the fraction of the correlated events in a HiRes-like data set as 1.5% to 3.5% (at 95% CL). This translates into the flux km-2yr-1sr-1 for the HiRes field of view. We note that these values of are of the same order as current published 95% CL limits on the isotropic gamma-ray flux from Auger, km-2yr-1sr-1 AugerGammaFlux , and TA, km-2yr-1sr-1 for eV TAGammaLimit , and, taken at a face value, are in tension with the Auger limit of km-2yr-1sr-1 reported at a conference in 2019 Auger-ICRC2019-gamma . However, is a different quantity than which assumes isotropic diffuse flux, so a dedicated study is required to test the filament hypothesis. While independent from the anisotropy result presented in this paper, further searches for UHE photons would be important for its interpretation.
Appendix A Construction of the weighted density of galaxies
For the construction of the weighted density of galaxies in the local Universe, we follow the approaches developed and applied previously in the UHECR context, see e.g. Refs. UHE-LSS1 ; UHE-LSS2 ; UHE-LSS3 . We start from the flux-limited () complete catalog of galaxies with coordinates and radial velocities, the 2MASS Redshift Survey (2MRS) in its 2019 release, Refs. 2MASS1 ; 2MASS2 . Like in Ref. UHE-LSS3 , we select galaxies with luminosity distances666The catalog gives radial velocities which we convert to distances assuming the flat CDM cosmological model with , , km/s/Mpc. between 5 Mpc and 250 Mpc and attribute a weight to each galaxy. This weight is a product of and an additional factor which accounts for progressive incompleteness of the flux-limited catalog at large distances. This latter factor is calculated with the help of the “sliding-box” method described in detail in Ref. Hylke , adopting in turn Ref. sliding-old . Figure 5
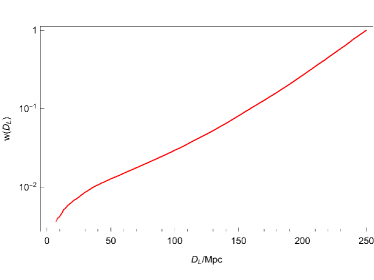
presents this factor as a function of .
In this way, we obtain a list of galaxies with their Galactic coordinates in the sky and their weights, , , where is the total number of galaxies with 5 Mpc Mpc and in the 2MRS catalog. The projected weighted density used in our analysis is a function of coordinates determined as a sum of these weights over all galaxies in a (smoothed) given direction. We consider two options of smoothing: the disk smoothing, equivalent to simple summing of within a cone of the opening angle centered on , so that the additional weight is
where is the angle between the directions and ; and the Gaussian-like smoothing with the additional weight function
Finally, we need to account for the zone of avoidance: the 2MRS catalog is complete for Galactic latitudes in the direction to the Galactic center, , and for for other Galactic longuitudes . We introduce an additional mask-related weight for every direction equal to the inverse integral of or over the sky. If this integral is zero, which may happen for small values of and a narrow band near the Galactic plane, the direction is dropped from the analysis. Various values of were used for this study, see Appendix C.
Appendix B Coordinates of anomalous sources
| name | |||
|---|---|---|---|
| 158.6 | 47.9 | 0.896 | 4C 55.17 |
| 123.7 | 58.8 | 0.847 | PG 1246586 |
| 199.4 | 78.4 | 0.725 | Ton 599 |
| 29.5 | 68.2 | 0.605 | PKS 1424240 |
| 305.1 | 57.1 | 0.536 | 3C 279 |
| 191.8 | 33.2 | 0.287 | 1ES 0414009 |
| 166.2 | 32.9 | 0.138 | 1ES 0806524 |
| 188.9 | 82.1 | 0.13 | 1ES 1215303 |
| 17.7 | 52.2 | 0.116 | PKS 2155304 |
| 350.4 | 32.6 | 0.071 | PKS 2005489 |
| name | |||
|---|---|---|---|
| 107.4 | 55.8 | 0.690 | RX J1359.85911 |
| 170.5 | 30.1 | 0.377 | TXS 0751485 |
| 211.2 | 69.0 | 0.360 | RX J1117.62548 |
| 191.1 | 42.5 | 0.354 | Ton 1015 |
| 141.6 | 75.1 | 0.234 | RBS 161 |
| 160.2 | 58.2 | 0.140 | RGB J1053494 |
| 98.0 | 17.7 | 0.047 | 1ES 1959650 |
| 174.2 | 41.9 | - | RBS 400 |
| 160.0 | 33.4 | - | RGB J0816576 |
| 91.8 | 52.0 | - | SBS 1508561 |
| 64.4 | 39.1 | - | RGB J1652403 |
Appendix C Account of multiple trials
In the present study, we do not assume any particular quantitative model of the anomalous transparency. While our results support the photon-ALP conversion on the magnetic field in the local filament, this field is poorly known. To which extent the number density of galaxies is a tracer of the filament field is also unknown. Quantitatively, this lack of direct relation is parametrized by the angular smoothing we introduce in the calculation of the weighted density. We choose to scan over the smoothing angular scale, in steps of , and to try both ways of smoothing described in Appendix A, treating the scan in the unknown parameter as multiple trials in our statistical study. As it is customary for the account of multiple trials, we first calculate the local p-value for each of the 50 variants of smoothing (two functions and 25 values of ), see Fig. 6.
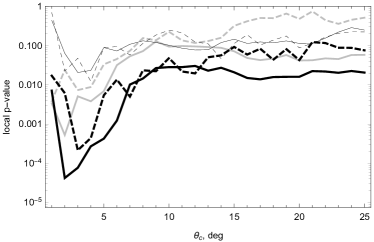
The minimal p-value, obtained for a certain variant of smoothing, is called the pre-trial p-value, .
The next step is necessary to directly estimate how often this or lower p-value can appear as a fluctuation because of the large number of trials. Were the trials statistically independent, this step would result in the multiplication of by the number of trials, 50 in our case. However, this is not the case here: different trials correspond to different versions of smoothing of one and the same distribution and hence are strongly statistically interdependent. We use the standard method of treating the multiple comparisons issue for non-independent data, see e.g. Ref. TT-penalty . We generate a large number, , Monte-Carlo samples which imitate the sample of anomalous sources, and repeat the procedure of calculating the local p-values and taking the minimal of them, , for each sample . The number of random samples for which determines the global, or post-trial, p-value, . This is interpreted as the probability that the distribution of weighted densities of galaxies in the directions to anomalous sources differs from that for all sources due to a random fluctuation for any assumed smoothing function. By definition, this is the probability that determines the significance of the rejection of the null hypothesis of isotropy in our analysis.
Acknowledgements.
The author is indebted to A. Korochkin, M. Kuznetsov, M. Libanov, A. Plavin, M. Pshirkov, V. Rubakov, G. Rubtsov and P. Tinyakov for illuminating and helpful discussions of various aspects of this study.References
- (1) A.I. Nikishov, Sov. Phys. JETP 14 (1962) 393 [ZhETF 41 (1962) 549].
- (2) M. G. Hauser and E. Dwek, Ann. Rev. Astron. Astrophys. 39 (2001), 249-307 [arXiv:astro-ph/0105539 [astro-ph]].
- (3) K. Mattila and P. Vaisanen, Contemp. Phys. 60 (2019), 23-44 [arXiv:1905.08825 [astro-ph.GA]].
- (4) R. Protheroe and H. Meyer, Phys. Lett. B 493 (2000), 1-6 [arXiv:astro-ph/0005349 [astro-ph]].
- (5) D. Horns and M. Meyer, JCAP 02 (2012), 033 [arXiv:1201.4711 [astro-ph.CO]].
- (6) G. Rubtsov and S. Troitsky, JETP Lett. 100 (2014), 355-359 [arXiv:1406.0239 [astro-ph.HE]].
- (7) A. Korochkin, G. Rubtsov and S. Troitsky, JCAP 12 (2019), 002 [arXiv:1810.03443 [astro-ph.HE]].
- (8) S. Abdollahi et al. [Fermi-LAT], Science 362 (2018), 1031-1034 [arXiv:1812.01031 [astro-ph.HE]].
- (9) A. Abeysekara et al. [VERITAS], Astrophys. J. 885 (2019) 150 [arXiv:1910.00451 [astro-ph.HE]].
- (10) J. Biteau and D. A. Williams, Astrophys. J. 812 (2015), 60 [arXiv:1502.04166 [astro-ph.CO]].
- (11) V. Acciari et al. [MAGIC], Mon. Not. Roy. Astron. Soc. 486 (2019), 4233-4251 [arXiv:1904.00134 [astro-ph.HE]].
- (12) H. Abdalla et al. [HESS], Astron. Astrophys. 606 (2017), A59 [arXiv:1707.06090 [astro-ph.HE]].
- (13) S. Troitsky, Phys. Rev. D 93 (2016), 045014 [arXiv:1507.08640 [astro-ph.HE]].
- (14) D. S. Gorbunov, P. G. Tinyakov, I. I. Tkachev and S. V. Troitsky, JETP Lett. 80, 145 (2004) [Pisma Zh. Eksp. Teor. Fiz. 80, 167 (2004)] [arXiv:astro-ph/0406654].
- (15) R. Abbasi et al. [HiRes], Astrophys. J. 610 (2004), L73 [arXiv:astro-ph/0404137 [astro-ph]].
- (16) P. G. Tinyakov and I. I. Tkachev, J. Exp. Theor. Phys. 106, 481 (2008) [arXiv:astro-ph/0612359].
- (17) E. Resconi et al. Mon. Not. Roy. Astron. Soc. 468, 597 (2017) [arXiv:1611.06022 [astro-ph.HE]].
- (18) R. U. Abbasi et al. [HiRes Collaboration], Astrophys. J. 636, 680 (2006) [arXiv:astro-ph/0507120].
- (19) R. Jansson and G. R. Farrar, JCAP 06, 017 (2008) [arXiv:0711.0177 [astro-ph]].
- (20) H. Martínez-Huerta, R. G. Lang and V. de Souza, Symmetry 12, 1232 (2020)
- (21) G. Rubtsov, P. Satunin and S. Sibiryakov, Phys. Rev. D 89 (2014), 123011 [arXiv:1312.4368 [astro-ph.HE]].
- (22) G. Rubtsov, P. Satunin and S. Sibiryakov, JCAP 05 (2017), 049 [arXiv:1611.10125 [astro-ph.HE]].
- (23) H. Abdalla and M. Bottcher, Astrophys. J. 865 (2018), 159 [arXiv:1809.00477 [astro-ph.HE]].
- (24) T. Dzhatdoev, E. Khalikov, A. Kircheva and A. Lyukshin, Astron. Astrophys. 603 (2017), A59 [arXiv:1609.01013 [astro-ph.HE]].
- (25) W. Essey, O. E. Kalashev, A. Kusenko and J. F. Beacom, Phys. Rev. Lett. 104 (2010), 141102 [arXiv:0912.3976 [astro-ph.HE]].
- (26) W. Essey, O. Kalashev, A. Kusenko and J. F. Beacom, Astrophys. J. 731, 51 (2011) [arXiv:1011.6340 [astro-ph.HE]].
- (27) K. Murase, C. D. Dermer, H. Takami and G. Migliori, Astrophys. J. 749, 63 (2012) [arXiv:1107.5576 [astro-ph.HE]].
- (28) H. Takami, K. Murase and C. D. Dermer, Astrophys. J. Lett. 771, L32 (2013) [arXiv:1305.2138 [astro-ph.HE]].
- (29) F. Tavecchio, Mon. Not. Roy. Astron. Soc. 438, 3255 (2014) [arXiv:1312.4281 [astro-ph.HE]].
- (30) Y. G. Zheng, C. Y. Yang and S. J. Kang, Astron. Astrophys. 585, A8 (2016) [arXiv:1607.03898 [astro-ph.HE]].
- (31) F. Tavecchio, P. Romano, M. Landoni and S. Vercellone, Mon. Not. Roy. Astron. Soc. 483, 1802 (2019) [arXiv:1810.07493 [astro-ph.HE]].
- (32) G. Raffelt and L. Stodolsky, Phys. Rev. D 37 (1988), 1237.
- (33) A. De Angelis, M. Roncadelli and O. Mansutti, Phys. Rev. D 76 (2007), 121301 [arXiv:0707.4312 [astro-ph]].
- (34) M. Simet, D. Hooper and P. D. Serpico, Phys. Rev. D 77, 063001 (2008) [arXiv:0712.2825 [astro-ph]].
- (35) C. Csaki, N. Kaloper, M. Peloso and J. Terning, JCAP 05 (2003), 005 [arXiv:hep-ph/0302030 [hep-ph]].
- (36) S. Troitsky, JETP Lett. 105 (2017), 55-59 [arXiv:1612.01864 [astro-ph.HE]].
- (37) M. Fairbairn, T. Rashba and S. V. Troitsky, Phys. Rev. D 84 (2011), 125019 [arXiv:0901.4085 [astro-ph.HE]].
- (38) A. Furniss, P. M. Sutter, J. R. Primack and A. Domínguez, Mon. Not. Roy. Astron. Soc. 446 (2015), 2267 [arXiv:1407.6370 [astro-ph.HE]].
- (39) D. Harari, S. Mollerach and E. Roulet, JHEP 08 (1999), 022 [arXiv:astro-ph/9906309 [astro-ph]].
- (40) D. Horns, L. Maccione, M. Meyer, A. Mirizzi, D. Montanino and M. Roncadelli, Phys. Rev. D 86 (2012), 075024 [arXiv:1207.0776 [astro-ph.HE]].
- (41) D. Wouters and P. Brun, JCAP 01 (2014), 016 [arXiv:1309.6752 [astro-ph.HE]].
- (42) H. B. J. Koers and P. Tinyakov, JCAP 0904, 003 (2009) [arXiv:0812.0860 [astro-ph]].
- (43) R. Abbasi et al., Astrophys. J. 713 (2010), L64-L68 [arXiv:1002.1444 [astro-ph.HE]].
- (44) T. Abu-Zayyad et al. [Telescope Array], Astrophys. J. 757 (2012), 26 [arXiv:1205.5984 [astro-ph.HE]].
- (45) J. P. Huchra et al., Astrophys. J. Suppl. 199 (2012), 26 [arXiv:1108.0669 [astro-ph.CO]].
- (46) L. Macri et al., Astrophys. J. Suppl. 245 (2019), 6 [arXiv:1911.02944 [astro-ph.GA]].
- (47) D. Lynden-Bell, Mon. Not. Roy. Astron. Soc. 155 (1971), 95
- (48) H. B. Koers and P. Tinyakov, Mon. Not. Roy. Astron. Soc. 399 (2009), 1005 [arXiv:0907.0121 [astro-ph.CO]].
- (49) H. M. Courtois, D. Pomarede, R. B. Tully and D. Courtois, Astron. J. 146 (2013), 69 [arXiv:1306.0091 [astro-ph.CO]].
- (50) P. Tinyakov and I. Tkachev, Phys. Rev. D 69 (2004), 128301 [arXiv:astro-ph/0301336 [astro-ph]].
- (51) S. P. Wakely and D. Horan, Proc. 30th International Cosmic Ray Conference, Mexico (2004) 3, 1341. Available at http://tevcat.uchicago.edu.
- (52) M. Ajello et al. [Fermi-LAT], Astrophys. J. Suppl. 232 (2017), 18 [arXiv:1702.00664 [astro-ph.HE]].
- (53) A. Korochkin and G. Rubtsov, Mon. Not. Roy. Astron. Soc. 481 (2018), 557-565 [arXiv:1712.06579 [astro-ph.GA]].
- (54) F. Govoni et al., Science 364 (2019), 981.
- (55) K. Dolag, D. Grasso, V. Springel and I. Tkachev, JCAP 0501 (2005), 009 [arXiv:astro-ph/0410419].
- (56) M. Libanov and S. Troitsky, Phys. Lett. B 802 (2020), 135252 [arXiv:1908.03084 [astro-ph.HE]].
- (57) V. Anastassopoulos et al. [TASTE], JINST 12 (2017), P11019 [arXiv:1706.09378 [hep-ph]].
- (58) E. Armengaud et al. [IAXO], JINST 9 (2014), T05002 [arXiv:1401.3233 [physics.ins-det]].
- (59) R. Bahre et al. [ALPS], JINST 8 (2013), T09001 [arXiv:1302.5647 [physics.ins-det]].
- (60) G. Dubus et al. [CTA consortium], Astropart. Phys. 43 (2013), 317-330 [arXiv:1208.5686 [astro-ph.HE]].
- (61) F. Aharonian, A. Konopelko, H. Volk and H. Quintana, Astropart. Phys. 15 (2001), 335-356 [arXiv:astro-ph/0006163 [astro-ph]].
- (62) A. Bykov et al., Tech. Phys. 62 (2017), 819-836
- (63) D. S. Gorbunov, P. Tinyakov, I. Tkachev and S. V. Troitsky, JCAP 01 (2006), 025 [arXiv:astro-ph/0508329 [astro-ph]].
- (64) D. Harari [The Pierre Auger Collaboration], arXiv:0706.1715 [astro-ph].
- (65) P. Billoir, C. Roucelle and J. C. Hamilton, arXiv:astro-ph/0701583.
- (66) O. E. Kalashev, G. I. Rubtsov and S. V. Troitsky, Phys. Rev. D 80, 103006 (2009) [arXiv:0812.1020 [astro-ph]].
- (67) A. Aab et al. [Pierre Auger], JCAP 04 (2017), 009 [erratum: JCAP 09 (2020), E02] [arXiv:1612.01517 [astro-ph.HE]].
- (68) R. U. Abbasi et al. [Telescope Array], Astropart. Phys. 110, 8 (2019) [arXiv:1811.03920 [astro-ph.HE]].
- (69) J. Rautenberg [Pierre Auger], PoS ICRC2019, 398 (2020)