Connecting shear localization with the long-range correlated polarized stress fields in granular materials
Abstract
One long-lasting puzzle in amorphous solids is shear localization, where local plastic deformation involves cooperative particle rearrangements in small regions of a few inter-particle distances, self-organizing into shear bands and eventually leading to the material failure. Understanding the connection between the structure and dynamics of amorphous solids is essential in physics, material sciences, geotechnical and civil engineering, and geophysics. Here we show a deep connection between shear localization and the intrinsic structures of internal stresses in an isotropically jammed granular material subject to shear. Specifically, we find strong (anti)correlations between the micro shear bands and two polarized stress fields along two directions of maximal shear. By exploring the tensorial characteristics and the rotational symmetry of force network, we reveal that such profound connection is a result of symmetry breaking by shear. Finally, we provide the solid experimental evidence of long-range correlated inherent shear stress in an isotropically jammed granular system.
School of Physics and Astronomy, Shanghai Jiao Tong University, 800 Dong Chuan Road, Shanghai 200240, China
Institute of Natural Sciences, Shanghai Jiao Tong University, Shanghai 200240, China
Collaborative Innovation Center of Advanced Microstructures, Nanjing 210093, China
* Email: jiezhang2012@sjtu.edu.cn
Introduction
Shear localization, in which local particle rearrangements appear in narrow regions of a few inter-particle distances, is a fascinating feature that not only appears in granular materials 1; 2; 3; 4 but also is shared by many other amorphous solids 5, such as molecular glass6, metallic glass 7, colloids8; 9; 10, emulsions 11 and foams 12. It is not only crucial to material research but also vital to the catastrophic failure of soils in geotechnical and civil engineering 13, and the control of geo-hazards 14. Shear localization in amorphous solids remains under intense debate due to the disordered nature of materials; its ubiquity requires a general explanation. One important issue is regarding the initial shear localization when a homogeneous and isotropic amorphous solid is subject to shear. In particular, experiments on sand 2 and two-dimensional (2D) granular materials 4 show that when a strain much smaller than the yield strain is applied, it appears immediately, showing self-organized spatial structures. The nature of the cooperation remains elusive.
The cooperative particle rearrangement implies long-range correlations, which are incorporated in microscopic theories 15; 16; 17; 18 in two different means. Both theories assume that local plastic particle rearrangements act like Eshelby inclusions 19, causing anisotropic and long range effects to their surrounding elastic media. The first theory is formulated on a dynamical basis: an avalanche of Eshelby inclusions leads to the shear-band formation 15; 16; 17. However, the recent granular experiment 4 shows no compelling evidence of the correlation between local stress drop and particle rearrangement, raising concerns of the relevance of the theory to granular materials, especially at the beginning of shear. The second theory is a mean-field theory based on an energy-minimization principle 18. However, it is unclear how the force chains and dissipation in granular materials would corporate with the theory. On the other hand, numerical works 20; 21; 22 observe that despite that the correlation of pressure is short range, the spatial correlation of inherent shear stress has an intrinsic quadrupolar anisotropy and a long-range power-law decay in dimensions, which is explained by a scaling argument assuming mechanical equilibrium and isotropy of amorphous solids 23. Moreover, this observation is explained using field theories 24; 25; 26. However, experimental evidence is still missing. Besides, it is equally missing which role and to what extent the long-range stress correlation may play in the shear dynamics. Considering that the spatial correlation of stresses provides a quantification of force network in granular materials 27; 28, it is natural to conjecture the missing role played by force network in the shear dynamics of isotropically jammed granular materials.
In this article, we address experimentally the connection between the shear localization and long-range correlated pseudo stress-chains at the beginning of shear. To this purpose, we study an isotropically jammed granular materials, consisting of bi-disperse photoelastic disks, subject to pure shear. We observe that micro shear bands occur right at the start of shear, generating those self-organized cooperative particle rearrangements. We find that there is a strong connection between the particle rearrangements and the pseudo stress-chains, as can be quantified by the correlation between the particle-rotation field and the polarized stress field along the directions of shear, . Further analysis on for arbitrary angles verify the infinite degeneracy of these long-range correlated polarized stress, showing a continuous rotational symmetry. Hence, we understand the deep connection between the dynamics of shear localization and the structure of pseudo stress-chains as symmetry breaking by shear. Moreover, we observe that the chain-like characteristics of the polarized stress is quantitatively captured in the scaling anisotropy of its autocorrelation , which shows a power law decay slower than along the chain direction and faster than perpendicular to the chain direction. Surprisingly, the azimuthal averaged harmonic projection of the autocorrelation function
| (1) |
decays as a power law of , which is still consistent with the continuum description of the stress chains in the theories23; 24; 25; 26. Finally, we verify that the autocorrelations of inherent shear stress show a quadrupole-like pattern with a power law decay of , providing the experimental evidence of the theoretical predictions 23; 24; 25; 26.
Results
0.1 Initial shear localization.
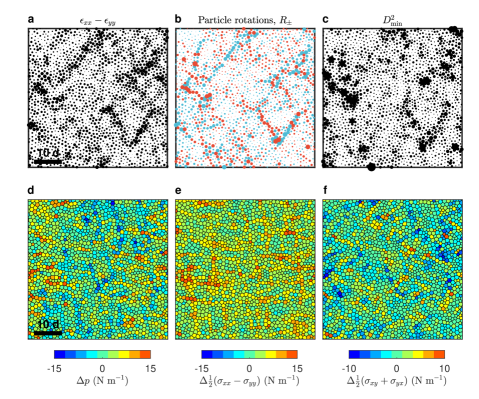
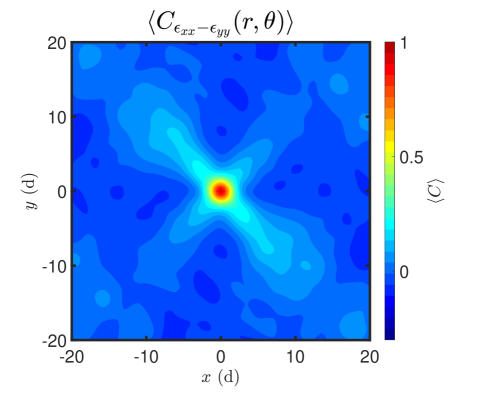
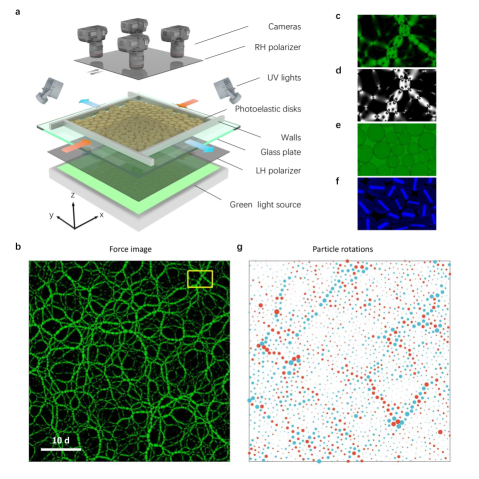
We first prepare an isotropic jammed packing using a biaxial apparatus shown in Fig. 1a, then apply pure shear quasi-statically in steps by compressing along axis and expanding along axis while keeping the area fixed. More experimental details can be seen in Methods. Surprisingly, shear localization appear at a strain much smaller than the yield strain , as shown in Fig. 1g. Here we use particle rotations to characterize shear localization, whose pattern is similar with local shear strain and 29, as shown in the Supplementary Figure 1. Local shear strain describes the affine deformation of the nearest neighbors of a particle, and quantifies the degree of the nonaffine displacement of the particle relative to its nearest neighbors by subtracting its affine displacement. Particles rotating clockwise tend to align cooperatively in bands along the direction, whereas those rotating counterclockwise tend to align in bands along the direction, which leads to a quadrupole-like long-range correlator of local strain, as shown in the Supplementary Figure 2, consistent with previous experiments of colloids 8; 9; 10 and 3D granular materials 2.
In contrast, spatial distributions of local stress changes are rather homogeneous without obvious correlation with particle rearrangements, as shown in the Supplementary Figure 1. As discussed in detail in the introduction, microscopic theories 15; 16; 17; 18 can not fully explain the emergent behaviors of shear localization seen in Fig. 1g, which shows organized spatial structures of particle rotation with long range correlation. It is a great challenge to understand the emergence of those self-organized, cooperative particle rearrangements in the seemingly disordered granular material. Recall that recent simulations and theories show the exhibition of long-range correlated shear stress of inherent structures in amorphous solids, including granular materials 23; 24; 25; 26, though no experimental evidence has been found yet, in particular, not in granular materials. If it does exist, such as in the force-chain network shown in Fig.1b, it is urgent to unravel the possible connection between the force network structure and the particle dynamics.
0.2 Polarized stress fields.
To reveal this connection, we first define the Cauchy stress tensor of individual particle in the initial state,
| (2) |
Here is the position vector from the center of disk to the contact point between disks and , is the contact-force vector between disks and , is the area of the Voronoi cell of disk , the operator ’’ represents the dyadic product of two vectors, and the index runs over all disks in contact with disk . In an arbitrary Cartesian axes , of an angle with respect to the laboratory axes , the stress tensor is given by,
| (3) |
0.3 Correlation between structure and dynamics.
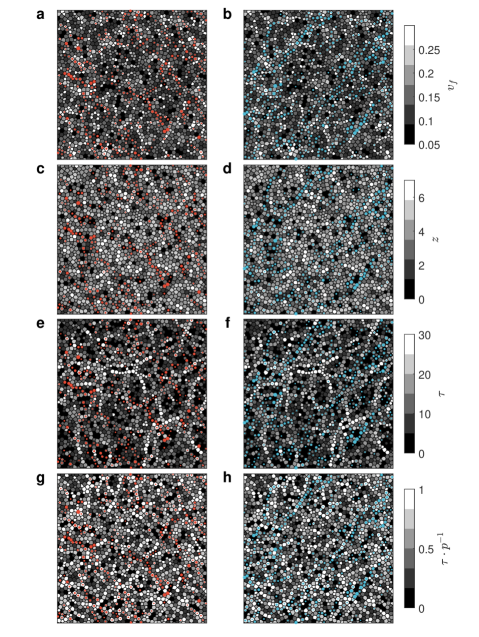
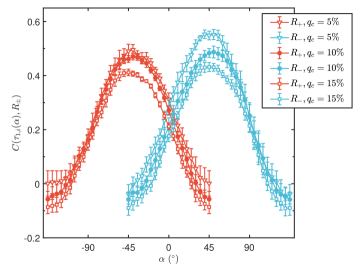
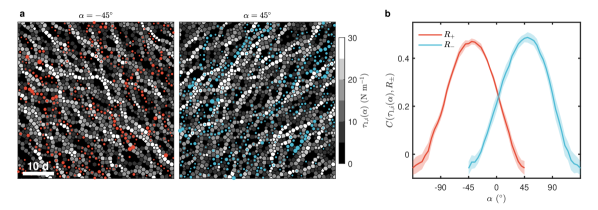
Remarkably, we found strong correlations between the micro-bands and the spatial distributions of normal stress along , as shown in Fig. 2a. We denote the normal stress along direction as the polarized stress , showing chain-like structures, which we call pseudo stress-chains. We denote the field of of all disks as . The micro bands, i.e. those cooperative particle motions, just locate within the inter-spaces of pseudo stress-chains in the two polarized stress fields with angles along directions of maximal shear. At the same time, other quantities, including free volume, contact number and deviatoric shear stress, show weak correlations with the micro-bands, as shown in Supplementary Figure 3. To quantify the correlations, we compute the correlation function following Ref. 30. We choose the particles of top (counterclockwise and clockwise ) rotations, then the median value of the polarized stress of these particles and the cumulative distribution functions (CDF) of give the correlation as . The results are shown in Fig. 2b, where the peak values are around , as expected. In the above calculation of the correlation functions, changing the cutoff (top 10%) of the particle rotation has little influence on the results, as shown in Supplementary Figure 4.
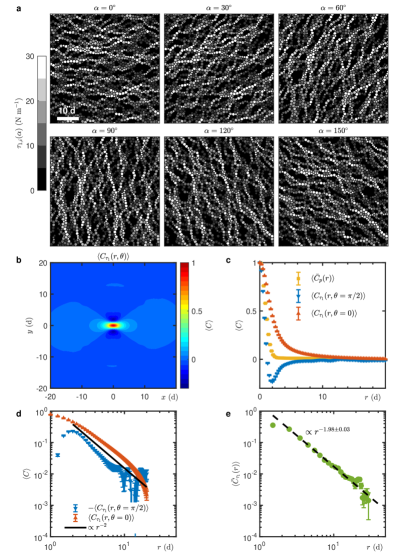
0.4 Symmetry and long-range characteristics of stress fields.
From the symmetry perspective, the two polarized stress fields of along are by no means special owing to the rotational symmetry of the isotropically jammed packing as shown in Fig. 1b. Six more polarized stresses of are shown in Fig. 3a, showing filamentary, pseudo stress-chains preferentially aligned along the orientation of polarized angle . This long-range character is quantified using an autocorrelation function of coarse-grained polarized stress 21; 31, showing a dipolar signature in Fig. 3b, similar with the pressure or force magnitude autocorrelations in shear-jammed granular systems 27; 32. Compared to the short-range correlation of local pressure, as shown in Fig. 3c, decays much slower along a cut in the dipolar direction. One prominent feature of the correlator of polarized stress is the anisotropy of the scaling property, as shown in the log-log plot in Fig. 3d: the correlation function decays slower than along the direction of the stress chains, i.e. ; it decays much faster than along the direction perpendicular to the direction of stress chains, i.e. . Nonetheless, a power-law fit of , yields an exponent as shown in Fig. 3e, which indicates that an azimuthally averaged harmonic projection of the correlation function does show the scaling consistent with the field theoretical predictions of in 2D systems for the description of stress chains in the continuum limit 23; 24; 25; 26. A finite-size analysis of is given in the Supplementary Figure 5a. By definition, for an isotropically jammed packing, where is the Voronoi area of disks . Here is the pressure of whole system. Owing to the continuous rotational symmetry, there is an infinite degeneracy of such long-range correlated polarized stress fields . Thus, the emergence of shear localization, i.e. micro bands along , can be understood as the breaking of the continuous rotational symmetry by shear.
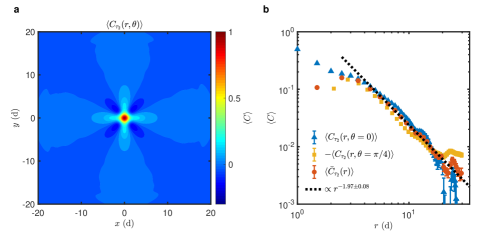
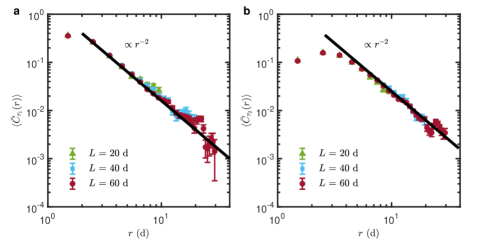
Compared to the polarized stress , in literature 23; 24; 25; 26, much attention has been paid to the quantity , the so called inherent shear stress, due to the anisotropy and long-range characteristics in its spatial autocorrelation despite that no experimental evidence has been reported thus far 23; 24; 25; 26. First note that the is directly related to the polarized stress at individual particles by . Next, we present the spatial autocorrelation map of shear stress , which indeed supports the theories 23; 24; 25; 26. The autocorrelation map clearly shows a quadrupole-like pattern with symmetry, as shown in Fig. 4a, consistent with theories 23; 24; 25; 26. To verify the power-law decay of the correlation function, cuts along the lobes and an appropriate spherical harmonics projection
| (4) |
are shown in Fig. 4b. A power-law fit of give the exponent , consistent with the theoretical prediction in 2D system 23; 24; 25; 26. A finite-size analysis of is given in the Supplementary Figure 5b. The deviation within , corresponds to the breakdown of continuum medium 33; 34.
Discussion
To conclude, we find the collective particle rearrangements of the emergent behavior of shear localization in an isotropically jammed granular material are closely related to the pseudo stress-chains in the polarized stress fields for along the directions of shear. The emergence of shear localization is associated with the breaking of the continuous rotational symmetry by shear. This mechanism is based on symmetry and the long-range character of internal stress without invoking the Eshelby mechanisms, which could also be applied to other amorphous solids. Statistically, the long-range characteristic of the internal stress are revealed from either the spatial correlations of polarized stress or the inherent shear stress , which provides the direct experimental evidence of theoretical predictions 23; 24; 25; 26. The present work serves as a starting point to understand more complicated dynamical processes of the evolution of shear localization. As strain increases, especially near the yielding, we suspect that Eshelby processes may contribute to the evolutions of shear localization and the development of global shear bands, which will be an important subject in future studies.
0.5 Experimental details.
In this experiment, we use a biaxial apparatus to apply isotropic compression or pure shear on a two-dimensional granular system. The apparatus mainly consists of a rectangular frame mounted on top of a powder-lubricated glass plate with four walls that can move symmetrically with a motion precision of 0.1 mm while keeping the center of mass fixed. The basal friction coefficient is around 0.3. We estimate that the force magnitude of the basal friction is about times smaller compared to the typical contact-force magnitude. Hence the basal friction is negligible. The rectangular area is filled with a random mixture of 2680 bi-disperse photoelastic disks (Vishay PSM-4) of with diameters of 1.4 cm and 1.0 cm and a number ratio of 1:1 to create various unjammed random initial configurations. The four narrow bands between these photoelastic disks and mobile walls are padded using a set of 300 small and 300 large bi-disperse Teflon-taped metal disks of the same sizes of the photoelastic disks. The friction coefficient is less than 0.1 between the Teflon-taped metal disks and the Teflon-taped mobile walls, which eliminates substantially the collective rotational motion of individual disks near the boundaries. Next, we apply isotropic compression to achieve packing at particular pressure levels. To minimize the potential inhomogeneity of force chains in the jammed packing, we constantly apply mechanical vibrations in random directions of the horizontal plane before the packing fraction (the ratio between the area of disks and that of the system) exceeds the jamming point of frictionless particles 35. At the top, an array of 2 times 2 high-resolution (100 pixel per cm) cameras are aligned and synchronized. Figure 1b shows one merged image of force-chain network of an isotropic jammed packing based on the pre-calibration of four cameras. The packing in Fig. 1b is confined in a square domain of 67.2 cm times 67.2 cm. Here, , the mean coordination number is around 4.1, and the pressure is around 11 N m-1.
We then apply pure shear quasi-statically in steps by compressing along axis and expanding along axis while keeping the area fixed. The step size is 0.5 mm, resulting the change of the strain. At each step, three different images are recorded as shown in Fig. 1. Disk positions are obtained using the normal image. Hough transformation is used to detect the particle position with a sub-pixel resolution. A UV image is taken for tracking individual particle rotation during shear, whose uncertainty is less than 0.02 rad. Contact forces are analyzed from the force-chain image using force-inverse algorithm, which generates a computed force-chain image based on an initial guess of contact forces, and then iterate contact forces to minimize the difference between experimental and computed force-chain image 27; 36; 37. The relative error of contact force measurement is around 3-4% for the typical force magnitude, and the accuracy of contact forces is checked by plotting a computed image for comparison as shown in Fig. 1d.
0.6 Data availability.
The datasets generated during and/or analysed during the current study are available from the corresponding author on reasonable request.
References
References
- 1 Amon, A., Nguyen, V. B., Bruand, A., Crassous, J. & Clément, E. Hot spots in an athermal system. Phys. Rev. Lett. 108, 135502 (2012).
- 2 Le Bouil, A., Amon, A., McNamara, S. & Crassous, J. Emergence of cooperativity in plasticity of soft glassy materials. Phys. Rev. Lett. 112, 246001 (2014).
- 3 Denisov, D. V., Lorincz, K. A., Uhl, J. T., Dahmen, K. A. & Schall, P. Universality of slip avalanches in flowing granular matter. Nat. Commun. 7, 10641 (2016).
- 4 Zheng, J., Sun, A., Wang, Y. & Zhang, J. Energy fluctuations in slowly sheared granular materials. Phys. Rev. Lett. 121, 248001 (2018).
- 5 Nicolas, A., Ferrero, E. E., Martens, K. & Barrat, J.-L. Deformation and flow of amorphous solids: Insights from elastoplastic models. Rev. Mod. Phys. 90, 045006 (2018).
- 6 Albaret, T., Tanguy, A., Boioli, F. & Rodney, D. Mapping between atomistic simulations and eshelby inclusions in the shear deformation of an amorphous silicon model. Phys. Rev. E 93, 053002 (2016).
- 7 Wang, W. H. The elastic properties, elastic models and elastic perspectives of metallic glasses. Prog. Mater. Sci. 57, 487–656 (2012).
- 8 Chikkadi, V., Wegdam, G., Bonn, D., Nienhuis, B. & Schall, P. Long-range strain correlations in sheared colloidal glasses. Phys. Rev. Lett. 107, 198303 (2011).
- 9 Jensen, K. E., Weitz, D. A. & Spaepen, F. Local shear transformations in deformed and quiescent hard-sphere colloidal glasses. Phys. Rev. E 90, 042305–042305 (2014).
- 10 Illing, B. et al. Strain pattern in supercooled liquids. Phys. Rev. Lett. 117, 208002 (2016).
- 11 Desmond, K. W. & Weeks, E. R. Measurement of stress redistribution in flowing emulsions. Phys. Rev. Lett. 115, 098302 (2015).
- 12 Kabla, A. & Debrégeas, G. Local stress relaxation and shear banding in a dry foam under shear. Phys. Rev. Lett. 90, 258303 (2003).
- 13 Terzaghi, K., Peck, R. B. & Mesri, G. Soil mechanics in engineering practice (John Wiley & Sons, 1996).
- 14 Scholz, C. H. The mechanics of earthquakes and faulting (Cambridge University Press, 2019).
- 15 Langer, J. Microstructural shear localization in plastic deformation of amorphous solids. Phys. Rev. E 64, 011504 (2001).
- 16 Maloney, C. E. & Lemaître, A. Amorphous systems in athermal, quasistatic shear. Phys. Rev. E 74, 016118 (2006).
- 17 Tanguy, A., Leonforte, F. & Barrat, J. L. Plastic response of a 2d lennard-jones amorphous solid: Detailed analysis of the local rearrangements at very slow strain rate. Eur. Phys. J. E 20, 355–364 (2006).
- 18 Dasgupta, R., Hentschel, H. G. E. & Procaccia, I. Microscopic mechanism of shear bands in amorphous solids. Phys. Rev. Lett. 109, 255502 (2012).
- 19 Eshelby, J. D. The determination of the elastic field of an ellipsoidal inclusion, and related problems. Proc. R. Soc. Lond. 241, 376–396 (1957).
- 20 Chowdhury, S., Abraham, S., Hudson, T. & Harrowell, P. Long range stress correlations in the inherent structures of liquids at rest. J. Chem. Phys. 144, 124508 (2016).
- 21 Lemaître, A. Inherent stress correlations in a quiescent two-dimensional liquid: Static analysis including finite-size effects. Phys. Rev. E 96, 052101 (2017).
- 22 Maier, M., Zippelius, A. & Fuchs, M. Emergence of long-ranged stress correlations at the liquid to glass transition. Phys. Rev. Lett. 119, 265701 (2017).
- 23 Lemaître, A. Stress correlations in glasses. J. Chem. Phys. 149, 104107 (2018).
- 24 Henkes, S. & Chakraborty, B. Statistical mechanics framework for static granular matter. Phys. Rev. E 79, 061301 (2009).
- 25 DeGiuli, E. Edwards field theory for glasses and granular matter. Phys. Rev. E 98, 033001 (2018).
- 26 DeGiuli, E. Field theory for amorphous solids. Phys. Rev. Lett. 121, 118001 (2018).
- 27 Majmudar, T. S. & Behringer, R. P. Contact force measurements and stress-induced anisotropy in granular materials. Nature 435, 1079–82 (2005).
- 28 Ostojic, S., Somfai, E. & Nienhuis, B. Scale invariance and universality of force networks in static granular matter. Nature 439, 828–830 (2006).
- 29 Falk, M. & Langer, J. Dynamics of viscoplastic deformation in amorphous solids. Phys. Rev. E 57, 7192 (1998).
- 30 Patinet, S., Vandembroucq, D. & Falk, M. L. Connecting local yield stresses with plastic activity in amorphous solids. Phys. Rev. Lett. 117, 045501 (2016).
- 31 Goldhirsch, I. & Goldenberg, C. On the microscopic foundations of elasticity. Eur. Phys. J. E 9, 245–251 (2002).
- 32 Lois, G. et al. Stress correlations in granular materials: An entropic formulation. Phys. Rev. E 80, 060303 (2009).
- 33 Schirmacher, W. The boson peak. Phys. Status Solidi B 250, 937–943 (2013).
- 34 Wang, Y., Hong, L., Wang, Y., Schirmacher, W. & Zhang, J. Disentangling boson peaks and van hove singularities in a model glass. Phys. Rev. B 98, 174207 (2018).
- 35 O’Hern, C. S., Silbert, L. E., Liu, A. J. & Nagel, S. R. Jamming at zero temperature and zero applied stress: The epitome of disorder. Phys. Rev. E 68, 011306 (2003).
- 36 Daniels, K. E., Kollmer, J. E. & Puckett, J. G. Photoelastic force measurements in granular materials. Rev. Sci. Instrum. 88, 051808 (2017).
- 37 Abed Zadeh, A. et al. Enlightening force chains: a review of photoelasticimetry in granular matter. Granul. Matter 21, 83 (2019).
J.Z. acknowledges the support from National Natural Science Foundation of China under (No.11774221 and No. 11974238)
Y.Q.W performed the experiment and carried out the data analyses. J.Z. designed the experimental project. Y.Q.W., Y.J.W. and J.Z. contributed in writing the manuscript and interpreting the data.
The authors declare no competing interests.
Correspondence and requests for materials should be addressed to J.Z. (email: jiezhang2012@sjtu.edu.cn).
Supplementary Information