Structural dynamics in thermal-treatment of amorphous indium-oxide films
Abstract
Thermally-treating amorphous indium-oxide films is used in various basic studies as a means of tuning the system disorder. In this process the resistance of a given sample decreases while its amorphous structure and chemical composition is preserved. The main effect of the process is an increase in the system density which in turn leads to improved interatomic overlap which is easily detected as improved conductivity. A similar effect has been observed in studies of other amorphous systems that were subjected to pressure. In the current work we show that the Raman spectra of amorphous indium-oxide change in response to thermal-treatment in a similar way as in pressure experiments performed on other disordered and amorphous systems. We present a study of how thermal-treatment changes the system dynamics by monitoring the resistance versus time of indium-oxide films following various stages of thermal-treatment. The time dependence of the sample resistance fits the stretched exponential law with parameters that change systematically with further annealing. Implication of these results to slow dynamics phenomena that are governed by the Kohlrausch’s law are discussed.
keywords:
Amorphous materials, Thermal-treatment, Stretched-exponential relaxation0.1 Introduction
Understanding the properties of amorphous solids has been a great intellectual endeavor. The lack of long-range periodicity presents a challenge to theory, and the non-equilibrium nature of the systems adds another layer of complexity. In addition to lack of long-range order, most amorphous solids exhibit mass density that is lower than their crystalline counterpart. This is presumably due to their being formed by a fast cooling from the liquid or gaseous phase. The latter preparation method, quench-cooling the material from the vapor phase onto a cold substrate, usually results in a spongy structure that has many micro-voids reducing the material bulk specific gravity. Consequently, an appreciable volume change may be affected in these structures upon application of pressure. Indeed, amorphous systems often show considerable volume-change V under pressure; relative volume shrinkage V/V exceeding 15% was observed in a number of studies [1, 2, 3, 4, 5, 6, 7, 8, 9, 10, 11, 12, 13].
It was recently shown [14] that similar densification may be affected by thermally-treating amorphous indium-oxide InO films. The protocol used a cycle of heating-cooling on vapor-deposited films and demonstrated a volume change of up to 20%. At the same time, a change of several orders of magnitude of the film resistance at room-temperature was observed in this low carrier-concentration version of InO [15].
In addition to the similarity between the effects produced by pressure and thermal-treatment, in terms of densification, both protocols seem to share a peculiar after-effect; upon relief of pressure, and after cooling-back to room-temperature in the thermal-treatment protocol, the system volume slowly crept back up towards its initial value. This ”swelling” effect was observed in the time dependence of the optical-gap of glasses following pressure relief [7, 14]. In our previous study of InO films the effect was observed in the time-dependence of the optical-gap and the system resistance studied in-situ after the thermal-treatment is terminated [14].
Previous thermal-treatment experiments [14] were performed using versions of InO with relatively small deviations from the InO stoichiometry of the ionic compound. In this work we use indium-richer version of InO with larger carrier-concentration N. This version is commonly used in superconductor-insulator transitions studies [16]. It exhibits the main features of all InO versions in having the flexibility of being able to modify its volume by heat-treatment and thus fine-tune its resistance while the relatively high carrier-concentration (N 5x10cm). This makes it possible to observe superconductivity at liquid-helium temperatures once the system disorder is low enough. The InO system affords a wide range of carrier-concentration (while keeping the Fermi energy in the conduction-band) with N as low as 8x10cm to N10cm. The carrier-concentration of InO is essentially determined by the In/O ratio during material deposition [17]. Due to its high carrier-concentration, the as-prepared film of the material naturally has much lower resistivity than InO films with N10cm. The amount by which the room-temperature resistivity of the sample could be reduced by thermal treatment is accordingly more modest; it is rarely more than a factor of 4. On the other hand the accompanying relative change in other physical properties, per change in resistivity, is actually larger [15].
Taking advantage of this sensitivity and the large response this material exhibits in Raman scattering, we study how the boson-peak changes with response to the thermal-treatment procedure used in taming the system disorder. The boson-peak is a feature that appears in Raman spectra of disordered systems as a peculiar broad peak at 10-100 cm[18, 19, 20, 21, 22]. The magnitude of the boson-peak, characteristically observed in glasses, decreases with pressure [22]. As it will be shown below, the same occurs upon thermally treating InO samples further supporting the similarity between applying pressure and thermal treatment of glasses [14]. We note however that the time dependence of the Raman spectra while pressure is applied or after its release was not yet studied. To our knowledge this aspect has not been studied in any glassy system probably due to technical difficulty. By contrast, monitoring the resistance is an extremely sensitive measure of the structural change associated with densification of InO as demonstrated in [14, 15]. Resistance measurement is also a fast process which allows tracking these changes in real time.
A special emphasis is given in this work to the ‘after-effect’ mentioned above where the resistance of the samples slowly increases after the heat-treatment has ended and the sample temperature returned to its pre-treatment value. The behavior of the resistance during this period has a mechanical analogue; The volume of a ‘memory-foam’ that has endured the squashing effect of a heavy object will show qualitatively similar time-dependence as R(t) after the heat is turned off. In particular, it will swell back towards its original volume, partly as a rather fast change when the weight is lifted followed by a much slower process.
The time dependence of the swelling phenomenon, as reflected in the sample resistance, fits a stretched-exponential law. A systematic study of how this law changes with consecutive annealing-cycles reveals that the in addition to densification, the rate distribution that determines the slow structural dynamics becomes narrower. The implication of these results for data analysis of glass dynamics and transport studies are discussed.
0.2 Samples preparation and characterization
The InO films used here were e-gun evaporated onto room-temperature substrates using 99.999% pure InO sputtering-target. Undoped Silicon wafers were used as substrates for both, electrical measurements and Raman spectroscopy measurements. Deposition was carried out at the ambience of 30.5x10 Torr oxygen pressure maintained by leaking 99.9% pure O through a needle valve into the vacuum chamber (base pressure 10 Torr). Rates of deposition were 1.4-2.5 Å/s. With this range of rate-to-oxygen-pressure, the InO samples had carrier-concentration N in the range (6-25)x10cm measured by Hall-Effect at room-temperature. Note that the carrier-concentration of the samples used in the previous study was considerably lower [14].The evaporation source to substrate distance in the deposition chamber was 45cm. This yielded films with thickness uniformity of 2% across a 2x2cm area. Lateral sizes of samples used for transport measurements was typically 1x2mm (width x length respectively), and 1x1cm for the Raman spectroscopy. The films thickness of the samples used for transport measurements was 51010 Å.
The as-deposited samples typically had sheet-resistance R□ of the order of (5-10)x10 at room-temperatures, much smaller than the films with the lower carrier-concentrations used before. This was usually the starting stage for the thermal-treatment cycles performed on each preparation batch (3 different batches were used in the study). A description of the annealing process will be described in the next section. Details of the changes in the material microstructure in the process of thermal-treatment are described elsewhere [14, 15].
0.3 Measurements methods
After removal from the deposition chamber, the sample was mounted onto a heat-stage in a small vacuum cell wired to make contacts with the sample for electrical measurements and a thermocouple thermometer attached to the sample-stage. The cell used for monitoring the sample resistance and temperature had a light-weight made of 0.2mm copper-sheet equipped with a thermofoil™ heating-strip on its back side. The characteristic time to reach 90% of the asymptotic temperature after applying power to the heating-element was typically 300s for the range of temperatures used in this work.
Copper wires were soldered to indium contacts pressed into the sample strip to facilitate resistance measurements. These were performed by a two-terminal technique using either the computer-controlled HP34410A multimeter or the Keithley K617.
Raman spectra were taken with a Renishaw inVia Reflex Spectrometer using a laser beam with either 514 nm or 785 nm wavelength and edge-filter at 70cm.
1 Results and discussion
1.1 The thermal treatment protocol
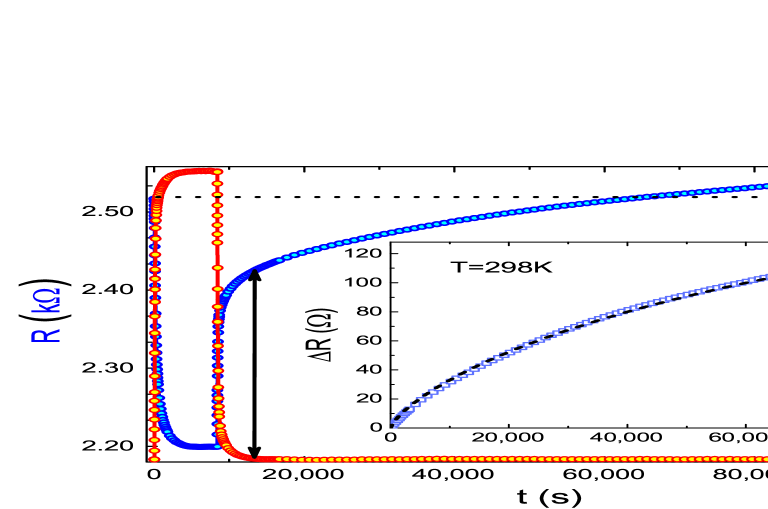
The protocol for thermally-treating InO samples is composed of the following steps: The sample, deposited at T (typically2982K) is anchored to a heat-stage within the measuring cell and electrical contacts are made to allow its resistance to be monitored. The cell is then evacuated by a rotary-pump to a pressure of 0.03mbar. Next, the heating-stage is energized, and within a time interval t (of the order of 300s) the sample-stage reaches an annealing temperature T. The system is then kept at this temperature for a dwell-time t, typically much longer than t. Finally, the heat supply is turned off and the sample is cooled back to ambient temperature within essentially the same t as in the heat-up stage. The sample resistance and the stage temperature are continuously measured throughout the annealing-cycle. A typical set of results for an annealing cycle is illustrated in Fig.1a including both R(T) and T(t)T(t)-T(t) where T is the ambient temperature. The sharp response of the resistance while the temperature increases upon turning on the heating and during the cool-back to T is due to the temperature dependence of the sample resistivity (the temperature coefficient of the resistance is negative for all the samples studied here). Note however that the resistance changes even during the parts of the cycle where the temperature is essentially constant (Fig.1b and Fig.1c). In particular, the resistance keeps going up long after the stage temperature stabilizes (Fig.1b). The time of R is associated with the increase in the sample volume. This ”swelling” effect was also observed in pressure-densification studies after the applied pressure has been relieved [6, 7].
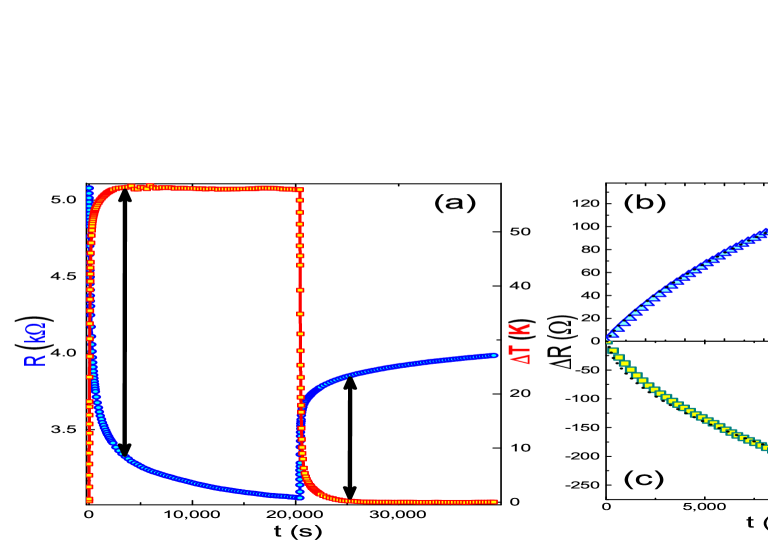
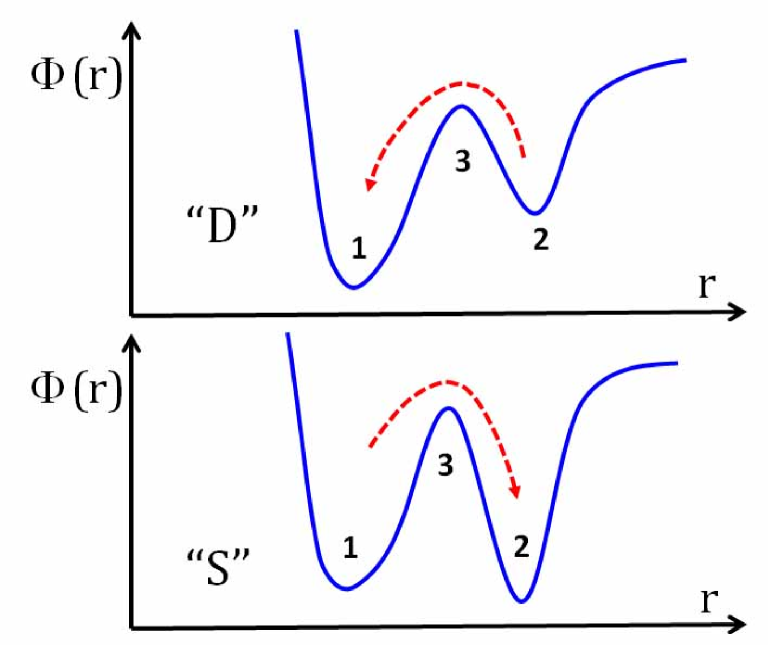
Both R(t) and R(t) reflect changes in the system volume (rarefaction and densification respectively). The change in volume in the process of thermally-treating InO films was demonstrated in an interference experiment using grazing-angle x-ray technique [15]. The volume change was further correlated with in-situ resistivity and optical-spectroscopy measurements [15]. It was argued [14] that the time-dependent processes that occur while the temperature is constant can be qualitatively accounted for by assuming an effective two-body potential of the form depicted in Fig.2. Moreover, the similarity of these effects with those produced by application of pressure could be explained on the same footing as in thermally-treating the system [14]. For completeness, we give below a concise summary of these arguments.
1.2 A heuristic picture for densification-rarefaction
The picture is based on the inter-particle potential schematically shown in Fig.2. The figure depicts two local configurations of the interparticle potential; ”S” and ”D” are specific two-state-systems featuring two local minima. The state labeled S (for ‘swell’) favors a larger interparticle separation while D favors a denser structure. The system density at a given temperature and pressure is determined by the values of ’s. Transitions of the type S,D(12), S,D(21), are assumed to be controlled by a Boltzmann factor so the transition-rate is:
| (1) |
where is =(3)-(1), =(3)-(2) respectively, 10s is the attempt-frequency and T is the temperature.
Many of the local configurations in the as-prepared InO films, are probably of the ‘swell-type’ because the samples were quench-condensed from the vapor phase onto room-temperature substrates and therefore are similar to rapidly-chilled glasses [1]. Accordingly, S-configurations may initially be preponderant in the system. When T0 is applied the balance of occupation in the S(1) and S(2) states changes and the density will increase towards the level dictated by Boltzmann statistics and controlled by the distribution of the barriers. If, while T is on, there are no irreversible structural changes then the density will eventually saturate at the ‘equilibrium’ value set by the temperature. In this case the density will acquire its pristine value when T is reduced to zero. Reversible changes that apparently occur when the asymptotic value of the resistance is lower than the starting value signify transformation of S-configurations into D-configurations.
1.3 Raman spectra
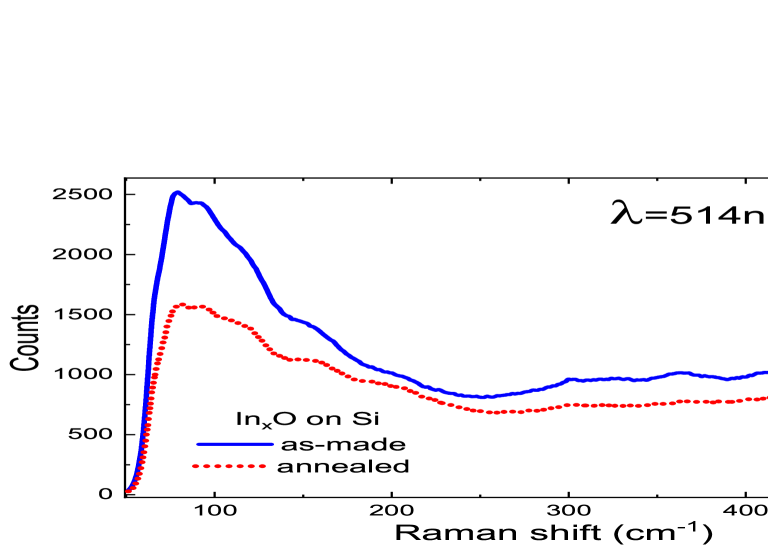
Amorphous systems are as a rule disordered solids. One of the characteristic features of these systems is the bosom-peak. This peculiar feature may be detected in inelastic neutron scattering where it shows up as an excess of vibration-states over the parabolic Debye spectrum [18, 19, 20, 21, 22]. This boson-peak is routinely observed in Raman scattering experiments where it exhibits a characteristic asymmetric shape with a peak value around 40-100 cm. The effect of pressure on the boson-peak has been studied in number of disordered systems [22] and showed a systematic reduction of the peak magnitude with increasing pressure. In this work we show Raman spectra of before and after thermal-treatment (Fig.3). The figure reveals the same trend as in other disordered systems; the magnitude of the boson-peak is significantly smaller following densification. This gives further support to the observation that thermal-treatment of InO has qualitatively the same effect as applying pressure on other structural glasses in agreement with the heuristic picture [14]. A reduction of the boson-peak magnitude was also observed after thermally-treating the InO version used in [14] but the change relative to the change in the resistance was smaller. It should also be remarked that with the present set-up, having a cut-off below 70cm, we cannot determine the position where the boson-peak reaches its maximum value* and therefore we are not able to see if and by how much it is shifted with annealing.
Further reduction in the boson-peak magnitude is achieved upon crystallizing the InO film. Crystallization proceeds rapidly by subjecting the InO film to temperatures in excess of 370K. The Raman spectrum of the resulting InO polycrystalline film is compared with that of the as-deposited amorphous film and with the spectrum of the deposition-source material InO.
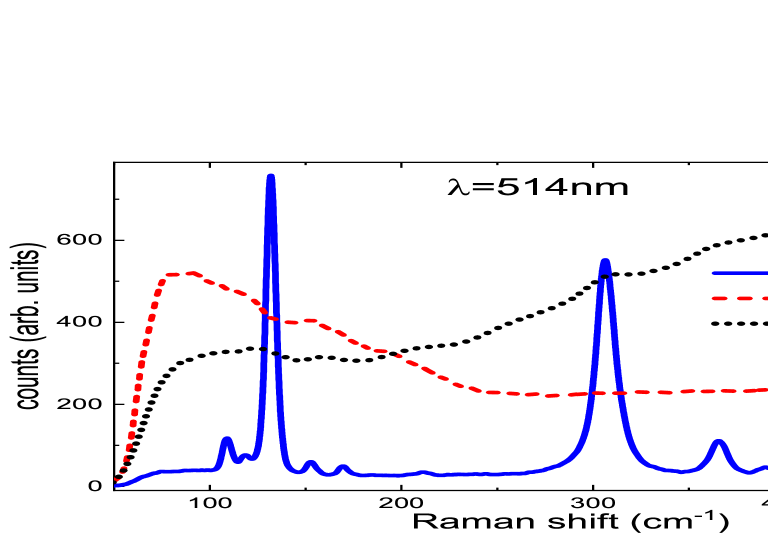
Obviously, Raman spectra for the various structures of indium-oxide samples are distinctly different. This makes Raman scattering a useful tool to identify them and, in particular, to distinguish between the oxygen-deficient (and electron-rich) InO and the stoichiometric compound InO. Note that, over the spectral range studied, some of the expected InO vibration-modes at 109, 135, 307, 366, and 495 cm clearly seen in the source-material spectrum, are masked or shifted in energy in the InO compound (Fig.4). This presumably is due to the presence of 10cmelectrons in the non-stoichiometric system. We found out that Raman spectroscopy is also sensitive enough to detect a residual amorphous phase in samples that undergone incomplete crystallization; this shows up as a prominent boson-peak superimposed on spectrum that looks like that of InO. The presence of a similar amount of amorphous phase on the same (mostly crystalline) sample was difficult to ascertain by using x-ray or electron-diffraction techniques as both usually give some signal due to inelastic scattering that is hard to distinguish from the presence of amorphous phase.
1.4 Dynamics of the iso-thermal processes
We turn now to discuss the slow processes that occur during the iso-thermal parts of the annealing cycle. The behavior shown in Fig.1 is typical but the relative magnitude of changes that presumably take place while the system temperature is constant depend in an intricate way on T, time of annealing, and on history. Two examples for protocols that are usually avoided are shown in Fig.5 and Fig.6.
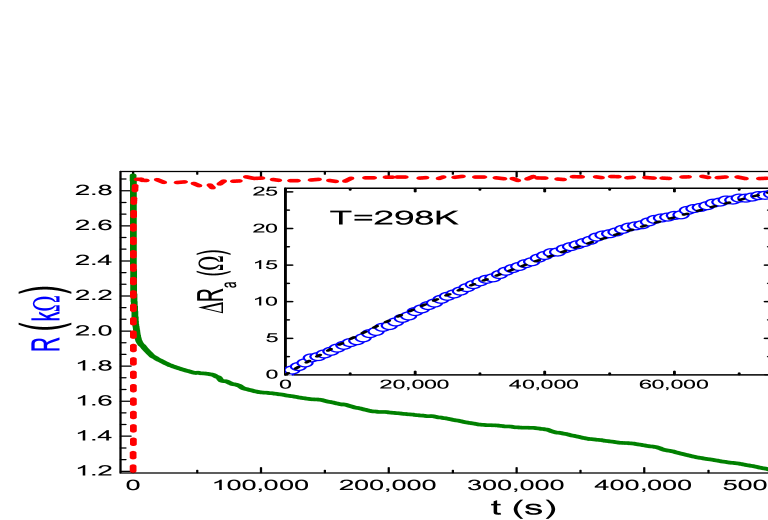
Figure 5 shows an example for an unusually long heating process which is the way to get a substantial densification and lowering of the sample resistance while using moderate annealing temperature. Figure 6, on the other hand, shows the unwanted result of actually ending up with a higher resistance than the value one started the protocol with. Such an outcome is not rare; it usually occurs when T is close to the temperature the sample was exposed to previously (for example, during deposition), annealed for short period of time, or both. In essence, even though the cooling-back to room-temperatures extends over hundreds of seconds, it is effectively tantamount to quench-cooling the sample because the cooling-time is still much shorter than the relaxation-time of the medium. In terms of the heuristic model, the most relevant configurations (see Fig.2) that are involved in the swelling effect are those having (1)-(2) just larger than kT.
An intriguing question to which we have yet no answer is whether it is possible by careful annealing to completely eliminate ‘S-type’ configurations from the amorphous system.
The temporal dependence of R, while the system is under the annealing-temperature T, may be fitted to a stretched-exponential law:
| (2) |
with the three parameters , , and R.
A complementary behavior takes place during the asymptotic region of the annealing protocol, where the temperature has settled back at T. In this period R(t) may also be described by a stretched-exponential law (in general, with different parameters):
| (3) |
Stretched-exponential time dependence is often observed in the dynamics of disordered systems [23, 24]. There were several attempts to come up with a microscopic model that accounts for the origin of this so called Kohlrausch-law [25]. However for discussing the current results a simple interpretation suggesting that the stretched-exponential is just a weighted sum of simple exponentials may suffice [26]. In this approach, the stretched-exponential law is a convoluted effect of parallel events with relaxation-rates distributed over a range with probability P(), the parameter is a logarithmic measure of the distribution-width and is a characteristic relaxation time [26]. We shall argue however that, unless 1, associating with a relaxation time may convey only part of the characteristics of the dynamics.
Fitting data of a rather plain form such as our R(t) or R(t) plots to Eq.2 or Eq.3, involving 3 parameters, should be taken with some reservations. The main problem in trying to fit such data to Eq.2 or Eq.3 is the time it takes the sample temperature to stabilize upon heating-up to T and after cooling-back to room-temperature. This introduces uncertainty in the assignment of the origin of time. Nevertheless, fitting data to these stretched-exponential expressions is still a reasonable tool to estimate (by extrapolation) the asymptotic value of the resistance, and to compare changes in dynamics on a relative basis. Our choice of the ”starting-time” for the iso-thermal process is marked by the arrows in figures 1, 5, and 6.
1.5 How disorder is reflected in the swelling dynamics
Next we wish to focus on how the dynamics observable through analyzing R(t) data reflect on the degree of the disorder after a given thermal-treatment cycle. In transport measurements, it is the sample resistivity that is often taken as the criterion for disorder. Thermal-annealing modifies the sample resistance at the end of the heat-cycle and therefore it changes the disorder. However, in addition to the value of the average resistivity, there are changes observable in the dynamics of the ‘after-effect’ that may give further information on the modified system disorder.
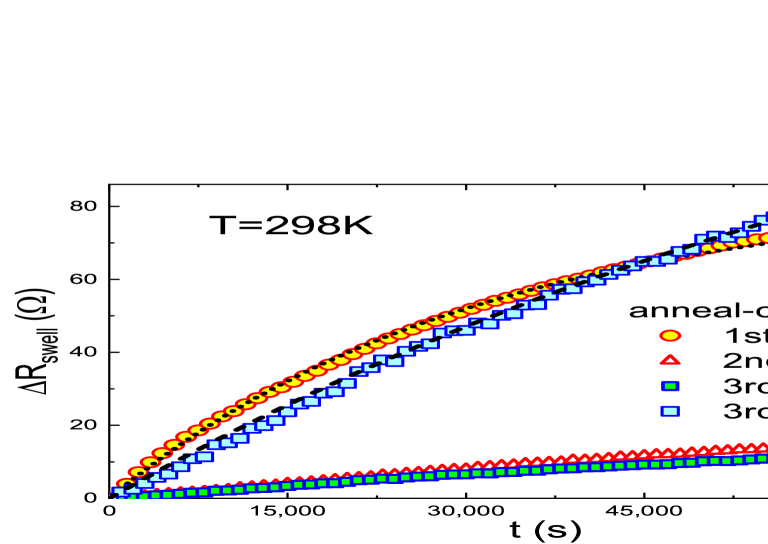
We have studied three series of samples that were progressively annealed by subjecting them to thermal-treatment for successively longer times, higher T (or both). This resulted in a lower resistance at the end of each annealing cycle. The dynamics of the system was then tested at each cycle-end by the very same protocol: The sample was exposed to T=3251K for 60 minutes, then allowed to cool back to room-temperature and the ensuing R(t) was monitored. A fit was then made for these data to Eq.3 using the same criteria for the choice of the origin of time for each heat-treatment cycle. It turns out that the best-fits parameters and consistently increased as the annealing stages progressed and the sample resistance decreased. Three plots that illustrate this trend are shown in fig.7. Note that the asymptotic value of R gets progressively smaller with further thermal-cycles but it seems to reach a limit as further annealing gives little or no improvement of the conductance. In addition, the time dependence of R(t) also changes: More annealing causes R(t) to exhibit a smaller curvature. This is illustrated in Fig.7 comparing the plots for the 1st and 3rd thermal-treatment cycles (the latter is also shown blown-up to facilitate comparison of curvature).
The R(t) plots in Fig.7 are results of testing three consecutive annealing-stages yielding best-fit values for and for the relaxation-times that are listed in the table below. These were purposefully chosen for display because their s are close to 1/2, 7/8 and 24/25 for thermal-cycle 1, 2, and 3 respectively. Note that P(,), where equals ratio of integers, may be readily calculated by the prescription suggested by Johnston [26].
| annealing cycle # | (x10s) | |
|---|---|---|
| 1 | 0.510.05 | 1.60.08 |
| 2 | 0.870.02 | 6.40.1 |
| 3 | 0.960.015 | 8.10.2 |
These specific rate-distributions are plotted in Fig.8a as function of the dimensionless variable [26].
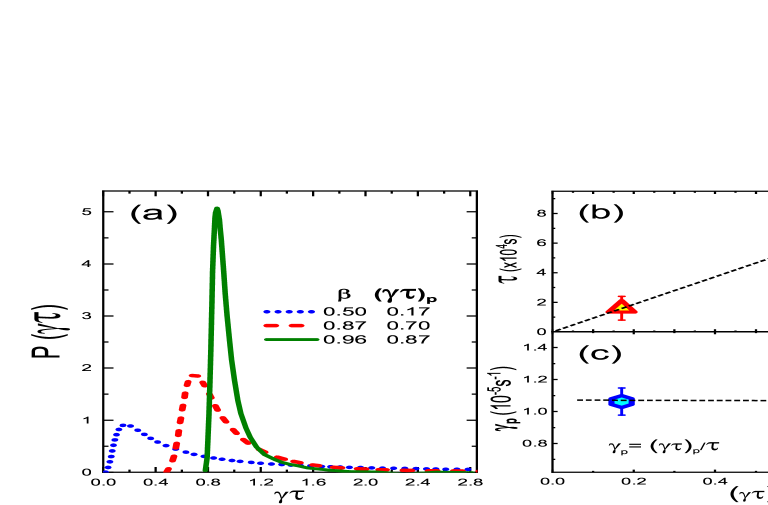
It would be natural to take the value of the fitted as a characteristic relaxation-time for a given sample. In this case one may conclude from Fig.8b that the dynamics of the swelling effect becomes slower with progressive annealing. However, plotted against the peak-value () of the P() associated with the best-fitted , one observes an intriguing correlation in our data; is linear with ()(Fig.8b).This, in turn, means that , the most probable rate involved in the dynamics of R(t) appears to remain constant as the annealing proceeds to further reduce the sample resistance (Fig.8c). It should be emphasized that the trend of getting larger with further annealing has been observed in all our thermal-treatment experiments, but not knowing the associated P() we cannot ascertain that the () relation holds in each interim annealing stage. What is clear is that larger means narrower, more symmetric rate-distribution. Therefore it is fair to conclude that, in addition to increasing the material density, thermally-treating InO films improves their homogeneity. This agrees with independent data obtained by using x-ray interferometry [15]. The lesson here is that the value of the best-fitted by itself conveys only part of the information relevant for the system dynamics (unless is close to unity). When is small the relaxation-time is an ill-defined quantity and its value may depend on the specific protocol one uses to estimate it.
Using Eq.1 the effective barrier that would give the most probable transition-rate found above for the InO films may be estimated by:
| (4) |
With kT25meV, 10s, and 10s (from Fig.8c) one gets 1.00.05 eV. It should be noted that, within the experimental error, this is identical with the value estimated for the barrier of another version of this material with a lower carrier-concentration [14]. The order of magnitude difference (in terms of carrier-concentration) between these versions of InO has apparently little effect on the value of the barrier. This suggests that its origin has to do with local chemistry rather than the specific stoichiometry of the compound.
With a barrier of the order of 1eV the only dynamics expected below 100K on a time scale relevant for most experiments would be of quantum nature; at liquid nitrogen temperatures the over-the-barrier transition-rate would already be smaller than 10s.
The lack of observable increase with time of the average resistance for a sample immersed in liquid helium suggests that tunneling-transition is also practically suppressed. The effective distance for tunneling may be of atomic dimension but it probably involves many-body effects making the mass of the tunneling object too large. This effective freezing-out of the system disorder makes thermal-treatment a useful tool for a variety of low-temperature studies where one seeks a way to fine-tune the disorder. Not only does it allow to change the average disorder over a range large enough to affect the metal-insulator or superconductor insulator transition, but by letting the system retrieve some disorder through the swelling-effect, it also allows a certain degree of reversibility. This is especially useful for low temperature study of the insulating phase where a tiny change in room-temperature resistance translates into an exponentially large change at the measuring temperatures [15].
2 Summary
We have studied in this work several effects associated with thermally-treating InO films. Two effects that were studied previously are a reduction in the system volume and optical-gap during heat-treatment as well as a partial recovery of these quantities after the sample is cooled back to room-temperature [14]. Here it is shown that thermal-treatment also leads to a reduction of the boson-peak magnitude. These three effects were observed in other disordered systems by applying pressure. The response of a system volume to application of pressure and the rarefaction that takes place once pressure is relieved appeals to one’s intuition based on everyday experience. That thermal-treatment has similar effects may seem counter-intuitive, again, due to common experience; raising temperature usually (but not always [27]) causes system to expand. It is in the nonequilibrium solids like amorphous systems that this peculiar behavior may turn out to be prevalent. There is no reason to believe that InO films are unique in this regard.
Monitoring the system resistance allow convenient and sensitive tracking of the dynamics and energetics associated with these phenomena during both densification and after the heat-treatment is terminated and the system relaxes towards a new (metastable) state. These processes are presumably activated and exhibit temporal dependencies that fit the Kohlrausch-law often encountered in experiments involving slow-dynamics of structural glasses. The parameters that fit the relaxation-law and change systematically with the degree of annealing. An analysis of these changes suggest that, in addition to densification, there is a narrowing of the rate-distribution. It would be interesting to see how general are these findings by studying the effects of thermal-treatment on other metallic glasses.
The assistance by Dr. Anna Radko with the Raman spectra work is gratefully acknowledged. This research has been supported by the 1030/16 grant administered by the Israel Academy for Sciences and Humanities.
*After this work was published, we have found that the maximum magnitude of the boson-peak in this version of InO occurs at 382 cm and does not shift with thermal-treatment (work performed in collaboration with Itai Bet-hazavdi and Ilana Bar from Ben-Gurion University of the Negev).
References
- [1] P. W. Bridgman and I. Šimon, J. of Appl. Phys., 24, 405 (1953).
- [2] S. Sakka and J. D. Mackenzie, J. of Non-Crys Sol., 1, 107 (1969).
- [3] J. D. Mackenzie, J. of Am. Ceramic Soc., 46. 461 (1963).
- [4] J. D. Mackenzie, J. of Am. Ceramic Soc., 46, 470 (1963).
- [5] Wu and H.L. Luo, Journal of Non-Crystalline Solids 18, 21 (1975).
- [6] N. Sakai and H. Fritzsche, Phys. Rev. B 15, 973 (1977).
- [7] Seinosuke Onari, Takao Inokuma, Hiromichi Kataura, and Toshihiro Arai, Phys. Rev. B 35, 4373 (1987).
- [8] A. Polian and M. Grimsditch, Phys. Rev. B 41, 6086 (1990).
- [9] S. Susman, K. J. Volin, D. L. Price, M. Grimsditch, J. P. Rino, R. K. Kalia, and P. Vashishta, G. Gwanmesia, Y. Wang, and R. C. Liebermann, Phys. Rev. B 43, 1194 (1991).
- [10] Norio Ookubo, Yasuhiro Matsuda, and Noritaka Kuroda, Applied Physics Lett., 63, 346 (1993).
- [11] Daniel J. Lacks, Phys. Rev. Lett., 30, 5385 (1998).
- [12] K. Miyauchi, J. Qiu, M. Shojiya, Y. Kawamoto, N. Kitamura, J. of Non-Crys Sol., 279, 186 (2001).
- [13] V. V. Brazhkin, E. Bychkov, and O. B. Tsiok, Phys. Rev. B 95, 054205 (2017).
- [14] Z. Ovadyahu, Phys. Rev. B 95, 214207 (2017).
- [15] Z. Ovadyahu , Phys. Rev. B. 95, 134203 (2017).
- [16] D. Shahar and Z. Ovadyahu, Phys. Rev. B 46, 10917 (1992); D. Kowal and Z. Ovadyahu, Solid State Comm., 90, 783 (1994); V. Gantmakher, International Journal of Modern Physics B, 12, Nos. 29, 30 & 31 (1998); G. Sambandamurthy, L. W. Engel, A. Johansson, and D. Shahar, Phys. Rev. Lett. 92, 107005 (2004); M. A. Steiner, G. Boebinger, and A. Kapitulnik, Phys. Rev. Lett. 94, 107008 (2005); M Steiner, A Kapitulnik, Physica C, 422, 16 (2005); Myles A. Steiner, Nicholas P. Breznay, and Aharon Kapitulnik, Phys. Rev. B 77, 212501 (2008); Nicholas P. Breznay, Myles A. Steiner, Steven Allan Kivelson, and Aharon Kapitulnik, PNAS, 113, 215 (2015); P. Breznay and Aharon Kapitulnik, Science advances, 3, e1700612 (2017); T. I. Baturina, A. Bilušić, A.Yu. Mironov, V. M. Vinokur, M. R. Baklanov, and C. Strunk, Physica C 468, 316 (2008); S. Poran, E. Shimshoni, and A. Frydman, Phys. Rev. B 84, 014529 (2011); D. Sherman, G. Kopnov, D. Shahar, and A. Frydman, Phys. Rev. Lett. 108, 177006 (2012); Yeonbae Lee, Aviad Frydman, Tianran Chen, Brian Skinner, and A. M. Goldman, Phys. Rev. B 88, 024509 (2013); Benjamin Sacépé, Thomas Dubouchet, Claude Chapelier, Marc Sanquer, Maoz Ovadia, Dan Shahar, Mikhail Feigel’man and Lev Ioffe, Nature Physics, 7, 239 (2011); Daniel Sherman, Uwe S. Pracht, Boris Gorshunov, Shachaf Poran, John Jesudasan, Madhavi Chand, Pratap Raychaudhuri, Mason Swanson, Nandini Trivedi, Assa Auerbach, Marc Scheffler, Aviad Frydman & Martin Dressel, Nature Physics 11, 1882 (2015); Ilana M. Percher, Irina Volotsenko, Aviad Frydman, Boris I. Shklovskii, and Allen M. Goldman, Phys. Rev. B 96, 224511 (2017).
- [17] U. Givan and Z. Ovadyahu, Phys. Rev. B 86, 165101 (2012).
- [18] U. Strom, and P. C. Taylor, Phys. Rev. B, 16 5512 (1977).
- [19] U. Buchenau, M. Prager, N. Nücker et al., Phys. Rev. B, 34 5665 (1986).
- [20] V. K. Malnikovsky, V. N. Novikov, P. P. Parshin, A. P. Sokolov and M. G. Zemlyanov, Europhys. Lett., 11 43 (1990).
- [21] Walter Schirmacher, Gregor Diezemann, and Carl Ganter, Phys. Rev. Lett. 81, 136 (1998).
- [22] K. Niss, B. Begen, B. Frick, J. Ollivier, A. Beraud, A. Sokolov, V. N. Novikov, and C. Alba-Simionesco, Phys. Rev. Lett. 99, 055502 (2007); L. Hong, B. Begen, A. Kisliuk, C. Alba-Simionesco, V. N. Novikov, and A. P. Sokolov, Phys. Rev. B 78, 134201 (2008); V. L. Gurevich, D. A. Parshin, and H. R. Schober, Phys. Rev. B 71, 014209 (2005); S. Sugai and A. Onodera, Phys. Rev. Lett. 77, 4210 (1996); A. Monaco, A. I. Chumakov, G. Monaco, W. A. Crichton, A. Meyer, L. Comez, D. Fioretto, J. Korecki, and R. Rüffer, Phys. Rev. Lett. 97, 135501 (2006); L. Hong, B. Begen, A. Kisliuk, S. Pawlus, M. Paluch, and A. P. Sokolov, Phys. Rev. Lett. 102, 145502 (2009); H. R. Schober, U. Buchenau, and V. L. Gurevich, Phys. Rev. B 89, 014204 (2014); Hiroshi Shintani and Hajime Tanaka, nature materials 7, 870 (2008).
- [23] C. A. Angell, K. L. Ngai, G. B. McKenna, P. F. McMillan, and S. W. Martin, J. of Appl. Phys., 88, 3113 (2000).
- [24] Bingyu Cui, Rico Milkus, and Alessio Zaccone, Phys. Rev. E 95, 022603, (2017).
- [25] E. W. Montroll, J. T. Bendler, J. Stat. Phys. 34,129 (1984); R. G. Palmer, D. L. Stein, E. Abrahams, and P. W. Anderson, Phys. Rev. Lett., 53, 958 (1984); J. S. Langer, S. Mukhopadhyay, Phys. Rev. E 77, 061505 (2008); J. C. Phillips, Rep. Prog. Phys. 59, 1133 (1996); I. M. Lifshitz, Usp. Fiz. Nauk 83, 617 (1964) [Engl. trans. Sov. Phys. Usp. 7, 549 (1965)]; R. Friedberg, J. M. Luttinger, Phys. Rev. B 12, 4460 (1975); P. Grassberger, I. Procaccia, J. Chem. Phys. 77, 6281 (1982).
- [26] D. C. Johnston, Phys. Rev. B 74, 184430 (2006).
- [27] T. A. Mary, J. S. O. Evans, T. Vogt, and A. W. Sleight, Science, 272, 90 (1996); Alexandra K A Prydedag, Kenton D Hammondsdag, Martin T Dove, Volker Heine, Julian D Gale and Michele C Warren, Journal of Physics: Condensed Matter, 8, 10973 (1996); John S. O. Evans, J. Chem. Soc., Dalton Trans., 19, 3317 (1999); Andrew L. Goodwin, Mark Calleja, Michael J. Conterio, Martin T. Dove, John S. O. Evans, David A. Keen, Lars Peters, Matthew G. Tucker, Science, 319, 794 (2008).