Ejective and preventative: the IllustrisTNG black hole feedback and its effects on the thermodynamics of the gas within and around galaxies
1Max-Planck-Institut für Astronomie, Königstuhl 17, D-69117 Heidelberg, Germany
2Max-Planck-Institut für Astrophysik, Karl-Schwarzschild-Str. 1, 85748 Garching, Germany
3Institute for Theory and Computation, Harvard-Smithsonian Center for Astrophysics, 60 Garden Street, Cambridge, MA 02138, USA
4Department of Physics & Astronomy, University of Bologna, via Gobetti 93/2, 40129 Bologna, Italy
5Kavli Institute for Astrophysics and Space Research, Massachusetts Institute of Technology, Cambridge, MA 02139, USA
Abstract
Supermassive black holes (SMBHs) which reside at the centres of galaxies can inject vast amounts of energy into the surrounding gas and are thought to be a viable mechanism to quench star-formation in massive galaxies. Here we study the stellar mass central galaxy population of the IllustrisTNG simulation, specifically the TNG100 and TNG300 volumes at , and show how the three components – SMBH, galaxy, and circumgalactic medium (CGM) – are interconnected in their evolution. We find that gas entropy is a sensitive diagnostic of feedback injection. In particular, we demonstrate how the onset of the low-accretion BH feedback mode, realised in the IllustrisTNG model as a kinetic, BH-driven wind, leads not only to star-formation quenching at stellar masses but also to a change in thermodynamic properties of the (non-star-forming) gas, both within the galaxy and beyond. The IllustrisTNG kinetic feedback from SMBHs increases the average gas entropy, within the galaxy and in the CGM, lengthening typical gas cooling times from to , effectively ceasing ongoing star-formation and inhibiting radiative cooling and future gas accretion. In practice, the same AGN feedback channel is simultaneously ‘ejective’ and ‘preventative’ and leaves an imprint on the temperature, density, entropy, and cooling times also in the outer reaches of the gas halo, up to distances of several hundred kiloparsecs. In the IllustrisTNG model, a long-lasting quenching state can occur for a heterogeneous CGM, whereby the hot and dilute CGM gas of quiescent galaxies contains regions of low-entropy gas with short cooling times.
keywords:
galaxies:evolution, galaxies:haloes, galaxies:quasars:supermassive black holes, galaxies:star formation1 Introduction
When characterized within the parameter space of colours/SFR vs. magnitude/stellar mass, galaxies in the observed Universe are generally found in one of two regions: the star-forming ‘blue cloud’ comprised of galaxies with an abundance of young stars and the quiescent ‘red sequence’ in which the star formation has been halted (e.g. Kauffmann et al., 2003; Baldry et al., 2004; Balogh et al., 2004; Hogg et al., 2004). Observations show that these populations are already well-established around (Bell et al., 2004; Cooper et al., 2007) and that the ‘blue cloud’ is mostly populated by low-mass galaxies, while massive galaxies lie in the ‘red sequence’ with the transition occurring at a stellar mass of (Kauffmann et al., 2003).
When comparing the populations of ‘central’ galaxies, i.e. the most massive galaxies within a dark matter host, to satellite galaxies, one finds a different quenched fraction at fixed stellar mass in each category (e.g. van den Bosch et al., 2008; Wetzel et al., 2012; Geha et al., 2012; Wetzel et al., 2013). This indicates that different physical processes govern the transition from star-forming to quenched in each class, with the quenching of satellites being driven by their environment (Wang et al., 2009; Peng et al., 2010; Woo et al., 2013).
While for the quenching of satellite galaxies a host of physical “environmental” mechanisms have been proposed, e.g. gas removal by ram-pressure (Gunn & Gott, 1972; McCarthy et al., 2008; Zinger et al., 2018) or tidal forces (Gnedin, 2003; Villalobos et al., 2014), the processes which terminate the formation of new stars in the central galaxy population must originate from within the galaxy itself (Peng et al., 2010; Liu et al., 2019). In this study we focus on central galaxies and thus exclude the effects of “environmental” processes in the transition of galaxies from star-forming to quenched.
For quenching of central galaxies, energy injection (feedback) is often invoked as the main driver, either from supernovæ(SNe) or from the supermassive black holes (SMBHs) that reside in the centres of galaxies. SMBHs are found in galaxies at very high redshifts (Bañados et al., 2018) as well as in our local Universe (e.g. Reines & Volonteri, 2015). When accreting mass, SMBHs can inject energy into their host galaxies and are known as Active Galactic Nuclei (AGN).
While the energy feedback from stars and SNe can be an important factor in shaping the evolution of low-mass galaxies and galaxies in general (Dekel & Silk, 1986; Hopkins et al., 2011), from a theoretical perspective it is widely accepted that, in galaxies at and above the stellar mass transition scale, AGN feedback plays an important role in regulating star formation and possibly in quenching galaxies (Di Matteo et al., 2005; Silk, 2013; Somerville & Davé, 2015; Penny et al., 2018). More specifically, theoretical studies with numerical cosmological simulations and semi-analytic models that follow galaxy evolution with and without AGN feedback (e.g. McCarthy et al., 2011; Dubois et al., 2016; Kaviraj et al., 2017) show that the quenching of entire populations of galaxies in a manner consistent with observations is only possible when AGN feedback is included. This is especially true at the high-mass end, where feedback from supernovæand massive stars is ineffective in shutting off star formation (Bower et al., 2006; Weinberger et al., 2017; Choi et al., 2018). As such, AGN feedback is a critical component of most galaxy formation models in both semi-analytic models and large-volume simulations (Vogelsberger et al., 2014a; Schaye et al., 2015; McCarthy et al., 2017; Bower et al., 2017; Weinberger et al., 2017).
| Name | Mean cell size (std. dev.) of non-SF gas () | |||||
|---|---|---|---|---|---|---|
| Galactic Gas | Inner CGM | Outer CGM | ||||
| TNG100 | 110.7 | 1.4 | 0.19 | 1.8 (0.98) | 5.7 (2.7) | 10.4 (3.1) |
| TNG300 | 302.6 | 11 | 0.37 | 4.1 (2) | 12.1 (5.5) | 21.3 (6.3) |
From an observational perspective, the association of AGN feedback to the quenching of star formation is more nuanced. On the one hand, AGN feedback may not account for quenching in all massive galaxies and other secular processes have been invoked to explain the quenched population of central galaxies at the high-mass end (Smethurst et al., 2016). On the other hand, while there are strong observational indications that AGN feedback can lead to quenching (Hickox et al., 2009; Cheung et al., 2016), strong AGN outflows have also been observed in massive star-forming galaxies, at intermediate redshifts (Genzel et al., 2014; Förster Schreiber et al., 2014). Yet, the existence of observed scaling relations between the large-scale properties of the host galaxies – e.g. luminosity, stellar mass, and stellar velocity dispersion – and the mass of the SMBH suggest that the evolution of the latter and its host galaxy are intertwined (Kormendy & Ho, 2013; Heckman & Best, 2014, and references therein).
Though SMBHs comprise a small fraction of the mass and volume of a galaxy, their effects can be seen and measured in the galaxy as well as out to hundreds of kiloparsecs in the surrounding gas (Bîrzan et al., 2004; Fabian, 2012). In galaxy clusters, for example, the energy from BH feedback is known to be a key player in compensating the high cooling rates inferred within the Intra-Cluster Medium (ICM) and in setting the thermodynamic conditions in the central regions of the cluster (McNamara & Nulsen, 2007; Böhringer & Werner, 2010; Prasad et al., 2015). Various observations indicate that the thermodynamics of the gaseous atmospheres surrounding massive galaxies (i.e. not just those at the centres of the most massive clusters) are also regulated by the energy injected by black holes (Nulsen et al., 2009; Werner et al., 2019). In atmospheres heated in such a manner the cooling and accretion of gas onto the galaxy can be suppressed and thus future epochs of star formation in the central galaxy can also be suppressed. Through this ‘preventative’ feedback (Somerville & Davé, 2015), the AGN not only quenches the galaxy but can maintain its quenched state for long periods of time.
Observations of AGN suggest two main modes of activity: AGN in which the mass accretion rates is high, exceeding a few percent of the Eddington rate, are dominated by radiation in IR, optical, UV all the way to X-ray wavelengths, originating from the luminous gas in the black hole accretion disk (Crenshaw et al., 2010; Villar-Martín et al., 2011; Woo et al., 2016; Rupke et al., 2017). This energy deposition mode, mediated by radiation-driven winds, is often called the ‘quasar’ mode. In the other case, linked to low accretion rates, mechanical energy is deposited in the surrounding gas, often resulting in radio jets or large synchrotron emitting plasma lobes. This feedback mode is often referred to as the ‘radio’ or ‘mechanical’ mode (Fabian, 2012; McNamara & Nulsen, 2007; Shin et al., 2016). From an observational perspective, a general picture has emerged whereby the first mode of feedback, the high-accretion channel, is responsible for triggering the quenching of the galaxies, while the second mode, at low accretion rates, is often referred to as a ‘maintenance’ mode (Mathews & Brighenti, 2003; Best et al., 2005; Rangel et al., 2014). Still, this separation remains uncertain and so does the nature of the feedback for quenching star formation; i.e. whether the energy injection from the SMBHs effectively heats up or vacates the gas within the galaxies and their surroundings and how these phenomena complement one another at different mass scales and cosmic epochs.
While there has been extensive study of the physical processes that connect the accretion of gas onto the SMBHs to their energy output (e.g. Yuan & Narayan, 2014) the subject is still not fully understood, especially when it comes to the coupling of the feedback energy to the surrounding gas. Complicating matters further, some galaxies have been found with signatures of both extended radio emission and a bright X-ray source (Yuan et al., 2008; Coziol et al., 2017). The murkiness surrounding the basic physical process which take place on the BH scale (King & Nixon, 2015), and the challenges of sharing the output energy with the gas over large scales (McNamara & Nulsen, 2007), makes modelling AGN feedback in galaxy simulations particularly challenging.
Simply injecting the right amount of energy, which in itself is uncertain, is not enough. The details of modelling AGN feedback are also quite important, as the comparison between the Illustris (Vogelsberger et al., 2014a, b) and the IllustrisTNG (The Next Generation, Marinacci et al., 2018; Naiman et al., 2018; Nelson et al., 2018a; Pillepich et al., 2018b; Springel et al., 2018) simulation results clearly shows. Though very similar in the overall energy injected by the AGN, the differences in implementation of the feedback in the two models led to several key differences. The ‘bubble model’ (Sijacki et al., 2007) employed in the Illustris suite and parameterised as in Vogelsberger et al. 2013 (but see Henden et al., 2018) resulted in too-low gas fractions in galaxy groups and low-mass galaxy clusters due to an over-efficient expulsion of the hight density gas (Genel et al., 2014), while at the same time generating too-high stellar masses in the central galaxies. These issues have been resolved and the overall agreement with observations has improved with the new AGN Model (Weinberger et al., 2017) of the IllustrisTNG simulations. Another example of this is found in Davies et al. (2019a) who compared the halo gas-fractions in the IllustrisTNG and EAGLE (Schaye et al., 2015) simulations: differences in the implementations of the AGN feedback resulted in a very different halo gas content for halo masses of and below. Future observational measures of this property, in this mass range, will be a powerful tool to discriminate between various models.
In this study, we put forward a comprehensive description of the role AGN feedback plays in setting the physical and thermodynamic conditions of the gaseous component in the galaxy and in the CGM within the framework of the IllustrisTNG simulations (hereafter TNG) and the AGN feedback model therein implemented. We study the entire (resolved) galaxy population afforded by the TNG100 and TNG300 simulations (galaxy stellar masses in the range) and focus exclusively on central galaxies at .
Within the TNG framework, earlier works by Weinberger et al. (2017, 2018); Nelson et al. (2018a); Terrazas et al. (2020) have demonstrated a close connection between the suppression of star formation in massive galaxies and the BH feedback in its kinetic mode, indicating the crucial role played by the latter in establishing the quenched population in the TNG simulations. The phenomena emerging from the underlying effective theory for galaxy formation include the appearance of a population of quenched galaxies also at intermediate/high redshifts (Weinberger et al., 2018; Donnari et al., 2019) and the good match of the shapes and widths of the red sequence and blue cloud in comparison to SDSS galaxies (Nelson et al., 2018a). This base level of realism in the properties of the simulated galaxy population enables us to gain insight into the workings of AGN feedback in the real Universe.
We take these notions further by examining the importance of the AGN energy injections in TNG, particularly the kinetic BH-driven winds, in setting the thermodynamic state of the gas in the galaxy itself and beyond in the CGM. As a case in point, Nelson et al. (2018b) have shown how this feedback model affects the abundance of highly ionized Oxygen atoms, OVI, which are an observational tracer of the thermodynamic state of the CGM.
In this way we gain a better understanding of the gas conditions which bring a galaxy to be quenched – ’ejective feedback’ – and the conditions in the CGM which are conducive for long-term quenching, i.e. ’preventative feedback’. In our analysis we take care to address the multi-phase nature of the CGM (Tumlinson et al., 2017), and to explore how it affects our findings.
The paper is organised as follows: In Section 2 we present the aspects of the TNG simulation suite most important to our study, including the details of the AGN model, as well as specifying the galaxy sample used and the particular physical properties we consider. In Section 3 we explore how the changes in thermodynamic conditions of the galactic and halo gas, particularly the gas entropy, mirror the transition of the galaxy from star-forming to quenched, and how these relate to the AGN feedback. The multi-phase nature of the CGM is also addressed in this context and we explore the implications of our findings on the future evolution of the galaxies in Section 4. In Section 5 we summarise the results of our analyses.
2 Methods
2.1 Simulations
The IllustrisTNG project111http://www.tng-project.org/is a suite of magneto-hydrodynamic cosmological simulations carried out in three simulation volumes of varying size and resolution that, when combined, provide an extremely large statistical sample of well-resolved galaxies, groups of galaxies and galaxy clusters.
The simulations were carried out with the AREPO code (Springel, 2010; Pakmor & Springel, 2013), coupled with the TNG physics model (Weinberger et al., 2017; Pillepich et al., 2018a) which has been shown to reproduce, with a reasonable level of accuracy, myriad observational properties of galaxies (Marinacci et al., 2018; Naiman et al., 2018; Nelson et al., 2018a; Pillepich et al., 2018b; Springel et al., 2018).
The simulation suite consists of three volumes roughly of side-length 50, 100 and 300 Mpc, dubbed TNG50, TNG100, and TNG300. The simulations are run within the framework of the CDM cosmological model with the cosmological parameters based on the Planck Collaboration et al. (2016) data: cosmological constant , matter density , with a baryonic density of , Hubble parameter , normalisation , and spectral index .
In Table 1 we detail, for both the TNG100 and TNG300 volumes, the target mass of the gas cells (which is roughly equal to the average initial mass of stellar particles), and the minimum comoving value of the gravitational softening for the gas elements. In addition, we give the average size of the gas cells222Since the AREPO code employs an unstructured mesh scheme, we use a representative cell-size scale of .within each of the three gas components we study in this paper (see Section 2.5.1), averaged over all objects in our sample (Section 2.4). The full simulation data of TNG100 and TNG300 is publicly available (see Nelson et al., 2019a, for details).
The computational and physical models for unresolved astrophysical processes incorporated in the TNG simulations have been presented in Weinberger et al. (2017); Pillepich et al. (2018a), and are updates to the earlier Illustris model (Vogelsberger et al., 2013; Torrey et al., 2014). As such, we forgo an in-depth description of these here, and present in the following sub-sections a short description of those aspects of the models that pertain to the analysis at hand; namely the AGN feedback model and the star formation recipe, as well as a short description of the galaxy sample herein analysed.
2.2 AGN feedback in the TNG model
BHs are formed in the simulation based on the host-halo relationship (Di Matteo et al., 2008; Sijacki et al., 2009): a BH is seeded in any friends of friends (FoF) halo whose mass exceeds (if the halo does not already possess a BH), with an initial seed mass of . Once seeded, BHs can grow by accreting gas from their close vicinity, the ‘feedback region’, which also defines the gas cells into which feedback energy is deposited. The size of the feedback region in the snapshots is of order a few kiloparsecs: in TNG100 and in TNG300 on average. In addition, BH-BH mergers occur whenever one BH is within the ‘feedback region’ of the other (Sijacki et al., 2007). The BHs are ‘pinned’ to the local minimum of the potential field, which in most cases coincides with the global minimum of its host halo.
The theoretical treatment of AGN feedback accounts for two modes of energy injection, set by the accretion rate of matter onto the BH (Begelman, 2014). The high accretion mode or thermal mode is associated with efficient accretion through a disk and feedback in this state is implemented as an injection of thermal energy into the surrounding gas. The low accretion mode or kinetic mode occurs at lower accretion rates in which the accretion disk is in a radiatively inefficient state (Blandford & Begelman, 1999; Yuan & Narayan, 2014), and results in a kinetic injection of energy. Two feedback modes acting at different BH accretion rates have been called, traditionally, the ‘quasar’ and ‘radio’ modes, respectively. However, within the TNG model the kinetic mode is distinct from the observed jets that have been typically associated with radio galaxies at the centres of clusters. Hence, in what follows we label the two modes as the thermal and kinetic modes.
The feedback energy injected in each of the modes is
| (1) |
where is the accretion rate onto the BH. For the thermal mode, is the efficiency with which energy couples to the surrounding gas. The energy is injected continuously as thermal energy in a kernel-weighted manner within the gas cells in the ‘feedback region’.
For the kinetic mode, the energy coupling factor has a maximal value333To prevent runaway kinetic feedback due to ever-decreasing gas densities, a ‘floor’ is set for the energy coupling parameter. of . This energy is imparted as a momentum boost to the gas cells in the feedback region (with no mediation by ‘wind-particles’) in a series of discrete ‘injection events’, which occur once the accumulated energy output from the BH has exceeded a certain threshold. In each injection event the direction of the momentum kick is chosen randomly, thus the energy injection is isotropic when averaged over many injection events, and, by extension, momentum conservation also holds in a time-averaged sense.
The feedback mode of the AGN is based on the ratio between the accretion rate and the Eddington accretion rate. The AGN feedback is in the thermal mode when the ratio is above a threshold value :
| (2) |
with scaling with the mass of the BH, thus favouring a transition to the kinetic mode for higher masses. The accretion rate of gas onto the BH is set as .
In both feedback modes, the thermal and kinetic, the energy is imparted to the cells in the small ‘feedback region’ of the BH. There is no de-coupling of these cells from the hydrodynamical forces, or from the radiative cooling, i.e. the progression in time of the physical state of these cells is governed by the same magneto-hydrodynamical model as before the energy was injected.
2.2.1 Emerging BH populations in TNG at
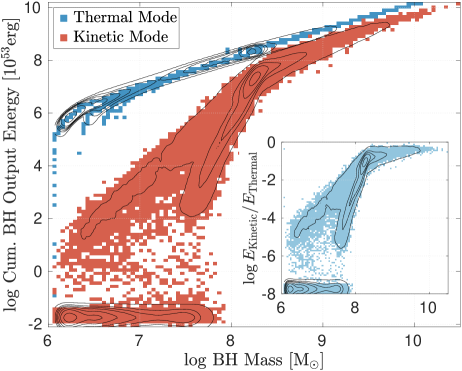
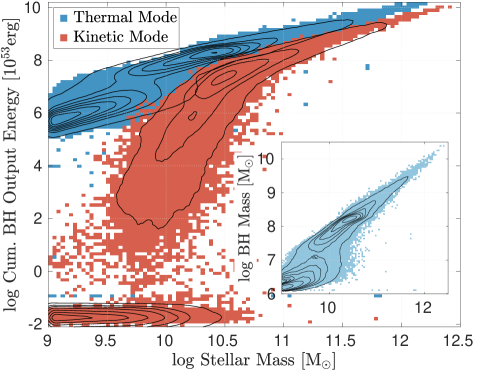
The BH particles in the simulation record the cumulative amount of energy released to the gas in each of the two modes (eq. 1) over the entire history of the BH: . In Fig. 1, we show the cumulative energy of the two feedback modes of the central BH in the TNG300 central galaxies at as a function of both the BH mass (Fig. 1a) and the stellar mass of the host galaxy (Fig. 1b). The ratio of the two energies vs. the BH mass is shown in the Fig. 1a inset. The central BH is chosen as the most massive BH particle in the galaxy. In addition, for any given BH at the current epoch, the cumulative energy injection includes all its progenitors across its history (and not only the feedback associated with the “main progenitor branch”).
These figures emphasise some important features of the AGN model. For all galaxies, more energy is injected in the thermal mode channel. In low-mass galaxies the dominant mass growth channel for the SMBH is through the high-accretion thermal mode. Since at any time , the cumulative energy will naturally be proportional to the total BH mass. Once a BH is seeded at a mass of , and starts giving off energy, we see a tight one-to-one relation between and form444In the low-mass end of the relation, several ‘branches’ are seen to rise and join the main relation. These branches are cases in which BH mergers occurred before enough energy was released to reach the power-law relation.(Fig. 1a). The convolution of this tight relation with the –stellar mass relation (see inset in Fig. 1b) leads to a similar relation with stellar mass, albeit with more scatter.
Examining the distribution of BH mass vs. stellar mass (in the inset of Fig. 1b) we see a concentration of BH masses at , close to the initial BH seed mass, found within low-mass galaxies and another concentration at , with a dearth of BHs in between. This distribution most likely arises due to the regulation of BH mass growth by the SN feedback process (see also Dubois et al., 2015; Habouzit et al., 2017; Anglés-Alcázar et al., 2017; Bower et al., 2017, though we note that these studies do not address the TNG model). Pillepich et al. (2018a) show with simulation run with variations of the TNG model, that in the low-mass galaxies, SN feedback limits the amount of available gas for BH accretion, keeping the BH mass close to the initial seed mass (though the BH can still grow by BH-BH mergers). As the galaxy grows in mass and its potential well deepens, the effectiveness of SN feedback diminishes, and the BH grows quickly to higher masses, concentrating at roughly where the kinetic mode feedback becomes important and self-regulates the further growth of the BH. McAlpine et al. (2018) found a similar process occurring in the EAGLE simulations.
The picture for the kinetic mode is more complex: 60 per cent of all galaxies in the sample have experienced no kinetic mode feedback at all throughout the history of the (simulated) universe. These are invariably of low BH mass , or in stellar mass. In this mass range the threshold to be in the kinetic mode is very low, implying that the required accretion conditions are never satisfied. In order to show these galaxies we have placed them ‘by hand’ at the bottom of the plot.
The two ‘branches’ in the kinetic mode energy vs. the BH mass relation of Fig. 1a come about from the distribution of BH masses mentioned earlier, in which low-mass BHs are concentrated close to the seed mass and most of the high-mass BHs are found at masses of . If the BH mass is low when it experiences its first kinetic mode injection event, it will progress on the shallow-slope left branch. If the BH experiences its first injection event only after it grows to the high-mass group, it will progress on the steeper, right branch.
Due to the scarcity of injection events at low masses, the energy input is quite low, but rises steeply with BH mass as the likelihood of being in the kinetic mode grows. A transitional mass scale appears at or in stellar mass, where the energy injected in the kinetic mode becomes comparable to that of the thermal mode, with a typical ratio of (see inset in Fig. 1a). Beyond this mass scale the relation with is also linear, but with a larger scatter compared to the thermal mode relation. In SMBHs above this mass scale, the gas accretion is self-regulated by kinetic mode feedback, and the SMBHs experience mostly epochs of kinetic mode feedback. BH-BH mergers become an important mass growth channel for these objects (Weinberger et al., 2018).
The transitional mass scale is set in part by the parameters of the AGN model (e.g. eq. 2), but is also influenced by other physical processes in the TNG model convolved with the coupled growth of galaxies and their BHs across cosmic epochs. For example, in a simulation run with the TNG model in which SN feedback was turned off, the stellar mass transitional mass scale occurs at a lower value. This most likely occurs since the mass growth of the BHs is no longer regulated by stellar feedback and thus massive BHs (with a propensity for kinetic mode feedback) are found in galaxies of lower stellar mass, when compared to the fiducial simulations.
As we show in this study, this mass scale, marking the onset of the kinetic feedback is a major determinant of the properties of the galaxies and their surrounding atmospheres (see also Terrazas et al., 2020) and is also found in the distributions of and AGN occupation fractions (Habouzit et al., 2019), despite it being sub-dominant in terms of overall energy output compared to the thermal mode.
Although it supplies most of the feedback energy, the thermal mode appears to be relatively ineffective. This is likely due to the fact that the thermal energy is deposited in a region close to the BH which is usually comprised of dense, star-forming gas. The injected energy is then (1) radiated away very efficiently, since cooling processes scale with , or (2) if the gas is star-forming it is governed by en effective equation of state (see Section 2.3) which will set an artificial temperature regardless of the amount of injected thermal energy (Weinberger et al., 2018). Since kinetic energy is agnostic to both radiative cooling and the equation of state of the gas, the kinetic mode can have a larger affect on the gas even if its total energy injection is considerably lower.
2.3 Star formation and the effective EOS
Star formation in the TNG physical model follows the Springel & Hernquist (2003) model for star formation in a pressurised, multi-phase ISM. Gas elements whose number density is above are designated as ‘star-forming’ and no longer follow the ideal-gas equation of state (EOS), but are placed on an effective EOS, which mimics the pressure support supplied by unresolved SN feedback. This star-forming gas is converted to stars stochastically following the Kennicutt-Schmidt relation and assuming a Chabrier (2003) initial mass function.
Since the thermodynamics of the star-forming gas are governed by this effective EOS, which is not meant to reproduce the realistic physical state of the gas, we will ignore this gas phase when extracting the mean values of gas properties such as temperature, density, entropy, and cooling time.
2.4 The TNG galaxy sample
Identification of bound objects in the TNG simulations is obtained through a two-tier approach: the Friends-of-Friends (FOF) method is used to identify distinct host haloes or ‘FOF Groups’ . For each of these haloes we define the ‘virial’ parameters: The virial mass, , and virial radius, , according to the relation
| (3) |
We further define the virial temperature and virial velocity
| (4) | ||||
| (5) |
where is the Boltzmann constant and is the average mass per particle, with being the proton mass, and being the mean molecular weight.
Within each host halo, the subfind algorithm (Springel et al., 2001; Dolag et al., 2009) is used to identify groups of gravitationally bound resolution elements (dark matter particles, stellar particles, gas cells, etc.), commonly known as sub-haloes555Only one level of sub-halo identification is considered here – sub-haloes of sub-haloes are typically below the limiting mass resolution.. With this approach every resolution element of a sub-halo is naturally also part of the host halo, but some resolution elements of the host halo are not bound to any of the sub-haloes. We filter out objects from our sample which were not formed in the traditional cosmological framework of structure formation through gravitational collapse, but rather are baryonic clumps which fragmented out of galactic gas in already formed galaxies. In detail, we follow the method described in Nelson et al. (2019a).
The centres of both host haloes and sub-haloes are set as the position of the most bound resolution element. Sub-haloes typically contain a stellar population, i.e. a galaxy, and the centre of this stellar distribution typically, but not always, corresponds to the sub-halo centre. For each host halo, the most massive, most gravitationally-bound sub-halo, whose centre invariably coincides with the host halo centre, is defined as the central sub-halo, and in what follows we define the galaxy of this sub-halo as the central galaxy of host halo. In most cases, the central galaxy is the most massive one in the halo; i.e. in the group or cluster.
In this study we focus on the central galaxies found in the TNG100 and TNG300 simulation volumes. We focus on the central galaxy population and exclude satellite galaxies since the latter are affected by environmental quenching processes. To ensure that our galaxy sample includes only well-resolved systems, we enforce a lower mass limit for the galactic stellar mass of . In our analysis we examine various properties of the gaseous medium in and around the galaxies; e.g. temperature, entropy, density, etc. Obviously these properties can be defined only for those galaxies which contain gas, further limiting our sample to galaxies with .
There is an important point to be made about our chosen mass limit with regards to the figures shown here. In many figures in this paper, we plot the distribution of our galaxy sample in various 2D galaxy-property spaces, e.g. sSFR–stellar mass and entropy-stellar mass (Fig. 5). In these figures we use contours to show the number of galaxies in different regions of the plane, which taper off toward the enforced lower mass limit. Naturally, if lower mass galaxies had been included in our sample, the contours would have extended to include those as well.
Finally, with the goal of examining the role of AGN in the quenching of central galaxies, we wish to filter out those galaxies which, although at the time of inspection are labelled as centrals, in the recent past were identified as satellites; i.e. those that may have undergone environmental quenching processes specific to satellites and would otherwise bias our description of the physical processes at play. These galaxies may be ‘back-splash’ galaxies- galaxies which recently travelled as satellites through a host halo and came out on the other side (Gill et al., 2005). To remove these galaxies, we follow the main-progenitor branch of the sublink merger tree (Rodriguez-Gomez et al., 2015) for each central galaxy (at and remove it from our sample if both of the following conditions are satisfied within the last 5 Gyr (since ):
-
-
Identified as a satellite by the subfind algorithm.
-
-
Found at a distance of more than from the centre of its host halo.
Our final sample includes central galaxies in TNG300. While most of the results we present are based on the galaxy population analysis of the TNG300 simulations, we have repeated our analysis on the TNG100 simulation box, with a sample of galaxies, with identical results (see appendix A).
2.5 Some basic definitions
We here present the definitions of important quantities we use throughout the paper: the subdivision of the gas into different spatial regions, gas entropy, cooling time, and free-fall time. We emphasise that when calculating both the entropy and cooling-time we ignore the star-forming gas, as described in Section 2.3.
2.5.1 The gas components
Since we wish to study the effects of AGN feedback on the galaxy itself as well as the surrounding CGM, we divide the gaseous medium of each sub-halo into the following 3 components: galactic gas, inner CGM and outer CGM. These components are determined by two radii: the galactic radius is defined to be twice the 3D stellar half-mass radius in the sub-halo
| (6) |
and the half-mass radius of the gaseous distribution in the sub-halo . Throughout the paper, galaxy stellar masses are obtained by summing up the stellar particles within and the star formation rates are, unless otherwise stated, obtained from the instantaneous SFRs of the star-forming gas cells within the same aperture.
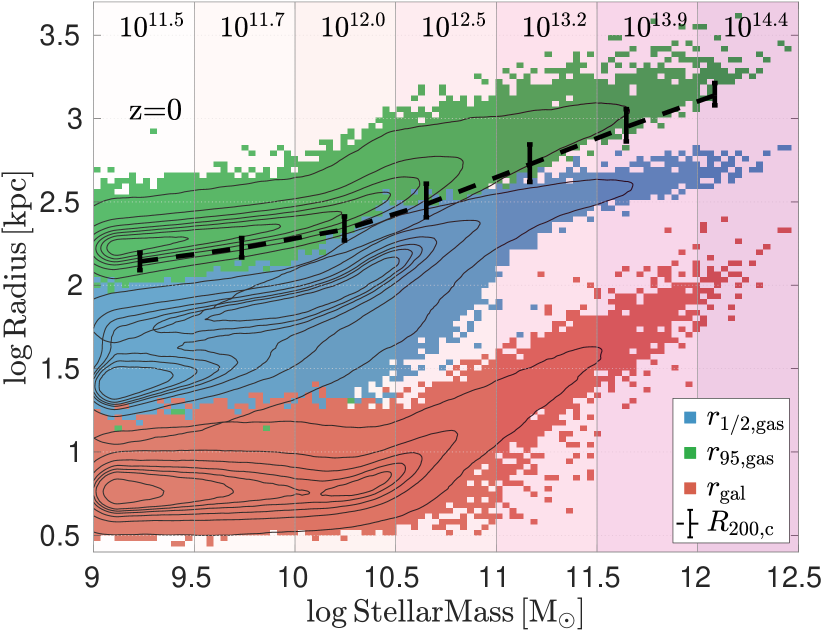
In Fig. 2 we show the distribution of these radii for our galaxy sample, as a function of galaxy stellar mass. We also present the radius which encloses 95 per cent of the gas mass in the central subfind object. The median virial radius of the host haloes is shown for comparison. As can be seen, the gas that is gravitationally bound to the sub-haloes usually extends to well beyond the ‘virial’ radius, defined by the total mass distribution. In this sense, should not be taken to be a sharp ‘edge’ of the system, but rather a typical length-scale of the host halo (Zinger et al., 2018).
The three components are thus defined to be
-
•
Galactic Gas – all the gaseous material in the sub-halo enclosed within .
-
•
Inner CGM – All the material found beyond and within .
-
•
Outer CGM – All the material found beyond , yet still gravitationally bound to the sub-halo. This typically includes gas found beyond of the host halo.
In the calculation of the thermodynamic properties: temperature, entropy and cooling times, we ignore the star-forming gas (which is placed on an effective EOS Section 2.3), and find the mass-weighted average over the non-star-forming gas cells. The galactic gas component is typically comprised on average of several hundreds of non-star-forming gas cells in galaxies of stellar masses of . The inner and outer CGM components of these galaxies each contain several thousands to tens of thousands of non-star-forming gas cells. In higher mass galaxies, the number of cells in these component is even larger. In Table 1 we give the average cell size for each of the three components, with the average taken over all non-star-forming gas cells in all objects of our sample (Section 2.4).
2.5.2 Gas entropy
The gas entropy is an important indicator of the thermodynamic state of the gas. In what follows, we use the common definition of ‘astrophysical’ entropy for a gas element
| (7) |
with the Boltzmann constant and the number density of the gas cell. For a collection of gas cells we take the mass-weighted average as a representative value.
It is instructive to obtain an estimate of the ‘virial’ entropy – what the entropy of the gas would be within the gravitational potential of a host halo, in the adiabatic case, i.e. when cooling/heating and feedback processes are ignored. By using eqs. 3, 4 and 5 we arrive at the relation
| (8) |
where is the baryon fraction within the halo. In the purely adiabatic case the gas fraction within a halo should follow the universal baryonic fraction , and we adopt this value to gain an estimate for the entropy of a halo of a given in the adiabatic case.
2.5.3 Cooling time
The cooling time of a gas cell is calculated as
| (9) |
where is the internal energy per unit volume in the cell, are the number density of ions and electrons, and is the normalised cooling rate (in units of ). For a primordial composition, with a Hydrogen mass fraction of , is the ratio of Hydrogen to Helium atoms, is the average mass per particle (), and is the number of electrons per particle. To obtain a typical value of the cooling time (last line of eq. 2.5.3) we define the scaled parameters , , and .
In practice, the simulation code records the internal energy per unit mass , the net cooling rate , and the gas mass density for each cell in the simulation. The number density of the ions and electrons are given by the relations
| (10) |
and thus the cooling time for each cell is calculated with the following expression
| (11) |
The cooling time is set by the local thermodynamic conditions of a given gas element. When calculating the cooling time of a given gaseous region we take the mass-weighted average over all gas cells in that region. In addition, we note that some cells have a negative cooling rate, or rather a heating rate – we ignore these cells when calculating the mass-weighted average.
2.5.4 Free-fall time
The free-fall time sets a timescale for a gas element to reach the centre of the potential well, and is set by the total mean-density of the FoF halo enclosed within the radial position of a gas element, ,
| (12) |
We note that the free-fall time is a monotonic function of the radial position within the halo. Regardless of the mass profile of any individual haloes, the definition of the virial quantities, eq. 3, sets the free-fall time at to be .
3 The galactic gas and gaseous haloes of TNG galaxies
3.1 Visualisation of the gas within and around galaxies
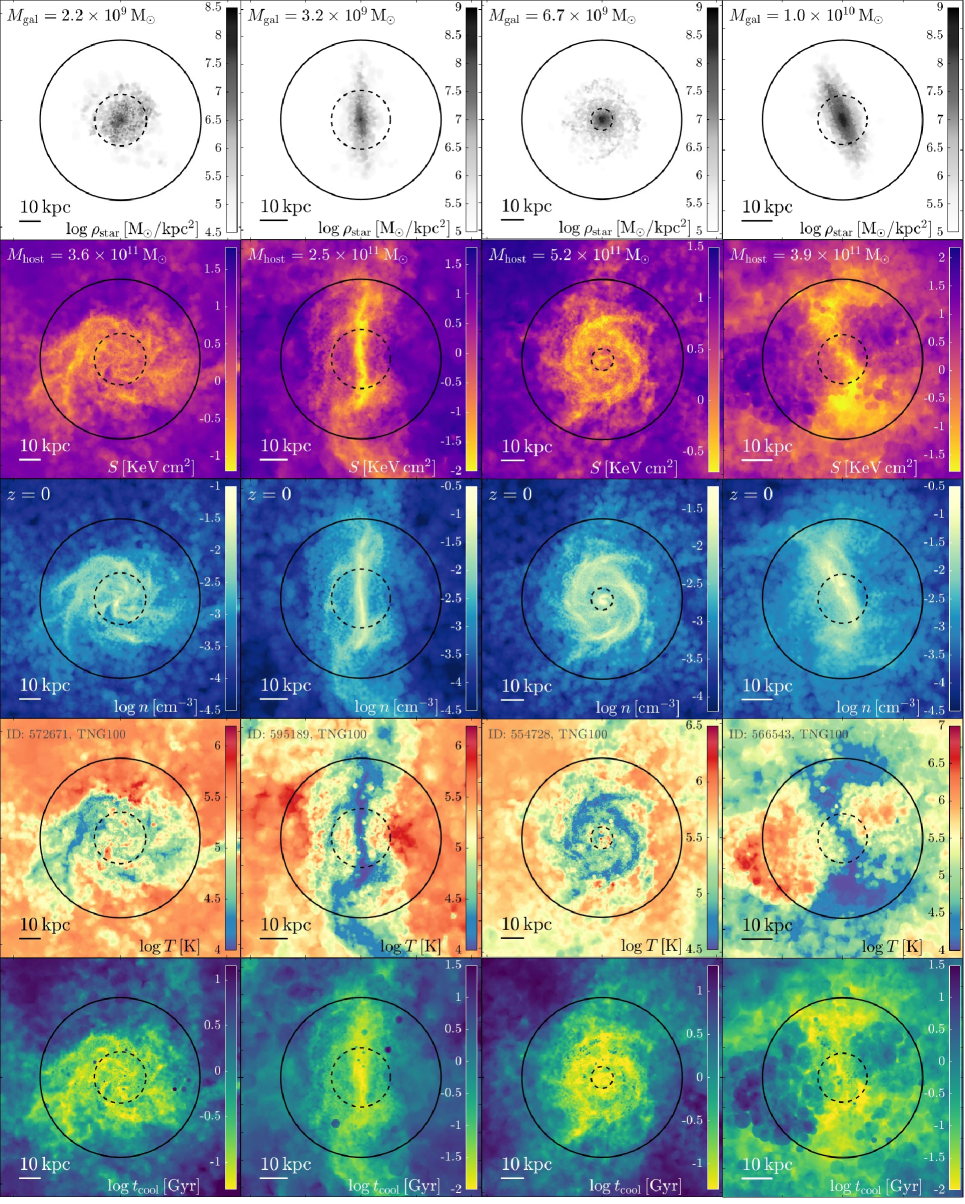
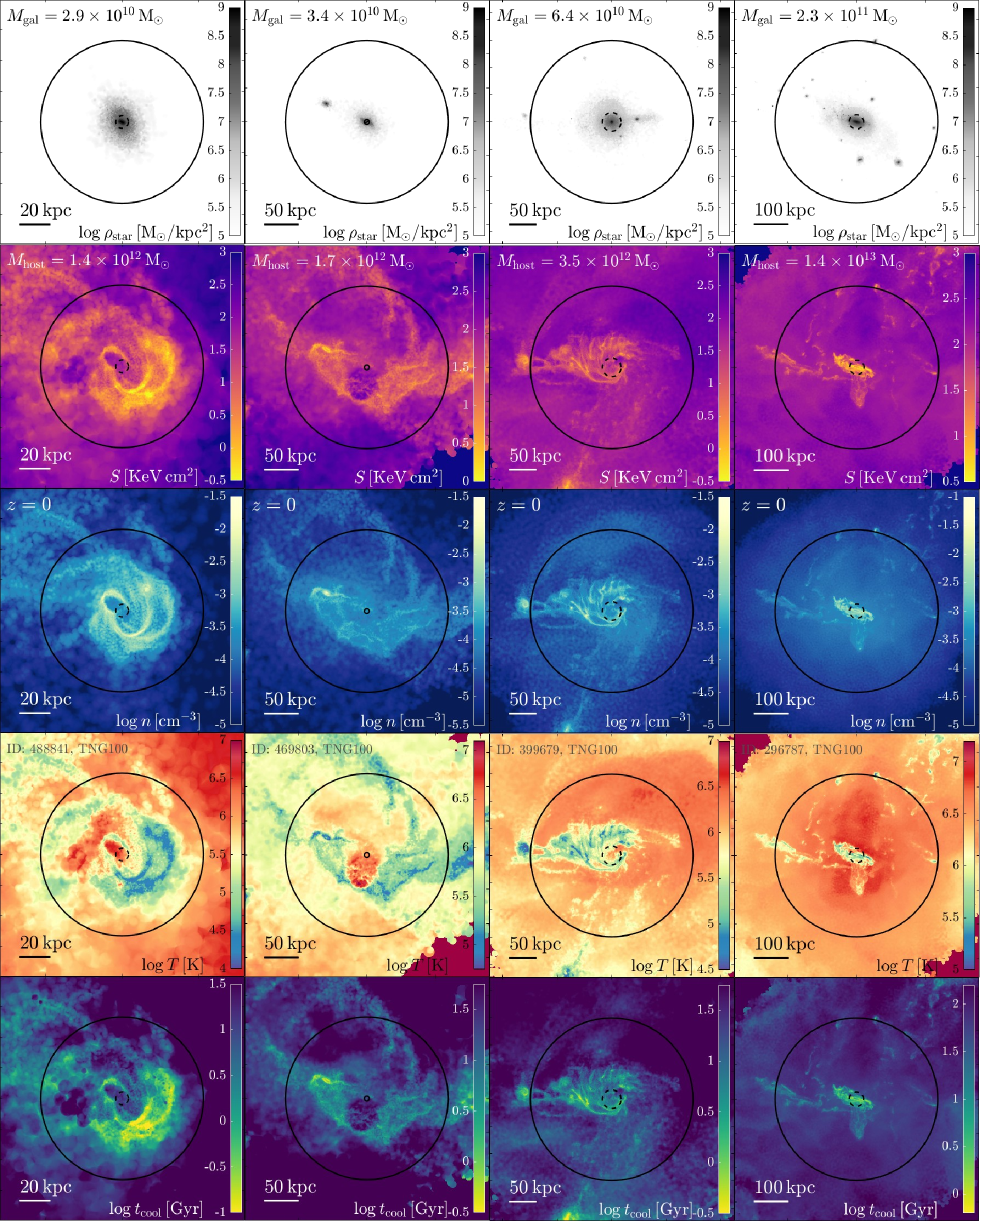
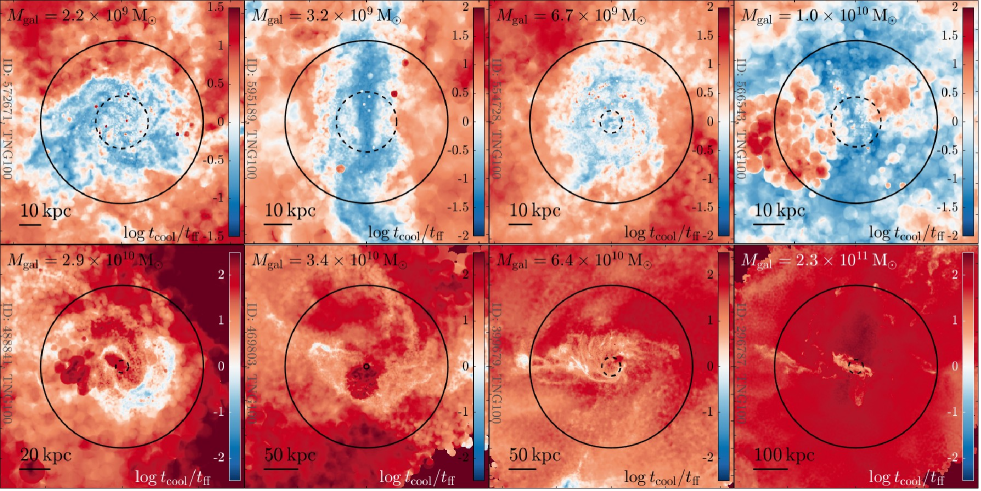
In Fig. 3 we show 8 representative central galaxies at extracted from the TNG100 simulation that span the mass range explored in this study. The images focus on the inner CGM and galactic gas regions of the galaxy. For each galaxy we plot, from top to bottom, the projected stellar surface density, entropy (eq. 7), gas number density, temperature, and cooling time (eq. 2.5.3). As in every calculation of these quantities, only gas which is not star-forming is used to calculate the entropy, temperature, and cooling times shown in these images. The number density of the gas, however, depicts all the gas, including the star-forming gas cells.
Since the host galaxy and host mass span several orders of magnitude, the typical values of these properties can vary greatly over the galaxy selection, and thus the colour-bars of these images are not consistent across images, and have been set to enhance the important features in each image.
The inner dashed circle, of radius , denotes the ‘galactic gas’ region, and the outer solid circle is of radius . The region between the two circles is the ‘inner CGM’ region, with the ‘outer CGM’ found beyond the circle, as defined in Section 2.5.1.
These maps are plotted from slices taken from the TNG100 simulation, and contain all the material from the FoF host and thus also include stellar particles and gas cells which do not belong to the central subfind halo. The slice thickness for each galaxy is equal to twice the gas half-mass radius, , and thus is equal to the diameter of the outer circle in each plot. The stellar surface density is projected along the slice. For the other quantities we show the average along the slice – a simple average for the gas number density and mass-weighted averages for the other quantities. The stellar mass and host mass, , of each system are shown in the first and second rows, respectively (the galaxy ID in the TNG catalogues is shown in the second row from the bottom).
Examining the stellar surface density plots (top row) we see that the stellar distribution often extends beyond our chosen galaxy size which is meant as a typical length-scale rather than a sharp border.
In the low-mass galaxies (part 1 of the figure), the galactic disk is embedded within a much larger gas disc, which can seamlessly connect to the large scale filaments of the cosmic web, as seen in the second system from the left. Here too, it is difficult to determine where the galactic gas ends and the CGM begins. In the higher mass systems (shown in part 2), the gas distribution beyond the galaxy is less ‘ordered’ and shows more signatures of past and ongoing merger events. In all cases, the conditions of the CGM are not uniform – areas of hot and cold gas are found side by side and the cooling times of different gas regions can vary by several orders of magnitude. We address the multi-phase nature of the CGM, as it pertains to our findings in Section 3.6.
The right-most system in the lower-mass, first part of the figure, captures a bipolar high-entropy outflow originating from the central region of the galaxy. The outflow is hotter than the surrounding gas, but of similar density to its surroundings. The source of this outflow may be stellar/SN feedback, thermal mode or kinetic mode AGN feedback, or some combination of all three. The stellar mass of this system is found below the transitional mass scale of , and its BH mass, , is likewise below the threshold where the kinetic mode has become comparable to the thermal mode. However, we have confirmed that this BH has indeed experienced kinetic feedback injection events in its history, with a cumulative injected kinetic energy of , which is relatively high compared to most BHs of this mass (see Fig. 1).
Nelson et al. (2019b) carried out an extensive study of such outflows in the TNG50 simulation (the smaller volume/higher-resolution run of the TNG project) showing that these outflows also originate from the action of the kinetic mode AGN feedback. Even though each kinetic feedback energy injection event is assigned a random direction, the resulting outflows follow the path of least resistance and form collimated outflows perpendicular to the galactic disc. While the cooling time in the outflow is quite long, (see bottom panel), the cooling time in the extended gas disk is of only of order . So even as the AGN is pushing gas out of the galaxy, more gas can be accreted to take its place. The continuous feeding of gas into the galaxy and the BH can generate a continuous outflow.
We can see the AGN feedback at work in the two systems on the left of part 2 of the figure. In both systems a hot, dilute (and therefore high-entropy) region can be seen originating from the galaxy. In the more massive of these two, the high-entropy ‘bubble’ has a diameter of .
In the most massive system, right-most in the second part of the figure, one can make out a succession of shock fronts, especially visible in the temperature map (second panel from bottom). These shocks may originate from gas pushed out by kinetic mode feedback and interacting with its surroundings. In high-mass systems such as this, there is little new gas accretion, which in turn makes the kinetic feedback more episodic. The individual shock fronts may correspond to individual injection events.
Many of the physical processes described above such as gas outflows, shock formation etc., can be seen in action in a movie which follows the evolution of a central galaxy in the TNG100 simulation. We invite the reader to view the movie here: www.tng-project.org/movies/tng/tng100_sb0_194946_zinger20.mp4.
3.2 The gas entropy of star-forming and quenched galaxies in TNG300
The important role that AGN feedback plays in quenching the star formation of its host galaxy within the framework of the TNG physical model has been studied previously. For example, Nelson et al. (2018a) showed that the TNG model reproduces the galaxy colour bi-modality, with the transition stellar mass scale found at as in observations. Weinberger et al. (2018) demonstrated that the onset of quenching occurs thanks to the kinetic mode feedback, and Terrazas et al. (2020) showed that the quenching of star formation follows once the cumulative energy injection of the kinetic mode exceeds the binding energy of the gas in a galaxy, leading to gas depletion. In what follows, we consider the quenching process as it relates to the conditions found in the gaseous components within the galaxy and beyond, in the CGM. We begin by characterizing the entropy of the gas.
In Fig. 5a we show the distribution of the TNG300 central galaxy population on the stellar mass-sSFR plane. In this plot, and in all similar plots that follow, we group the galaxies on the plane into bins which are adaptively sized to ensure that no more than 30 galaxies are found within each bin. The colour of each bin is set by the median value of the property under consideration, in this case the entropy of the galactic gas.
It is important to note that owing to the mass resolution limit of the simulation, the SFR in some galaxies falls below a certain resolved value and so it is in practice equal to zero (see Donnari et al., 2019, for a discussion). Throughout this paper, such galaxies are given an arbitrary sSFR value ‘by hand’ in the range so that they will appear in the plots – in Fig. 5a this is the flat horizontal band in the bottom of the top panel. In addition, black contours denote the distribution of the galaxy population on the plane: they enclose the 5, 15, 25, 35, etc. percentiles of the entire galaxy population in the depicted plane, with the outermost contour enclosing 95 per cent of the population. The values at the top of the coloured bands in the figures show the mean of the host haloes of the galaxies within the mass range defined by the bands.
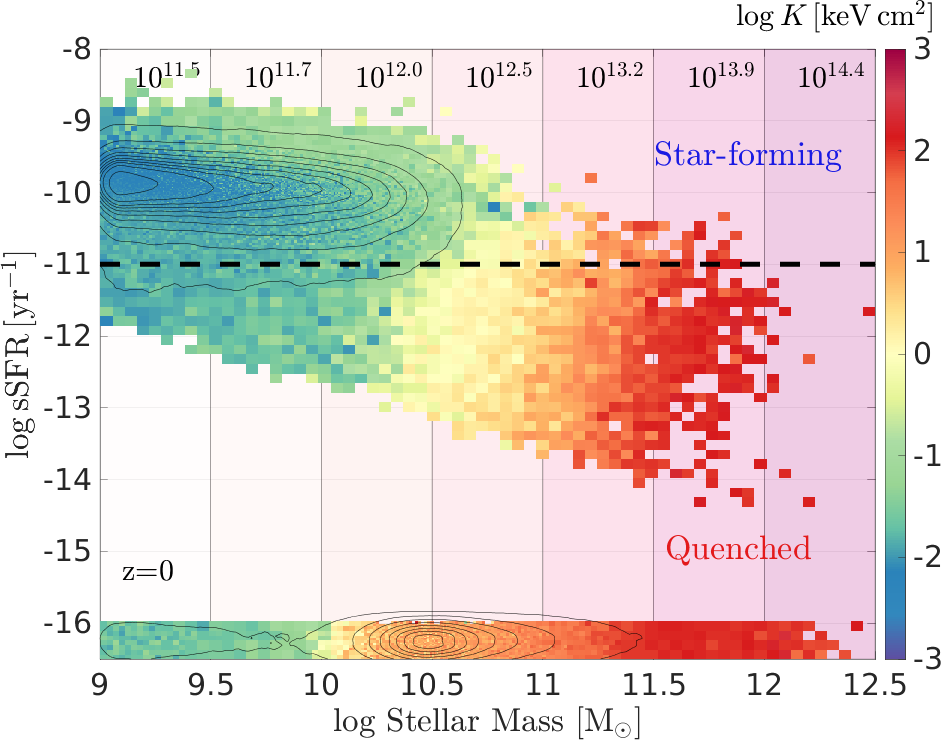
The star-forming sequence of galaxies is clearly evident in the low mass end. Above a stellar mass of , most galaxies are ‘quenched’, i.e. fall below the locus of the star-forming main sequence (or rather, below its extrapolation towards the high-mass end). In fact, most of them possess so low star-formation rates that they are unresolved by the simulation. We note that there are many galaxies, especially in the high-mass end, which are forming stars at rates of , but would still be considered quenched due to their high stellar mass, and thus low sSFR. In terms of numbers, the quenched population comprises 23 per cent of the total galaxy sample in TNG300 and 15 per cent of the TNG100 galaxy sample for the same stellar mass minimum of (see Section 2.4).
We divide the galaxy population into star-forming vs. quenched galaxies by using an sSFR threshold of to separate the two groups. This threshold is based on the bi-modal distributions of galaxies at in observations (e.g. Brinchmann et al., 2004; Kauffmann et al., 2004; Wetzel et al., 2012), as well as simulations (e.g. Donnari et al., 2019, for the TNG suite).
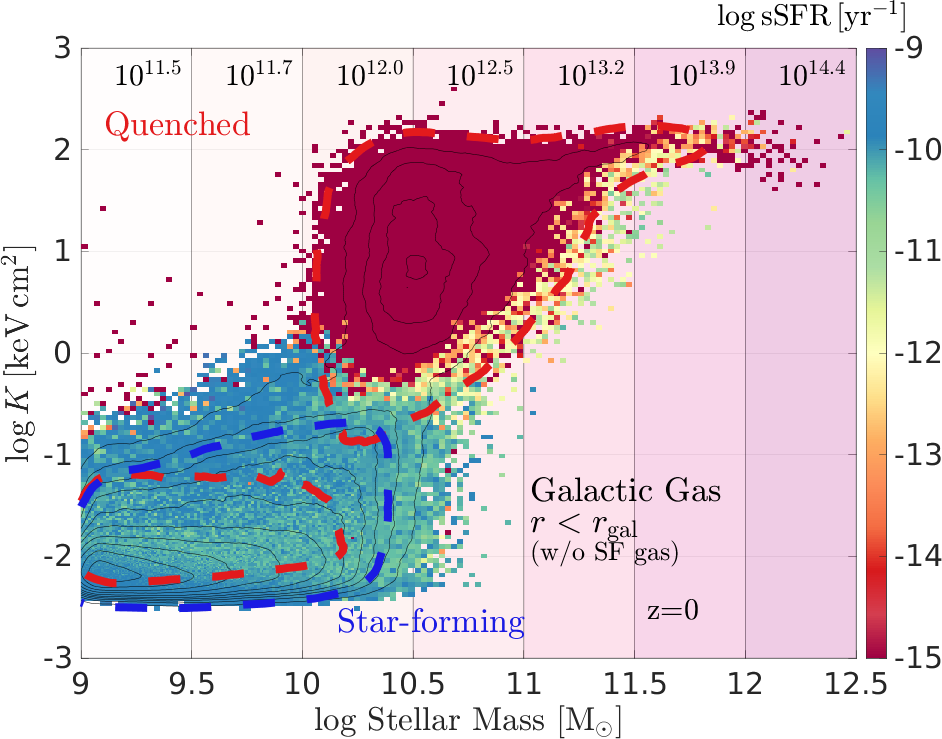
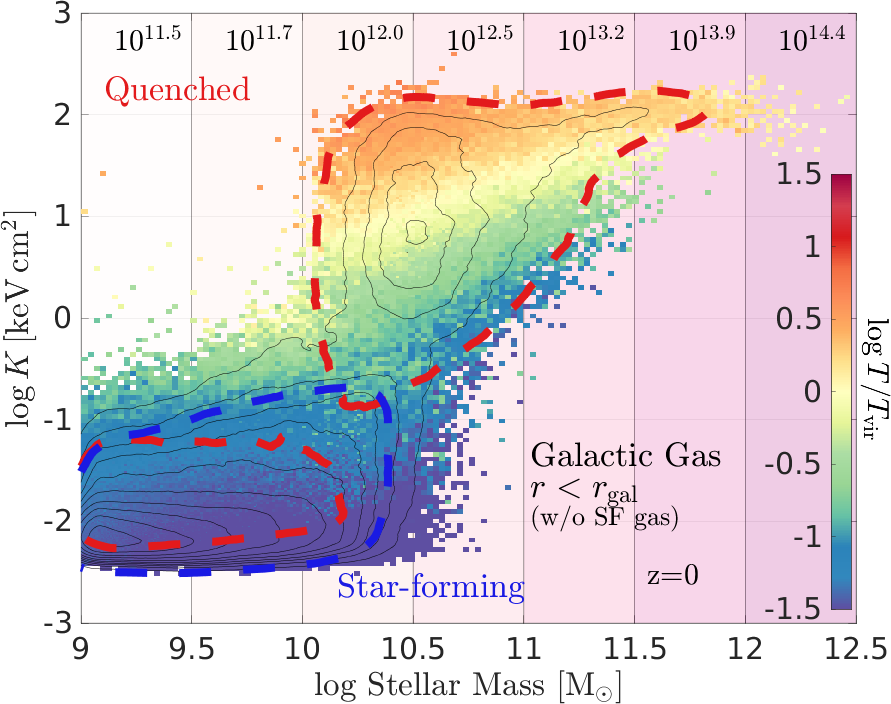
The transition between the star-forming and quenched population is seen to correspond to a jump in the entropy of the galactic gas. This transition is more striking when displayed in the entropy-stellar mass plane (Fig. 5b) where the colour-coding now shows the sSFR of the galaxy. The star-forming and quenched population each inhabit a distinct region in this plane, with the transition between the two occurring at the transitional stellar mass scale of , where the kinetic mode feedback becomes a significant source of energy, as seen in Fig. 1b. Because the entropy of the gas scales as , this separation may indicate that the gas within galaxies is depleted or heated up, or a combination of the two.
An interesting feature of Fig. 5b is the appearance of an entropy ‘floor’ for the low-mass galaxies and an entropy ‘ceiling’ seen in the high-mass galaxies. The existence of the entropy ‘floor’ is set by the physical model of the TNG simulation: in the simulation gas cannot cool below , and as specified in Section 2.3, cold gas with a number density above is deemed star-forming and placed on an effective EOS and thus is no longer part of our analysis. Combining these two values in eq. 7 results in a minimal entropy value for the gas of . There is no straightforward physical reason for the existence of a limiting entropy value, and indeed, when examining the entropy of the inner and outer CGM (see Fig. 7) we see that there is no maximal value for the entropy of the gas. In the outer CGM of high-mass galaxies, where the gravitational potential of the host halo determines the gas entropy, it is seen to rise with host mass. The entropy limit seen in the galactic gas may be a matter of buoyancy – when the entropy of a gas element is higher than its surrounding, a buoyant force is exerted on it, accelerating it outward (Keller et al., 2020), until it is no longer found within our prescribed radial distance limit .
The classification of star-forming vs. quenched galaxies is shown in Fig. 5b, and in all subsequent figures, by the blue and red contours, each of which encloses 90 per cent of the star-forming/quenched population respectively. While there are some galaxies at the high-mass end which are considered to be star-forming, their numbers are very small. However, we do find a non-negligible group of low-mass, low-entropy galaxies which are quenched, as marked by the red contour in the bottom-left corner. Though the size of the contour is not an indication of the size of this galaxy sub-sample, but rather their spread in stellar mass and entropy, we find that these objects comprise roughly 3.5 percent of the total galaxy population and 15 percent of the quenched population in TNG300 for stellar mass (in TNG100, a similar population comprises 0.5 percent of the total galaxy population and 3.4 percent of the quenched population). We reiterate that these numbers reflect the population after removing satellites and ‘back-splash’ galaxies from the sample. We discuss this curious sub-sample of quenched galaxies in appendix B.
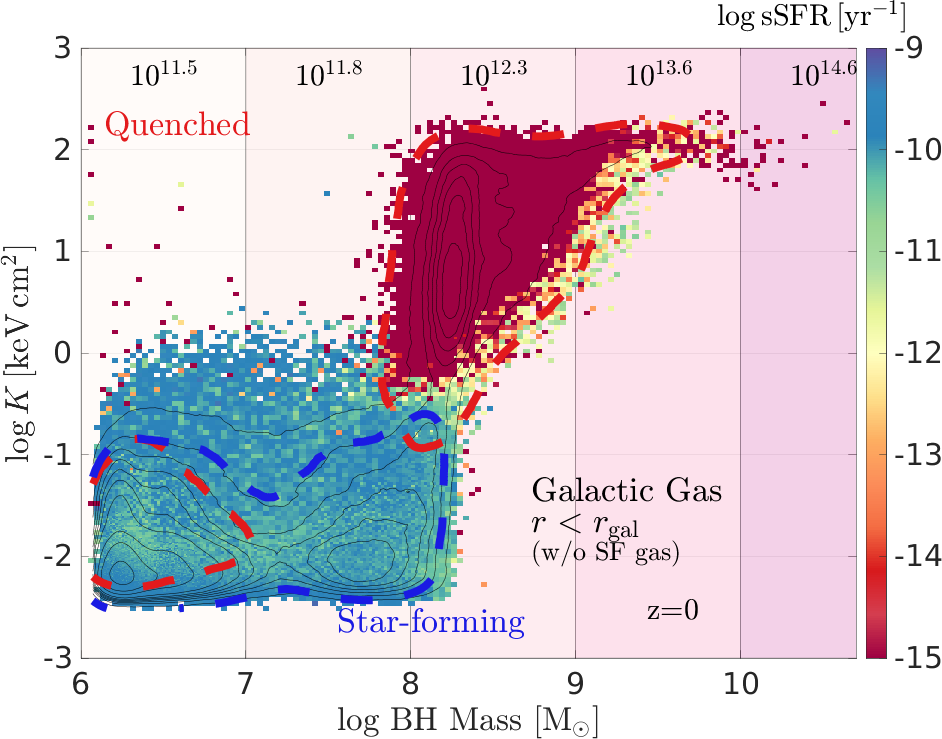
The decisive role of the kinetic mode feedback in this transition is all the more evident when the galaxy entropy is displayed vs. the mass of the central black hole, as shown in Fig. 6a. The transition from star-forming to quenched, and the corresponding jump in entropy occurs very sharply at the transitional black hole mass of found in Section 2.2.1 (Fig. 1a). We speculate that the bi-modality in BH masses, seen earlier in the inset of Fig. 1b, is also evident in this figure. The cause for the bi-modality is most-likely the regulation of the BH growth by SN feedback in low mass galaxies (see Section 2.2.1 for details).
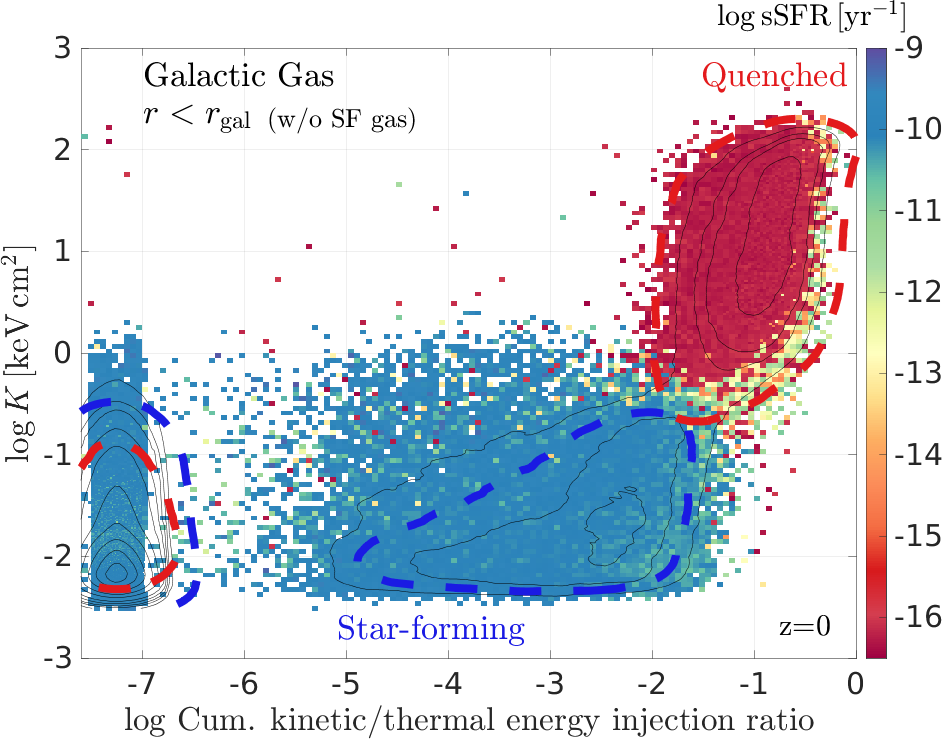
The relative role of the two feedback modes is further studied in Fig. 6b where we show the ratio between the cumulative energy injected by the central BH in the kinetic mode and the energy injected by the thermal mode666The value of the cumulative energy in both the kinetic mode and thermal mode for a BH particle includes the energy injected by all the progenitors of the BH. Thus, some of this energy may have been injected in the smaller progenitors which built up the central sub-halo, before they were accreted.. As shown in Section 2.2.1, roughly 60 percent of all galaxies, all of low mass, have not experienced a single kinetic energy feedback event. We have shown these in the vertical band at the left end of the plot, by assigning them arbitrary -axis values below . It is interesting to note that most (78 percent) of low-mass/low-entropy quenched galaxies are of this group.
When the kinetic mode mode is responsible for more than a few percent of the total energy output of the AGN, the entropy of the galactic gas jumps to much higher values and the host galaxy becomes quenched. The contribution of the kinetic mode to the total energy output is always sub-dominant, yet even this small contribution has an appreciable effect on the galaxy properties, which can extend even to the surrounding gas and leave its mark on the entire sub-halo CGM (see Fig. 7 and Section 3.4).
The jump in entropy which follows the onset the kinetic mode mode feedback indicates that the gas has been heated, depleted or most likely both, by the kinetic energy supplied by the AGN (see eq. 7). We observe this process in action in Fig. 3: in the two left-most galaxies in the second part, of masses and , we see a hot, dilute ‘bubble’ emanating from the central region.
3.3 The thermodynamic state of the gas within galaxies
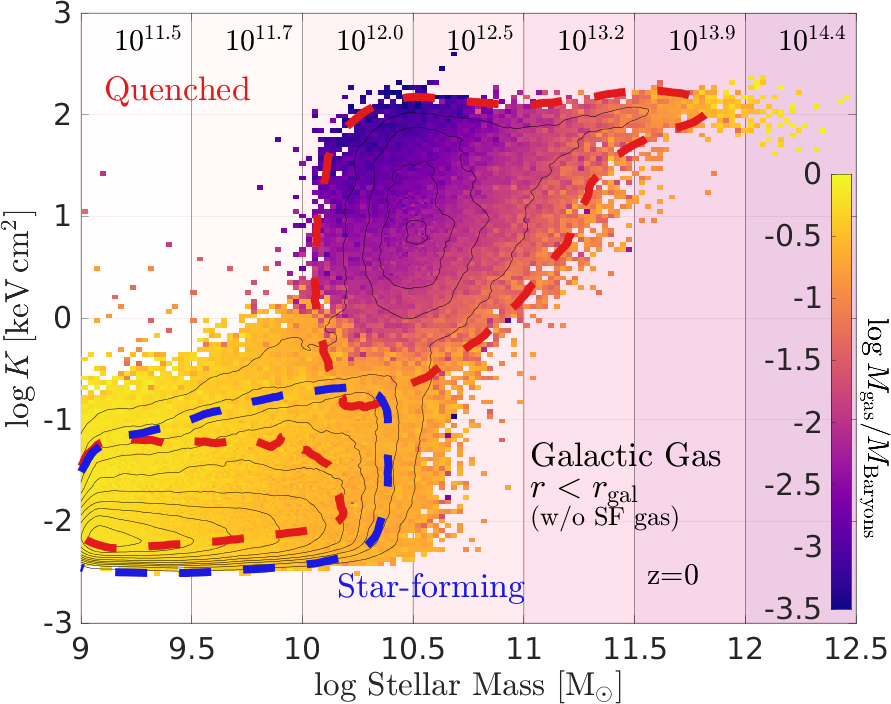
In Fig. 7, left column, we characterize the temperature, gas mass fraction, and cooling time of the gas within the galaxies (), from top to bottom. As a reminder, the color-coded values are averages of all the galaxies in each pixel, where values for individual galaxies are themselves an average of the gas within the galactic component.
In the top left panel (Fig. 7a), we show the mean temperature of the galactic gas, normalised by the virial temperature of the host halo, for the distribution of the galaxies in the entropy-stellar mass plane. As mentioned above and throughout the paper, we only consider the gas within galaxies and haloes that is not star-forming when deriving an average gas temperature. While the (non-star-forming) gas within star-forming galaxies is cool, and close to the lower limit of (as seen in the low-mass galaxies shown in Fig. 3), in the majority of quenched population the average gas temperature is as hot, or as much as 10 times hotter than, the virial temperature of the host halo. This shows that feedback processes inject additional energy into the gas beyond what is available through gravitational infall into the host halo.
In Fig. 7d we show the fraction of gas to total baryon mass, , within the galaxy (). Here too we see high gas content in star-forming galaxies, whereas in most of the quenched galaxies, less than a few percent of the mass is comprised of gas.
The kinetic mode feedback therefore not only heats the gas to beyond the virial temperature, it can remove it altogether to beyond . This is especially true for the galaxies just at the mass scale. Of all galaxies affected by the kinetic mode feedback, these have the shallowest potential wells and their gas is most susceptible to the feedback. This result is complemented by the findings of Terrazas et al. (2020), who analysed the TNG100 simulation, and found that the shutdown of star formation occurred in galaxies in which the cumulative energy injected by the kinetic mode of the central BH exceeded the gravitational binding energy of the gas in the galaxy.
Indeed, when examining galaxies of higher mass, we see that they still contain large amounts of gas, which is kept hot by the AGN and thus maintaining their quenched state. This can be seen in the most massive galaxy shown in Fig. 3: a gaseous disk of density is found in the centre of the galaxy, with a temperature of , and cooling times of order several Gyrs.
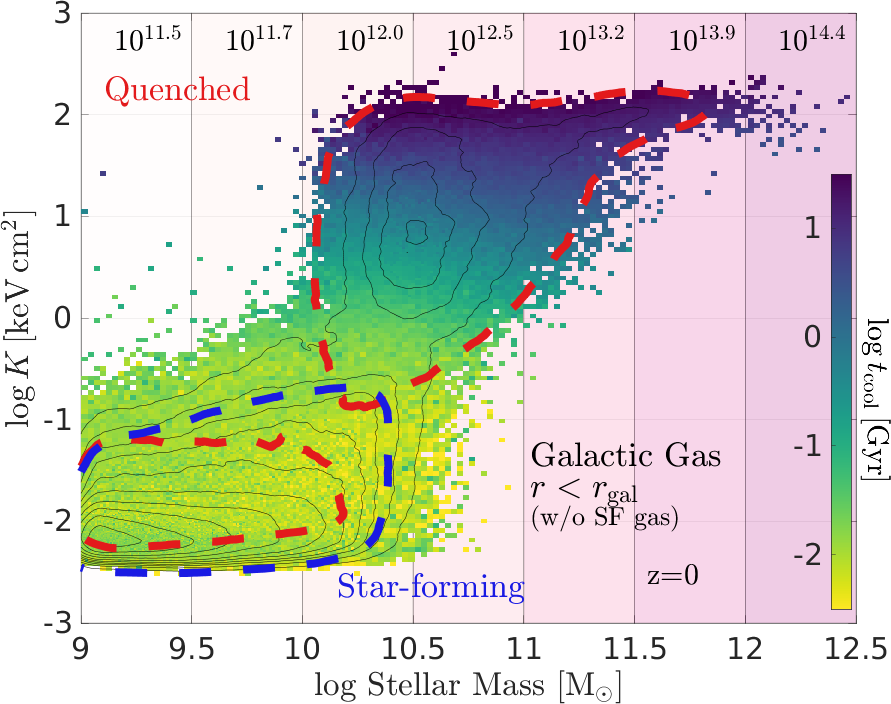
In Fig. 7g we examine the cooling time of the galactic gas, which naturally reflects the star-forming efficiency of the galactic gas. The value of the cooling time in the gas here and in Figs. 7h and 7i appears to correlate strongly with the entropy (see also Davies et al., 2019a). In star-forming galaxies the cooling time is of order . For the quenched population, galaxies with high entropies of exhibit cooling times of and above. This implies that the quenched state of these galaxies will be long-lived since the gas cannot cool efficiently to form stars. Gas repletion from the CGM of these galaxies is even less likely, since the cooling time in the CGM is of order and above for these galaxies, as can be seen in Fig. 7h.
For quenched galaxies in the entropy range the cooling times are of order several hundred Myrs, but, as shown above, they contain very little gas. For a galaxy found at the peak of the quenched distribution, of mass and entropy of , the gas content is of order (Fig. 7d) with typical cooling times of order . Even if 10 percent of the available gas would form stars over a single cooling time (Krumholz et al., 2019, with actual star-formation efficiencies being of order per cent per free-fall time,), the fractional stellar mass increase would be . In comparison, the fractional stellar mass increase for a galaxy on the sSFR threshold over the same period would be roughly 3 times this value – thus even under these very favourable conditions, the galaxies are expected to remain quenched. The cooling times in the CGM of these galaxies is (see Fig. 7 and next Section) and is therefore not expected to be a significant source of gas accretion onto the galaxy. We revisit this line of reasoning in the Discussion section.
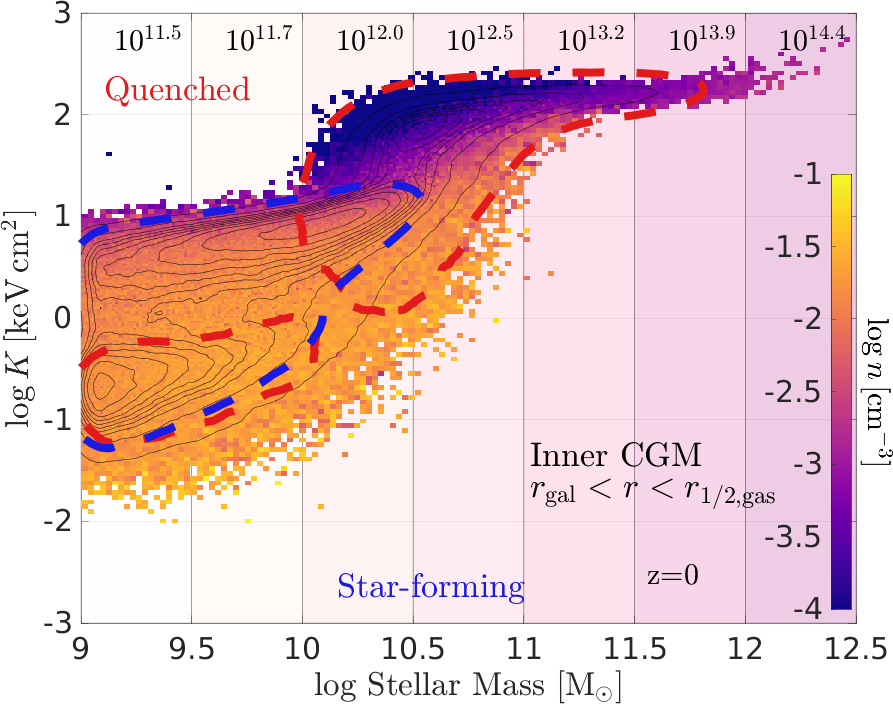
3.4 AGN effects on the gas properties in the CGM
The effects of the AGN are not limited to the gas within the galaxy but extend out to the surrounding CGM. We see this explicitly in Fig. 3, in the left-most galaxy of the first part, and the two right-most galaxies in the second part. In these galaxies, outflows originating from the central AGN create extended regions and ‘bubbles’ of hot and dilute gas in the CGM region, in which the cooling time is considerably longer than in unaffected regions.
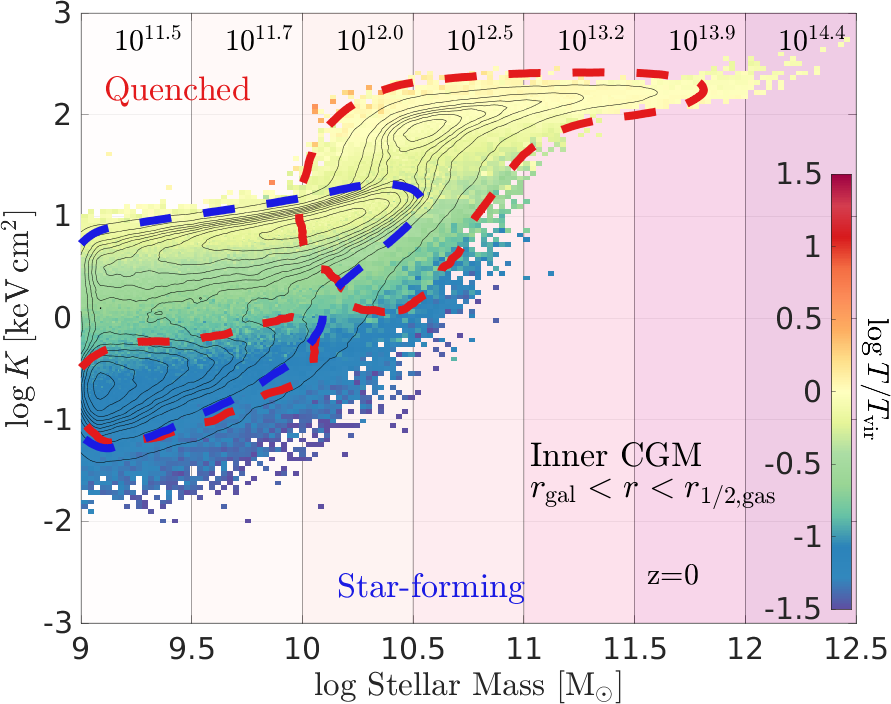
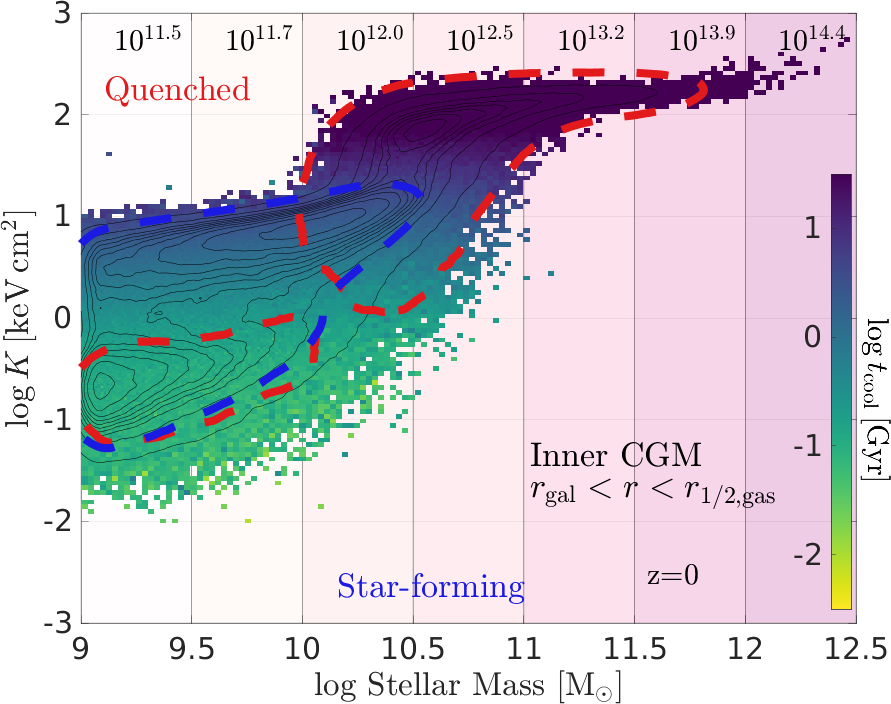
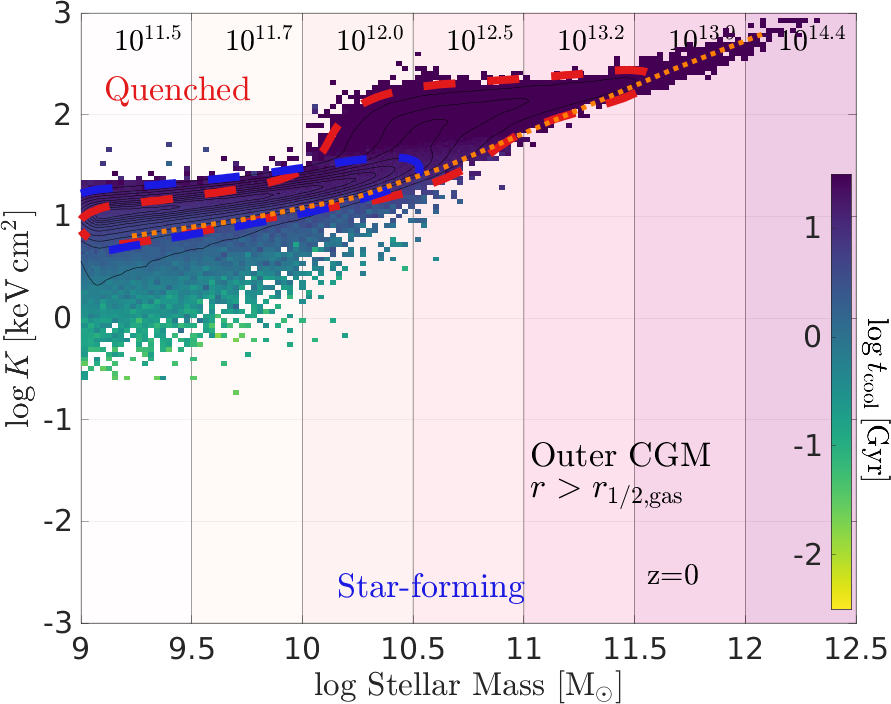
A more comprehensive and quantitative analysis is shown in Fig. 7, middle and rightmost columns, where we study the distribution in the entropy-stellar mass plane not only of the gas within galaxies (see previous Section), but also of that within the inner and outer CGM. Colour-maps show the gas temperature in units of the host halo (top row), the mean gas density (middle row), and cooling time of the gas (bottom row). Again, the depicted values are averages across galaxy samples of average gas properties within the different CGM components.
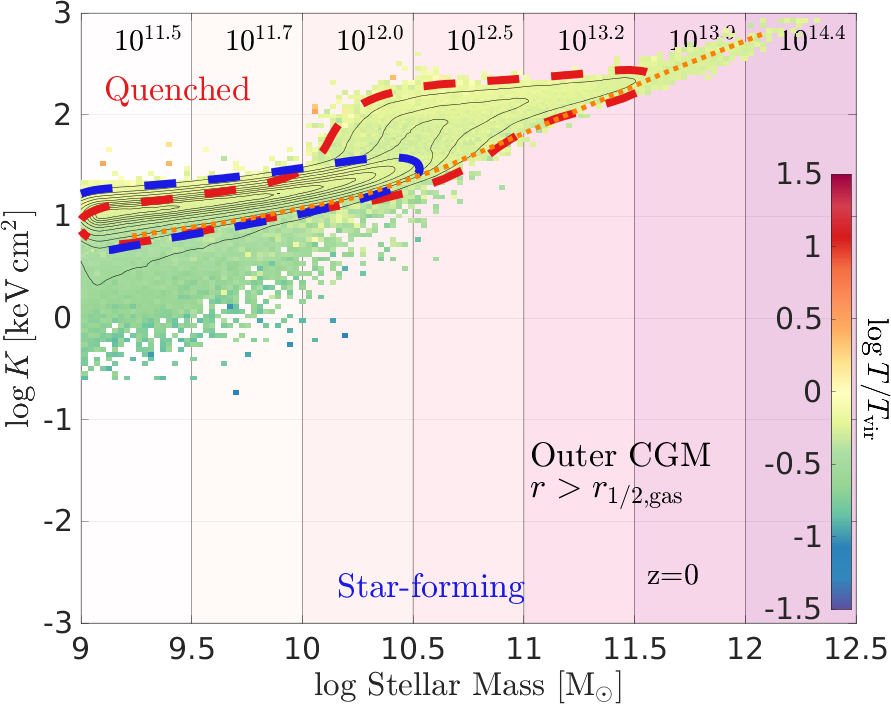
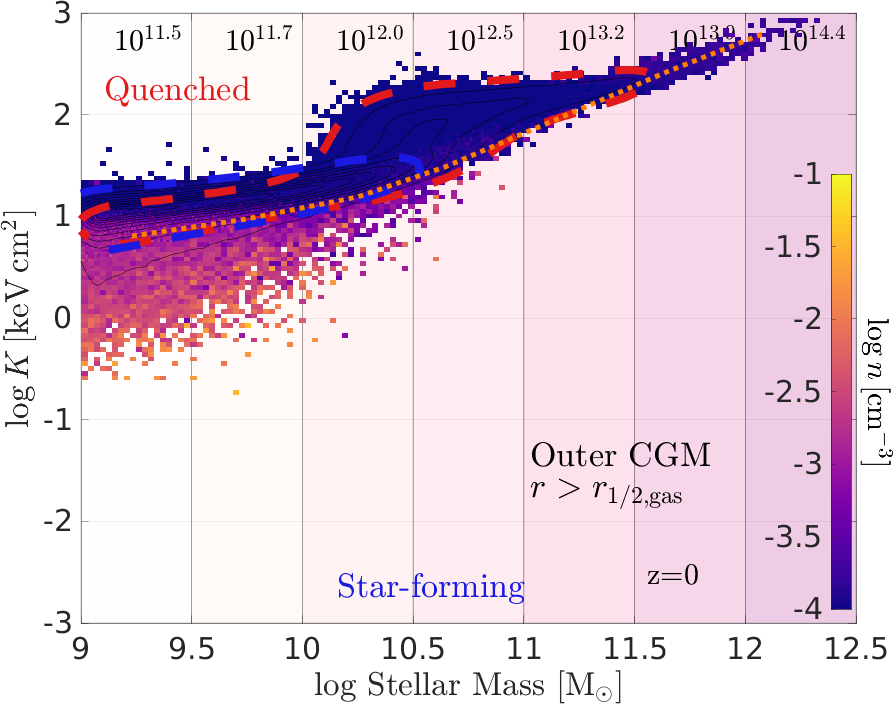
We find that the onset of the kinetic mode feedback at the transitional mass scale of leaves a distinct imprint in the gas entropy in the inner CGM and even in the outer regions of the gas halo, up to distances of several hundreds of kiloparsecs (Fig. 2). In the distribution of the outer CGM (Figs. 7i, 7c and 7f), we find that most galaxies lie on a relatively tight relation between stellar mass and entropy, set by the properties of the host halo. The orange dotted line shows the global entropy-halo mass relation one obtains in the adiabatic case (see eq. 8). In essence, this line shows what the average entropy of the gas would be for a halo of a given mass and a gas fraction equal to the universal baryon fraction, affected only by the gravitational potential of the host halo. The distribution of galaxies roughly follows this relation, except in the region where a prominent ‘bump’ of higher entropy values is found, where kinetic mode feedback becomes important. This shows that the effects of the AGN feedback can leave an imprint that extends to the gaseous atmospheres around galaxies.
Furthermore, it is interesting to note that in the low-mass range (below the transitional mass scale), the average entropy of the outer CGM is found to be above the adiabatic prediction, whereas in the high-mass range, the entropy of the outer CGM lies closer to the adiabatic relation. An excess in entropy above the adiabatic relation indicates that additional energy, beyond the gravitational potential of the halo, is imparted into the gas. The injected energy affects both the thermodynamic properties of the gas, and the gas fraction in the halo by removing some of it.
In the low-mass range, the energy injection is likely due to SN and thermal mode AGN feedback. When the kinetic mode becomes important, the excess in entropy grows considerably, indicating that the injection mode (kinetic vs. thermal) is of extreme importance in coupling the energy to the gas. As we examine haloes of even higher mass, the amount of energy which can be injected by SN and AGN becomes sub-dominant with respect to the gravitational energy of the host halo and the global entropy is set largely by the gravitational potential.
The average cooling time in the CGM of galaxies found at the transitional mass scale is the same as in the central galaxies of massive clusters, and is of order 10–30 Gyr. With average cooling times exceeding the Hubble time, the gas in the CGM is not expected to cool in any significant quantity, ensuring that these galaxies remain quenched in the future. In this way, the AGN feedback not only shuts off star formation in the galaxy but also maintains the quenched state for extended times. Of course, if gas is funnelled to the galaxy in a different way, such as in a merger with a gas-rich companion or via smooth accretion of pristine or feedback gas, the galaxy may acquire more gas and star-formation may resume.
The kinetic mode feedback heats the CGM of the central galaxies, and, if the potential well of the halo is shallow enough, may actually evacuate gas from the inner CGM as well. This can be seen in Fig. 7e where the mean density of the CGM gas is colour-coded. The extremely low densities in the lower mass quenched galaxies, at masses of , show that the energy supplied by the AGN is enough to unbind the gas not only from the galaxy itself but to push out significant amounts of gas from the surrounding medium as well. This has also been seen in the EAGLE simulation (Davies et al., 2019b), even though the implementation of the BH feedback in the EAGLE model does not include a kinetic mode.
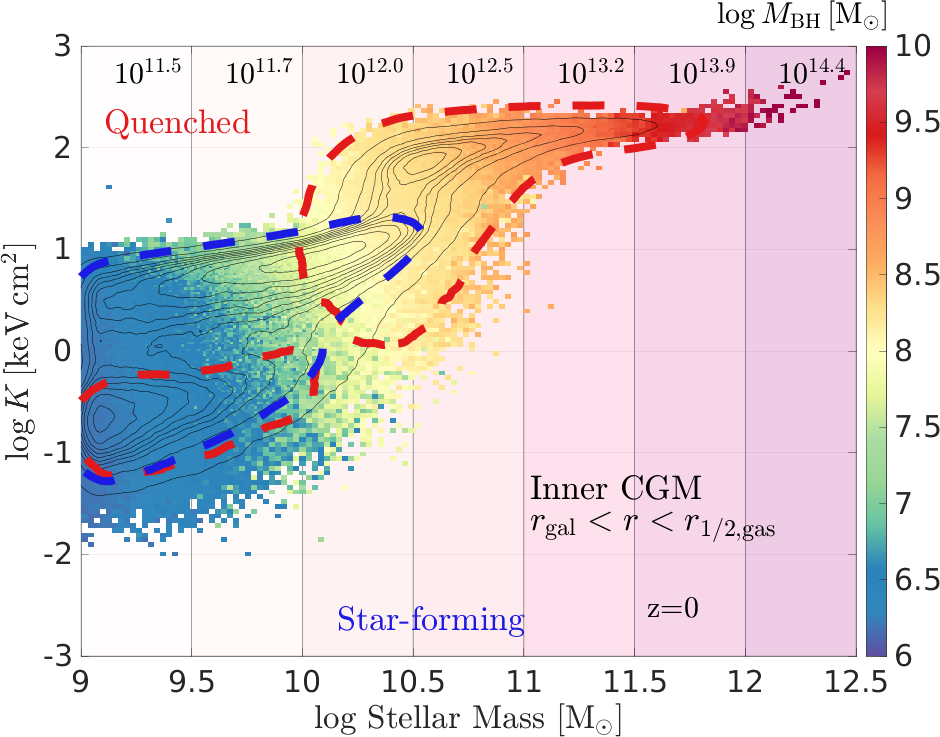
When examining the distribution of galaxies in the CGM entropy-stellar mass plane, as represented by the black contours of Figs. 7b and 8 for example, we find three distinct galaxy concentrations: a low entropy concentration at low stellar masses ( and ), an intermediate-entropy concentration at stellar masses of in the range and entropies of , and a high entropy concentration with masses of and entropies of . Both the low- and intermediate-entropy concentrations are comprised of star-forming galaxies, while the high-entropy concentration is composed of quenched galaxies.
The cooling time in the low entropy concentration is very short, of order , thus the galactic gas in these galaxies can be easily replenished by CGM gas cooling. For the intermediate mass concentration, comprised of galaxies of mass , the CGM cooling time is of order . The gas depletion timescale due to star-formation is also of order several Gyrs (Kong, 2004; Bigiel et al., 2008; Leroy et al., 2008; Pflamm-Altenburg & Kroupa, 2009; Bauermeister et al., 2013), thus these galaxies can remain star-forming since the gas cooling in the CGM can balance the gas depletion from star-formation. In the high-entropy concentration, above a stellar mass of the cooling time is , thus these galaxies are expected to remain quenched since they have been depleted of cold galactic gas which cannot be replenished on timescales shorter than that. The caveat to this statement is the induced cooling of the CGM by cold, high-metallicity gas ejected by SN winds from the galaxy itself (Marinacci et al., 2010; Fraternali et al., 2013; Armillotta et al., 2016), though this effect is more important in star-forming galaxies rather than in galaxies which have already been quenched.
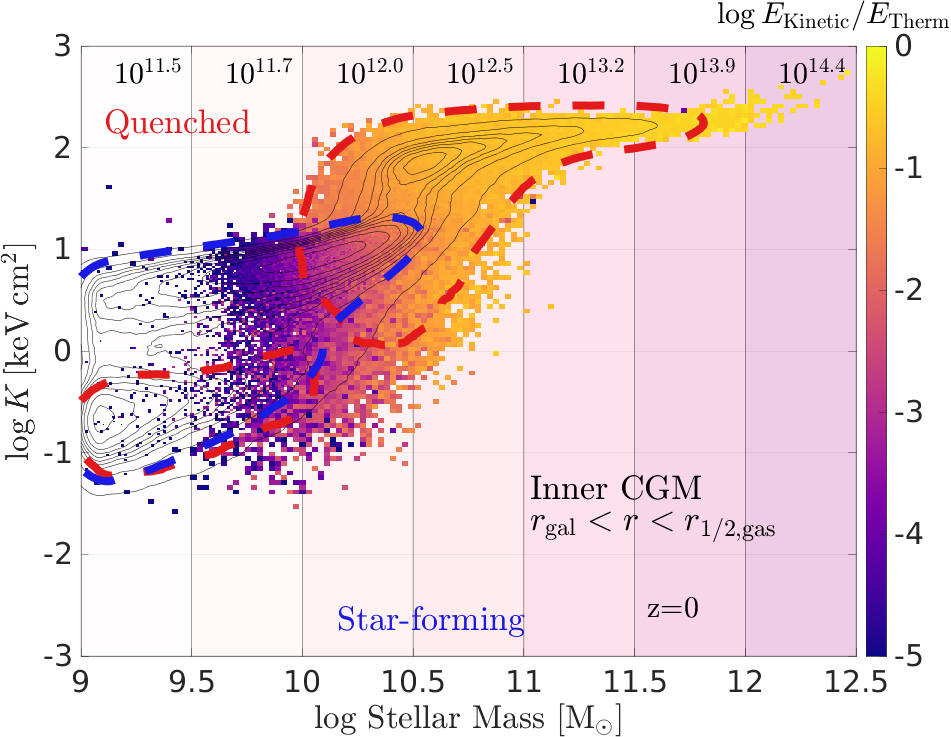
In Fig. 8 we can find clues as to what causes the groupings of galaxies in CGM entropies: the typical BH masses found in these galaxies (Fig. 8a) and more importantly, the amount of kinetic feedback released by the BH, or lack thereof (Fig. 8b). In the low-entropy concentration BH masses are small and there has been no kinetic mode feedback at all. Once the kinetic mode feedback starts to occur, even at very low levels (below the mass scale), the entropy of the inner CGM is seen to increase by two order of magnitudes, and the typical temperature rises to (Fig. 7b), though the gas density remains high (Fig. 7e). Once the BH mass scale is crossed and the kinetic feedback jumps to higher values, the entropy of the inner CGM grows even further, reaching values identical to those of haloes of masses 100 times larger. The temperature in the high entropy concentration is still in the vicinity of , but the mean density drops to very low values. Thus, small amounts of kinetic energy input heat the CGM gas, but only when the kinetic mode becomes the prevalent mode does the gas become diluted.
A question naturally arises – Why do we not see a similar distinction in entropy in the galactic gas of star-forming galaxies between those galaxies with no kinetic feedback at all and those with some kinetic feedback (e.g. Fig. 7g)? We think that once the kinetic feedback begins to be active, even with low levels of energy injection, some portion of the gas will be affected, and its entropy will increase. This gas would be hydrodynamically unstable and thus rise outwards to beyond our fiducial , thus becoming part of the CGM. The rest of the gas is unaffected and retains its low entropy and short cooling time.
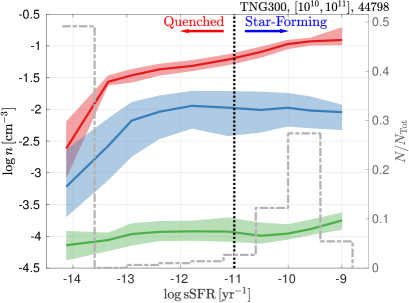
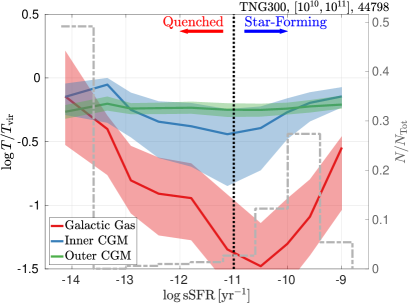
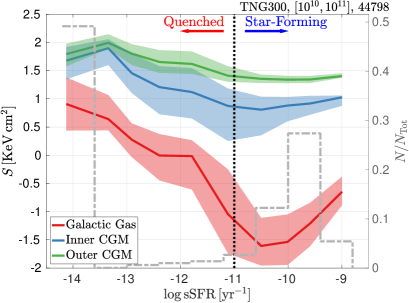
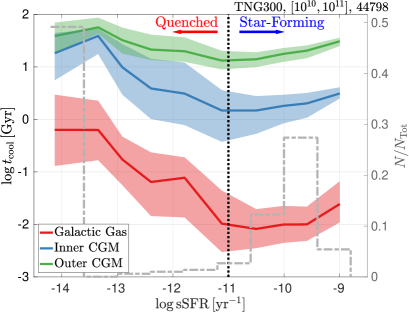
3.5 Thermodynamics of the CGM for star-forming vs. quiescent galaxies at the transitional mass scale
We explore what happens to the central galaxies as they transition from star-forming to quenched by examining the galaxies in the transitional mass range in the TNG300 simulation, where the kinetic mode becomes effective. In this mass range we find 44,798 galaxies with roughly equal numbers of star-forming and quenched galaxies. As shown in Fig. 6, the transition between star-forming and quenched in this mass range is tied to the onset of the kinetic mode feedback.
In Fig. 9 we bin these galaxies by their sSFR, and plot the thermodynamic conditions: density, temperature (normalised by ), entropy, and cooling time, within the 3 gas components: the galactic gas, inner CGM, and outer CGM (red, blue, and green curves, respectively). The values plotted are the median values over all galaxies in a given sSFR bin, with the shaded region showing the 25–75 percentile range. Also shown is a histogram of the number of galaxies within each bin.
As seen earlier, the transition from star-forming to quenched is marked by a rise in the temperature – the galactic gas is very cool in the star-forming galaxies, but in the quenched galaxies it is as hot as the inner and outer CGM with values of order . The inner and outer CGM temperatures remain fairly constant. In all three gas components we see a rise in entropy, with the most significant change in the galactic gas. The entropy change is very similar to the changes in cooling times, showing once again (see Fig. 7) that the entropy is a good indicator of the cooling time in the gas.
The cooling time in star-forming galaxies is quite short, of order , but rises to values of in the quenched population. The density of the gas also drops considerably, so while the cooling time is not very long, the small amount of gas that remains in these galaxies (see also Fig. 7d) is of very low density and is not likely to be a source of considerable star formation in the future.
This behaviour is mirrored in the inner CGM component – the average cooling time grows from several Gyrs in the star-forming galaxies to exceeding the Hubble time, and the density drops by more than an order of magnitude. In this way we see that the onset of the kinetic mode feedback greatly affects the inner CGM as well as the gas within the quenched galaxies and thus, left to itself, the CGM is not expected to be a substantial source for gas accretion.
The most star-forming galaxies in this mass range, with , actually show a rise in the normalised temperature and entropy of the galactic gas compared to the rest of the star-forming population (Figs. 9b and 9c). We speculate that this may be due to heating of the galactic gas by the action of SN feedback and/or the thermal mode of the AGN.
3.6 The multi-phase nature of the CGM and the role of AGN feedback
Up to this point we have treated the galactic gas and the CGM as monolithic components whose thermodynamic state is defined by single average values of density, entropy, temperature, and cooling time. In reality, observations show that the gas within galaxies and in the CGM is multi-phase in nature and comprised of regions which vary in density and temperature leading to greatly varying cooling times (Tumlinson et al., 2017, and references therein). This multi-phase nature of the CGM gas is realised also in the TNG simulations, as demonstrated to some extent already by Nelson et al. 2019b with the TNG50 run.
This can also be seen in the maps of Fig. 3 – the CGM of low-mass galaxies contain disc-like structures of low entropy (dense and cool) gas. Especially striking is the right-most galaxy in the first part of the figure, in which the inner CGM, found within the solid black circle, is comprised of a cold and dense disk (seen edge-on) with two lobes of hot outflows emanating from the galaxy at the centre.
In the higher mass galaxies, seen in the second part of the figure, we still find regions of varying entropy in the CGM, though they are not as structured as in the large gas discs seen in the low-mass examples. In the three most massive galaxies of Fig. 3 we also find satellite galaxies, best seen in the stellar mass map on the top row. These satellite galaxies can also be a source of lower entropy gas in the CGM – ‘Jellyfish’ galaxies which lose gas due ram-pressure as they travel through the CGM (Poggianti et al., 2017; Yun et al., 2019). The cold, low-entropy stripped gas joins the much hotter medium, and may even lead to cooling and entrainment of gas from the CGM (Marinacci et al., 2010; Gronke & Oh, 2018, 2020).
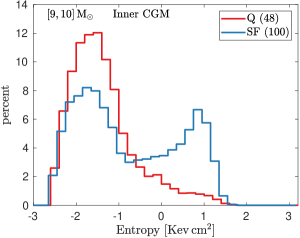
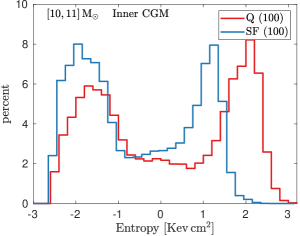
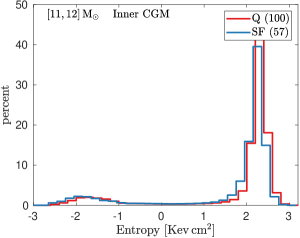
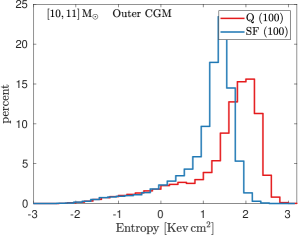
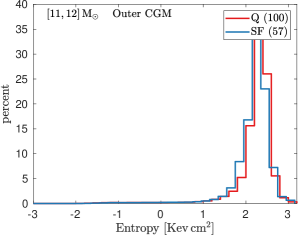
A quantitative characterization of the multi-phase nature of the CGM is shown in Fig. 10 where we separately stack histograms of the CGM entropy of star-forming and quenched galaxies selected from the TNG100 simulation, in three galaxy stellar mass ranges. In each mass range, , , and , we randomly select 100 galaxies from each group, star-forming or quenched. In the low (high) mass range we find less than 100 quenched (star-forming) galaxies, and in those cases collect all the available galaxies of that group. For each galaxy, a mass histogram of the CGM entropy is created, i.e. how much gas mass is found at a given entropy value, and these histograms are stacked together. As in the analysis presented thus far, here we include only central galaxies and we account only for the gas that is gravitationally bound to each central, i.e. excising the gas contribution from satellites. We choose to present here the results from the TNG100 galaxies since the higher resolution of the simulation better captures the multi-phase nature of the CGM, but repeating the analysis with the TNG300 sample gives very similar results.
In the inner CGM, shown on the top row of Fig. 10, the entropy distribution is bi-modal for (nearly) all galaxy types and mass ranges, indicating that the CGM contains both low and high entropy gas, although the amount of low-entropy gas in the high-mass regime is found to be very small. The high amount of low-entropy gas found in the quenched galaxies of the transitional mass range (top-middle panel) is especially striking: these are mass histograms and thus the top middle panel in Fig. 10 shows that there can be as much (in mass) low-entropy as high-entropy gas in the CGM of the depicted galaxies. Though the AGN feedback has already affected some of the CGM gas, (seen in shift of the high-entropy peak compared to that of the star-forming galaxies), there are still considerable amounts of low-entropy gas. This points to a localised effect of the AGN, as can be achieved with collimated outflows or bubbles (the mid-range galaxy images of Fig. 3 show this nicely). We note that a similar bi-modal distribution is found in the mass histograms of the temperature and density separately (not shown here), with the high-temperature/low-density peak of the quenched galaxy groups shifted to higher/lower values compared to the star-forming group.
The quenched galaxies at the low-mass end (red histograms in Fig. 10a) deviate from the general description proposed so far, as in fact they are almost completely lacking in high-entropy gas in their inner CGM. There are only 48 such objects in TNG100: they are the low-mass, low-entropy galaxies already seen in Fig. 5. We discuss this interesting group of galaxies in appendix B.
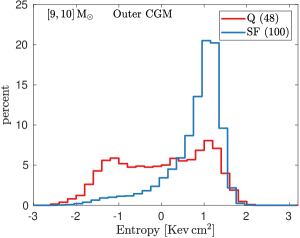
In the outer CGM the distribution of entropy is no longer bi-modal, with the single peak moving to higher values in higher mass ranges as expected. The exception to this statement is again the low-mass quenched population, which curiously seems to be characterised by a lower entropy distribution compared to the star-forming counterparts (see appendix B).
When stacking a large number of different distributions, a bi-modal distribution can occur naturally if all (or most) of the individual distributions are of a similar bi-modal shape. However, a similar distribution will be achieved if the sample contains only single-peak distributions, some with the peaks in the low entropy regime and some in the high entropy regime. We examined the individual distributions and found that for the inner CGM, in both groups and all mass ranges, most ( percent) of the individual galaxies exhibit distributions similar to the final stacking, that is, most of the individual galaxy distributions are also bi-modal. The rest of the distributions usually had a single peak, either in low entropy regime () or in the high-entropy regime (). In the star-forming groups, there were more low entropy single-peak distributions and the opposite was true for the quenched group: most single-peaked distributions were in the high-entropy regime.
In the transitional mass range, , while both groups show a similar bi-modal distribution of entropy in the inner CGM, the quenched group distribution is shifted to higher values, even for the low entropy peak, as a result of the energy injected by the kinetic mode feedback of the AGN (see also Fig. 9c). This is also the case for the outer CGM. In the high-mass end, both quenched and star-forming groups are practically identical, both in the inner and outer CGM. In these galaxies, the deep potential of the massive host halo is the dominant factor in setting the thermodynamic state of the gas.
4 Discussion and implications
From both the TNG simulations studied here, we can trace a relationship between the star-forming and thermodynamic states of the galaxy and its CGM with the stellar mass of the galaxy and its SMBH mass, which can be summarised as follows. In low-mass galaxies, , the (non-star-forming) gas in the galaxy is cold and dense with very low entropy values and short cooling times of order – within the main stellar body of galaxies. The BH masses are also low, around the initial seed mass of . In most of these galaxies, AGN feedback is limited to the high accretion mode alone (Figs. 6b and 8b). Under these conditions, the sSFR of these galaxies is high and they are typically found on the star-forming sequence. Star formation in these galaxies is expected to continue unabated due to the conditions in the gas immediately surrounding the galaxy, which we have dubbed the inner CGM. The cooling time in the inner CGM is of order ensuring that any gas used up through star formation will be replenished by gas cooling from the CGM. In these galaxies the BH masses remain low due to low accretion rates.
In more massive galaxies, , the BH mass is . At these BH masses the kinetic feedback is present and weak, but its effects can already be seen. Part of the galactic gas is affected by the AGN and thus has elevated entropy and is pushed out of the galaxies to become part of the CGM, however most of the galactic gas is unaffected and the galaxy remains star-forming. The entropy of the inner CGM is higher and thus the cooling time is . In these galaxies the cooling of the CGM can still balance gas depletion due to star formation since both have roughly the same timescales.
Once the BH mass crosses the transitional mass scale of , energy injected by the kinetic mode kinetic feedback becomes comparable () to that supplied by the thermal mode (and therefore of the total energy output), and as a result the galaxy entropy jumps by orders of magnitude, and the galaxy transitions from star-forming to quenched. Naturally, this transition will also manifest in observable properties of the galaxy such as colour (Nelson et al., 2018a).
Throughout this paper (and elsewhere) the transition in galaxy and CGM properties - e.g. sSFR, entropy, cooling time, halo gas content (Davies et al., 2019a; Terrazas et al., 2020), color (Nelson et al., 2018a), size (Genel et al., 2018), and others - is seen to occur at specific values of stellar or BH mass as a result of the way the AGN feedback is implemented in the TNG model. Whether or not such a sharp transition is supported by observations is still an open question, but we would suggest that entropy, due to its dramatic increase at the transition, constitutes a powerful diagnostic for future studies.
In galaxies close to the transition mass of the kinetic feedback overcomes the binding energy of the gas in the galaxy (Terrazas et al., 2020) and can deplete much of the galactic gas. In some cases, even the inner CGM becomes extremely dilute (Fig. 7e): the kinetic feedback in the TNG model is therefore ‘ejective’ and star-formation quenching is triggered, in effect, by gas removal from the star-forming regions.
However, the onset of kinetic mode feedback also leads to a change in the CGM of the galaxies: the CGM is hotter, more dilute and of higher entropy. Therefore, in a nutshell, the TNG AGN feedback ejects and heats up the gas within and around galaxies. The change in conditions may be observable, as the high-entropy CGM becomes a detectable X-ray source, albeit strongly susceptible to the underlying gas density (Truong et al., 2020; Oppenheimer et al., 2020).
The cooling time, both in the galactic gas as well as the CGM is now quite long, of order . These galaxies are quenched, and expected to remain so, since the cooling from the CGM, even when taking into account the multi-phase nature of the CGM, will not replenish the gas in the galaxy. Only if gas is accreted into the galaxy in a different way, by a merger for example, can star formation be ignited in the galaxy.
It is important to note that a similar physical occurrence is found in the EAGLE simulations (Davies et al., 2019a; Oppenheimer et al., 2019), a consensus which lends credibility to the outcome at the galaxy and CGM levels of from two very different galaxy formation models. In fact, in the details, this is achieved by a different implementation of BH feedback: the very effective kinetic mode in the TNG model operates at accretion rates well below the Eddington rate whereas in the EAGLE model, in which the AGN feedback efficiency is constant, the BH feedback is most effective at accretions rates close to the Eddington rate. This in turn highlights the challenges and uncertainties present in the modelling of this important process, as well as the need for detailed studies of the physical outcomes of its implementation.
In the inner CGM we found the imprints of the kinetic mode feedback at two mass scales – when the first event of kinetic feedback injection occurs (even when the galaxy is still star-forming), and when the kinetic to thermal energy ratio becomes roughly constant. In both, the typical entropy of the CGM increases noticeably. In the outer CGM we only see the imprint of the latter. This is probably due to two processes which work in tandem at this mass scale: only when the energy injected by the kinetic mode feedback is high enough can it influence the outer regions of the CGM. In addition, for galaxies at this mass scale the dark matter host halo becomes massive enough to sustain stable shocks emanating from its centre (Birnboim & Dekel, 2003; Dekel & Birnboim, 2006) allowing them to expand and encompass the entire host halo. It may be that the shocks being driven by the kinetic feedback in lower mass systems cannot expand far enough to affect the outer CGM.
As shown by Nelson et al. (2019b), the kinetic mode of AGN feedback can drive strong bi-polar outflows of gas, which emerge perpendicular to the galaxy disk (‘path of least resistance’). Examples of this can be seen in Fig. 3. In addition to gas removal from the galaxy itself, the high velocity gas in the outflow generates shocks as it encounters the ambient gas (see idealized tests in Weinberger et al., 2017). These shocks, in turn, convert the kinetic energy of the outflows into thermal energy and lead to the heating of the CGM gas and a subsequent rise in entropy and cooling times. Regions of high-entropy gas (‘bubbles’) embedded in lower entropy gas (see Fig. 3) which rise due to their buoyancy (Bower et al., 2017; Keller et al., 2020) can also transport energy from the central regions to the outer halo gas.
4.1 On the preventative nature of the TNG BH feedback
We have argued that in galaxies in which the kinetic mode feedback from the AGN is active, the thermodynamic conditions of the CGM (in an averaged sense), namely high entropy and long cooling times, will inhibit this gas from accreting and so prolong the quenched state of a galaxy. However, we have also demonstrated that the CGM is comprised of both low and high entropy components, which therefore have very different cooling timescales.
To assess whether the TNG black hole feedback model is indeed preventative, we calculate an estimate for the total mass of (inner and outer) CGM gas which may turn into stars in the near future for each galaxy, and try to determine whether the galaxy would be classified as quenched or not based on this value. To do so, we assume that a gas cell in the CGM can only be accreted onto the galaxy and form stars if it can cool in the time it would take it to reach the centre, namely that its cooling time (eq. 2.5.3), must be less than the free-fall time (eq. 12) at its position, .
This approach is inspired by the work of McCourt et al. (2012) who find that the condition for the development of thermal instabilities in the gas haloes surrounding galaxies, which allows gas to condense and cool from the medium (and potentially from stars) to be . Additional studies of the hot, dilute plasmas which populate the intra-cluster medium estimate the condition for condensation to be (Sharma et al., 2012; Voit et al., 2015; Voit & Donahue, 2015)
In Fig. 11 we show the same 8 galaxies presented earlier in Fig. 3, with the colour-maps showing the ratio of the cooling time to the free-fall time, . In regions where the cooling time is longer than the free-fall time (in red), the gas cannot cool quickly enough and therefore cannot contribute to star formation. We posit that only gas with (white to blue pixels) can potentially fuel star formation in the future. Low-mass galaxies contain large regions in which this ratio is below 1, whereas in the CGM of high-mass galaxies the ratio predominantly above 1 – note the logarithmic scale of the color bar. The regions in which outflows and hot and dilute ‘bubbles’ were formed (see panels in the middle row) are characterised by high values of the ratio.
In each galaxy in our sample, for a given timescale , we sum up the mass of all gas cells for which and to estimate how much gas is available to fuel star formation, by assuming that only gas cells which a) can reach the galaxy within the given timescale and b) can cool within that time can in turn form stars. Studies of star-forming gas clouds show that only a small fraction of the cloud mass actually forms stars, with star formation efficiencies of order percent per cloud free-fall time (see Krumholz et al., 2019, and references therein). We likewise assume that not all the available gas cooled from the CGM will form stars and assume a high fraction of percent, so as to obtain a high estimate of the total amount of gas which can be transformed into stars777When taking a value of per free-fall time convolved with the number of free-fall times found in the time span of for different parcels of gas we find that the integrated star-formation efficiency over all the gas is .. Thus the total amount by which the stellar mass can increase within a timescale of is
| (13) |
where we take .
This estimate takes into account the local thermodynamic conditions in the CGM and therefore reflects the star-forming potential of the multi-phase CGM surrounding each galaxy. An additional assumption we make in this estimate is that the actual process of forming stars from gas occurs on timescales much shorter than . Of course, in making this estimate of the stellar mass formed in the future, we are deliberately ignoring the effects of feedback, SN and AGN, that in practice would continue to act on galaxies. As such, this estimate reflects the conditions within the CGM and should not be considered as an attempt to predict the stellar mass in the future of a galaxy. Rather, these are very strong conditions to assess the ‘maintenance’ i.e. ‘preventative’ nature of the AGN feedback we are seeking to prove.
In Fig. 12 we show the projected (in time) stellar mass increase, normalised by the current stellar mass , for all the galaxies in our TNG300 sample. We separate the galaxy population based on their star-forming state at : star-forming galaxies in blue and quenched galaxies in red, and show the contours enclosing the 25,50,75 and 95 percentiles of the each population. The results shown assume a star formation efficiency of of , for a representative timescale of .
To asses whether the projected increase in stellar mass is typical of a star-forming or quenched galaxy, we calculate what would be the (normalised) increase in stellar mass, for a galaxy with exactly the threshold value of , within the timescale . This value is shown as the horizontal dashed line in Fig. 12. Thus, galaxies found above this line will have formed more stars than a galaxy which has been marginally quenched; i.e. just on the sSFR threshold, for the entire time .
The percentages shown on the top of each panel indicate the fraction of galaxies found above the dashed lines for the two populations; namely, the percentages give the fraction of galaxies that, selected to be e.g. quiescent at (red annotations), would become star-forming within the next . For the quenched population at (red annotations), we also show the percentage of galaxies with stellar mass above that are then found above the dashed line after the chosen time span (here ). For longer timescales (not shown here) the galaxy distribution in the figure remains unchanged – the radial extent corresponding to encompasses nearly all of the gravitationally bound gas in the CGM (see Section 2.5.4). With the high value of the star-formation efficiency of 5 percent (and no energy feedback of any kind), nearly half of quenched galaxies above (55 per cent), will still be considered quenched over the next , with the gas in the CGM in a thermodynamic state which is disadvantageous for future star formation. For values of the percentage of massive quenched galaxies found above the line exceeds 80 percent.
When taking the higher threshold of for the cooling condition to see how much star-forming gas will be available within , the above results do not change by much: the fraction of quenched and higher galaxies found above the SF-threshold line is now percent for and percent for .
The line of arguments provided above demonstrates that the BH feedback in the TNG model is not only ejective, but also preventative in the sense that it sets the conditions within the CGM to be non-conducive for fuelling future star formation. In fact, within the TNG implementation, both the quenching of star formation and the maintenance of a quenched state are accomplished by the same mode of BH feedback, namely the kinetic BH-driven winds at low-accretion rates.

4.2 On the state of the gas and star formation activity at earlier epochs
We also inspected the thermodynamic state of galaxy and halo gas at earlier epochs: by and large, most of the results of this study are already in place at ( ago), with long cooling times in all gaseous components, for example. As expected, the star-forming sequence is found at higher values of sSFR (Donnari et al., 2019), yet the shape of the distribution in the entropy-stellar mass plane is remarkably similar to that found at (Fig. 5), with the transitional stellar mass scale where the entropy increases and galaxies become predominately quenched located at the typical scale as for more recent epochs. The increase in entropy at the transitional mass scale is seen in the inner and outer CGM components as well, and the cooling times in the CGM of galaxies above the transitional mass scale is of order , showing that preventative aspect of AGN feedback is effective since this time to the present.
A complementary, in-depth study of the evolution over the history of individual galaxies may still be necessary for a complete understanding of the role the AGN plays in the evolution of the gas conditions in tandem with the star-forming state of the galaxy.
4.3 Addressing issues of resolution
The analysis presented above rests on the results of both the TNG300 simulation, with its extremely large sample of galaxies, as well as the higher-resolution TNG100 simulation. In this way we could better explore the distribution of galaxy properties over a large sample with TNG300 (especially in the high-mass end), as was done in Figs. 5, 6, 7, 8, 9 and 12, and also study important small-scale features which are better resolved in TNG100 (Figs. 3, 10 and 11).
To study the effects of the simulation resolution, we carried out our population analysis on the TNG100 simulation. We find that the salient features remain unchanged when examining the better-resolved population: the transitional stellar mass scale is identical and the typical average values of entropy, temperature, density, and cooling times shown in Fig. 7 are by and large unchanged as well. We show a few examples of these comparisons in appendix A and Figs. 13 and 14. The results presented in Section 4.1 and Fig. 12 also remain the same when conducted on TNG100 galaxies (see Fig. 15). In examining the multi-phase aspect of the CGM, Section 3.6 and Fig. 10, we repeated our analysis with the TNG300 galaxies and found similar trends in the properties of the CGM.
Thus, our conclusions do not depend on the resolution of our simulations, though we stress that this is also due to our studying averaged values both within the galaxies and over the galaxy populations. Simulations with increased resolution would undoubtedly reveal features and properties of the CGM, particularly pertaining to regions of low entropy, which the simulations studied here cannot capture (e.g. van de Voort et al., 2019; Suresh et al., 2019). To gain insight as to how these small-scale differences may alter the way BH feedback affects the CGM, it would be interesting to carry out a detailed comparison between individual, similar-mass galactic systems in the TNG300, TNG100, as well as the higher resolution TNG50 simulation (Pillepich et al., 2019; Nelson et al., 2019b), an endeavour we defer to a later date.
5 Summary
In this paper we have quantified the effects of AGN feedback, as realised in the TNG model, on the evolution of galaxies by specifically focusing on the physical conditions of the non-star-forming gas within the galaxy and beyond, i.e. in the surrounding circumgalactic medium. To that end, we have examined the population of central galaxies in the stellar mass range from the TNG100 and TNG300 simulations at . We have drawn our conclusions from global properties of the entire population under the assumption that the galaxy histories are imprinted on their present day properties – an assumption which may not hold in all cases. We have relied on a numerical framework whereby the feedback from SMBHs is implemented as thermal energy injection at high BH accretion rates and kinetic BH-driven winds at low accretion rates capable of driving large-scale outflows.
In particular, we have quantified the temperature, density, entropy, and cooling times of the non-star-forming, gravitationally-bound gas of tens of thousands of galaxies, by broadly distinguishing among galactic gas (within twice the stellar half-mass radius), the inner CGM (between the latter and the gas half-mass radius), and the outer CGM (beyond the gas half-mass radius). We have connected the gas thermodynamics to the star-forming state of the galaxies (e.g. star-forming vs. quiescent) and hence to the current and time-integrated properties and activity of their central SMBHs.
Our key conclusions are the following:
-
*
Gas entropy is a sensitive diagnostic of the effects of feedback energy injection and is a strong indicator of the cooling time in the gas and, by extension, of the quenched vs. non-quenched state of galaxies;
-
*
The same AGN feedback channel can simultaneously function as ‘ejective’ and ‘preventative’.
More specifically, our findings can be summarised as follows:
-
•
The population of central galaxies in the TNG simulations (TNG100 and TNG300) transitions between a largely star-forming population at low masses, which forms a tight ‘star-forming sequence’ in the sSFR-stellar mass plane, to a mostly quiescent population at higher masses (Fig. 5a). The transition between the two populations comes about when the kinetic mode feedback of the AGN model (BH-driven winds) accounts for roughly 1/4 of the total energy output over the lifetime of the BH (Figs. 1 and 6). This occurs at a BH mass scale of , which corresponds to a stellar mass scale of .
-
•
The transition between star-forming and quiescent galaxies manifests itself in the gas properties of the galaxy in the form of a rapid increase in the average entropy of the galactic gas (Fig. 5b, excluding star-forming gas) which corresponds to a jump in the typical gas cooling times from to (Fig. 7g).
-
•
The changes in galactic gas properties are mirrored in the CGM, showing that the kinetic mode feedback also affects the gas beyond the galaxy. Even very small amounts of energy injected via the kinetic mode feedback result in a noticeable jump in the CGM average entropy. In other words, in quenching galaxies, the effects of the kinetic mode AGN Feedback leave an imprint also on the outer reaches of the gas halo, up to distances of several hundreds of kiloparsecs (Fig. 7). This separation in the typical thermodynamic properties of the gas within and around star-forming vs. quiescent galaxies can be tested with X-ray observations (see Truong et al., 2020; Oppenheimer et al., 2020).
-
•
Within the framework of the TNG model, AGN feedback, and particularly the kinetic mode feedback at low BH accretion rates, ejects and heats up the gas within and around galaxies (Fig. 9). Namely, it acts as both an ‘ejective’ feedback – by expelling star-forming gas from the galaxy and triggering quenching – as well as a ‘preventative’ feedback – by increasing the average CGM entropy and cooling time and making them non-conducive for fueling future star formation (Figs. 11 and 12). This remains true even though the CGM itself is multi-phase, with both high and low entropy (diffuse and dense) components (Fig. 10). While for some systems the ’ejective’ part of the feedback is enough to ensure long-term quiescence, a significant sub-population would start to form stars again unless preventative AGN feedback is operating.
In conclusion, with this work we have examined how the three components – the SMBH, the galaxy, and the CGM – are all interconnected in their evolution within the context of a numerical model for galaxy formation that yields galaxy populations in reasonable agreement with observations. While the latter may not be fully realistic in detail owing to limited resolution (see e.g. van de Voort et al., 2019; Suresh et al., 2019), it still provides us with a rich and plausible laboratory to get insights and inspirations for what may happen in the real Universe.
Importantly, global evolutionary properties, such as a long-lasting quenched state, can be accompanied by a diversity of halo gas states, spanning orders of magnitude in entropy values within the same galaxy or gaseous halo. Finally and more generally, we hope we have inspired future studies of the formation and evolution of galaxies to treat the entire galactic ecosystem – from the small scales of the central BH, to the outer reaches of the CGM – as a complex, inter-dependent structure, with each component having its own part to play in determining the future of the system.
Data Availability
-
•
The simulation data used for this analysis is publicly available through the Illustris TNG project website (see Nelson et al., 2019a, for details): http://www.tng-project.org/data .
-
•
The scripts used to analyse the data and generate the figures can be found here: https://github.com/eladzing/matlab_scripts.git. Please contact the corresponding author for assistance at elad.zinger@mail.huji.ac.il.
Acknowledgements
The authors thank the anonymous referee for their time and effort in providing constructive comments and suggestions which improved the paper. The authors would like to thank Martina Donnari for input on the star formation rates of TNG galaxies and for many fruitful discussions. FM acknowledges support through the Program “Rita Levi Montalcini” of the Italian MIUR. MV acknowledges support through an MIT RSC award, a Kavli Research Investment Fund, NASA ATP grant NNX17AG29G, and NSF grants AST-1814053, AST-1814259 and AST-1909831. The flagship simulations of the IllustrisTNG project used in this work (TNG100 and TNG300) have been run on the HazelHen Cray XC40-system at the High Performance Computing Center Stuttgart as part of project GCS-ILLU of the Gauss centres for Supercomputing (GCS, PI: Springel).
References
- Anglés-Alcázar et al. (2017) Anglés-Alcázar D., Faucher-Giguère C.-A., Quataert E., Hopkins P. F., Feldmann R., Torrey P., Wetzel A., Kereš D., 2017, MNRAS, 472, L109
- Armillotta et al. (2016) Armillotta L., Fraternali F., Marinacci F., 2016, MNRAS, 462, 4157
- Baldry et al. (2004) Baldry I. K., Glazebrook K., Brinkmann J., Ivezić Ž., Lupton R. H., Nichol R. C., Szalay A. S., 2004, ApJ, 600, 681
- Balogh et al. (2004) Balogh M. L., Baldry I. K., Nichol R., Miller C., Bower R., Glazebrook K., 2004, ApJ, 615, L101
- Bañados et al. (2018) Bañados E., et al., 2018, Nature, 553, 473
- Bauermeister et al. (2013) Bauermeister A., et al., 2013, ApJ, 768, 132
- Begelman (2014) Begelman M. C., 2014, arXiv e-prints, p. arXiv:1410.8132
- Bell et al. (2004) Bell E. F., et al., 2004, ApJ, 608, 752
- Best et al. (2005) Best P. N., Kauffmann G., Heckman T. M., Brinchmann J., Charlot S., Ivezić Ž., White S. D. M., 2005, MNRAS, 362, 25
- Bigiel et al. (2008) Bigiel F., Leroy A., Walter F., Brinks E., de Blok W. J. G., Madore B., Thornley M. D., 2008, AJ, 136, 2846
- Birnboim & Dekel (2003) Birnboim Y., Dekel A., 2003, MNRAS, 345, 349
- Bîrzan et al. (2004) Bîrzan L., Rafferty D. A., McNamara B. R., Wise M. W., Nulsen P. E. J., 2004, ApJ, 607, 800
- Blandford & Begelman (1999) Blandford R. D., Begelman M. C., 1999, MNRAS, 303, L1
- Böhringer & Werner (2010) Böhringer H., Werner N., 2010, A&ARv, 18, 127
- Bower et al. (2006) Bower R. G., Benson A. J., Malbon R., Helly J. C., Frenk C. S., Baugh C. M., Cole S., Lacey C. G., 2006, MNRAS, 370, 645
- Bower et al. (2017) Bower R. G., Schaye J., Frenk C. S., Theuns T., Schaller M., Crain R. A., McAlpine S., 2017, MNRAS, 465, 32
- Brinchmann et al. (2004) Brinchmann J., Charlot S., White S. D. M., Tremonti C., Kauffmann G., Heckman T., Brinkmann J., 2004, MNRAS, 351, 1151
- Chabrier (2003) Chabrier G., 2003, PASP, 115, 763
- Cheung et al. (2016) Cheung E., et al., 2016, Nature, 533, 504
- Choi et al. (2018) Choi E., Somerville R. S., Ostriker J. P., Naab T., Hirschmann M., 2018, ApJ, 866, 91
- Cooper et al. (2007) Cooper M. C., et al., 2007, MNRAS, 376, 1445
- Coziol et al. (2017) Coziol R., Andernach H., Torres-Papaqui J. P., Ortega-Minakata R. A., Moreno del Rio F., 2017, MNRAS, 466, 921
- Crenshaw et al. (2010) Crenshaw D. M., Schmitt H. R., Kraemer S. B., Mushotzky R. F., Dunn J. P., 2010, ApJ, 708, 419
- Davies et al. (2019a) Davies J. J., Crain R. A., Oppenheimer B. D., Schaye J., 2019a, MNRAS, p. 2797
- Davies et al. (2019b) Davies J. J., Crain R. A., McCarthy I. G., Oppenheimer B. D., Schaye J., Schaller M., McAlpine S., 2019b, MNRAS, 485, 3783
- Dekel & Birnboim (2006) Dekel A., Birnboim Y., 2006, MNRAS, 368, 2
- Dekel & Silk (1986) Dekel A., Silk J., 1986, ApJ, 303, 39
- Di Matteo et al. (2005) Di Matteo T., Springel V., Hernquist L., 2005, Nature, 433, 604
- Di Matteo et al. (2008) Di Matteo T., Colberg J., Springel V., Hernquist L., Sijacki D., 2008, ApJ, 676, 33
- Dolag et al. (2009) Dolag K., Borgani S., Murante G., Springel V., 2009, MNRAS, 399, 497
- Donnari et al. (2019) Donnari M., et al., 2019, MNRAS, 485, 4817
- Dubois et al. (2015) Dubois Y., Volonteri M., Silk J., Devriendt J., Slyz A., Teyssier R., 2015, MNRAS, 452, 1502
- Dubois et al. (2016) Dubois Y., Peirani S., Pichon C., Devriendt J., Gavazzi R., Welker C., Volonteri M., 2016, MNRAS, 463, 3948
- Fabian (2012) Fabian A. C., 2012, ARA&A, 50, 455
- Förster Schreiber et al. (2014) Förster Schreiber N. M., et al., 2014, ApJ, 787, 38
- Fraternali et al. (2013) Fraternali F., Marasco A., Marinacci F., Binney J., 2013, ApJ, 764, L21
- Geha et al. (2012) Geha M., Blanton M. R., Yan R., Tinker J. L., 2012, ApJ, 757, 85
- Genel et al. (2014) Genel S., et al., 2014, MNRAS, 445, 175
- Genel et al. (2018) Genel S., et al., 2018, MNRAS, 474, 3976
- Genzel et al. (2014) Genzel R., et al., 2014, ApJ, 796, 7
- Gill et al. (2005) Gill S. P. D., Knebe A., Gibson B. K., 2005, MNRAS, 356, 1327
- Gnedin (2003) Gnedin O. Y., 2003, ApJ, 589, 752
- Gronke & Oh (2018) Gronke M., Oh S. P., 2018, MNRAS, 480, L111
- Gronke & Oh (2020) Gronke M., Oh S. P., 2020, MNRAS, 492, 1970
- Gunn & Gott (1972) Gunn J. E., Gott III J. R., 1972, ApJ, 176, 1
- Habouzit et al. (2017) Habouzit M., Volonteri M., Dubois Y., 2017, MNRAS, 468, 3935
- Habouzit et al. (2019) Habouzit M., et al., 2019, MNRAS, 484, 4413
- Heckman & Best (2014) Heckman T. M., Best P. N., 2014, ARA&A, 52, 589
- Henden et al. (2018) Henden N. A., Puchwein E., Shen S., Sijacki D., 2018, MNRAS, 479, 5385
- Hickox et al. (2009) Hickox R. C., et al., 2009, ApJ, 696, 891
- Hogg et al. (2004) Hogg D. W., et al., 2004, ApJ, 601, L29
- Hopkins et al. (2011) Hopkins P. F., Quataert E., Murray N., 2011, MNRAS, 417, 950
- Kauffmann et al. (2003) Kauffmann G., et al., 2003, MNRAS, 341, 54
- Kauffmann et al. (2004) Kauffmann G., White S. D. M., Heckman T. M., Ménard B., Brinchmann J., Charlot S., Tremonti C., Brinkmann J., 2004, MNRAS, 353, 713
- Kaviraj et al. (2017) Kaviraj S., et al., 2017, MNRAS, 467, 4739
- Keller et al. (2020) Keller B. W., Kruijssen J. M. D., Wadsley J. W., 2020, MNRAS, 493, 2149
- King & Nixon (2015) King A., Nixon C., 2015, MNRAS, 453, L46
- Kong (2004) Kong X., 2004, A&A, 425, 417
- Kormendy & Ho (2013) Kormendy J., Ho L. C., 2013, ARA&A, 51, 511
- Krumholz et al. (2019) Krumholz M. R., McKee C. F., Bland Hawthorn J., 2019, ARA&A, 57, 227
- Leroy et al. (2008) Leroy A. K., Walter F., Brinks E., Bigiel F., de Blok W. J. G., Madore B., Thornley M. D., 2008, AJ, 136, 2782
- Liu et al. (2019) Liu C., Hao L., Wang H., Yang X., 2019, ApJ, 878, 69
- Marinacci et al. (2010) Marinacci F., Binney J., Fraternali F., Nipoti C., Ciotti L., Londrillo P., 2010, MNRAS, 404, 1464
- Marinacci et al. (2018) Marinacci F., et al., 2018, MNRAS, 480, 5113
- Mathews & Brighenti (2003) Mathews W. G., Brighenti F., 2003, ARA&A, 41, 191
- McAlpine et al. (2018) McAlpine S., Bower R. G., Rosario D. J., Crain R. A., Schaye J., Theuns T., 2018, MNRAS, 481, 3118
- McCarthy et al. (2008) McCarthy I. G., Babul A., Bower R. G., Balogh M. L., 2008, MNRAS, 386, 1309
- McCarthy et al. (2011) McCarthy I. G., Schaye J., Bower R. G., Ponman T. J., Booth C. M., Dalla Vecchia C., Springel V., 2011, MNRAS, 412, 1965
- McCarthy et al. (2017) McCarthy I. G., Schaye J., Bird S., Le Brun A. M. C., 2017, MNRAS, 465, 2936
- McCourt et al. (2012) McCourt M., Sharma P., Quataert E., Parrish I. J., 2012, MNRAS, 419, 3319
- McNamara & Nulsen (2007) McNamara B. R., Nulsen P. E. J., 2007, ARA&A, 45, 117
- Naiman et al. (2018) Naiman J. P., et al., 2018, MNRAS, 477, 1206
- Nelson et al. (2018a) Nelson D., et al., 2018a, MNRAS, 475, 624
- Nelson et al. (2018b) Nelson D., et al., 2018b, MNRAS, 477, 450
- Nelson et al. (2019a) Nelson D., et al., 2019a, Computational Astrophysics and Cosmology, 6, 2
- Nelson et al. (2019b) Nelson D., et al., 2019b, MNRAS, 490, 3234
- Nulsen et al. (2009) Nulsen P., Jones C., Forman W., Churazov E., McNamara B., David L., Murray S., 2009, in Heinz S., Wilcots E., eds, American Institute of Physics Conference Series Vol. 1201, American Institute of Physics Conference Series. pp 198–201, doi:10.1063/1.3293033, https://ui.adsabs.harvard.edu/abs/2009AIPC.1201..198N
- Oppenheimer et al. (2019) Oppenheimer B. D., et al., 2019, MNRAS, p. 2733
- Oppenheimer et al. (2020) Oppenheimer B. D., et al., 2020, ApJ, 893, L24
- Pakmor & Springel (2013) Pakmor R., Springel V., 2013, MNRAS, 432, 176
- Peng et al. (2010) Peng Y.-j., et al., 2010, ApJ, 721, 193
- Penny et al. (2018) Penny S. J., et al., 2018, MNRAS, 476, 979
- Pflamm-Altenburg & Kroupa (2009) Pflamm-Altenburg J., Kroupa P., 2009, ApJ, 706, 516
- Pillepich et al. (2018a) Pillepich A., et al., 2018a, MNRAS, 473, 4077
- Pillepich et al. (2018b) Pillepich A., et al., 2018b, MNRAS, 475, 648
- Pillepich et al. (2019) Pillepich A., et al., 2019, MNRAS, 490, 3196
- Planck Collaboration et al. (2016) Planck Collaboration et al., 2016, A&A, 594, A13
- Poggianti et al. (2017) Poggianti B. M., et al., 2017, ApJ, 844, 48
- Prasad et al. (2015) Prasad D., Sharma P., Babul A., 2015, ApJ, 811, 108
- Rangel et al. (2014) Rangel C., et al., 2014, MNRAS, 440, 3630
- Reines & Volonteri (2015) Reines A. E., Volonteri M., 2015, ApJ, 813, 82
- Rodriguez-Gomez et al. (2015) Rodriguez-Gomez V., et al., 2015, MNRAS, 449, 49
- Rupke et al. (2017) Rupke D. S. N., Gültekin K., Veilleux S., 2017, ApJ, 850, 40
- Schaye et al. (2015) Schaye J., et al., 2015, MNRAS, 446, 521
- Sharma et al. (2012) Sharma P., McCourt M., Quataert E., Parrish I. J., 2012, MNRAS, 420, 3174
- Shin et al. (2016) Shin J., Woo J.-H., Mulchaey J. S., 2016, ApJS, 227, 31
- Sijacki et al. (2007) Sijacki D., Springel V., Di Matteo T., Hernquist L., 2007, MNRAS, 380, 877
- Sijacki et al. (2009) Sijacki D., Springel V., Haehnelt M. G., 2009, MNRAS, 400, 100
- Silk (2013) Silk J., 2013, ApJ, 772, 112
- Smethurst et al. (2016) Smethurst R. J., et al., 2016, MNRAS, 463, 2986
- Somerville & Davé (2015) Somerville R. S., Davé R., 2015, ARA&A, 53, 51
- Springel (2010) Springel V., 2010, MNRAS, 401, 791
- Springel & Hernquist (2003) Springel V., Hernquist L., 2003, MNRAS, 339, 289
- Springel et al. (2001) Springel V., White S. D. M., Tormen G., Kauffmann G., 2001, MNRAS, 328, 726
- Springel et al. (2018) Springel V., et al., 2018, MNRAS, 475, 676
- Suresh et al. (2019) Suresh J., Nelson D., Genel S., Rubin K. H. R., Hernquist L., 2019, MNRAS, 483, 4040
- Terrazas et al. (2020) Terrazas B. A., et al., 2020, MNRAS, 493, 1888
- Torrey et al. (2014) Torrey P., Vogelsberger M., Genel S., Sijacki D., Springel V., Hernquist L., 2014, MNRAS, 438, 1985
- Truong et al. (2020) Truong N., et al., 2020, MNRAS
- Tumlinson et al. (2017) Tumlinson J., Peeples M. S., Werk J. K., 2017, ARA&A, 55, 389
- Villalobos et al. (2014) Villalobos Á., De Lucia G., Murante G., 2014, MNRAS, 444, 313
- Villar-Martín et al. (2011) Villar-Martín M., Humphrey A., Delgado R. G., Colina L., Arribas S., 2011, MNRAS, 418, 2032
- Vogelsberger et al. (2013) Vogelsberger M., Genel S., Sijacki D., Torrey P., Springel V., Hernquist L., 2013, MNRAS, 436, 3031
- Vogelsberger et al. (2014a) Vogelsberger M., et al., 2014a, MNRAS, 444, 1518
- Vogelsberger et al. (2014b) Vogelsberger M., et al., 2014b, Nature, 509, 177
- Voit & Donahue (2015) Voit G. M., Donahue M., 2015, ApJ, 799, L1
- Voit et al. (2015) Voit G. M., Donahue M., Bryan G. L., McDonald M., 2015, Nature, 519, 203
- Wang et al. (2009) Wang Y., Yang X., Mo H. J., van den Bosch F. C., Katz N., Pasquali A., McIntosh D. H., Weinmann S. M., 2009, ApJ, 697, 247
- Weinberger et al. (2017) Weinberger R., et al., 2017, MNRAS, 465, 3291
- Weinberger et al. (2018) Weinberger R., et al., 2018, MNRAS, 479, 4056
- Werner et al. (2019) Werner N., McNamara B. R., Churazov E., Scannapieco E., 2019, Space Sci. Rev., 215, 5
- Wetzel et al. (2012) Wetzel A. R., Tinker J. L., Conroy C., 2012, MNRAS, 424, 232
- Wetzel et al. (2013) Wetzel A. R., Tinker J. L., Conroy C., van den Bosch F. C., 2013, MNRAS, 432, 336
- Woo et al. (2013) Woo J., et al., 2013, MNRAS, 428, 3306
- Woo et al. (2016) Woo J.-H., Bae H.-J., Son D., Karouzos M., 2016, ApJ, 817, 108
- Yuan & Narayan (2014) Yuan F., Narayan R., 2014, ARA&A, 52, 529
- Yuan et al. (2008) Yuan W., Zhou H. Y., Komossa S., Dong X. B., Wang T. G., Lu H. L., Bai J. M., 2008, ApJ, 685, 801
- Yun et al. (2019) Yun K., et al., 2019, MNRAS, 483, 1042
- Zinger et al. (2018) Zinger E., Dekel A., Kravtsov A. V., Nagai D., 2018, MNRAS, 475, 3654
- van de Voort et al. (2019) van de Voort F., Springel V., Mandelker N., van den Bosch F. C., Pakmor R., 2019, MNRAS, 482, L85
- van den Bosch et al. (2008) van den Bosch F. C., Aquino D., Yang X., Mo H. J., Pasquali A., McIntosh D. H., Weinmann S. M., Kang X., 2008, MNRAS, 387, 79
Appendix A Comparison between the TNG100 and TNG300 galaxy samples - resolution effects
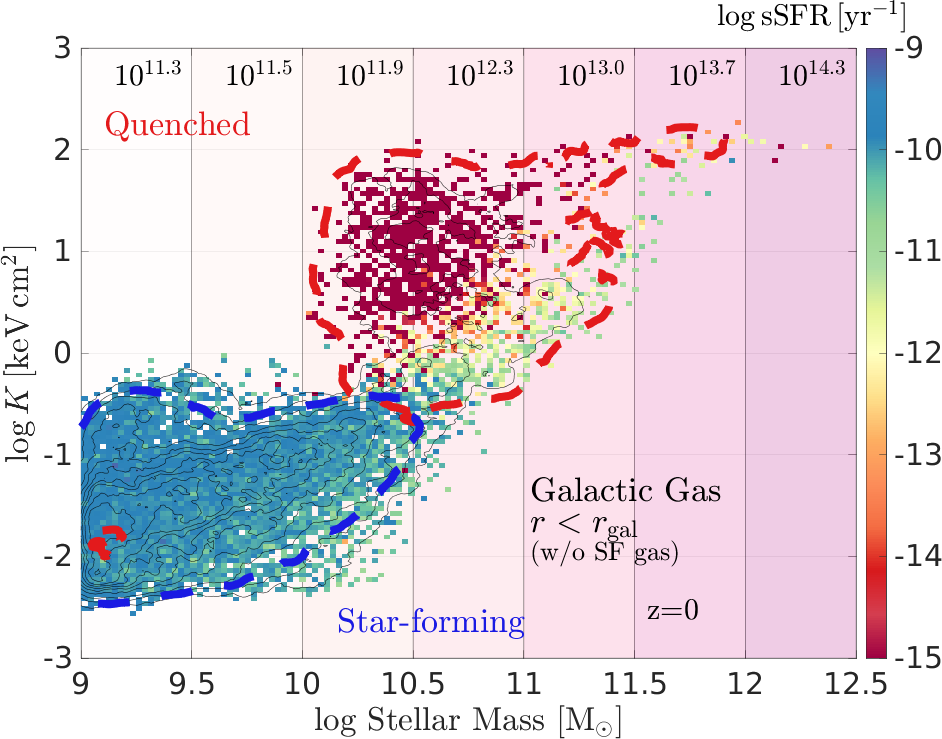
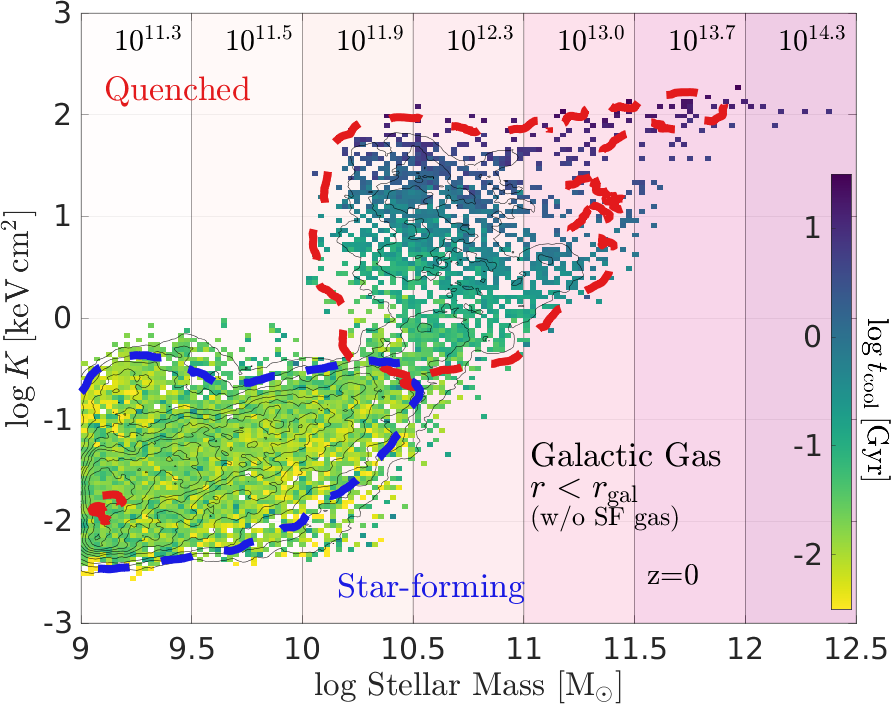
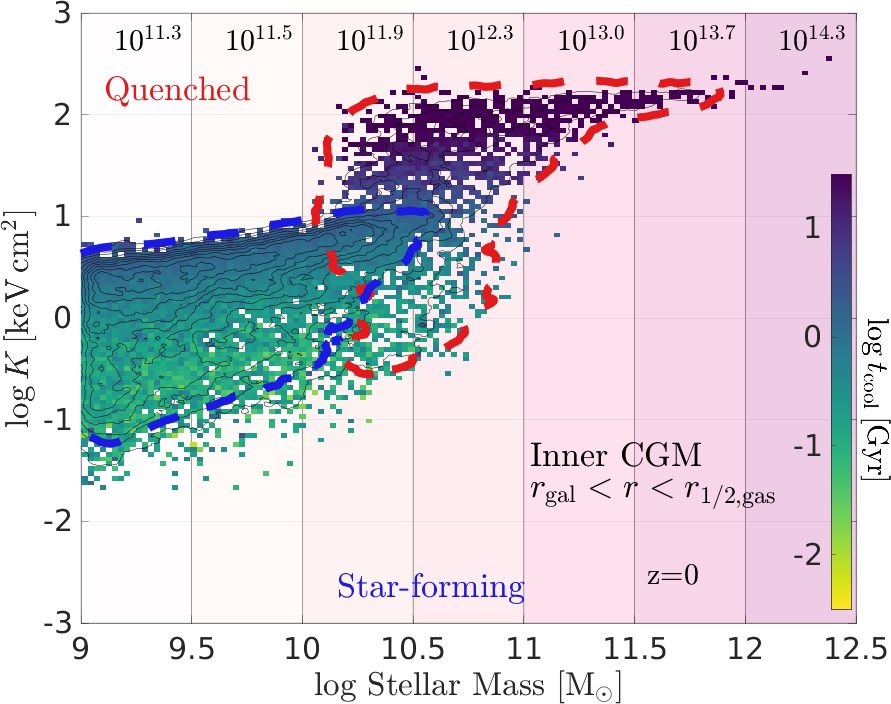
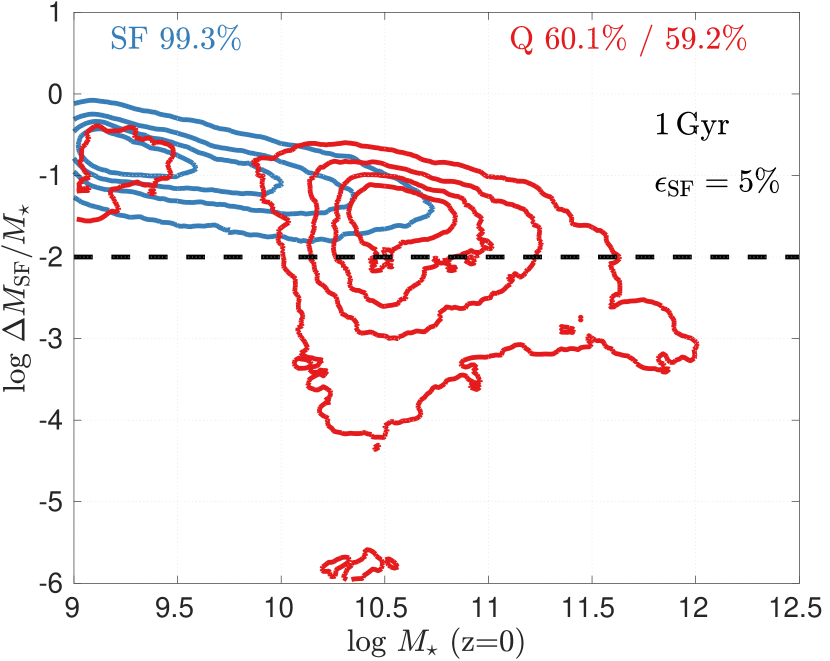
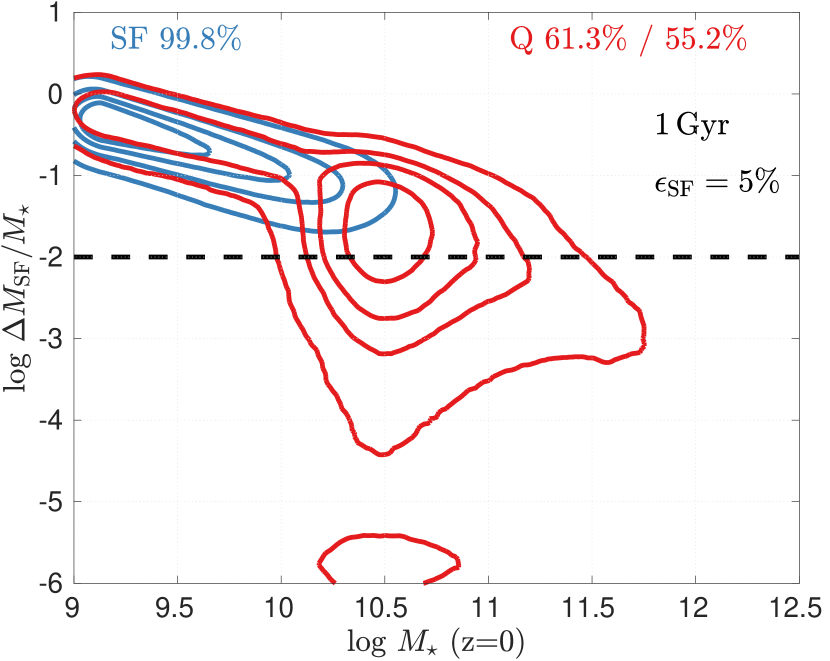
In this section we present several comparisons of our results carried out between the galaxy populations of TNG100 and TNG300 simulations, in an effort to probe the effects of resultion on our findings. The TNG100 and TNG300 galaxy samples number and respectively (see Section 2.4).
In Fig. 13 we show the distribution of the galactic gas of central galaxies at for the two simulation boxes on the entropy-stellar mass plane, with the colors corresponding to the sSFR of the galaxies (shown earlier in Fig. 5b. The advantages of using the much larger TNG300 sample are clear as the distribution is much more ‘fleshed-out’ with this sample, especially at the high-mass end.
The transition between star-forming and quenched occurs at the same mass scale, as expected, since this threshold is set by the physical model and the transition between the thermal and kinetic mode (Section 2.2). In addition, the entropy values for the star-forming and quenched population are by and large identical, with the same entropy ‘floor’ (as set by the physical model) and ‘ceiling’, and the same typical values for the peak of the distribution.
In Fig. 14 we show the distribution for the galactic gas and inner CGM, top and bottom row, respectively, with the colors showing the cooling time in the gas, for the TNG100 sample on the left and TNG300 sample on the right (Figs. 14b and 14d are identical to Figs. 7g and 7h, respectively). The distribution of galaxies for inner CGM entropy values is also similar in both samples. Even though the gas is better resolved in the TNG100 sample, the average values of the cooling time in both the galactic and CGM gas is also practically identical between the two simulations. Higher resolution usually entails a more multi-phase medium, but it appears that this has little effect when considering median value of the (mass-weighted average) cooling time for the galaxies in a given region of the plane.
In Fig. 15 we repeat the analysis of Section 4.1 for estimating the potential increase in stellar mass due to accretion from the CGM. In Fig. 15a we show the results for the TNG100 sample, with the TNG300 sample results shown for comparison in Fig. 15b (previously shown in Fig. 12). Here too we see that despite the difference in resolution, the quenched and star-forming populations inhabit similar regions in the plot, and the estimated fractional increase in stellar mass is by and large the same.
Appendix B Low-mass/low-entropy quenched population
In Fig. 5b we encountered a population of low-mass, low-entropy galaxies, marked in the figure by the red contour found in the lower-left corner. These galaxies comprise roughly 3.5 percent of the TNG300 galaxies in our sample (with stellar mass above ), and about 15 percent of the quenched galaxy population. It should be noted that we find these galaxies after removing ‘back-splash’ galaxies as described in Section 2.4.
In TNG100, a similar population is found (see Fig. 13a), but of much lower relative numbers: only 0.5 percent of the total population and only 3.4 percent of the quenched population. The fact that the relative size of this population is different between TNG100 and TNG300 points to either a resolution or volume dependent effect. We note that when lowering the sSFR threshold for what should be considered a quenched galaxy by a factor of two, this galaxy population shrinks by roughly 25 percent, but still comprises 11 percent of the quenched galaxy population.
In Fig. 6a we learn that the BHs in all these galaxies have low mass, and all have not yet experienced a single kinetic mode injection event, as can be seen in Fig. 6b. As such, the inner CGM of these galaxies is characterised by relatively low entropies (Fig. 7b). The outer CGM of these galaxies is no different overall from most other star-forming galaxies of similar masses (Figs. 7c, 7f and 7i). We cannot rely on Fig. 7 to learn about the temperatures, densities, and cooling times of these galaxies directly since the values of these quantities are averaged over all galaxies within a pixel, most of which are likely star-forming. However, based on the entropy values for these galaxies one can confidently surmise that their cooling times are most likely similar to those of the star-forming population of order in the galactic gas and in the inner CGM.
When examining the conditions in the CGM of similar galaxies in the TNG100 simulation, by studying the red histogram of Figs. 10a and 10d, we see that these galaxies have entropy distributions which are skewed to lower values in the inner CGM and possess a more massive low-entropy component than their star-forming counterparts.
All this points to the fact that whatever process is quenching these galaxies, it is most likely not energy injected by either SN or AGN kinetic feedback – the conditions within the gas of these galaxies is conducive to star formation at a rate similar to that of galaxies on the star-forming sequence. Indeed, when examining the future star-forming potential of these galaxies, as was done in Fig. 12, most of them occupy the same region as similar mass star-forming galaxies. In light of this, we are confident that the existence of this small group does not affect our conclusions as to the role of AGN feedback in instigating the quenching of the general population of galaxies.
We defer an in-depth analysis as to the reason this specific galaxy population is quenched to a later date, but offer several conjectures as to why these galaxies are found in this state. It is possible that these are ‘back-splash’ galaxies which evaded our filtering procedure, i.e. galaxies who are centrals at but were identified as satellites at some point in the past . When we further remove all galaxies which were identified as satellites within the past , the low-mass, low-entropy galaxies now comprise 3.3 percent of total TNG300 sample and roughly 13 percent of the quenched sub-sample. In TNG100, most galaxies from this group were found to be ‘back-splash’ galaxies and only a negligible number of quenched low-mass galaxies remain after their removal, based on the criteria set out in Section 2.4.
Another possibility is that the quenched state of these galaxies is a transient short-lived episode of low SFR. We tested this conjecture by examining the smoothed SFR of these systems over the past , calculated by tallying up the total amount of stellar mass formed over this period. By this metric, i.e. when the star-formation rates are averaged across longer periods of time, roughly 25 percent of these systems are actually considered star-forming. As it stands, it appears that within the TNG model there is a quenching channel for low-mass galaxies which is likely resolution dependent.