Crystalline shielding mitigates structural rearrangement and localizes memory in jammed systems under oscillatory shear
Abstract
The nature of yield in amorphous materials under stress has yet to be fully elucidated. In particular, understanding how microscopic rearrangement gives rise to macroscopic structural and rheological signatures in disordered systems is vital for the prediction and characterization of yield and for the study of how memory is stored in disordered materials. Here, we investigate the evolution of local structural homogeneity on an individual particle level in amorphous jammed two-dimensional systems under oscillatory shear, and relate this evolution to rearrangement, memory, and macroscale rheological measurements. We identify a new structural metric, crystalline shielding, that is predictive of rearrangement propensity and the structural volatility of individual particles under shear. We use this metric to identify localized regions of the system in which the material’s memory of its preparation is preserved. Our results contribute to a growing understanding of how local structure relates to dynamic response and memory in disordered systems.
I Introduction
Amorphous, jammed systems 1 are abundant in nature and utilized often to process and produce materials 2. The way in which these systems’ disordered multi-scale structure 3 evolves under the application of stress 4; 5; 6; 7; 8, eventually resulting in catastrophic yielding 9, is an area of active investigation with consequences for phenomena ranging from landslides and other forms of landscape evolution 10; 11 to cellular unjamming during tumor metastasis 12; 13. The identification of local structural characteristics that are coupled to dynamical response under stress in disordered systems is of particular interest. Yet, associated efforts have been hampered by the lack of obvious structural order in such systems and the often subtle nature of the relevant dynamics.
Memory encoding in amorphous materials is an especially intriguing stress response with a highly non-trivial relationship to heterogeneous structure. The evolution of a disordered system can depend on its preparation history, resulting in embedded memories of the past that can be read out by subsequent procedures 14. Material memory has been observed in a variety of forms ranging from the simple to the complex. For example, amorphous systems under oscillatory shear have recently been found to develop precisely cyclical particle trajectories 15; 16; 17; 18; 19; 20 that can encode single or multiple memories of the strain amplitude at which the material was prepared 21; 22; 23; 24; 25; 26. Materials may also simply remember the direction in which they were last deformed and express that memory via directional asymmetry in their response to subsequent stress, as in the case of the well-known Bauschinger effect observed in metals 27; 28 and amorphous materials 29; 30; 31. Even in such a seemingly simple case, however, important open questions remain regarding the microstructural origin of response asymmetry 30. To understand the more complicated forms of memory in materials, it is crucial that the relationship between local structure and the simple memory encoded by shear response anisotropy in heterogeneous materials be fully elucidated.
Here, we provide a conceptual link between local structure and memory as encoded in the response of a two-dimensional dense colloidal system under oscillatory shear. Experiments are performed using a custom-made interfacial stress rheometer in which a dense (jammed) particle monolayer is sheared using a magnetic needle 32. This method provides sufficient spatial and temporal resolution to probe structural rearrangement probability on the scale of individual particles, while simultaneously measuring bulk rheological properties.
We show that these jammed and disordered systems have memory of their preparation, exhibited via an asymmetry in local deformation with respect to shear direction below yielding. We use generic measures of structural homogeneity on an individual particle level to track the sample microstructure over time, and find that global crystallinity is also asymmetric with respect to shear direction, and thus encodes preparation memory. This memory is increasingly “erased” as strain amplitude increases beyond yielding. We next demonstrate that, on an individual particle level, correlations in crystallinity over time are reliable indicators of particle rearrangement. We stratify crystalline particles into subgroups according to their interiority within crystal grains, and find that the propensity for rearrangement occurs in a hierarchy according to this crystalline shielding metric, with particles most interior within grains rearranging least. Our results show that the likelihood of particle rearrangement depends on a continuum of interiority within crystal grains rather than a binary classification of grain boundary vs. interior as has been found previously 33; 18; 32; 34; 35. Finally, we show that rearrangement asymmetry with respect to shear direction also occurs in a hierarchy according to crystalline shielding, with asymmetry being highest for particles most interior within grains. Thus, we conclude that sample preparation memory is spatially localized to the interior of crystal grains.
II Methods
II.1 Experiments
Experiments are performed using a custom-made interfacial stress rheometer (ISR) to controllably impose shear deformation on two-dimensional jammed colloidal suspensions. The ISR apparatus allows for the tracking of single particles (and hence microstructure characterization), while simultaneously measuring the suspension bulk rheological properties (e.g. viscous and elastic modulii). We will briefly describe the ISR employed in our experiments, and further details can be found in Refs. 18; 32. The ISR is composed of a ferromagnetic needle trapped at a decane/water interface by capillary forces, between two vertical glass walls. These walls pin the interface to maintain a flat shearing channel that can be simultaneously imaged with a microscope. Particles are adsorbed at this interface, creating a two-dimensional jammed colloidal suspension. Particle positions are identified and linked to form trajectories using the open-source particle-tracking software trackpy 36; 37. The positions of approximately 40,000 particles are tracked during shearing.
To obtain an interface’s rheological information, the needle is driven axially by a known, imposed, magnetic force generated by two Helmholtz coils. The displacement of the needle is measured using a microscope. A monolayer’s shear storage () and loss () moduli are calculated from the imposed force and observed displacement 38; 39; 40. Experiments access shear moduli over a range of strain amplitudes , with , at a fixed frequency of 0.1 Hz. Prior to each experiment, the monolayer is prepared via six cycles of shearing at a large strain amplitude (). Shearing is then halted, and resumed at smaller strain amplitudes for experimental data collection.
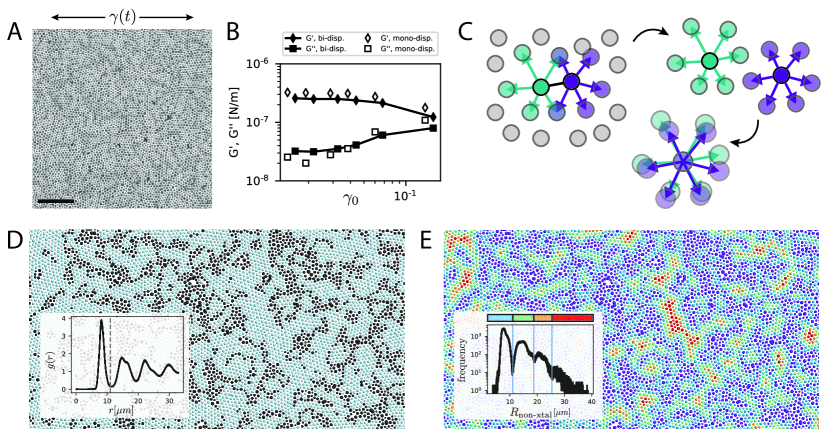
All particles are sulfate latex (invitrogen) and experience dipole-dipole repulsion due to charge groups on the surface of the particles 41. All packings have high enough area fraction to be fully jammed without shear. Data from two main experimental systems are analyzed here: a bi-disperse system (equal parts 4.1 and 5.6 diameters, ) is analyzed in the main Results section, and a mono-disperse system (5.6 diameter, ) is analyzed in the Discussion and Supplementary Information sections. (We note that these experimental systems were examined in Ref. 32 with different analytical techniques to test distinct hypotheses.) A snapshot of a bi-disperse two-dimensional jammed amorphous colloidal system is shown in Fig. 1A. Oscillatory rheology measured for these systems is shown in Fig. 1B. In both systems, the rheological yield strain amplitude is approximately .
II.2 Structural analysis
To investigate local structure in these amorphous colloidal systems, we use an environment matching method to characterize continuous structural homogeneity and discrete crystallinity. Software can be found in the open-source analysis toolkit freud 42. Our approach, schematically illustrated in Fig. 1C, characterizes whether particle environments are sufficiently similar to their neighbors’ environments, regardless of the structure of the environment itself.
We define particle ’s environment (shown as green vectors in Fig. 1C) as the set of vectors , where points from the center of particle to the center of particle , and is an index over ’s nearest neighbors. We then inspect all environments of ’s neighbors. Let one such neighbor be labeled . Particle ’s environment (shown as purple vectors in Fig. 1C) is defined as the set of vectors , where points from the center of particle to the center of particle and loops over ’s nearest neighbors. We then compare the environments of particle and particle by attempting to match these sets of vectors. Particle ’s environment “matches” particle ’s environment if we can find a one-to-one mapping such that for every mapping pair for some threshold . Nearest neighbors of each particle are defined as those within a radial distance for the bi-disperse systems and for the mono-disperse systems, determined approximately by the minimum after the first peak of the radial distribution function calculated over all particles in each system. Fig. 1D (inset) shows the radial distribution function of a sample bi-disperse experiment at , collected over one shear cycle. Environments of particles and are only compared if , and thus a one-to-one mapping is possible; otherwise, particles and are automatically deemed non-matching. The threshold was chosen for all systems, because 0.2 or 0.3 times the approximate nearest-neighbor distance () has proven appropriate – neither too stringent nor too lenient – in other contexts 43; 44. Supplementary Fig. S2 explores the impact of threshold choice on crystallinity characterization as we explain next.
If the environments of two neighboring particles match, then they are designated members of the same crystal grain. Crystallinity is defined in this paper as the fraction of particles in crystal grains of size larger than 1, and particles are defined as crystalline if they are members of a crystal grain of size larger than 1. Fig. 1D shows a snapshot of a sample bi-disperse experiment at with all crystalline particles identified. Particles are drawn with radii equal to twice the measured image radii of gyration for ease of visualization. Crystalline structure in this system is hexagonal in nature, as reported in Ref. 32 and also as evidenced by histograms of the bond-orientational order parameter , collected separately for crystalline particles and non-crystalline particles over one cycle of two example systems (Supplementary Fig. S1). The complex number , where is the number of nearest neighbors of particle and is the angle between and the vector , measures the six-fold orientational symmetry of particle ’s environment. The distribution of values for crystalline particles peaks near 1 in both experiments shown in Fig. S1, implying strong hexagonal order, while for disordered particles is distributed evenly across all values between 0 and 1. The choice of matching threshold influences the hexagonal quality of the identified crystal grains as shown in Supplementary Fig. S2A. We find that setting the threshold below results in many particles being deemed disordered that nevertheless have high hexagonal ordering, whereas setting the threshold above results in many particles being deemed crystalline that have low hexagonal ordering. Thus, is a reasonable compromise that produces a well-defined bipartition of crystalline and disordered particles. Furthermore, we find that the choice of threshold, within reason, does not change our results pertaining to crystallinity reported in Section III.1 (see Figs. S2B, S2C).
We quantify the shielding, or interiority of a crystalline particle within a grain, by , the distance of that particle to the nearest non-crystalline particle. Shielding is higher as increases. Example distributions of for all particles in 6 consecutive non-transient cycles of a sample bi-disperse experiment at (Fig. 1E inset) show clear peaks and valleys that inform the way in which we bin into four shielding levels, . The minima of are approximately the first three minima of , shown inset in Fig. 1D, as one would expect. These minima are not influenced by strain amplitude, as shown in Supplementary Fig. S7, which displays distributions of for all particles over several cycles in experiments below and above yield. A rendering of the system with particles colored according to crystalline shielding illustrates the concept (Fig. 1E). Disordered particles, whose distance to the nearest non-crystalline particle is formally zero, are also shown and colored purple.
Due to occasional imaging or tracking errors, or to particles moving out of the imaging field of view, some particles are not preserved over the course of entire experiments. The fraction of preserved particles ranges from (for the smallest strain amplitude) to (for the largest strain amplitude) in the bi-disperse system, and from to (not correlated with strain amplitude) in the mono-disperse system. To eliminate any spurious effects due to the non-preserved particles, we typically calculate structural signatures of all particles in every snapshot, but only show those signatures of particles that are tracked and preserved over the entire experiment. Unless otherwise stated, the following results will always be for the preserved particles in each experiment.
III Results
III.1 Crystallinity oscillates with shear and reveals material preparation memory
We first investigate whether our systems retain memory of their preparation history, by studying the symmetry of their deformation response with respect to shear direction. We measure local deformation according to how much the average nearest neighbor shell stretches, and find that deformation is asymmetric with respect to shear direction at low strain amplitude. Local deformation displays increasing symmetry as strain amplitude increases.
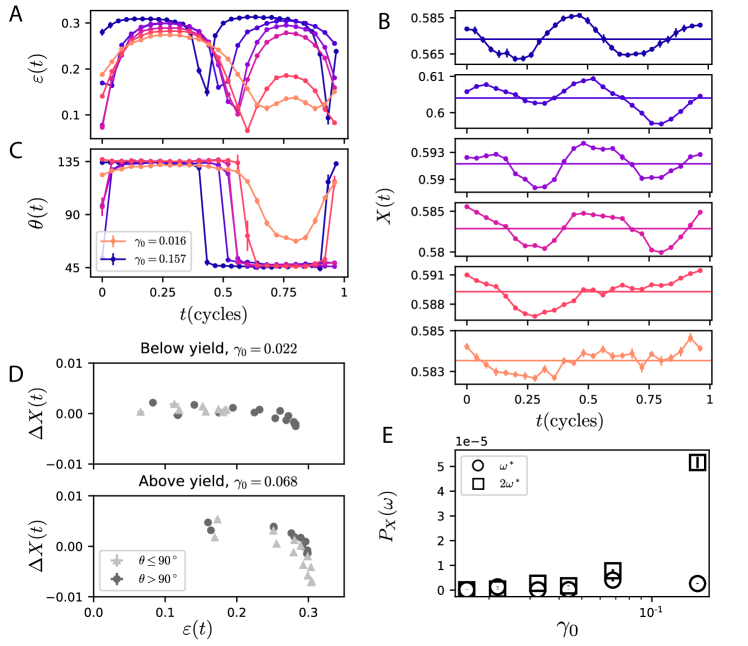
Fig. 2A shows the eccentricity of the ellipse fit to the average nearest neighbor shell over multiple shear cycles for experiments at all strain amplitudes, and Fig. 2C shows ellipse orientation, defined as the angle from the positive x-axis to its major axis. Eccentricity and orientation signatures are calculated for each experiment from an ellipse fit to the average nearest neighbor shell of all particles (even if they are not preserved over the entire experiment), defined as the boundary demarcated by the first peak of the two-dimensional histogram of nearest neighbors accumulated over every particle. We show stroboscopic averages of each signal over the non-transient portion of each system trajectory, conservatively defined as the set of cycles well after the global crystallinity for each system, defined below, has reached steady-state oscillation. Signals for full trajectories are shown in Supplementary Fig. S3.
At high strain amplitude, well above yield, eccentricity reaches approximately equal heights during the first and second halves of each cycle, and thus local deformation is approximately symmetric with respect to shear direction. As strain amplitude decreases, however, eccentricity grows smaller (and thus local deformation is smaller) during the back half of each cycle, when . Asymmetry in deformation between the first and second shear half-cycles implies an anisotropy in the system that encodes the system’s history, and this memory is “erased” with increasing strain amplitude.
We next consider whether this asymmetrical response is exhibited by measures of structure in our systems. We calculate global crystallinity for each system over time and find that it also displays an asymmetry with respect to shear direction at low strain amplitude, thus seeming to also indicate material anisotropy and preparation memory. Global crystallinity at time , , is the fraction of particles in the system that are crystalline, as defined in the Methods. We note that we could instead have chosen to analyze a more continuous per-particle measure of structural homogeneity, : the root-mean-squared deviation between the environment of particle and that of its neighbor, averaged over all of its neighbors. Another global measure of structural homogeneity is then , where the average is taken over all particles in the system at each time. Calculation of is explained in more depth in the Supplementary Information, and results using this alternative definition, shown in Supplementary Fig. S5, are very similar to those presented here.
Fig. 2B shows that global crystallinity oscillates in time with shear, in agreement with other studies 45 that observed similar structural oscillations. The amplitude of the crystallinity oscillation increases with strain amplitude. We show stroboscopic averages of each signal over non-transient trajectories identical to those used to calculate Fig. 2A, C. Full signals, showing initial transient behavior, are shown in Supplementary Fig. S3. At low strain amplitude, there is an asymmetry in the crystallinity signal with respect to shear direction, and this asymmetry is erased as strain amplitude increases. This asymmetry erasure is evident in the power spectra of the signals via the periodogram estimate (Fig. 2E): we find that the power spectral density associated with twice the frequency of the needle oscillation, , increases with strain amplitude, whereas remains relatively stable. Each power spectral density is the mean of a set of values calculated over consecutive 2 cycle windows of the relevant non-transient trajectory shown in Supplementary Fig. S4, and error bars represent the standard deviation of the mean. Full power spectral density distributions over all are also shown in Supplementary Fig. S4.
In general, global crystallinity decreases as deformation increases. This behavior can be seen in plots of deviation in the crystallinity from its mean, , against neighborhood ellipse eccentricity for systems below and above yield (Fig. 2D). Plots for all experiments are shown in Supplementary Fig. S6. As eccentricity increases, crystallinity dips, and this dip is more pronounced above yield. Below yield, crystallinity during the second half-cycle (for which ) remains distributed close to , due to asymmetry with respect to shear direction. In the experiment we show above yield, crystallinity during the second half-cycle dips even lower than crystallinity during the first half-cycle (for which ).
III.2 Correlations in crystallinity over time indicate particle rearrangement under shear
A closer investigation of the structure of individual particles over time reveals that correlations in crystallinity are reliable indicators of individual particle rearrangement. To show this, we quantify crystallinity correlation via , the conditional probability that a particle is in structure at time given that it was in the same structure at time . In our analysis, either , representing crystalline structure, or , representing non-crystalline or disordered structure. We compare crystallinity correlation to a metric that measures particle rearrangement: 29, the mean squared deviation of the displacements of a particle and its neighbors from the best-fit affine deformation of those displacements 46. High values of correspond to non-affine deformations between times and , which manifest as particle rearrangements. We find that and are inversely related: when is lower, is higher, and vice versa. This relationship implies that structural auto-correlation captures particle rearrangement dynamics.
To gain more insight into the influence of crystalline structure on rearrangement dynamics, we partition particles into groups according to their crystalline shielding level at time , as explained in the Methods, when calculating and . Supplementary Figs. S7 and S8 show fractions of particles at each crystalline shielding level as a function of time for all strain amplitudes; we observe that each signature oscillates distinctly in time, showcasing the evolution of crystal grain morphology during the shear cycle.
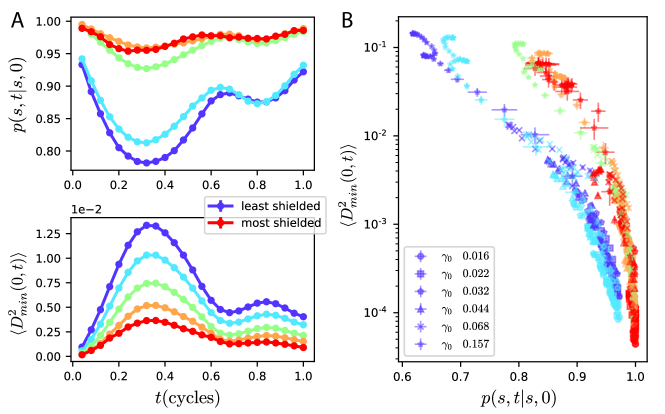
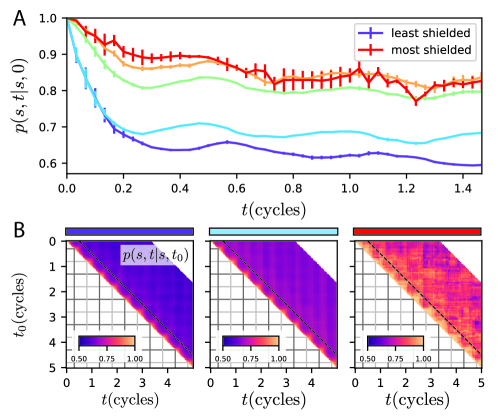
We find that rearrangements occur in a hierarchy according to shielding level, with more shielded particles prone to less rearrangement at all points of the shear cycle. This result indicates that degree of interiority within crystal grains has a significant impact on rearrangement dynamics. As an example, we consider a sample experiment at (above yield) in Fig. 3A. The top panel of Fig. 3A shows the quantity for each shielding layer as a function of over one shear cycle, with marking the beginning of the cycle. The bottom panel shows the quantity for the same experiment and identical values of and , where the average is taken over all particles in each shielding level at . Both panels show stroboscopic averages of each signal over non-transient trajectories. While particles in all shielding layers show rearrangement within the shear cycle according to both and , we find that more interior shielding layers generally show higher values of and lower values of , indicating less rearrangement.
Additionally, in all cases, reaches a global minimum and reaches a global maximum around cycles (the time of the first strain extremum), while these signals reach local minima and local maxima, respectively, around cycles (the time of the second strain extremum). Rearrangement is more evident during the first shear half-cycle; this asymmetry is further evidence of a difference in material response according to shear direction, and hints that the system remembers its history.
We compile results for all strain amplitudes in Fig. 3C, which clearly evidences the inverse relationship between and for all shielding levels. As strain amplitude increases, the minima in decrease, and the maxima in increase, indicating increased rearrangement with strain amplitude. Curiously, shielding levels show a roughly log-linear relationship between and across most strain amplitudes, with disordered particles and particles at grain boundaries showing a smaller slope between these quantities than the more interior crystalline particles. We may conclude in general that correlations in crystallinity over time, captured by , indicate rearrangement of individual particles, and that rearrangement occurs in a hierarchy according to interiority within crystal grains.
Finally, we note that these results seem quite robust; alternate analysis of structural rearrangement using time correlations in the continuous structural homogeneity parameter , introduced in Section III.1, leads to similar conclusions to those presented above (see Supplementary Fig. S9).
III.3 Asymmetry in crystallinity correlation with respect to shear direction is localized within crystal grains
Next, we demonstrate that particles more interior within crystal grains, or more shielded, have a rearrangement propensity that is more asymmetric with respect to shear direction, indicating that memory of material history is localized within crystal grains. To do so, we quantify the difference in rearrangement propensity with respect to shear direction via the correlation , the conditional probability that a particle is in structure (either crystalline or disordered) at time given that it was in the same structure half a cycle earlier. The quantity thus measures correlation between equivalent time points in each half-cycle, differing only in the direction of shear, since the applied shear is sinusoidal. As in the previous section, at each time , we group particles according to their crystalline shielding level at time , and calculate over each particle subgroup. (Note that this correlation, and the correlations presented in the previous section, are in fact one-dimensional cuts through a full two-dimensional probability distribution . Full two-dimensional distributions for non-transient portions of trajectories at all strain amplitudes are shown in Supplementary Figs. S10 and S12.)
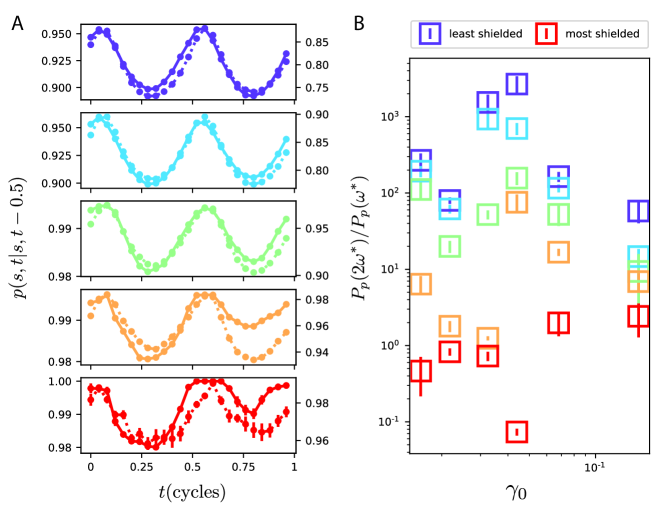
Fig. 4A shows for all shielding layers for experiments below () and above () yield. Signals are stroboscopic averages over non-transient system trajectories shown in Supplementary Fig. S12. The two minima in each signal show that particles in all shielding levels are least structurally auto-correlated when both and are times of strain extremum, at 0.25 and 0.75 cycles. This bimodal nature stems from the fact that particles are most dynamically responsive to shear, rearranging most, at those times of strain extremum. However, for the more shielded layers in the experiment below yield, there is a striking asymmetry between the first and second halves of the signal. The correlation reaches a shallower minimum in the second half-cycle, around cycles, than it does in the first half-cycle, around cycles. This asymmetry implies that shielded particles are less responsive to shear during the second half-cycle than they are during the first half-cycle. The asymmetry is not as prominent for the least shielded layers, and diminishes in the experiment above yield.
We quantify this asymmetry via , the ratio of power spectra of each signal at and , where is the frequency of the shear cycle. Fig. 4B shows this ratio for each shielding layer at all strain amplitudes, and provides further evidence that more shielded crystalline particles are more asymmetric with respect to direction in their response to shear. Power spectra are calculated via the periodogram estimate and each value is the mean of a set of such values calculated over consecutive two-cycle windows of the full non-transient signal shown in Supplementary Fig. S12. Power spectral densities for each frequency at all strain amplitudes are reported separately in Supplementary Fig. S11. The ratio is highest for the least shielded particles, and lowest for the most shielded particles, at all strain amplitudes. This finding implies that the structural rearrangement of the least shielded particles is most symmetric with respect to shear direction, and the structural rearrangement of the most shielded particles is least symmetric with respect to shear direction. In fact, our results suggest a hierarchy of asymmetry in structural response according to crystalline shielding layer. Thus, response anisotropy, signifying the material’s memory of its history, is spatially localized within crystal grains.
IV Discussion
We have demonstrated that bi-disperse amorphous, jammed systems under oscillatory shear show an asymmetry with respect to shear direction in both local deformation and structural homogeneity. This asymmetric response is only erased at high strain amplitudes above yield. Per-particle auto-correlations in structural homogeneity are also asymmetric with respect to shear direction, and auto-correlations are especially asymmetric for particles that are most interior, i.e. shielded, within crystal grains. We believe that observed asymmetries are indicative of memory of the system’s history or preparation, and our findings imply that this simple form of memory is spatially localized within crystal grains.
IV.1 Structural reversibility is destroyed only at strain amplitudes well above yield
We first address the system at the highest strain amplitude studied, , which displays per-particle structural correlations that are qualitatively different than structural correlations of systems at lower strain amplitudes (even when those systems are still above yield). Fig. 5 displays some of these signals; together, they show that particles at do not retain their distinct structural identities of crystalline or disordered in any significant capacity even over the course of one shear cycle. The system is in a state of structural irreversibility on the individual particle level, even while structural reversibility exists at lower strain amplitudes that are still above yield.
Fig. 5A shows for each shielding layer at as a function of over 1.5 shear cycles, with marking the beginning of the cycle. This structural auto-correlation is calculated identically to that shown in Fig. 3A for , still above the yield strain. Notably, whereas the correlations in Fig. 3A appear periodic within one shear cycle and only show slow decay over longer timescales (Supplementary Figs. S10 and S12), correlations in Fig. 5A are never periodic and decay rapidly during the first cycle for all shielding layers, showing the destruction of maintained particle identities over the course of one cycle.
The decay in structural auto-correlation at can be seen more fully in two-dimensional distributions of across and . Fig. 5B shows distributions for particles in three crystalline shielding layers at time : disordered particles, grain boundary particles, and particles that are most interior within crystal grains. None of these two-dimensional distributions display meaningful periodicity over any one-dimensional cut through them, except the cut , drawn as a black dotted line. This signal, explored thoroughly in the Results, measures correlations only within the half-cycle time window, and indicates that the maximum period over which particles retain their structural identity is approximately half a cycle.
According to the oscillatory rheology shown in Fig. 1B, at the highest strain amplitude , the storage modulus and loss modulus are closest to each other, approaching equality. We therefore posit that our particle-scale measurements of correlations in local structural homogeneity capture the macroscopic, rheological cross-over point at which material behavior is equally dominated by elastic and viscous response.
IV.2 Crystalline shielding in a mono-disperse system with larger crystal grains
We also analyzed crystallinity and structural rearrangement in a mono-disperse system 32, identical in preparation to the bi-disperse one discussed in the Results. Due to the mono-dispersity, crystalline grains are larger, and thus crystalline shielding is deeper. Our results, shown in Supplementary Figs. S13, S14, and S15, are in agreement with those already presented. We find oscillating measures of global structural heterogeneity, both crystallinity and averaged over all particles, and an asymmetry in those measures with respect to shear direction as strain amplitude decreases, indicating that some material anisotropy and memory is preserved in the system (Supplementary Figs. S13A, S13B, S14). Deep crystalline shielding exists in the system (Supplementary Figs. S13C, S13D, S13E), and particles of deeper shielding are generally less structurally volatile, with higher values of (Supplementary Figs. S13F and S15). Particles of deeper shielding are also generally more asymmetrical in their structural response with respect to shear direction: crystalline particles that are more shielded have probability signals that are more dissimilar between each half of the shear cycle. As a result, more shielded layers generally have lower values of (Supplementary Fig. S13G). These results are not as clear-cut as those obtained from the bi-disperse system, perhaps because in the mono-disperse system there are more crystalline layers, each with fewer particles, and statistics are consequently thinner. However, we can observe that the three most shielded layers have lower values than the three least shielded layers at all strain amplitudes except for the highest strain amplitude studied. Particles of deeper shielding thus in general form regions in which the system’s memory of its preparation is localized. At the highest strain amplitude, we observe qualitatively distinct structural correlation measures across all shielding layers (Supplementary Fig. S15). Correlations are not periodic even within one shear cycle, and differ in behavior from correlations at all lower strain amplitudes, in a similar manner to that discussed in Section IV.1. Thus, particle structural identities are not retained even over one shear cycle. The highest strain amplitude is again a point at which and approach equality as shown in Fig. 1B, implying that our local correlation measures capture a macroscopic rheological transition.
V Conclusions
In this paper, we have presented new and accessible measures on the individual particle level that correlate with non-trivial phenomena on the macroscale. Our measures capture local structural homogeneity and its correlations over time, and are quite distinct from other quantities such as 29 or T1 events 47 usually employed to investigate microstructural response under shear. We have found that, by simply measuring correlations in the degree to which an individual particle’s environment is similar to those of its neighbors, we can shed light on macroscale yield and memory effects in amorphous materials under oscillatory shear.
Our analysis indicates that the system-wide average of crystallinity on the particle level shows asymmetry with respect to shear direction, and thus encodes the material’s memory of its preparation. Correlations over time in the structural homogeneity of individual particles are reliable indicators of particle rearrangement as measured by , and these correlations also show asymmetry with respect to shear direction. The observed structural asymmetric response is not homogeneous throughout the system, however. Particles that are more interior within crystal grains, or more “shielded,” are generally less structurally volatile over time, and intriguingly least symmetric in their structural response with respect to shear direction. Thus, response asymmetry and consequent material memory is spatially localized in crystal grains.
Additionally, we have found that structural correlations are qualitatively different at strain amplitudes for which macroscale rheological measures of elastic and viscous response approach cross-over, implying that our local measurements indicate a behavioral transition usually only visible on a much larger length scale. Our work bridges the micro- and macro- scales, and thus will be useful for future experimentalists studying yield in amorphous systems who may have access only to information on one length scale, either microstructural or rheological. Our efforts add to the growing body of knowledge regarding the nature of microscopic rearrangement and macroscopic yield in disordered materials, and help to illuminate how, and specifically where, certain types of memory are stored in these systems.
VI Citation diversity statement
Recent work in several fields of science has identified a bias in citation practices such that papers from women and other minorities are under-cited relative to other papers in the field 48; 49; 50; 51; 52; 53. Here we sought to proactively consider choosing references that reflect the diversity of our field in thought, form of contribution, gender, and other factors. We obtained predicted gender of the first and last author of each reference by using databases that store the probability of a name being carried by a woman or a man 48; 54; we supplemented these results with online research of individuals for whom automatic classification failed. By this measure (and excluding self-citations to the first and last authors of our current paper), our references contain man/man, man/woman, woman/man, and woman/woman categorization. The automated method is limited in that a) names, pronouns, and social media profiles used to construct the databases may not, in every case, be indicative of gender identity and b) it cannot account for intersex, non-binary, or transgender people. We look forward to future work that could help us to better understand how to support equitable practices in science.
VII Acknowledgements
We thank Michael Engel for use of the software package inJaVis, used to visualize the particle systems. E.G.T, K.L.G, P.E.A, and D.S.B. are supported by the National Science Foundation Materials Research Science and Engineering Center at University of Pennsylvania (NSF grant DMR-1120901). K.L.G. and P.E.A are additionally supported by the U.S. Army Research Office (ARO grant W911-NF-16-1-0290). E.G.T and D.S.B. are additionally supported by the Paul G. Allen Family Foundation. The views and conclusions contained in this document are solely those of the authors.
References
- Liu and Nagel (2010) A. J. Liu and S. R. Nagel, Annual Review of Condensed Matter Physics 1, 347 (2010).
- Liu and Nagel (1998) A. J. Liu and S. R. Nagel, Nature 396, 21 (1998).
- Papadopoulos et al. (2018) L. Papadopoulos, M. A. Porter, K. E. Daniels, and D. S. Bassett, Journal of Complex Networks 6, 485 (2018), arXiv:1708.08080 .
- Manning and Liu (2011) M. L. Manning and A. J. Liu, Physical Review Letters 107, 108302 (2011), arXiv:1012.4822 .
- Cubuk et al. (2017) E. D. Cubuk, R. J. S. Ivancic, S. S. Schoenholz, D. J. Strickland, A. Basu, Z. S. Davidson, J. Fontaine, J. L. Hor, Y.-R. Huang, Y. Jiang, N. C. Keim, K. D. Koshigan, J. A. Lefever, T. Liu, X.-G. Ma, D. J. Magagnosc, E. Morrow, C. P. Ortiz, J. M. Rieser, A. Shavit, T. Still, Y. Xu, Y. Zhang, K. N. Nordstrom, P. E. Arratia, R. W. Carpick, D. J. Durian, Z. Fakhraai, D. J. Jerolmack, D. Lee, J. Li, R. Riggleman, K. T. Turner, A. G. Yodh, D. S. Gianola, and A. J. Liu, Science 358, 1033 (2017).
- Tordesillas et al. (2010) A. Tordesillas, D. M. Walker, and Q. Lin, Physical Review E 81, 011302 (2010).
- Herrera et al. (2011) M. Herrera, S. McCarthy, S. Slotterback, E. Cephas, W. Losert, and M. Girvan, Physical Review E - Statistical, Nonlinear, and Soft Matter Physics 83, 1 (2011).
- Papadopoulos et al. (2016) L. Papadopoulos, J. G. Puckett, K. E. Daniels, and D. S. Bassett, Physical Review E 94, 1 (2016), arXiv:1603.08159 .
- Bonn et al. (2017) D. Bonn, M. M. Denn, L. Berthier, T. Divoux, and S. Manneville, Reviews of Modern Physics 89, 035005 (2017), arXiv:1502.05281 .
- Ferdowsi et al. (2018) B. Ferdowsi, C. P. Ortiz, and D. J. Jerolmack, Proceedings of the National Academy of Sciences 115, 4827 (2018), arXiv:1708.06032 .
- Jerolmack and Daniels (2019) D. J. Jerolmack and K. E. Daniels, Nature Reviews Physics 1, 716 (2019).
- Bi et al. (2016) D. Bi, X. Yang, M. C. Marchetti, and M. L. Manning, Physical Review X 6, 1 (2016), arXiv:1509.06578 .
- Oswald et al. (2017) L. Oswald, S. Grosser, D. M. Smith, and J. A. Käs, Journal of Physics D: Applied Physics 50, 10.1088/1361-6463/aa8e83 (2017).
- Keim et al. (2019) N. C. Keim, J. D. Paulsen, Z. Zeravcic, S. Sastry, and S. R. Nagel, Reviews of Modern Physics 91, 35002 (2019), arXiv:1810.08587 .
- Corté et al. (2008) L. Corté, P. M. Chaikin, J. P. Gollub, and D. J. Pine, Nature Physics 4, 420 (2008).
- Regev et al. (2013) I. Regev, T. Lookman, and C. Reichhardt, Physical Review E - Statistical, Nonlinear, and Soft Matter Physics 88, 1 (2013), arXiv:1301.7479 .
- Schreck et al. (2013) C. F. Schreck, R. S. Hoy, M. D. Shattuck, and C. S. O’Hern, Physical Review E - Statistical, Nonlinear, and Soft Matter Physics 88, 1 (2013), arXiv:1301.7492 .
- Keim and Arratia (2014) N. C. Keim and P. E. Arratia, Physical Review Letters 112, 1 (2014), arXiv:1308.6806 .
- Royer and Chaikin (2015) J. R. Royer and P. M. Chaikin, Proceedings of the National Academy of Sciences 112, 49 (2015).
- Lavrentovich et al. (2017) M. O. Lavrentovich, A. J. Liu, and S. R. Nagel, Physical Review E 96, 2 (2017), arXiv:1705.08368 .
- Keim and Nagel (2011) N. C. Keim and S. R. Nagel, Physical Review Letters 107, 1 (2011), arXiv:1101.2931 .
- Paulsen et al. (2014) J. D. Paulsen, N. C. Keim, and S. R. Nagel, Physical Review Letters 113, 1 (2014), arXiv:1404.4117 .
- Fiocco et al. (2014) D. Fiocco, G. Foffi, and S. Sastry, Physical Review Letters 112, 1 (2014).
- Adhikari and Sastry (2018) M. Adhikari and S. Sastry, European Physical Journal E 41, 10.1140/epje/i2018-11717-5 (2018).
- Mukherji et al. (2019) S. Mukherji, N. Kandula, A. K. Sood, and R. Ganapathy, Physical Review Letters 122, 158001 (2019), arXiv:1808.07701 .
- Keim et al. (2020) N. C. Keim, J. Hass, B. Kroger, and D. Wieker, Physical Review Research 2, 012004 (2020), arXiv:1809.08505 .
- Dieter (1961) G. E. Dieter, Jr., Mechanical Metallurgy (McGraw-Hill Book Company, Inc., 1961).
- Sowerby et al. (1979) R. Sowerby, D. K. Uko, and Y. Tomita, Materials Science and Engineering 41, 43 (1979).
- Falk and Langer (1998) M. L. Falk and J. S. Langer, Physical Review E 57, 7192 (1998).
- Karmakar et al. (2010) S. Karmakar, E. Lerner, and I. Procaccia, Physical Review E 82, 026104 (2010).
- Bhattacharjee (2015) A. K. Bhattacharjee, Soft Matter 11, 5697 (2015).
- Keim and Arratia (2015) N. C. Keim and P. E. Arratia, Soft Matter 11, 1539 (2015), arXiv:1410.2923 .
- Gokhale et al. (2012) S. Gokhale, K. H. Nagamanasa, V. Santhosh, A. K. Sood, and R. Ganapathy, Proceedings of the National Academy of Sciences 109, 20314 (2012).
- Buttinoni et al. (2017) I. Buttinoni, M. Steinacher, H. T. Spanke, J. Pokki, S. Bahmann, B. Nelson, G. Foffi, and L. Isa, Physical Review E 95, 1 (2017).
- Sharp et al. (2018) T. A. Sharp, S. L. Thomas, E. D. Cubuk, S. S. Schoenholz, D. J. Srolovitz, and A. J. Liu, Proceedings of the National Academy of Sciences of the United States of America 115, 10943 (2018), arXiv:1803.01416 .
- Allan et al. (2019) D. Allan, C. van der Wel, N. Keim, T. A. Caswell, D. Wieker, R. Verweij, C. Reid, Thierry, L. Grueter, K. Ramos, apiszcz, zoeith, R. W. Perry, F. Boulogne, P. Sinha, pfigliozzi, N. Bruot, L. Uieda, J. Katins, H. Mary, and A. Ahmadia, soft-matter/trackpy: Trackpy v0.4.2 (2019).
- Crocker and Grier (1996) J. C. Crocker and D. G. Grier, Journal of Colloid and Interface Science 179, 298 (1996).
- Shahin (1986) G. T. Shahin, Jr., The Stress Deformation Interfacial Rheometer, dissertation, University of Pennsylvania (1986).
- Brooks et al. (1999) C. F. Brooks, G. G. Fuller, C. W. Frank, and C. R. Robertson, Langmuir 15, 2450 (1999).
- Reynaert et al. (2008) S. Reynaert, C. F. Brooks, P. Moldenaers, J. Vermant, and G. G. Fuller, Journal of Rheology 52, 261 (2008).
- Park et al. (2010) B. J. Park, J. Vermant, and E. M. Furst, Soft Matter 6, 5327 (2010).
- Ramasubramani et al. (2020) V. Ramasubramani, B. D. Dice, E. S. Harper, M. P. Spellings, J. A. Anderson, and S. C. Glotzer, Computer Physics Communications , 107275 (2020), arXiv:1906.06317 .
- Cadotte et al. (2016) A. T. Cadotte, J. Dshemuchadse, P. F. Damasceno, R. S. Newman, and S. C. Glotzer, Soft Matter 12, 7073 (2016), arXiv:1605.07160v1 .
- Teich et al. (2019) E. G. Teich, G. van Anders, and S. C. Glotzer, Nature Communications 10, 64 (2019).
- Zhang et al. (2010) J. Zhang, T. S. Majmudar, A. Tordesillas, and R. P. Behringer, Granular Matter 12, 159 (2010), arXiv:0906.2416 .
- Keim (2014) N. C. Keim, philatracks v0.2 (2014).
- Weaire and Hutzler (2001) D. L. Weaire and S. Hutzler, The Physics of Foams (Clarendon Press, 2001).
- Dworkin et al. (2020) J. D. Dworkin, K. A. Linn, E. G. Teich, P. Zurn, R. T. Shinohara, and D. S. Bassett, Nature Neuroscience 10.1038/s41593-020-0658-y (2020).
- Maliniak et al. (2013) D. Maliniak, R. Powers, and B. F. Walter, International Organization 67, 889 (2013).
- Caplar et al. (2017) N. Caplar, S. Tacchella, and S. Birrer, Nature Astronomy 1, 0141 (2017).
- Chakravartty et al. (2018) P. Chakravartty, R. Kuo, V. Grubbs, and C. McIlwain, Journal of Communication 68, 254 (2018).
- Thiem et al. (2018) Y. Thiem, K. F. Sealey, A. E. Ferrer, A. M. Trott, and R. Kennison, Just Ideas? The Status and Future of Publication Ethics in Philosophy: A White Paper, Tech. Rep. (2018).
- Dion et al. (2018) M. L. Dion, J. L. Sumner, and S. M. Mitchell, Political Analysis 26, 312 (2018).
- Zhou et al. (2020) D. Zhou, E. J. Cornblath, J. Stiso, E. G. Teich, J. D. Dworkin, A. S. Blevins, and D. S. Bassett, Gender diversity statement and code notebook v1.0 (2020).