The Diffuse Ultraviolet Background Close to the Galactic Plane
Abstract
We have used Voyager and GALEX observations to map the diffuse Galactic light near the Galactic equator. We find that most of the observations are relatively faint with surface brightnesses of less than 5,000 photon units. This is important because many ultraviolet telescopes have not observed at low Galactic latitudes because of the fear of a bright diffuse emission. Our data are consistent with emission from interstellar dust grains with albedo () of 0.2 – 0.3 and phase function () at 1100 Å; at 1500 Å; and at 2300 Å.
keywords:
dust, extinction – ISM: general – local interstellar matter – diffuse radiation – ultraviolet: ISM1 Introduction
The diffuse Galactic light (DGL) in the ultraviolet (UV) is comprised of many different components whose relative contributions vary across the sky. Stellar radiation scattered from interstellar dust dominates the DGL at low Galactic latitudes (Murthy, 2016) with extragalactic radiation being more important near the poles where there is little dust (Akshaya et al., 2018, 2019). Molecular hydrogen fluorescence contributes even at high latitudes (Akshaya et al., 2019) and may contribute more at low latitudes where there are more molecular clouds. Unfortunately most missions capable of observing the diffuse radiation in the UV avoided the Galactic plane because of the fear of damaging the detectors due to the intense radiation expected (Martin et al., 2005) and there are few observations of the DGL at low latitudes.
One of the first observations in the Galactic plane was made using the Voyager ultraviolet spectrometer (UVS) in the vicinity of the Coalsack Nebula where Murthy et al. (1994) found intense radiation at 1100 Å, which they attributed to the scattering of the light from 3 of the 5 brightest UV stars in the sky from a thin layer of foreground dust. Further studies with both Voyager and the Far Ultraviolet Spectroscopic Explorer (FUSE) by Murthy & Sahnow (2004) showed a patchy distribution at low latitudes with dark regions even in the Galactic Plane. The DGL in the UV is due to the light from stars scattered by nearby dust within a few hundred parsecs of the Sun and is therefore concentrated near bright stars.
We will look at the DGL using both Voyager and GALEX data. Because these are archival observations made with long inoperative instruments, we have incomplete coverage and have a limited ability to confirm uncertain observations. Nevertheless, they provide valuable input on the sources of the diffuse light in the Galactic Plane.
2 Data
2.1 Voyager
| Voyager 1 | |
|---|---|
| 1979 – 1979.29 | Jupiter |
| 1980.64 - 1981 | Saturn |
| Voyager 2 | |
| 1979.3 – 1979.9 | Jupiter |
| 1981.4 – 1981.8 | Saturn |
| 1985.8 – 1986.2 | Uranus |
| 1989.4 – 1989.8 | Neptune |
The two Voyager spacecraft were launched in 1977 with the primary mission objective of visiting the Jovian planets. However, during their cruise phase and after the last of their planetary encounters, the two spacecraft observed many astrophysical targets with their ultraviolet spectrometers (UVS). The two UVS are identical Wadsworth-mounted objective grating spectrometers which cover the spectral range between 500 and 1700 Å (with maximum sensitivity for Å) with a field of view of (Broadfoot et al., 1977). Murthy et al. (1999); Murthy et al. (2012) reprocessed the entire Voyager database of several thousand observations and tabulated the diffuse observations, from which we have extracted those within of the Galactic equator. Note that we have excluded several of the brightest points from Murthy et al. (2012) which, upon further examination, were found to be near planetary encounters (Table 1). They were flagged as observations of the blank sky but cluster around the planetary encounters and are probably observations of the planetary environment
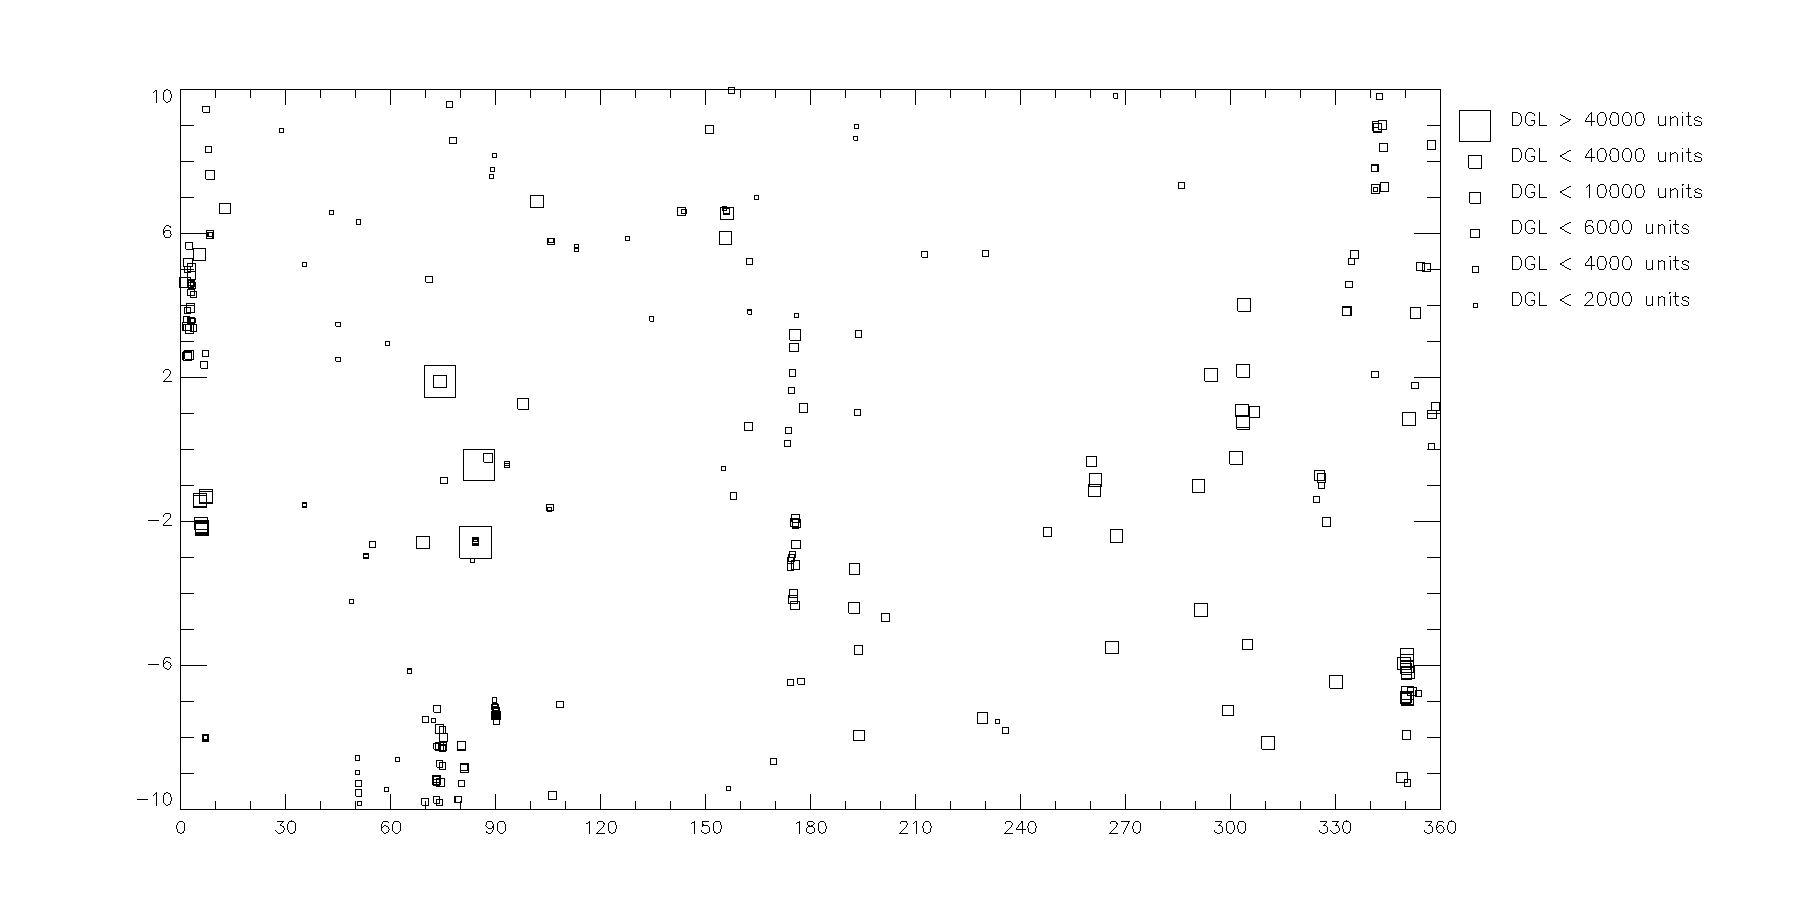
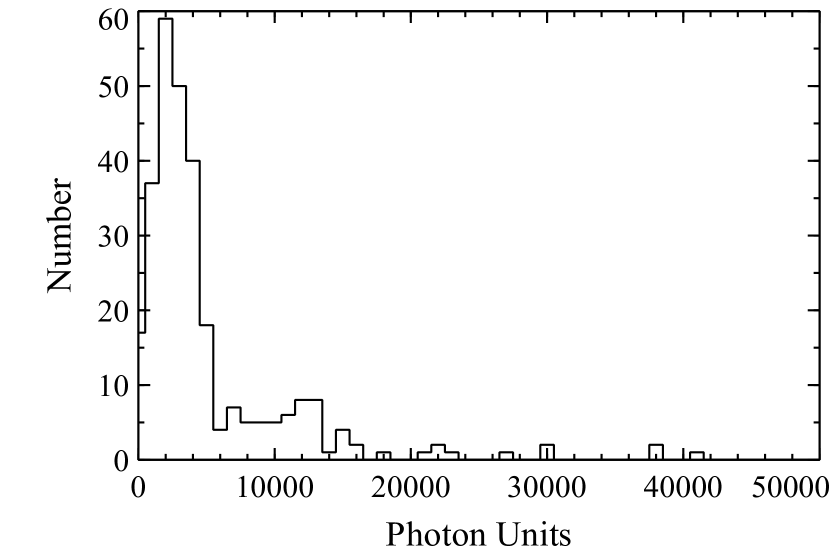
There were 292 background observations within of the Galactic plane and we have plotted these in Fig. 1 where the size of the symbol is dependent on the mean surface brightness between 1070 and 1130 Å. The distribution of the observed brightness is plotted in Fig. 2. We emphasize that, even though these are observations near the Galactic Plane, most (206) of them have a surface brightness of less than 5000 photon units and only 47 with a surface brightness of more than 10,000 photon units.
| Spacecraft | Seq.a | Date | GL | GB | Sb |
|---|---|---|---|---|---|
| 1 | 227 | 1990.68 | 85.22 | -0.43 | 117,000 |
| 1 | 281 | 1994.07 | 84.28 | -2.59 | 51,800 |
| 2 | 361 | 1985.76 | 74.05 | 1.89 | 41,500 |
| 2 | 656 | 1991.32 | 156.12 | 6.57 | 38,761 |
| 2 | 743 | 1992.83 | 294.55 | 2.08 | 30,121 |
| 2 | 795 | 1993.44 | 155.69 | 5.87 | 15,394 |
| aSequence number from Murthy et al. (2012). | |||||
| bSurface brightness in photon units from Murthy et al. (2012). | |||||
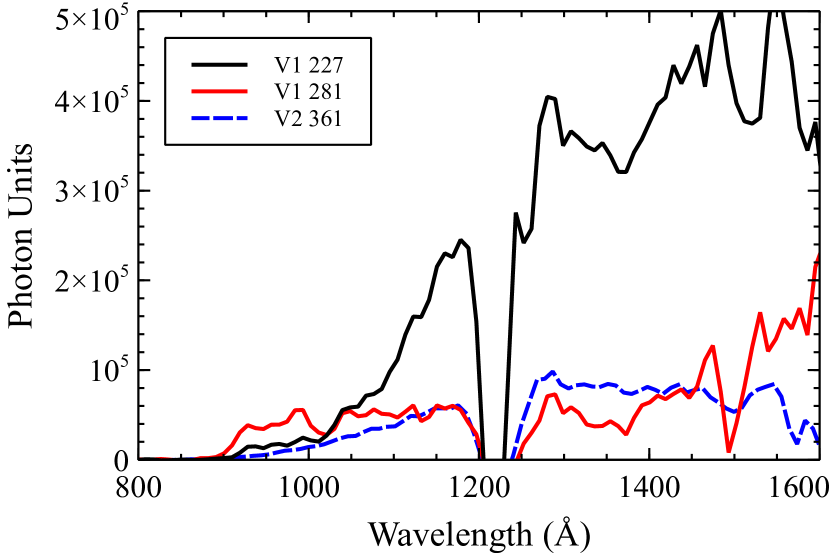
There were several bright observations in the Voyager targets in the Galactic plane (Table 2). All are consistent with an interstellar diffuse source (see Murthy et al. (2012) for details) but exist in isolation; that is, there is no plausible source in optical maps of the region. A few even overlap with the GALEX data but, again, with no evidence for such a bright source. Given the passage of time since the Voyager observations, we have not included them in this work and have left out a few others where the background subtraction was unreliable. This left 282 of the original 292 observations. The spectra for all Voyager diffuse observations, including those left out of this work, may be obtained from Murthy et al. (2012).
2.2 GALEX
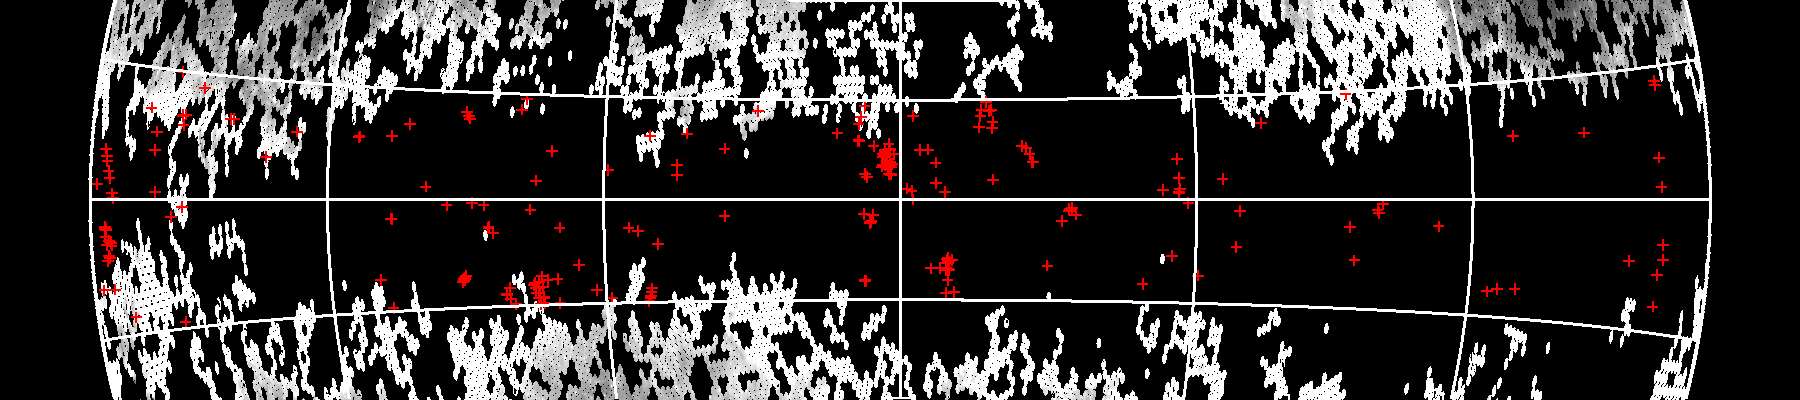
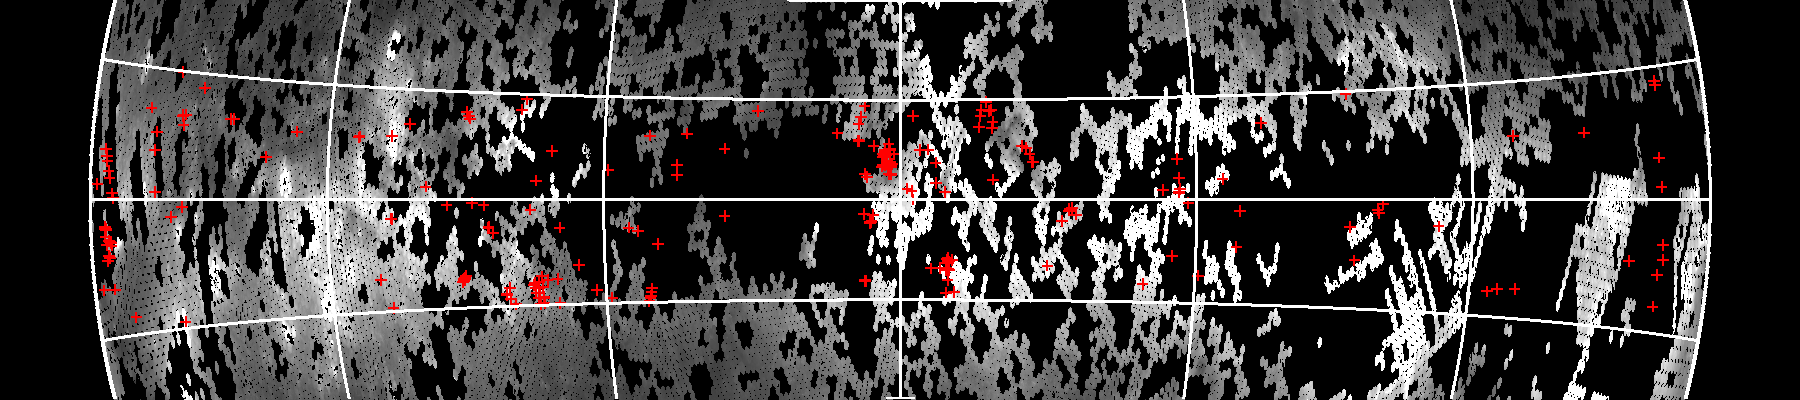
The GALEX mission was launched in 2003 and continued to take observations until 2013 (Martin et al., 2005; Morrissey et al., 2007). There were two imagers on board: the far ultraviolet (FUV: 1516 Å), which failed in 2007, and the near ultraviolet (NUV: 2316 Å). Observations of the Galactic plane were barred for much of the mission under the mistaken belief that the diffuse radiation was intense, as would have predicted from a cosecant law (Murthy et al., 2010), and only started near the end of the mission. Each GALEX observation is an image of a field in the sky with a spatial resolution of 5″. The typical observation length was 100 seconds but could be much longer in a few fields. Murthy (2014) used the original GALEX data, removed the stars, subtracted the foreground airglow and zodiacal light (Murthy, 2014), and binned the data to produce a map of the diffuse radiation over the entire sky with a bin size of 6′. We have extracted the FUV and NUV observations within of the plane from these data (Fig. 4.
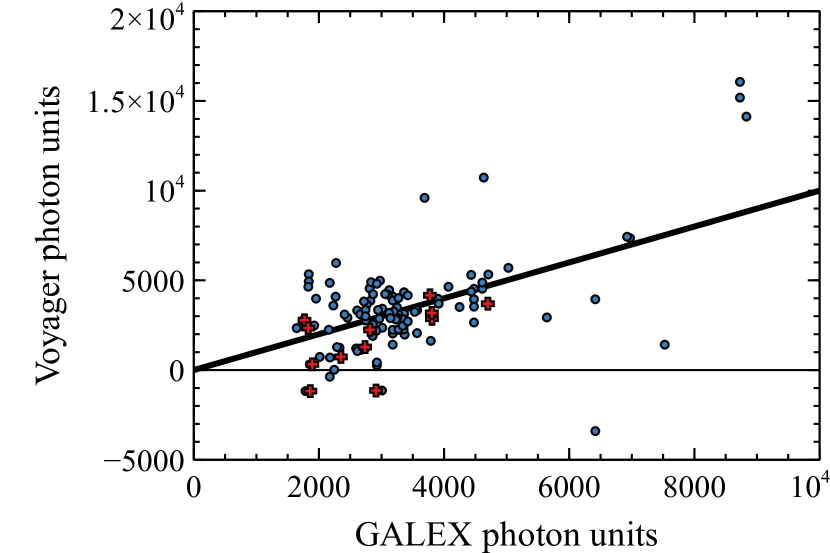
As discussed above, the Galactic plane was only observed near the end of the GALEX mission and only 125 of the Voyager targets are covered by NUV observations with 19 covered by FUV observations. There is a reasonable correlation between the Voyager DGL observations at 1100 Å and the GALEX FUV and NUV observations (Fig. 5), with the outliers already discussed (Table 2).
3 Modeling & Analysis
Murthy (2015, 2016) developed a Monte Carlo model in which they used:
-
•
The stellar positions, spectral types, magnitudes and positions from the Hipparcos catalog (Perryman et al., 1997).
-
•
Stellar spectra from Castelli & Kurucz (2004).
-
•
A 3-dimensional dust model using dust maps from Schlegel et al. (1998) with an exponential drop off from the Galactic plane.
-
•
A scattering phase function from Henyey & Greenstein (1941) with the albedo () and phase function asymmetry factor () as free parameters.
This model tracked the observed emission well at high Galactic latitudes but did increasingly poorly at lower latitudes as the dust column density increased. The dust cross-section at 100 µm is much less than that in the UV and the 100 µm emission from the Infrared Astronomy Satellite (IRAS: Neugebauer et al. (1984)) samples a much longer line of sight than would be the case in the UV where the DGL comes primarily from dust within a few hundred parsecs of the Sun (Murthy, 2016). We have therefore replaced the 2-dimensional dust map from Schlegel et al. (1998) with the 3-d map of Green et al. (2015), as described by Akshaya et al. (2019).
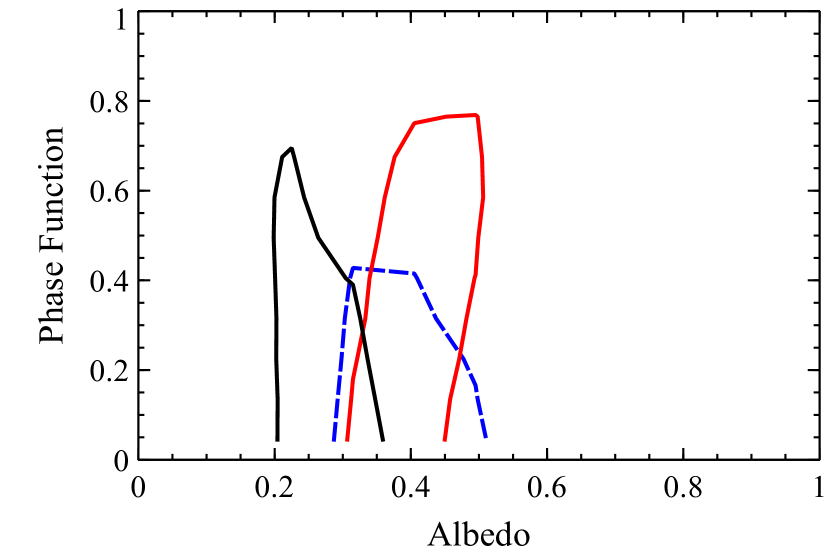
| Wavelength (Å) | Albedo () | Phase Function () |
|---|---|---|
| 1100 | 0.2 – 0.3 | |
| 1500 | 0.2 – 0.5 | |
| 2300 | 0.4 – 0.6 |
We have fit our observations with our models at 1100, 1500, and 2300 Å as a function of the optical constants ( and ) and have drawn pseudo-confidence contours in Fig. 6 to find limits on the optical constants (Table 3). Our models are time consuming and we have only run them over a limited grid of optical parameters with a spacing of 0.1 on both and . Nevertheless, we find limits that are consistent with others (Draine, 2003; Akshaya et al., 2018).
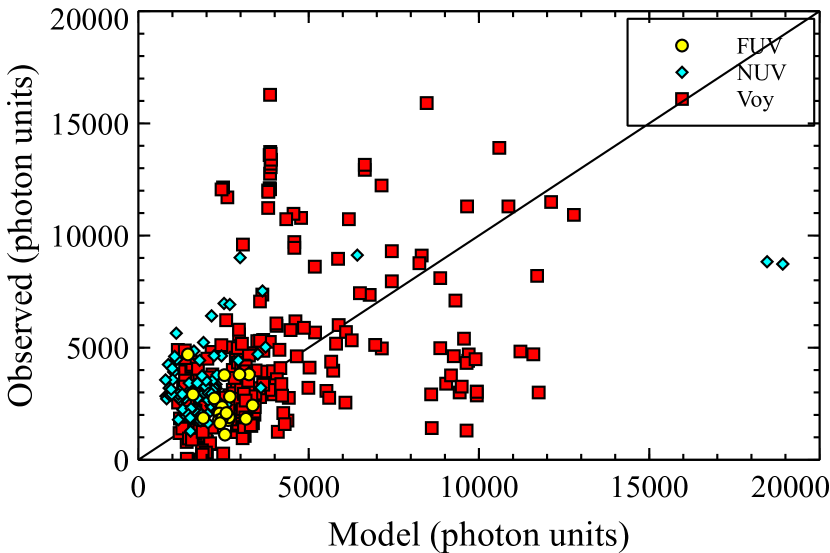
The observations have been plotted against the models (; ) for each of the three bands in Fig. 7. We find that the models are a reasonable fit to the data in most cases with some notable deviations. There are several reasons why this could arise. Perhaps the most critical is that the DGL in the UV is dependent on local effects (Murthy & Sahnow, 2004) and we will have to model each direction individually. We also plan to explore the parameter space with a better appreciation of the errors in both the modeling and the data and a finer grid in the optical parameters.
4 Conclusions
We have used archival observations from Voyager and GALEX to study the DGL near the Galactic plane. Although there are a few particularly bright regions for which we have no explanation, most of the observations are a few thousand photon units from 1100 Å to 2300 Å. We will examine the bright regions further in a future work but expect that it will be difficult to find a plausible explanation without further observations.
We have compared a model for dust scattering in the Galaxy (Murthy, 2016) to the observations finding a reasonable fit but with several outliers. These are perhaps because of local effects which we will explore in a future work. We find an albedo of 0.2 – 0.3 and at 1100 Å; 0.2 – 0.5 and at !500 Å; and 0.4 – 0.6 at 2300 Å. We plan now to examine individual regions in more detail to understand the distribution of dust in those directions and, perhaps, changes in the optical constants, if any.
Acknowledgements
We have used the Gnu Data Language (http://gnudatalanguage.sourceforge.net/index.php) for the analysis of these data. The data presented in this paper were obtained from the Mikulski Archive for Space Telescopes (MAST). STScI is operated by the Association of Universities for research in Astronomy, Inc., under the NASA contract NAS5-26555. Support for MAST for non-HST data is provided by the NASA Office of Space Science via grant NNX09AF08G and by other grants and contracts. This work has been done while under work-at-home rules and we thank all those who have made it possible for us to do so.
References
- Akshaya et al. (2018) Akshaya M. S., Murthy J., Ravichandran S., Henry R. C., Overduin J., 2018, ApJ, 858, 101
- Akshaya et al. (2019) Akshaya M. S., Murthy J., Ravichandran S., Henry R. C., Overduin J., 2019, MNRAS, p. 2102
- Broadfoot et al. (1977) Broadfoot A. L., et al., 1977, Space Science Reviews, 21, 183
- Castelli & Kurucz (2004) Castelli F., Kurucz R. L., 2004, ArXiv Astrophysics e-prints,
- Draine (2003) Draine B. T., 2003, ARA&A, 41, 241
- Green et al. (2015) Green G. M., et al., 2015, ApJ, 810, 25
- Henyey & Greenstein (1941) Henyey L. G., Greenstein J. L., 1941, ApJ, 93, 70
- Martin et al. (2005) Martin D. C., et al., 2005, ApJ, 619, L1
- Morrissey et al. (2007) Morrissey P., et al., 2007, ApJS, 173, 682
- Murthy (2014) Murthy J., 2014, Ap&SS, 349, 165
- Murthy (2015) Murthy J., 2015, DiffuseModel: Modeling the diffuse ultraviolet background, Astrophysics Source Code Library (ascl:1512.012)
- Murthy (2016) Murthy J., 2016, MNRAS, 459, 1710
- Murthy & Sahnow (2004) Murthy J., Sahnow D. J., 2004, ApJ, 615, 315
- Murthy et al. (1994) Murthy J., Henry R. C., Holberg J. B., 1994, ApJ, 428, 233
- Murthy et al. (1999) Murthy J., Hall D., Earl M., Henry R. C., Holberg J. B., 1999, ApJ, 522, 904
- Murthy et al. (2010) Murthy J., Henry R. C., Sujatha N. V., 2010, ApJ, 724, 1389
- Murthy et al. (2012) Murthy J., Conn Henry R., Holberg J. B., 2012, ApJS, 199, 11
- Neugebauer et al. (1984) Neugebauer G., et al., 1984, ApJ, 278, L1
- Perryman et al. (1997) Perryman M. A. C., et al., 1997, A&A, 323
- Schlegel et al. (1998) Schlegel D. J., Finkbeiner D. P., Davis M., 1998, ApJ, 500, 525
Appendix A Some extra material
If you want to present additional material which would interrupt the flow of the main paper, it can be placed in an Appendix which appears after the list of references.