Strong Near-Infrared Spectral Variability of the Young Cloudy L Dwarf Companion VHS J1256–1257 b
Abstract
Rotationally-modulated variability of brown dwarfs and giant planets provides unique information about their
surface brightness inhomogeneities, atmospheric circulation, cloud evolution,
vertical atmospheric structure, and rotational angular momentum.
We report results from Hubble Space Telescope/Wide Field Camera 3
near-infrared time-series spectroscopic observations of three companions with masses
in or near the planetary regime:
VHS J125601.92–125723.9 b, GSC 6214–210 B, and ROXs 42 B b.
VHS J1256–1257 b exhibits strong total intensity and spectral variability
with a brightness difference of 19.3% between 1.1–1.7 m over 8.5 hours
and even higher variability at the 24.7% level at 1.27 m.
The light curve of VHS J1256–1257 b continues to rise at the end of the observing sequence so these
values represent lower limits on the full variability amplitude at this epoch.
This observed variability rivals (and may surpass) the most variable brown dwarf currently known,
2MASS J21392676+0220226.
The implied rotation period of VHS J1256–1257 b is 21–24 hr assuming sinusoidal modulations,
which is unusually long for substellar objects.
No significant variability is evident
in the light curves of GSC 6214–210 B (1.2%) and ROXs 42 B b (15.6%).
With a spectral type of L7, an especially red spectrum, and a young age,
VHS J1256–1257 b reinforces emerging patterns between high variability amplitude,
low surface gravity, and evolutionary phase near the L/T transition.
1 Introduction
Time series photometry and spectroscopy of brown dwarfs has opened up a new window into the physical properties and atmospheric structure of substellar objects. Over the past decade, high precision infrared monitoring programs have demonstrated that most brown dwarfs are variable at the 0.2–5% level between 1 to 5 m, especially those spanning the L and T spectral classes between 500–2500 K (e.g., Artigau et al. 2009; Apai et al. 2013; Radigan et al. 2014; Metchev et al. 2015). There is now abundant evidence that the primary source of this variability is from rotationally-modulated surface features in the form of evolving heterogeneous condensate clouds (e.g., Showman & Kaspi 2013; Crossfield et al. 2014), at least among low-temperature late-L and T-type brown dwarfs, analogous to Jupiter’s latitudinally banded structure where gaps in the cloud deck result in bright regions at infrared wavelengths (e.g., Antuñano et al. 2019; Ge et al. 2019). These patchy clouds produce hot and cold spots which, coupled with rotation, result in periodic disk-integrated brightness variations that evolve in amplitude, phase, and wavelength (Buenzli et al. 2012; Apai et al. 2017).
Most of these monitoring campaigns have focused on old (several Gyr) brown dwarfs in the field. Recently there has been increased interest in exploring the variability properties of both young brown dwarfs and giant planets found with high-contrast imaging to examine the influence of surface gravity on variability properties. For example, Biller et al. (2015) found that the 8 object PSO J318.5–22 exhibits strong variability at the 10% level in band. Lew et al. (2016) report that the young isolated brown dwarf WISE J0047+6803 is highly variable from 1.1–1.7 m, with peak-to-peak brightness changes as high as 8%. Variability has also been confidently observed in a growing number of companions at or below the deuterium-burning limit (13 ): 2M1207b (Zhou et al. 2016), Ross 458 C (Manjavacas et al. 2019), HD 203030 B (Miles-Paez et al. 2019), HN Peg B (Zhou et al. 2018), 2M0122–2439 b (Zhou et al. 2019), and GU Psc b (Naud et al. 2017; Lew et al. 2019).
Several statistical patterns are emerging from variability surveys of substellar objects. There is evidence that low-gravity brown dwarfs have higher variability amplitudes compared to their higher-gravity counterparts (Metchev et al. 2015). Vos et al. (2018) found that young L dwarfs have higher intrinsic rates of variability compared to field brown dwarfs with 98% confidence, an indication that low surface gravity plays an important role in shaping the spatial distribution and physical properties of condensate clouds. Viewing geometry also appears to impact these observational signatures; brightness changes are most strongly attenuated for brown dwarfs observed at low inclinations (closer to pole-on orientations; Vos et al. 2017).
Extending variability studies to directly imaged exoplanets is challenging because of their high contrasts and close separations. Over the past decade, a steadily growing population of giant planets located at unexpectedly wide separations of tens to hundreds of AU from their host stars has been identified. Their relatively wide separations (100 AU) and modest contrasts (10 mag) make them amenable to detailed photometric and spectroscopic observations. Here we present a Hubble Space Telescope () program to obtain time-series spectroscopic light curves of the three low-mass companions VHS J125601.92–125723.9 b (herinafter VHS J1256–1257 b), GSC 6214–210 B, and ROXs 42 B b. Our Wide-Field Camera 3 (WFC3) G141 grism observations span 1.1–1.7 m, enabling simultaneous monitoring at band, band, and over the 1.4 m water feature. None of these companions have previously been monitored for variability.
VHS J1256–1257 b is an unusually red L7 companion orbiting a young binary brown dwarf at 81 (Gauza et al. 2015; Stone et al. 2016). Depending on the system’s age and distance, which remain poorly constrained, the companion’s luminosity implies a lower mass limit between 11–26 (Rich et al. 2016). The -band spectrum of VHS J1256–1257 b from Miles et al. (2018) shows signs of weak methane absorption and thick photospheric clouds. GSC 6214–210 B is an M9.5 companion with a mass of 14 orbiting at 22 (240 AU) from its young (17 Myr) Sun-like host star (Ireland et al. 2011; Bowler et al. 2014; Pearce et al. 2019). ROXs 42 B b has a mass of 10 and a near-infrared spectral type of L1 (Kraus et al. 2014; Currie et al. 2014; Bowler et al. 2014). It is the most challenging target in our sample to observe with because of its close angular separation to its host star (12, or 140 AU). All three companions have rotational broadening measurements from high-resolution near-infrared spectroscopy (Bryan et al. 2018).
This paper is organized as follows. In Section 2 we describe the observations, spectral extraction, and corrections for detector ramp effects. In Section 3 we discuss the companion light curves and interpretation of variability observed in VHS J1256–1257 b. Our observations and results are summarized in Section 4.
2 Observations
Time-series spectroscopic monitoring was carried out with HST’s WFC3/IR camera with the near-infrared grism (=1.1–1.7 m; /130) on UT 2018 March 5–6, UT 2018 March 14–15, and UT 2018 June 14 for VHS J1256–1257 b, ROXs 42 B b, and GSC 6214–210 B, respectively (HST Proposal GO-15197). The spectral grasp of our observations samples a range of atmospheric pressure levels and prominent molecular absorption features, most notably the water feature centered at 1.4 m and methane beyond 1.6 m. Our program was designed to span 8.5 hr over six contiguous orbits for each target with unobservable gaps of about 45 min during each orbit. Observations were carried out in nominal stare mode with the telescope roll angle constraints oriented so that the grism dispersion direction was approximately orthogonal to the star-planet position angle.
At the start of each orbit, several direct images were taken in the filter to determine the location of the companion and to calibrate the wavelength solution. The 256256 subarray (30′′30′′ field of view) was read out to reduce buffer dumps and improve readout time efficiency. Exposure times and number of non-destructive reads were chosen to avoid saturating the host star at the location of the companion and to ensure adequate signal-to-noise ratio of the companion spectrum. No dithering was carried out to mitigate flat fielding errors.
We acquired 11 grism images of VHS J1256–1257 b per orbit for a total of 66 frames, each with an exposure time of 224 s and a SPARS25, NSAMP = 11 readout sequence. For ROXs 42 B b, 21 grism images were taken for the first orbit followed by 22 for orbits 2–6, totaling 131 images altogether. The integration time was 103 s per image and the SPARS10, NSAMP = 15 sequence was chosen. 137 grism images were obtained for GSC 6214–210 B: 22 were acquired in orbit 1 followed by 23 frames during orbits 2–6. Each had an integration time of 103 s with SPARS10, NSAMP = 15.
2.1 Data Reduction
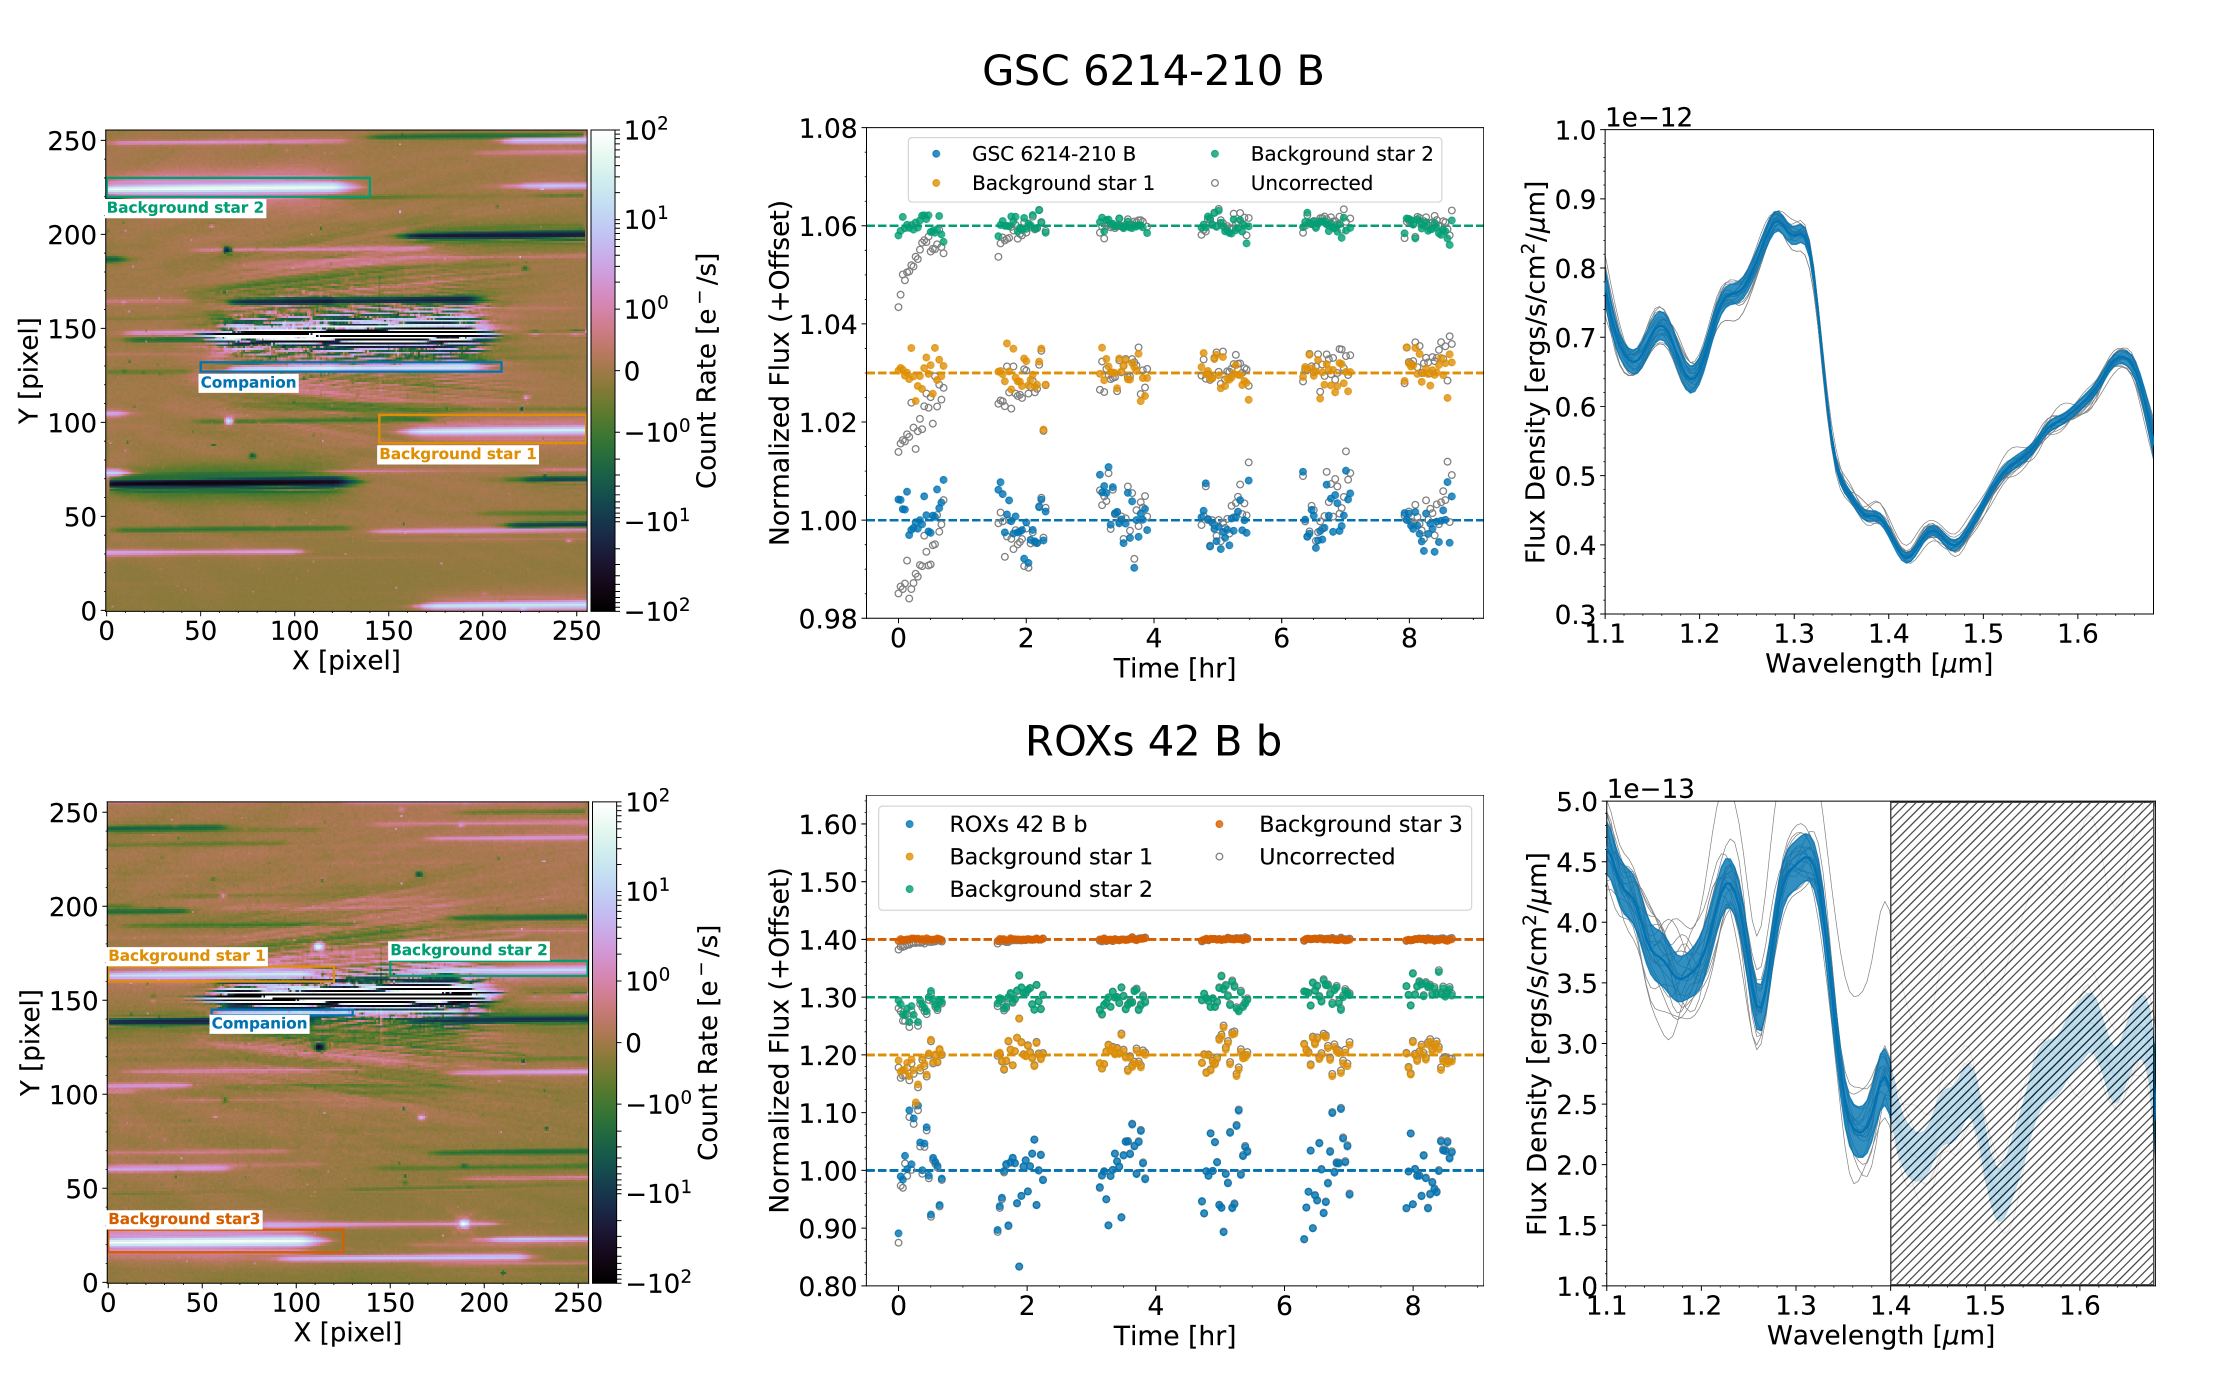
We adopt different strategies to extract the grism spectra of our three targets. For VHS J1256–1257 b, the contamination from the host star spectral trace at the location of the companion (a separation of 57.7 pixels) is negligible: the average flux level at the location of VHS J1256–1257 b is about 0.23 e- s-1 pixel-1, which is less than 20% of the average sky background. We therefore do not carry out point spread function (PSF) subtraction for this system. For the other two targets, the contamination from their host stars is much more significant and requires PSF subtraction in the dispersion direction to recover the companions. Below we describe details of the data reduction and spectral extraction procedure for each system in this program.
2.1.1 VHS J1256–1257 b
Basic image reduction is carried out with STScI’s calwfc3 pipeline, which performs bias correction, linearity correction, dark subtraction, unit/gain conversion, and cosmic ray identification with up-the-ramp fitting. We extract individual spectra from the flt images with our custom WFC3/IR time-resolved spectroscopic pipeline, which makes use of the aXe slitless spectral extraction package (Kümmel et al. 2009) and has been employed in multiple studies to measure rotational modulations of brown dwarfs (e.g., Buenzli et al. 2012; Apai et al. 2013; Buenzli et al. 2014; Zhou et al. 2018). As part of this pipeline, we first expand the subarray to the full-array images so that they are compatible with aXe. We then identify bad pixels with data quality flag 4 (indicating a bad detector pixel), 16 (hot pixel), 32 (unstable response), and 256 (full-well saturation) and correct them with bi-linear interpolation. We also search and correct for pixels that are affected by cosmic rays but not corrected by the up-the-ramp fit. These pixels are identified by comparing the time sequence of each individual pixel to its median-filtered light curve (in a window size of 5 pixels) and select outliers. These pixels are then corrected through bi-linear interpolation with adjacent unaffected pixels. We develop and implement our own sky subtraction routine following Brammer et al. (2015) to incorporate and optimize recently-updated multi-component WFC3 master sky images, and thus run the axeprep task with the “background” option turned off. Then the axecore task is executed with a 4-pixel radius window to extract spectra.
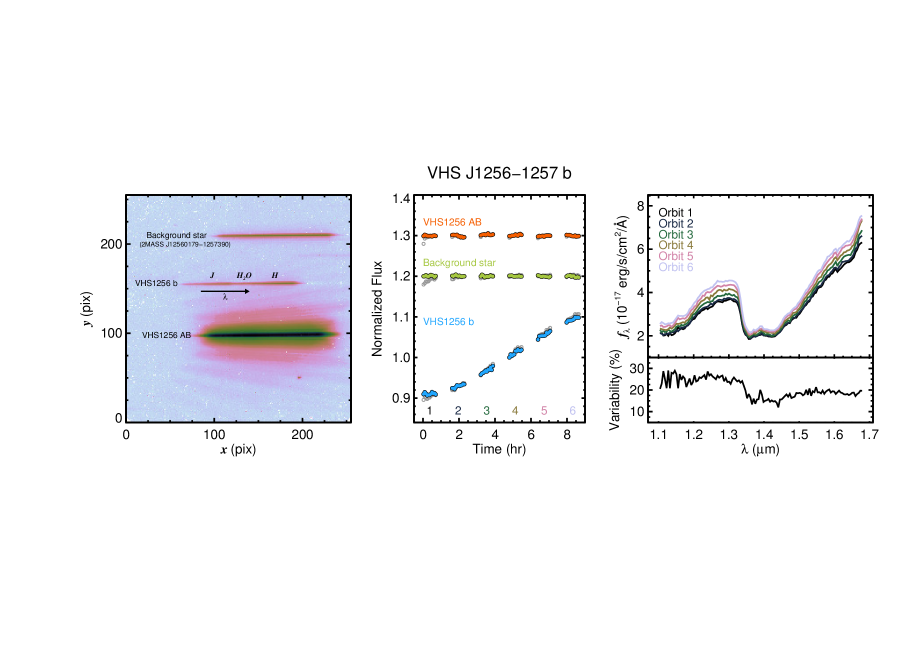
For the VHS J1256–1257 b sequence, three spectra of VHS J1256–1257 b, the host VHS J1256–1257 AB (which is unresolved here), and the background star 2MASS J12560179–1257390 are extracted from each grism image (Figure 1). This results three spectroscopic light curves in units of both count rate (e- s-1) and flux density (erg s-1 cm-2 m-1), as well as their corresponding measurement uncertainties. We then remove the “ramp-effect” systematics in the light curves (e.g., Berta et al. 2012). Here we use the Ramp Effect Charge Trapping Eliminator (RECTE; Zhou et al. 2017) tool to model and correct these systematics. RECTE estimates the “ramp-effect” profile by assuming the systematics are introduced by charge trapping and delayed release due to detector defects. We adopt a set of pre-determined parameters that describe the charge trap numbers, efficiency, and trapping timescales. The remaining parameter that primarily determines the systematic profile is the pixel illumination level. We input the median-combined images to the RECTE model and calculate the ramp profile for each pixel, then sum the profiles of the same image columns to identify the correction term for each wavelength. Our final spectroscopic light curves are obtained by dividing the correction term from the raw extracted spectra.
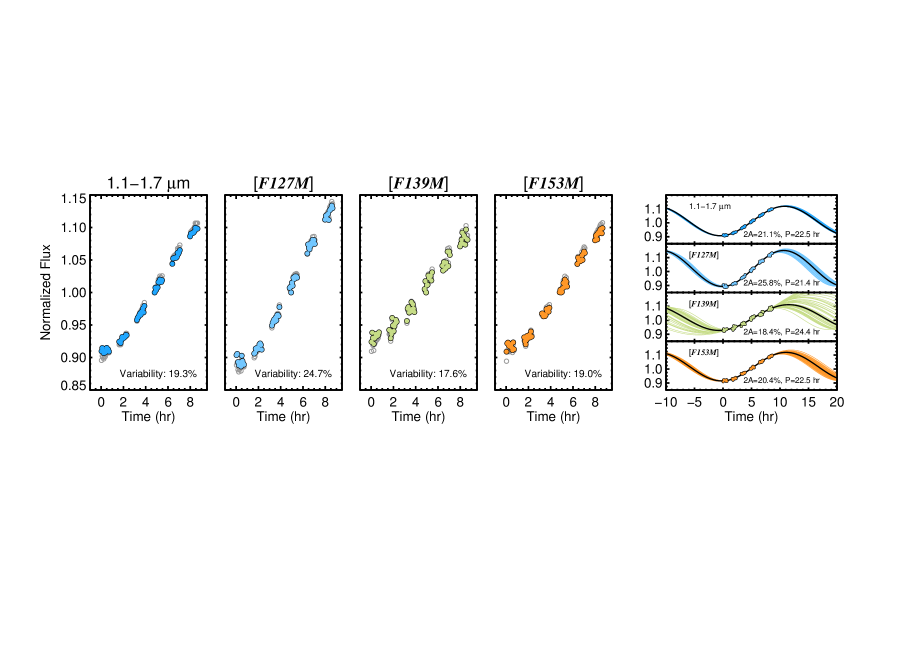
Light curves of VHS J1256–1257 b, the host binary, and the background star are measured by integrating the spectra in the wavelength dimension. Four light curves are produced for each object: a broadband curve spanning 1.10–1.68 m where the grism throughput is above 30%, as well as time series photometry synthesized in the bandpass, bandpass, and bandpass (Figure 2). The synthesized light curves are measured by convolving each spectrum with transmission curves and then integrating the result. Note that the red cutoff of the grism truncates the traditional MKO bandpass by about 0.1 m, so we chose to use medium-band HST filters instead of standard near-infrared filters.
2.1.2 GSC 6214–210 B and ROXs 42 B b
GSC 6214–210 B and ROXs 42 B b are both embedded in the PSF wings of their host stars in the grism images. For these observations, our strategy is to subtract the spectral PSF of the primary star in the dispersion direction before spectral extraction. By assuming the spectral trace is symmetric with respect to the central axis, we mirror the image about this axis and subtract it individually from each science frame (Figure 3). Because the spectral trace is tilted by with respect to the image -axis, the mirrored image is first rotated to match the original primary spectral PSF. To optimize the subtraction, we set the template scaling parameter and the tilt angle as free parameters and fit them to minimize the rms subtraction residuals surrounding the companion spectral traces. Following PSF subtraction, the steps to extract the spectra and correct the light curves for these companions and several nearby background stars in the images are identical to the procedure for VHS J1256–1257 b.
3 Results and Discussion
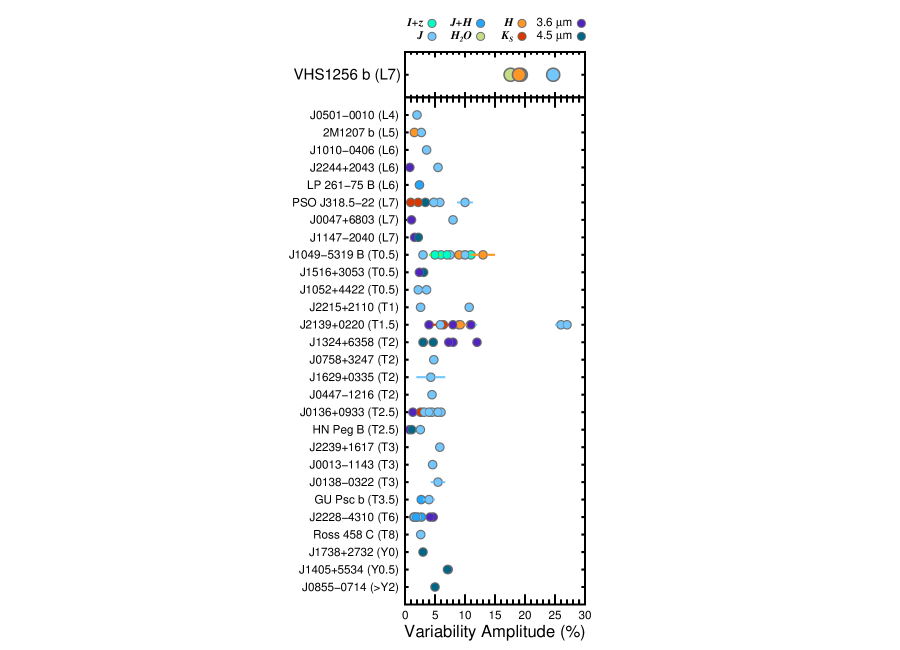
No variability is observed in the observations of GSC 6214-210 B and ROXs 42 B b, but significant evolution is readily apparent for VHS J1256–1257 b. The brightness difference for VHS J1256–1257 b is unusually large compared to the 28 strong variables with measured amplitudes greater than 2% (Figure 4). Metchev et al. (2015) found that most brown dwarfs exhibit low-amplitude variability (0.2–2%), but strong variability at the 2–10% level is rarer, especially outside the L/T transition (Radigan 2014; Eriksson et al. 2019). Only five brown dwarfs are known to exhibit exceptionally high-amplitude variability above the 10% level (see Eriksson et al. 2019 for a recent compilation): PSO J318.5–22 (L7; Biller et al. 2018; Vos et al. 2018), WISE J104915.57–531906.1 B (T0.5; Gillon et al. 2013; Biller et al. 2013; Buenzli et al. 2015) 2MASS J22153705+2110554 (T1; Eriksson et al. 2019), 2MASS J13243553+6358281 (T2; Yang et al. 2016), and 2MASS J21392676+0220226 (T1.5; e.g., Radigan et al. 2012). The brightness difference of 24.7% we measure in the synthesized F127M filter for VHS J1256–1257 b is the second-highest after 2MASS J21392676+0220226, which exhibits exceptionally strong variability up to 27% in band (Apai et al. 2013). Among these six strong variables (amplitudes 10%), all have spectral types between L7 and T2 and three show spectroscopic and/or kinematic evidence of youth (VHS J1256–1257 b, PSO J318.5–22, and 2MASS J13243553+6358281). These same three objects have masses near or within the planetary regime, supporting trends of high amplitude modulation and low surface gravity found by Metchev et al. (2015) and Vos et al. (2018).
The large brightness changes from VHS J1256–1257 b exhibit inflection points midway through the observations (Figure 2) which resemble sinusoidal modulations commonly observed among brown dwarfs and planetary-mass objects. To estimate the rotation period and total variability amplitude, we fit the normalized broad-band light curve and synthesized light curves for individual bands assuming a sinusoidal model as follows: = + .111We tested both linear and sinusoidal relations to model the curves and calculated Bayesian Information Criterion (BIC) values, where BIC = + ln. Here is the number of free parameters in the fit and is the number of data points (66). The BIC between the two models is 1133 for the broadband light curve, indicating a very strong preference for the sine model. Here is the normalized flux, is a constant offset, is the semi-amplitude, is the period, and is a phase offset. Parameter posterior distributions are sampled using Markov Chain Monte Carlo with a Metropolis-Hastings algorithm. Step sizes for trial values are chosen so that acceptance rates are between 20–30%. A uniform prior was adopted in (from 0–2), (from 0–2), (from 0–100 hours), and (from 0–2).
Results of the sinusoidal fits are shown in Figure 2. For the full 1.1–1.7 m light curve, we infer a rotation period of 22.5 hr and a peak-to-peak amplitude of 21.1%. The value of the best-fit curve is 126.1, the BIC value is 142.9, and the reduced value (=/(–)) is 2.0. Here =4 and =66. The synthetic photometry for individual bands implies similar periods but significant wavelength-dependent amplitude differences. We find a period of 21.4 hr and a peak-to-peak amplitude of 25.8% for (=65.1, BIC=81.9, =1.05), 24 hr and an amplitude of 18.4% for (=67.2, BIC=84.0, =1.08), and 22.5 hr and an amplitude of 20.4% for (=81.4, BIC=98.2, =1.23). The implied rotation period of 21–24 hours assumes the long-term variability is smooth and periodic. It also neglects any possible latitudinal dependence of the rotation rate, for example if the signal originates from non-equatorial features where banding or differential rotation could produce a longer variability period than at equatorial regions. These results highlight how unusual the properties of VHS J1256–1257 b are in terms of its variability amplitude, its strong chromatic modulations, and its long rotation period compared to typical values of 3–20 hr for brown dwarfs (e.g., Biller 2017). We note that this long rotation period can only be reconciled with the projected rotational velocity of 13.5 km s-1 from Bryan et al. (2018) with a large physical radius and (nearly) edge-on viewing geometry. The inferred inclination distribution of VHS J1256–1257 b is explored in more detail in a companion study (Zhou et al., submitted).
Spectroscopic observations also enable searches for wavelength-dependent phase lags, which provide information about the nature and distribution of surface features causing the brightness modulations. These light curve phase shifts have been observed in several objects, especially when comparing simultaneous near-infrared and mid-infrared light curves (e.g., Buenzli et al. 2012; Biller et al. 2018), but this phenomenon is not universal among variable brown dwarfs. We find phases of 4.73 rad, 4.89 rad, and 4.77 rad from our sinusoidal fits to the , , and light curves of VHS J1256–1257 b, respectively. The phase for the full 1.1–1.7 m region is 4.84 rad. We conclude that there is no significant evidence for distinct phase lags from these observations.
The observed variability of brown dwarfs has largely been attributed to the presence of clouds, which can produce a variety of time-dependent observable signatures. This is expected to be especially pronounced near the L-T transition as brown dwarfs cool and cloud decks sink below the photosphere at lower effective temperatures. At higher altitudes (low pressures), patchy clouds tend to produce gray modulations with little change in variability amplitude as a function of wavelength. When located at lower altitudes (higher pressures), clouds can introduce a wavelength-dependence to the variability amplitude (e.g., Buenzli et al. 2012). In this scenario, spectral regions that probe deeper into the atmosphere (such as band) will be more susceptible to variability compared to wavelengths sensitive to higher altitudes (such as the 1.4 m water band). These wavelength-dependent amplitude differences are therefore generally interpreted as signatures of mid-altitude clouds and have predominantly been observed in early T dwarfs, whereas gray (wavelength-independent) variability likely arises from high-altitude clouds and appears to be more common among mid-L dwarfs (e.g., Yang et al. 2015; Artigau 2018). VHS J1256–1257 b has a spectral type of L7 but exhibits unusually strong relative spectral variability of 5.7% between and , and even larger differences of 7.1% between and . Aside from a small increase at 1.39 m in the middle of the water band, these changes are relatively constant within each bandpass (Figure 1). In this respect VHS J1256–1257 b more closely resembles the spectral variability behavior of early T dwarfs than mid-L dwarfs.
VHS J1256–1257 b also shares similarities with the two other low-mass variable objects WISE J0047+6803 and PSO J318.5–22: all have comparable spectral types (L6–L7), extremely red near-infrared slopes (–=2.5–2.8 mag), and similar wavelength-dependent variability patterns from 1.1–1.7 m with the strongest variability at band and the weakest variability in the 1.4 m water band (Lew et al. 2016; Biller et al. 2018). However, these traits are all significantly enhanced in VHS J1256–1257 b, which may be a result of thinner high-altitude clouds or distinct dust properties compared to the other two objects.
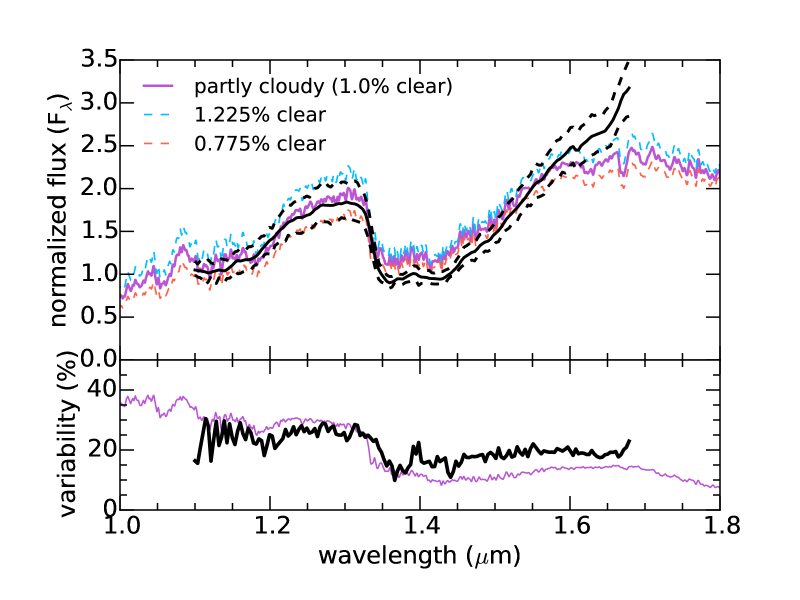
To provide physical insight into the observed variability, partly cloudy model spectra were generated following the methodology presented in Marley et al. (2010) and Morley et al. (2014). All models use =900 K and log g=4.0 and assume that the atmosphere is in chemical and radiative-convective equilibrium. A small grid of sedimentation efficiency () and cloud-free surface fraction () was considered (=0.3–2; =1–10%); very lofted clouds (=0.3) with a small cloud-free surface fraction (1%) provided the best match, as expected for this red, dusty object. After converging this partly-cloudy model, moderate resolution spectra through the cloudy and clear columns were generated. The trend and amplitude in variability can be matched by varying the cloud-covering fraction by 0.225% (from 0.775% cloud-free to 1.225% cloud-free).
The resulting model is meant to demonstrate that the overall trend—higher amplitude variability in band relative to the water band and band—and large amplitude can be matched by considering non-uniform clouds. Future work should investigate disequilibrium chemistry (a likely cause of the model–data discrepancy in band); provide detailed fits to larger grids of model spectra; and investigate different cloud treatments (e.g., thicker and thinner clouds and latitudinal banding rather than thick clouds and cloud-free regions)—particularly using two- or three-dimensional models.
3.1 Upper limits on variability for GSC 6214-210 B and ROXs 42 B b
In contrast, our light curves of GSC 6214-210 B and ROXs 42 B b appear to be flat with no evidence of significant variability. The photometric precision for these companions is limited by the PSF subtraction in the grism images. This procedure was substantially more challenging for ROXs 42 B b owing to the close separation of its host star (12). We measure rms levels of 0.4% for GSC 6214-210 B, or a 3 upper limit of 1.2%. For ROXs 42 B b we find an rms of 5.2%, or a 3 upper limit of 15.6%.
4 Summary
We have obtained HST/WFC3 near-infrared time-series spectroscopy of the three young companions VHS J1256–1257 b, GSC 6214–210 B, and ROXs 42 B b all of which have masses at or near the deuterium-burning boundary. Results from this program are summarized below:
-
1.
Our 8.5 hr observations show strong brightness changes in VHS J1256–1257 b at the level of 19.3% across the full 1.1–1.68 m region. For the synthesized bandpasses we find 24.7% variability in , 17.6% variability in , and 19.0% variability in . These are the highest variability measurements of any substellar object after the T1.5 brown dwarf 2MASS J21392676+0220226. The evolving light curve of VHS J1256–1257 b was still rising at the end of the observations, implying the full variability amplitude is likely to be even larger at this epoch.
-
2.
We interpret these substantial wavelength-dependent variability amplitudes as evidence for mid-altitude cloud decks, similar to (but much stronger than) the other young red L dwarfs WISE J0047+6803 and PSO J318.5–22. The spectral shape, large-amplitude brightness modulations, and wavelength-dependent variability can be reproduced with atmospheric models comprising a 1% clear surface coupled with 0.225% changes in cloud-covering fraction.
-
3.
Sinusoidal fits to the light curves of VHS J1256–1257 b imply rotation periods between 21–24 hr for the full 1.1–1.68 m spectral region and individual synthesized bands. We find no evidence of phase shifts from these observations, although only about 30–40% of a single rotation period appears to have been sampled.
-
4.
No variability is observed from GSC 6214–210 B or ROXs 42 B b at the 1.2% and 15.6% levels (3 upper limits), respectively. These precisions are limited by the close separations of these companions to their host stars (12–22).
The large separation of VHS J1256–1257 b from its host star (81) makes it an excellent target for follow-up observations spanning longer time baselines, broader wavelength coverage, and higher spectral resolution. The high near-infrared amplitude for this object also means that it especially amenable to ground-based photometric monitoring. Altogether these results for VHS J1256–1257 b suggest that other young planetary-mass companions at the L/T transition like HR 8799 bcde, HD 95086 b, HIP 65426 b, and 2MASS J22362452+4751425 b are promising companions to search for variability.
References
- Antuñano et al. (2019) Antuñano, A., Fletcher, L. N., Orton, G. S., et al. 2019, arXiv, 130
- Apai et al. (2013) Apai, D., Radigan, J., Buenzli, E., et al. 2013, 768, 121
- Apai et al. (2017) Apai, D., Karalidi, T., Marley, M. S., et al. 2017, Science, 357, 683
- Artigau (2018) Artigau, E. 2018, in Handbook of Exoplanets (Cham: Springer International Publishing), 1–19
- Artigau et al. (2009) Artigau, É., Bouchard, S., Doyon, R., & Lafrenière, D. 2009, The Astrophysical Journal, 701, 1534
- Berta et al. (2012) Berta, Z. K., Charbonneau, D., Désert, J.-M., et al. 2012, The Astrophysical Journal, 747, 35
- Biller (2017) Biller, B. 2017, Astronomical Review, 1
- Biller et al. (2013) Biller, B. A., Crossfield, I. J. M., Mancini, L., et al. 2013, The Astrophysical Journal, 778, L10
- Biller et al. (2015) Biller, B. A., Liu, M. C., Rice, K., et al. 2015, Monthly Notices RAS, 450, 4446
- Biller et al. (2018) Biller, B. A., Vos, J., Buenzli, E., et al. 2018, The Astronomical Journal, 155, 0
- Bowler et al. (2014) Bowler, B. P., Liu, M. C., Kraus, A. L., & Mann, A. W. 2014, 784, 65
- Brammer et al. (2015) Brammer, G., Ryan, R., & Pirzkal, N. 2015, Source-dependent master sky images for the WFC3/IR grisms, Space Telescope WFC Instrument Science Report
- Bryan et al. (2018) Bryan, M. L., Benneke, B., Knutson, H. A., Batygin, K., & Bowler, B. P. 2018, Nature Publishing Group, 128, 63
- Buenzli et al. (2014) Buenzli, E., Apai, D., Radigan, J., Reid, I. N., & Flateau, D. 2014, 782, 77
- Buenzli et al. (2015) Buenzli, E., Saumon, D., Marley, M. S., et al. 2015, 798, 127
- Buenzli et al. (2012) Buenzli, E., Apai, D., Morley, C. V., et al. 2012, The Astrophysical Journal, 760, L31
- Crossfield et al. (2014) Crossfield, I. J. M., Biller, B., Schlieder, J. E., et al. 2014, Nature, 505, 654
- Currie et al. (2014) Currie, T., Daemgen, S., Debes, J., et al. 2014, The Astrophysical Journal, 780, L30
- Eriksson et al. (2019) Eriksson, S. C., Janson, M., & Calissendorff, P. 2019, arXiv, A145
- Gauza et al. (2015) Gauza, B., Bejar, V. J. S., Pérez-Garrido, A., et al. 2015, The Astrophysical Journal, 804, 96
- Ge et al. (2019) Ge, H., Zhang, X., Fletcher, L. N., et al. 2019, The Astronomical Journal, 157, 0
- Gillon et al. (2013) Gillon, M., Triaud, A. H. M. J., Jehin, E., et al. 2013, ApJ, astro-ph.SR
- Ireland et al. (2011) Ireland, M. J., Kraus, A., Martinache, F., Law, N., & Hillenbrand, L. A. 2011, The Astrophysical Journal, 726, 113
- Kraus et al. (2014) Kraus, A. L., Ireland, M. J., Cieza, L. A., et al. 2014, 781, 20
- Kümmel et al. (2009) Kümmel, M., Walsh, J. R., the, N. P. P. o., & 2009. 2009, PASP, 121, 59
- Lew et al. (2016) Lew, B. W. P., Apai, D., Zhou, Y., et al. 2016, The Astrophysical Journal Letters, 829, 1
- Lew et al. (2019) —. 2019, arXiv, arXiv:1912.02812
- Manjavacas et al. (2017) Manjavacas, E., Apai, D., Zhou, Y., et al. 2017, The Astronomical Journal, 155, 0
- Manjavacas et al. (2019) Manjavacas, E., Apai, D., Lew, B. W. P., et al. 2019, arXiv, L15
- Marley et al. (2010) Marley, M. S., Saumon, D., & Goldblatt, C. 2010, The Astrophysical Journal, 723, L117
- Metchev et al. (2015) Metchev, S. A., Heinze, A., Apai, D., et al. 2015, 799, 154
- Miles et al. (2018) Miles, B. E., Skemer, A. J., Barman, T. S., Allers, K. N., & Stone, J. M. 2018, arXiv, 18
- Miles-Paez et al. (2019) Miles-Paez, P. A., Metchev, S., Apai, D., et al. 2019, arXiv, 181
- Morley et al. (2014) Morley, C. V., Marley, M. S., Fortney, J. J., & Lupu, R. 2014, ApJL, 789, L14
- Naud et al. (2017) Naud, M.-E., Artigau, E., Rowe, J. F., et al. 2017, The Astronomical Journal, 154, 0
- Pearce et al. (2019) Pearce, L. A., Kraus, A. L., Dupuy, T. J., et al. 2019, The Astronomical Journal, 157, 0
- Radigan (2014) Radigan, J. 2014, The Astrophysical Journal, 797, 120
- Radigan et al. (2012) Radigan, J., Jayawardhana, R., Lafrenière, D., et al. 2012, The Astrophysical Journal, 750, 105
- Radigan et al. (2014) Radigan, J., LaFreniere, D., Jayawardhana, R., & Artigau, E. 2014, 793, 75
- Rich et al. (2016) Rich, E. A., Currie, T., Wisniewski, J. P., et al. 2016, The Astrophysical Journal, 830, 1
- Showman & Kaspi (2013) Showman, A. P., & Kaspi, Y. 2013, 776, 85
- Stone et al. (2016) Stone, J. M., Skemer, A. J., Kratter, K. M., et al. 2016, The Astrophysical Journal Letters, 818, 1
- Vos et al. (2017) Vos, J. M., Allers, K. N., & Biller, B. A. 2017, 842, 0
- Vos et al. (2018) Vos, J. M., Biller, B. A., Bonavita, M., et al. 2018, arXiv, 480
- Yang et al. (2015) Yang, H., Apai, D., Marley, M. S., et al. 2015, The Astrophysical Journal Letters, 798, L13
- Yang et al. (2016) —. 2016, The Astrophysical Journal, 826, 1
- Zhou et al. (2017) Zhou, Y., Apai, D., Lew, B. W. P., & Schneider, G. 2017, The Astronomical Journal, 153, 0
- Zhou et al. (2016) Zhou, Y., Apai, D., Schneider, G. H., Marley, M. S., & Showman, A. P. 2016, 818, 1
- Zhou et al. (2018) Zhou, Y., Apai, D., Metchev, S., et al. 2018, The Astronomical Journal, 155, 0
- Zhou et al. (2019) Zhou, Y., Apai, D., Lew, B. W. P., et al. 2019, The Astronomical Journal, 157, 0