Restoration of azimuthal symmetry of muon densities in extended air showers
Abstract
At ground level, the azimuthal distribution of muons in inclined Extensive Air Showers (EAS) is asymmetric, mainly due to geometric effects. Several EAS observables sensitive to the primary particle mass, are constructed after mapping the density of secondary particles from the ground plane to the shower plane (perpendicular to the shower axis). A simple orthogonal projection of the muon coordinates onto this plane distorts the azimuthal symmetry in the shower plane. Using CORSIKA simulations, we correct for this distortion by projecting each muon onto the normal plane following its incoming direction, taking also into account the attenuation probability. We show that besides restoring the azimuthal symmetry of muons density around the shower axis, the application of this procedure has a significant impact on the reconstruction of the distribution of the muon production depth and of its maximum, , which is an EAS observable sensitive to the primary particle mass. Our results qualitatively suggest that not including it in the reconstruction process of may introduce a bias in the results obtained by analyzing the actual data on the basis of Monte Carlo simulations.
I Introduction
Knowledge about the mass composition of the Ultra High Energy Cosmic Rays (UHECRs) is essential when trying to explain the origin and acceleration mechanisms of the most energetic particles in the Universe. Due to their deflection in the galactic and extragalactic magnetic fields, a precise measurement of the mass (charge) of the incoming particles is absolutely necessary to correlate their arrival directions with the possible sources from the sky, in particular for light elements. After entering the Earth’s atmosphere, the primary particles interact and produce a huge number of secondary particles. These particles further interact or decay, producing in this way the so called Extensive Air Showers (EAS). The electromagnetic longitudinal profile of the shower (the density of the charged particles as a function of the atmospheric depth) can be indirectly reconstructed using Fluorescence Detectors (FD) Abraham et al. (2010a), by collecting the UV light emitted after the excitation of the nitrogen molecules by the secondary charged particles from the EAS. The atmospheric depth where the longitudinal profile reaches its maximum, , is an important observable sensitive to the mass of the primary particle ( is related to ln ), the difference in between proton and iron induced showers at the same energy being g/cm2 Aab et al. (2014a). This is an accurate method for reconstructing the longitudinal profile of EAS, and therefore of the observable, but has the shortcoming of the low duty cycle of the FD (up to Aab et al. (2015a)). This is due to the fact that the UV light can be measured only in moonless nights in good atmospheric conditions.
The properties of the EAS were investigated using various techniques in different ground based experiments like the Pierre Auger Observatory Aab et al. (2015a), Telescope Array Abu-Zayyad et al. (2012), KASCADE Antoni et al. (2005), KASCADE-Grande Apel et al. (2010), HiRES Sokolsky (2011), AGASA Chiba et al. (1992), Yakutsk Knurenko et al. (2008). Despite huge efforts in the last decades, there are still large uncertainties in the reconstruction of the mass composition of UHECRs Aab et al. (2017a, b); Abbasi et al. (2018). First of all, this is due to the large uncertainties of the cross sections at these extreme energies ( eV), evaluated by extrapolation from lower energies accessible at LHC, in combination with the very low flux of UHECRs ( particle km-2 yr-1 at eV).
Different complementary methods were developed Rebel et al. (1995); Haeusler et al. (2002); Aab et al. (2016a, 2015b); Cazon et al. (2005, 2004) to obtain information about the primary particle mass, by making use of the signal recorded in the Surface Detectors (SD) Abu-Zayyad et al. (2012); Abraham et al. (2010b). The duty cycle of such detectors is usually , thus, the statistics of the reconstructed events would increase considerably with respect to FD results.
One of these methods consists in the reconstruction of the longitudinal profile of muon production depth (MPD) from EAS, as proposed in Cazon et al. (2005, 2004) in the context of the Pierre Auger Observatory. Using the arrival times of each muon in SDs relative to the time when the shower core reaches the ground, the heights on the shower axis where the muons were produced can be evaluated. Then, expressing the distribution of the production heights of all muons in units of atmospheric depth, the MPD longitudinal profile of the shower is obtained. The atmospheric depth where the maximum production rate of muons occurs, , proved to be sensitive to the primary mass, the values of this observable for iron induced showers being lower than the values for proton induced showers at the same energy. The comparison of the experimental values of with values obtained from simulation can also provide information useful to constrain the hadronic interaction models at highest energies Aab et al. (2014b). For example, the experimental values of measured at the Pierre Auger Observatory indicate a disagreement between data and simulations based on the EPOS hadronic interaction model at high energies Aab et al. (2014b, 2015c). It should be mentioned that in the same energy range, measurements of the mass composition based on are in good agreement with MC simulations for two hadronic interaction models (QGSJetII-04 Ostapchenko (2011) and EPOS-LHC).
Another parameter sensitive to the primary mass is the total number of muons at ground level Haungs et al. (2008); Müller et al. (2018). Its overall dependence on the primary mass and energy is given by the Matthews-Heitler model Matthews (2005).
There is a special interest in the study of very inclined showers, because in this case the electromagnetic component is much attenuated due to the long atmospheric path, thus the particle density is dominated by the muonic component. The cleaner muonic component facilitates shower analysis. Also, including highly inclined showers increases the exposure of a particular experiment. Therefore, the problem of muon density in inclined showers was discussed in many papers, sometimes with the focus on specific features. Thus, an analytical description of the muon density was proposed Ave et al. (2002) and the composition sensitivity, including the possibility of discriminating photon induced showers from particle induced showers was analyzed Ave et al. (2003). The shape of the distribution, governed by the geomagnetic field and the muon production depth distribution, was proposed as a method for mass discrimination Billoir et al. (2016). Phenomenological parameterizations fitted to detailed Monte Carlo simulations were also proposed Ave et al. (2000); Dembinski et al. (2010), and used for shower reconstruction Aab et al. (2014c). Recently, a refined analysis of the shower development, including a new electromagnetic component due to low energy hadrons, complemented by a detailed detector simulation, resulted in a generalized description of the signal size in extensive air shower detectors Ave et al. (2017).
Because the intrinsic shower properties are better described in the shower plane (also called normal plane), a procedure for mapping the coordinates of the muons observed in the detection plane onto the shower plane should be applied. The problem of mapping the particle densities onto the shower plane is of a complex nature. The purpose of this paper is restricted to the study of the effect of the procedure of mapping the muon density from the ground plane onto the shower plane on the reconstruction of the muon production depth and of the number of muons contributing to the MPD profile.
We will reconstruct the MPD profiles using muon produced on the shower core and strike the ground plane, whose corresponding coordinates into the normal plane lie in specific radial ranges. These corresponding coordinates are obtained following two approaches. In the first one we use a simple orthogonal projection from the ground plane to the normal plane, without including the differential attenuation effect. We will call this method (ort). The second projection method follows the true incoming directions of muons and takes into account the differential attenuation effect from Eq. 1. We call this method (att).
In this exploratory study, based on CORSIKA simulations Heck and Knapp (1989); Heck et al. (1998), we consider only the muonic component of the shower, which would be relevant in the case of shielded detectors or for inclined showers far from the core, after correcting for the electromagnetic background. The zenith angles are restricted to the range , the high limit being chosen to avoid the effect of geomagnetic deflection.
In Section II we describe the method applied for mapping the particle density from the ground plane to the shower plane which restores the azimuthal symmetry of the distribution of the muons around the shower axis. In Section III we evaluate the and the number of muons which contributed to the constructed MPD. These quantities are computed using two projection methods onto the normal plane (orthogonal projection and projection along the particle momentum). In Section IV we present the implication of the projection methods on the estimation of and . Section V concludes the paper.
II Restoring the azimuthal symmetry around the shower axis
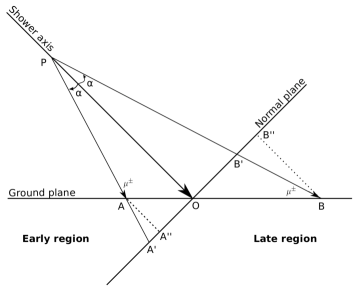
is evaluated experimentally by taking into account the muons which contribute to the MPD and whose coordinates in the plane perpendicular to the shower axis lie in a specific radial range. On the ground plane, the azimuthal distribution of muons is asymmetric for inclined showers Ave et al. (2002) - Ave et al. (2017). This asymmetry arises from the geometry of the shower axis, attenuation effects and deflections in the geomagnetic field. In the case of inclined showers with , the length of the muons’ trajectory through the geomagnetic field is not sufficient for introducing significant asymmetry, therefore our analysis is focused on geometric and attenuation effects. The particles produced below the shower axis strike the ground first, in the , while those produced above the shower axis, in the , will experience additional attenuations or decay. Suppose that two muons are produced in the point on the shower core (see Fig. 1), at the same angle relative to the shower axis, and hit the ground plane in the points and respectively. To analyze the muons from a specific radial range in the normal plane, the coordinates from the ground plane should be mapped onto the normal plane. After a simple orthogonal projection (dashed lines in Fig. 1), the point translates into and point into . One can observe that is larger than , which means that using this projection method, the density of muons as a function of the distance to the shower axis is distorted. The consequence of this distortion may be a wrong estimation of the number of muons produced in the point if, for example, a too small radial range is considered. By projecting the particles along their momentum vector ( and ) and including also the attenuation probability, the azimuthal symmetry is restored at least approximately. Therefore in this work the density in the normal plane is obtained by projecting along the muon momentum, including also differential attenuation effects Sima et al. (2011).
From now on, in this study we will refer only to the secondary muons from the EAS. The details regarding the evaluation of the attenuation probability will be given in Section II.2.
II.1 Simulations
We analyze a set of CORSIKA simulations comprising showers induced by protons and iron nuclei as primary particles, including EPOS as the hadronic interaction model at high energies Pierog and Werner (2009) and FLUKA at low energies Ferrari et al. (2005).
The simulations were done for and primary particles, at two fixed energies, and eV, at zenith angles and in the conditions of the Pierre Auger Observatory (geomagnetic field and height of the observation level). In each case showers were prepared, with random azimuth angles , thus in total showers were analyzed. In order to reduce computation time and the output size, the thinning algorithm Hillas (1997) is implemented in the CORSIKA simulation code by replacing, in certain conditions, a bunch of secondary particles of the same type, with a single particle with a weight . The thinning level is defined as , where is the energy of the primary particle which initiated the shower and represents the summed energy of the secondary particles exposed to the thinning algorithm. The required condition for activating the thinning algorithm is . In our simulations we used . The same set of showers has been used in our previous study of the muon production depth Arsene et al. (2016). Experimental uncertainties were not included in the analysis.
II.2 Evaluation of the attenuation parameter
As proposed in Sima et al. (2011), to restore the azimuthal symmetry of the lateral distribution of the secondary particles around the shower axis in the normal plane, the probability of particles to survive from the ground plane to the normal plane in the (from ), but also the attenuation from to in the (see Fig. 1) should be accounted for. Consequently, the procedure for estimating the lateral density of muons in the shower plane is the following. For a muon arriving at point in the ground plane, the point of incidence of its trajectory on the normal plane is determined. A weight factor ,
| (1) |
is assigned to this muon. In the equation is the distance along the muon trajectory between the two planes, is the differential attenuation parameter, and distinguishes between the () and the (). The density in the normal plane is evaluated by summing the weight factors of the muons with in a given domain and dividing by the area of that domain.
The role of the Eq. 1 is to ensure that muons which hit the ground level at point (early region) and don’t have enough energy to propagate to point , or are expected to decay, to be weighted by the factor which takes into account the differential attenuation and decay. In this situation the weight factor for these muons is smaller than 1. It means that around point the muon density will be smaller than the density around point . In the same way we proceed for the late region. Note that in this case the weight factors are greater than 1, which translates in a higher density around point in comparison with point .
The value of depends on the zenith angle of the primary cosmic ray, the muon momentum, and the muon position on the ground. The individual muon momentum cannot be obtained experimentally, thus we have to impose a threshold value for the muon’s momentum , and to consider in the analysis muons with . For example, the muon detection threshold in the water-Cherenkov tanks Ave et al. (2007) from the Pierre Auger Observatory is GeV/c (the threshold of the Cherenkov effect for muons in water), whereas after the upgrade with the scintillator detectors Aab et al. (2016b), different values for could be considered. In this context, it should be mentioned that a simulation study regarding the impact of the on the sensitivity of observables to the primary mass was recently done Müller et al. (2018).
We evaluate the parameter ( stands for primary or ) for each shower as follows:
-
-
each muon is projected from the ground onto the normal plane along its incoming direction;
-
-
the muons from different radial ranges m in the normal plane are separately analyzed;
-
-
in each radial range, several muon momentum thresholds and GeV/c are set;
-
-
each muon is weighted according to Eq. 1, while is varied in a specific range until the azimuthal distribution of muons becomes symmetric; this is done by performing a linear fit of the azimuthal distribution following a minimization;
-
-
finally, the set of values which best restore the azimuthal symmetry is obtained.
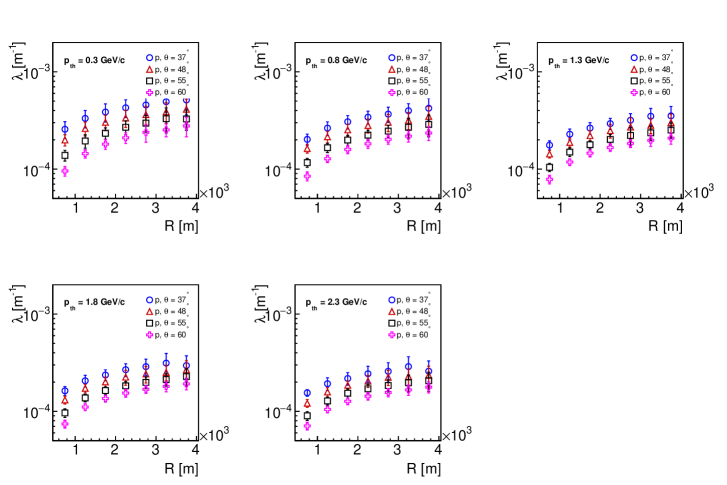
The attenuation parameter as a function of the distance to the shower axis in the normal plane for induced showers at eV, for different zenith angles and different values of is represented in Fig. 2. As can be seen, the parameter depends on the muon momentum threshold and zenith angle of the shower axis , having larger values for lower values of and . The results obtained for showers at eV, as well as for induced showers at both primary energies and eV look similar to those presented in Fig. 2. The main difference is given by the larger uncertainties of the parameter for showers, due to the larger shower-to-shower fluctuations.
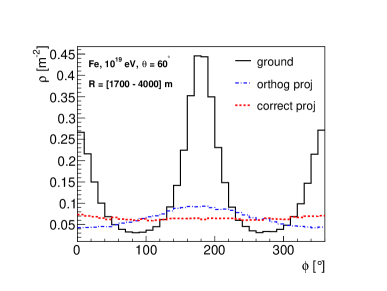
After the estimation of , the muon density in the normal plane is obtained by projecting along the muons’ incoming directions and applying the weight factor given in Eq. 1 to correct for differential attenuation. In Fig. 3, the distribution of the muons density for an induced shower at , taking into account only the muons from the radial range m is displayed. The coordinate system in the normal plane is defined as follows: the intersection of the horizontal plane with the normal plane defines the Y axis, while the X axis is defined by the intersection of the vertical plane containing the shower axis with the normal plane. The positive direction of the X axis corresponds to forward directions in the horizontal plane. The angle is defined as usually in the normal trigonometrical sense in the shower plane.
We represent the muon density around the shower axis in the ground plane (asymmetric due to the shower geometry), in the normal plane after an orthogonal projection and after the projection along the muons momentum, with the correction for differential attenuation included. As can be seen, the azimuthal distribution of muons in the normal plane obtained using the latter procedure is symmetric, whereas the orthogonal projection maintains an asymmetry of the distribution with an amplitude of about .
III Evaluation of and
The MPD longitudinal profile of EAS can be reconstructed experimentally on the basis of the signal induced in the SDs; the advantage is the high duty cycle . The method is suitable for experiments which can record the arrival times of the secondary particles in SDs, for example the Pierre Auger Observatory. The muons produced on the shower core, propagate almost in a straight line through the atmosphere, suffering negligible deviations in the geomagnetic field (zenith angle ). We apply the procedure described in Arsene et al. (2016) to calculate the muon production height in units of [g cm-2] for individual muons. Only the muons produced on the shower core (i.e., for which the difference in the arrival time of muons at ground relative to the time when the shower core reaches the ground , is consistent with the difference in their pathlengths Arsene et al. (2016)), and which have the radial coordinates in the normal plane belonging to specific radial ranges, are considered. The distribution of the MPD is constructed by applying to the production depth of each muon the corresponding weight factor. The resulting MPD profile is fitted with the Gaisser-Hillas function Gaisser and Hillas (1977) and its maximum, , is evaluated. A quality criterion is additionally imposed in the determination of , namely only the showers whose fit quality satisfy are included in the analysis. This cut had been adopted from previous studies Arsene et al. (2016), but it is worth mentioning that varying the cut level has a negligible effect on the estimates, affecting slightly only their uncertainties.
We evaluated also , which represents the number of muons which contribute to the MPD profile (not the total number of muons, , from the EAS). This parameter depends on the inclination angle of the shower axis and the radial range of interest in the normal plane. Both parameters, and , depend also on the muon momentum threshold imposed when reconstructing the MPD profile.
In the next section we present the main differences between the values of and obtained using the two projection methods (orthogonal projection and the method described in Section II).
IV Results
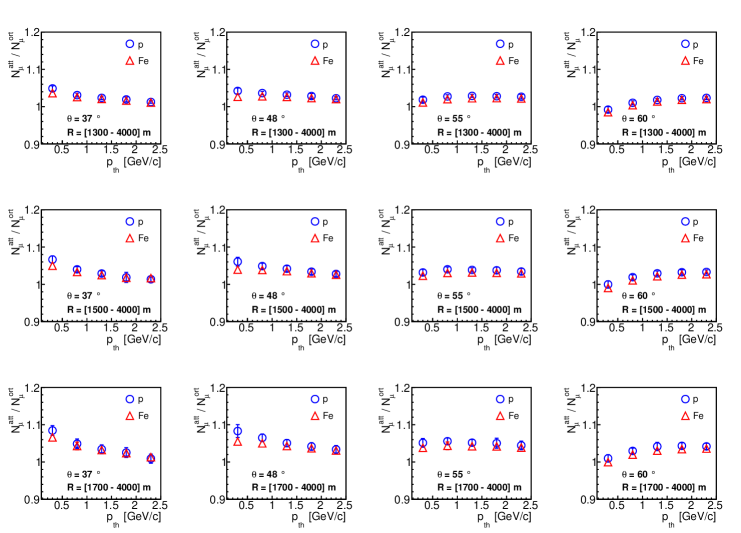
The and parameters were evaluated for each simulated shower, considering different values for the muon momentum threshold and GeV/c, and taking into account only the muons whose coordinates in the normal plane lie in three radial ranges m, m and m. For each analyzed shower we obtain two sets of (, ) parameters corresponding to the different projection methods: orthogonal projection of muons from the ground plane to the normal plane (, ), and projection along their incoming direction, corrected for differential attenuation effects (, ).
In order to quantify the effect of the projection methods on the two observables and , we define the quantities and the ratio .
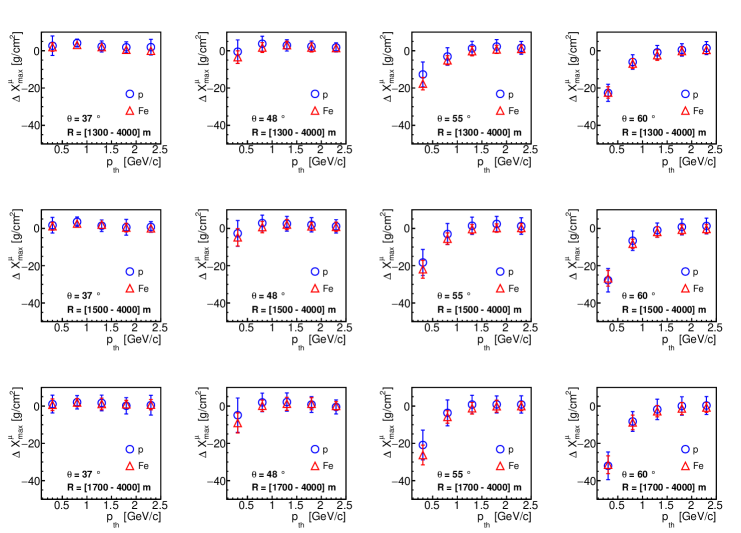
In Fig. 4 we plot the dependence of on for showers with eV and different zenith angles for the muons belonging to the three radial ranges in the normal plane. It can be seen that the reconstruction of is strongly dependent on the chosen projection method. We found smaller values when the attenuation effect is considered in the analysis. The difference is larger for small muon momentum thresholds, large zenith angles and higher radial ranges. The largest difference g/cm2, representing almost of the proton-iron separation, is obtained for GeV/c, and m. This value should be compared with the experimental resolution (systematic uncertainty) of measurement at the Pierre Auger Observatory ( g/cm2) Collica (2016). For larger values, the difference becomes negligible, but setting a high value of in data analysis implies having a poor statistics in the MPD distributions, which translates in large uncertainties for the estimation of .
What changes the behavior of the reconstructed MPD profiles is the way (i.e. (ort) or (att) projection method) we select the muons which contribute to the MPD, whose coordinates into the normal plane lie in a specific radial range, and on the other hand, the corrections for the differential attenuation effects. The lateral distribution in the normal or in the ground plane of the muons produced in a given atmospheric depth, depends on the production depth. That means that the reconstructed production depth depends on the radial range in which the muons used for reconstruction are sampled. The projection method proposed in this paper, (att), aims to select a more homogeneous sample of muons to be used for production depth reconstruction. Indeed we consider that the sample of muons in a given radial range obtained by the proposed projection method is more homogeneous than the sample of muons in the same radial range obtained by orthogonal projection, because in the latter case the dependence on the particular azimuthal coordinates is strong. Of course the distribution of production depths obtained using our method is not identical with the ideal distribution of the production depths which could be obtained by analyzing all the muons, but if it is sensitive to the nature of the primary particle it could be useful in shower reconstruction.
Concerning these results, we emphasize the following issues. In order to extract information on mass composition from the experimental values of , the experimental values should be compared with corresponding values obtained from simulations. In this approach, besides the mapping procedure, several other reconstruction steps, which may act somewhat differently on experimental than on simulation data Aab et al. (2014b, 2015c), are involved. As a consequence, the distribution of the values of becomes broader, due to the effect of several factors, like e.g. the unthinning algorithm applied to the simulation data. In order to get a meaningful evaluation of the effect of the mapping procedure, the results presented in this work were obtained by applying the two mapping procedures to all the muons simulated by CORSIKA which have the radial coordinate in the shower plane in the given radial ranges. Thus, the values of reported here, which are based on the contributions to the MPD of all the muons, not only of the muons which happen to hit the detectors, have lower uncertainties. Due to this fact we consider that the values of and obtained in this way represent a better reference for inferring the mass composition from the experimental values of . We already checked that by analyzing the same sets of CORSIKA simulations taking into account only muons which hit an array of detectors similar to those from the Pierre Auger Observatory, the statistical spread of the results is higher. In view of the narrower shower to shower fluctuations of the values obtained by simulations including all the muons, we consider justified to propose these values as reference in analyzing the experimental results.
The restoration of the azimuthal symmetry of the density in the shower plane is clearly demonstrated and this feature is very useful in every respect in the shower reconstruction. This is especially so when analyzing data pertaining to few locations around the shower core, obtained from detectors with specific radial and angular coordinates; we expect a higher bias of the reconstructed quantities if the information comes from observed densities strongly dependent on the azimuthal coordinates than in the case when the azimuthal dependence is removed.
If the mass composition would be inferred from the same set of values obtained from experiment by comparison with the values instead of , the lower values of would suggest a lighter primary composition in comparison with the values obtained by reference to . In this context, we mention that the results presented in reference Aab et al. (2014b, 2015c) were obtained using the orthogonal projection. We do not know for sure whether the application of the proposed mapping procedure to experimental data will shift the values to exactly the same extent as in the case of the simulations; we suspect that this is not the case. But the conclusion that the comparison of a given set of values extracted from experimental data with the lower values obtained from simulation would suggest a lighter mass composition than in the case when the orthogonal projection would be used for obtaining from simulations, is correct.
We also investigated the influence of the two projection methods on the number of muons contributing to the MPD profiles. In Fig. 5 we plot the dependence of as a function of , for the same showers analyzed in Fig. 4. The biggest difference is observed for showers with smaller zenith angles and smaller values of . The number of muons is larger than with an amount of for showers induced at and m.
The results obtained for showers with primary energy eV are quite similar to those obtained for eV, for both observables and .
V Summary and Conclusions
In this study a procedure for the reconstruction of the distribution of the MPD is presented. The study is based on CORSIKA simulations at two fixed energies and four angles of incidence. Production depth of individual muons is evaluated on the basis of arrival times; the muon incoming direction is also obtained. The lateral muon density in the plane normal to the shower axis is constructed by projecting the muon impact point in the ground plane along the muon momentum and applying a correction for differential attenuation, by assigning a weight factor associated with attenuation to each muon. This procedure restores the axial symmetry of the lateral density of muons in the normal plane. The distribution of the MPD is constructed using the weight factors of the muons from selected radial ranges (typically m) in the plane normal to the shower axis.
Further, the distributions of the MPD were fitted with Gaisser-Hillas functions and the values of were estimated. These values, as well as the values of the number of muons obtained by integrating the lateral density of muons which contributed to the MPD from a given radial range in the shower plane, were compared with the corresponding values obtained by applying the orthogonal projection. We found smaller values when the refined method including the attenuation corrections was applied. In conditions similar to those from the Pierre Auger Observatory ( GeV/c and m) we found g/cm2 which represents almost of the iron-proton separation.
The lower values of the in the simulations when compared with given experimental values of would be interpreted as a lighter mass composition of the cosmic rays.
Our findings suggest that the method of mapping the muon density from the ground plane to the shower plane has a significant effect on the MPD distributions constructed for muons belonging to specific radial bins in the shower plane. In order to avoid a biased estimation, the same mapping procedure, including corrections for attenuation effects, should be applied both to experimental data and to simulations when using the observable for the determination of the mass composition of the cosmic rays.
Finally, we emphasize that in the present study no experimental details were considered. In actual experiments larger uncertainties, related to the muon arrival time uncertainties, the primary energy reconstruction, and due to the poor statistics in the MPD distributions, are expected. In this context, we would like to emphasize that the Auger Upgrade ”AugerPrime” will include improved electronics, capable to achieve better timing accuracy and faster ADC sampling Martello (2018). With improved values of the arrival times, the uncertainty of the MPD reconstruction will decrease and the effect described in this paper should be accounted for.
Acknowledgments
We would like to thank our colleagues from the Pierre Auger Collaboration for many interesting and useful discussions. N. A. acknowledges financial support from the LAPLAS VI program of the Romanian National Authority for Scientific Research (CNCS-UEFISCDI). The work of O. S. was supported by a grant of the Romanian Ministery of Research and Innovation, CCCDI - UEFISCDI, project number PN-III-P1-1.2-PCCDI-2017-0839/19PCCDI/2018, within PNCDI III.
References
- Abraham et al. (2010a) J. Abraham et al. (Pierre Auger Collaboration), Nucl. Instrum. Meth. A620, 227 (2010a).
- Aab et al. (2014a) A. Aab et al. (Pierre Auger Collaboration), Phys. Rev. D 90, 122005 (2014a).
- Aab et al. (2015a) A. Aab et al. (Pierre Auger Collaboration), Nucl. Instrum. Meth. A798, 172 (2015a).
- Abu-Zayyad et al. (2012) T. Abu-Zayyad et al., Nucl. Instrum. Meth. A689, 87 (2012).
- Antoni et al. (2005) T. Antoni et al. (KASCADE), Astropart. Phys. 24, 1 (2005).
- Apel et al. (2010) W. D. Apel et al. (KASCADE-Grande), Nucl. Instrum. Meth. A620, 202 (2010).
- Sokolsky (2011) P. Sokolsky, Nuclear Physics B - Proceedings Supplements 212–213, 74 (2011).
- Chiba et al. (1992) N. Chiba et al., Nucl. Instrum. Meth. A311, 338 (1992).
- Knurenko et al. (2008) S. P. Knurenko et al., Nucl. Phys. Proc. Suppl. 175-176, 201 (2008).
- Aab et al. (2017a) A. Aab et al. (Pierre Auger Collaboration), Phys. Rev. D96, 122003 (2017a).
- Aab et al. (2017b) A. Aab et al. (Pierre Auger Collaboration), JCAP 1704, 038 (2017b), [Erratum: JCAP1803,no.03,E02(2018)].
- Abbasi et al. (2018) R. U. Abbasi et al. (Telescope Array Collaboration), Astrophys. J. 858, 76 (2018).
- Rebel et al. (1995) H. Rebel, G. Voelker, M. Foeller, and A. Chilingarian, J.Phys. G21, 451 (1995).
- Haeusler et al. (2002) R. Haeusler, A. Badea, H. Rebel, I. Brancus, and J. Oehlschlager, Astropart. Phys. 17, 421 (2002).
- Aab et al. (2016a) A. Aab et al. (Pierre Auger Collaboration), Phys. Rev. D93, 072006 (2016a).
- Aab et al. (2015b) A. Aab et al. (Pierre Auger Collaboration), Phys. Rev. D91, 032003 (2015b), [Erratum: Phys. Rev.D91,no.5,059901(2015)].
- Cazon et al. (2005) L. Cazon, R. Vazquez, and E. Zas, Astropart. Phys. 23, 393 (2005).
- Cazon et al. (2004) L. Cazon, R. Vazquez, A. Watson, and E. Zas, Astropart. Phys. 21, 71 (2004).
- Abraham et al. (2010b) J. Abraham et al. (Pierre Auger Collaboration), Nucl. Instrum. Meth. A613, 29 (2010b).
- Aab et al. (2014b) A. Aab et al. (Pierre Auger Collaboration), Phys. Rev. D90, 012012 (2014b).
- Aab et al. (2015c) A. Aab et al. (Pierre Auger Collaboration), Phys. Rev. D 92, 019903 (2015c).
- Ostapchenko (2011) S. Ostapchenko, Phys. Lett. B703, 588 (2011).
- Haungs et al. (2008) A. Haungs et al., Nucl. Phys. Proc. Suppl. 175-176, 354 (2008).
- Müller et al. (2018) S. Müller, R. Engel, T. Pierog, and M. Roth, Astropart. Phys. 97, 174 (2018).
- Matthews (2005) J. Matthews, Astropart. Phys. 22, 387 (2005).
- Ave et al. (2002) M. Ave, J. A. Hinton, R. A. Vazquez, A. A. Watson, and E. Zas, Phys. Rev. D65, 063007 (2002).
- Ave et al. (2003) M. Ave, J. A. Hinton, R. A. Vazquez, A. A. Watson, and E. Zas, Phys. Rev. D67, 043005 (2003).
- Billoir et al. (2016) P. Billoir, M. Settimo, and M. Blanco, Astropart. Phys. 74, 14 (2016).
- Ave et al. (2000) M. Ave, R. A. Vazquez, and E. Zas, Astropart. Phys. 14, 91 (2000), eprint astro-ph/0011490.
- Dembinski et al. (2010) H. P. Dembinski, P. Billoir, O. Deligny, and T. Hebbeker, Astropart. Phys. 34, 128 (2010).
- Aab et al. (2014c) A. Aab et al. (Pierre Auger Collaboration), JCAP 1408, 019 (2014c).
- Ave et al. (2017) M. Ave, R. Engel, M. Roth, and A. Schulz, Astropart. Phys. 87, 23 (2017).
- Heck and Knapp (1989) D. Heck and J. Knapp, Report FZKA 6097 (1998), Forschungszentrum Karlsruhe; available from http://www-ik.fzk.de/~heck/publications/ (1989).
- Heck et al. (1998) D. Heck, J. Knapp, J. Capdevielle, G. Schatz, and T. Thouw, Report FZKA 6019 (1998), Forschungszentrum Karlsruhe; available from http://www-ik.fzk.de/corsika/physicsdescription/corsikaphys.html (1998).
- Sima et al. (2011) O. Sima et al., Nucl. Instrum. Meth. A638, 147 (2011).
- Pierog and Werner (2009) T. Pierog and K. Werner, Nucl. Phys. Proc. Suppl. 196, 102 (2009).
- Ferrari et al. (2005) A. Ferrari, P. R. Sala, A. Fassò, and J. Ranft, FLUKA: A multi-particle transport code (program version 2005) (CERN, Geneva, 2005), URL https://cds.cern.ch/record/898301.
- Hillas (1997) A. M. Hillas, Nucl. Phys. Proc. Suppl. 52B, 29 (1997).
- Arsene et al. (2016) N. Arsene, O. Sima, A. Haungs, and H. Rebel, Astropart. Phys. 83, 13 (2016).
- Ave et al. (2007) M. Ave et al. (Pierre Auger Collaboration), Nucl. Instrum. Meth. A578, 180 (2007).
- Aab et al. (2016b) A. Aab et al. (Pierre Auger Collaboration) (2016b), eprint arxiv/1604.03637.
- Gaisser and Hillas (1977) T. Gaisser and A. Hillas, Proc. of 15th ICRC 8 Plovdiv, Bulgaria 353 (1977).
- Collica (2016) L. Collica (Pierre Auger Collaboration), Eur. Phys. J. Plus 131, 301 (2016).
- Martello (2018) D. Martello (Pierre Auger Collaboration), PoS ICRC2017, 383 (2018).