Pandora Talks: Personality and Demographics on Reddit
Abstract
Personality and demographics are important variables in social sciences and computational sociolinguistics. However, datasets with both personality and demographic labels are scarce. To address this, we present Pandora, the first dataset of Reddit comments of 10k users partially labeled with three personality models and demographics (age, gender, and location), including 1.6k users labeled with the well-established Big 5 personality model. We showcase the usefulness of this dataset on three experiments, where we leverage the more readily available data from other personality models to predict the Big 5 traits, analyze gender classification biases arising from psycho-demographic variables, and carry out a confirmatory and exploratory analysis based on psychological theories. Finally, we present benchmark prediction models for all personality and demographic variables.
1 Introduction
Personality and demographics describe differences between people at the individual and group level. This makes them important for much of social sciences research, where they may be used as either target or control variables. One field that can greatly benefit from textual datasets with personality and demographic data is computational sociolinguistics Nguyen et al. (2016), which uses NLP methods to study language use in society.
Conversely, personality and demographic data can be useful in the development of NLP systems. Recent advances in machine learning have brought significant improvements in NLP systems’ performance across many tasks, but these typically come at the cost of more complex and less interpretable models, often susceptible to biases Chang et al. (2019). Biases are commonly caused by societal biases present in data, and eliminating them requires a thorough understanding of the data used to train the model. One way to do this is to consider demographic and personality variables, as language use and interpretation is affected by both. Incorporating these variables into the design and analysis of NLP models can help interpret model’s decisions, avoid societal biases, and control for confounders.
The demographic variables of age, gender, and location have been widely used in computational sociolinguistics (Bamman et al., 2014; Peersman et al., 2011; Eisenstein et al., 2010), while in NLP there is ample work on predicting these variables or using them in other NLP tasks. In contrast, advances in text-based personality research are lagging behind. This can be traced to the fact that (1) personality-labeled datasets are scarce and (2) personality labels are much harder to infer from text than demographic variables such as age and gender. In addition, the few existing datasets have serious limitations: a small number of authors or comments, comments of limited length, non-anonymity, or topic bias. While most of these limitations have been addressed by the recently published MBTI9k Reddit dataset (Gjurković and Šnajder, 2018), this dataset still has two deficiencies. Firstly, it uses the Myers-Briggs Type Indicator (MBTI) model Myers et al. (1990), which – while popular among the general public and in business – is discredited by most personality psychologists Barbuto Jr (1997). The alternative is the well-known Five Factor Model (or Big 5) McCrae and John (1992), which, however, is less popular, and thus labels for it are harder to obtain. Another deficiency of MBTI9k is the lack of demographics, limiting model interpretability and use in sociolinguistics.
Our work seeks to address these problems by introducing a new dataset – Personality ANd Demographics Of Reddit Authors (Pandora) – the first dataset from Reddit labeled with personality and demographic data. Pandora comprises over 17M comments written by more than 10k Reddit users, labeled with Big 5 and/or two other personality models (MBTI, Enneagram), alongside age, gender, location, and language. In particular, Big 5 labels are available for more than 1.6k users, who jointly produced more than 3M comments.
Pandora provides exciting opportunities for sociolinguistic research and development of NLP models. In this paper we showcase its usefulness through three experiments. In the first, inspired by work on domain adaptation and multitask learning, we show how the MBTI and Enneagram labels can be used to predict the labels from the well-established Big 5 model. We leverage the fact that more data is available for MBTI and Enneagram, and exploit the correlations between the traits of the different models and their manifestations in text. In the second experiment we demonstrate how the complete psycho-demographic profile can help in pinpointing biases in gender classification. We show that a gender classifier trained on a large Reddit dataset fails to predict gender for users with certain combinations of personality traits more often than for other users. Finally, the third experiment showcases the usefulness of Pandora in social sciences: building on existing theories from psychology, we perform a confirmatory and exploratory analysis between propensity for philosophy and certain psycho-demographic variables.
We also report on baselines for personality and demographics prediction on Pandora. We treat Big 5 and other personality and demographics variables as targets for supervised machine learning, and evaluate a number of benchmark models with different feature sets. We make Pandora available111https://psy.takelab.fer.hr for the research community, in the hope this will stimulate further research.
2 Background and Related Work
Personality models and assessment.
Myers-Briggs Type Indicator (MBTI; Myers et al., 1990) and Five Factor Model (FFM; McCrae and John, 1992) are two most commonly used personality models. Myers-Briggs Type Indicator (MBTI) categorizes people in 16 personality types defined by four dichotomies: Introversion/Extraversion (way of gaining energy), Sensing/iNtuition (way of gathering information), Thinking/Feeling (way of making decisions), and Judging/Perceiving (preferences in interacting with others). The main criticism of MBTI focuses on low validity Bess and Harvey (2002); McCrae and Costa (1989).
Contrary to MBTI, FFM McCrae and John (1992) has a dimensional approach to personality and describes people as somewhere on the continuum of five personality traits (Big 5): Extraversion (outgoingness), Agreeableness (care for social harmony), Conscientiousness (orderliness and self-discipline), Neuroticism (tendency to experience distress), and Openness to Experience (appreciation for art and intellectual stimuli). Big 5 personality traits are generally assessed using inventories e.g., personality tests.222The usual inventories for assessing Big 5 are International Personality Item Pool (IPIP; Goldberg et al., 2006), Revised NEO Personality Inventory (NEO-PI-R; Costa et al., 1991), or Big 5 Inventory (BFI; John et al., 1991). Another common inventory is HEXACO Lee and Ashton (2018), which adds a sixth trait, Honesty-Humility. Moreover, personality has been shown to relate to some demographic variables, including gender Schmitt et al. (2008), age Soto et al. (2011), and location Schmitt et al. (2007). Results show that females score higher than males in agreeableness, extraversion, conscientiousness, and neuroticism Schmitt et al. (2008), and that expression of all five traits subtly changes during lifetime Soto et al. (2011). There is also evidence of correlations between MBTI and FFM Furnham (1996); McCrae and Costa (1989).
NLP and personality.
Research on personality and language developed from early works on essays Pennebaker and King (1999); Argamon et al. (2005); Luyckx and Daelemans (2008), emails Oberlander and Gill (2006), EAR devices Mehl et al. (2001), and blogs Iacobelli et al. (2011), followed by early research on social networks Quercia et al. (2011); Golbeck et al. (2011). In recent years, most research is done on Facebook Schwartz et al. (2013); Celli et al. (2013); Park et al. (2015); Tandera et al. (2017); Kulkarni et al. (2018); Xue et al. (2018), Twitter Plank and Hovy (2015); Verhoeven et al. (2016); Tighe and Cheng (2018); Ramos et al. (2018); Celli and Lepri (2018), and Reddit Gjurković and Šnajder (2018); Wu et al. (2020). Due to labeling cost and privacy concerns, it has become increasingly challenging to obtain personality datasets, especially large-scale dataset are virtually nonexistent . Wiegmann et al. (2019) provide an overview of the datasets, some of which are not publicly available.
After MyPersonality dataset Kosinski et al. (2015) became unavailable to the research community, subsequent research had to rely on the few smaller datasets based on essays Pennebaker and King (1999), personality forums,333http://www.kaggle.com/datasnaek/mbti-type Twitter Plank and Hovy (2015); Verhoeven et al. (2016), and a small portion of the MyPersonality dataset Kosinski et al. (2013) used in PAN workshops Celli et al. (2013, 2014); Rangel et al. (2015).
To the best of our knowledge, the only work that attempted to compare prediction models for both MBTI and Big 5 is that of Celli and Lepri (2018), carried out on Twitter data. However, they did not leverage the MBTI labels in the prediction of Big 5 traits, as their dataset contained no users labeled with both personality models.
As most recent personality predictions models are based on deep learning Majumder et al. (2017); Xue et al. (2018); Rissola et al. (2019); Wu et al. (2020); Lynn et al. (2020); Vu et al. (2020); Mehta et al. (2020, 2020), large-scale multi-labeled datasets such as Pandora can be used to develop new architectures and minimize the risk of models overfitting to spurious correlations.
User Factor Adaption.
Another important line of research that would benefit from datasets like Pandora is debiasing based on demographic data Liu et al. (2017); Zhang et al. (2018); Pryzant et al. (2018); Elazar and Goldberg (2018); Huang and Paul (2019). Current research is done on demographics, with the exception of the work of Lynn et al. (2017), who use personality traits, albeit predicted. Different social media sites attract different types of users, and we expect more research of this kind on Reddit, especially considering that Reddit is the source of data for many studies on mental health De Choudhury et al. (2016); Yates et al. (2017); Sekulic et al. (2018); Cohan et al. (2018); Turcan and McKeown (2019); Sekulic and Strube (2019).
3 Pandora Dataset
Reddit is one of the most popular websites worldwide. Its users, Redditors, spend most of their online time on site and have more page views than users of other websites. This, along with the fact that users are anonymous and that the website is organized in more than a million different topics (subreddits), makes Reddit suitable for various kinds of sociolinguistic studies. To compile their MBTI9k Reddit dataset, Gjurković and Šnajder (2018) used the Pushift Reddit dataset Baumgartner et al. (2020) to retrieve the comments dating back to 2015. We adopt MBTI9k as the starting point for Pandora.
Ethical Research Statement.
We are following the ethics code for psychological research by which researchers may dispense with informed consent of each participant for archival research, for which disclosure of responses would not place participants at risk of criminal or civil liability, or damage their financial standing, employability, or reputation, and if confidentiality is protected. As per Reddit User Agreement, users agree not to disclose sensitive information of other users and they consent that their comments are publicly available and exposed through API to other services. The users may request to have their content removed, and we have taken this into account by removing such content; future requests will be treated in the same way and escalated to Reddit. Our study has been approved by an academic IRB.
3.1 MBTI and Enneagram Labels
Gjurković and Šnajder (2018) relied on flairs to extract the MBTI labels. Flairs are short descriptions with which users introduce themselves on various subreddits, and on MBTI-related subreddits they typically report on MBTI test results. Owing to the fact that MBTI labels are easily identifiable, they used regular expressions to obtain the labels from flairs (and occasionally from comments). We use their labels for Pandora, but additionally manually label for Enneagram, which users also typically report in their flairs. In total, 9,084 users reported their MBTI type in the flair, and 793 additionally reported their Enneagram type. Table 1 shows the distribution of MBTI types and dimensions (we omit Enneagram due to space constraints).
3.2 Big 5 Labels
Obtaining Big 5 labels turned out to be more challenging. Unlike MBTI and Enneagram tests, Big 5 tests result in a score for each of the five traits. Moreover, the score format itself is not standardized, thus scores are reported in various formats and they are typically reported not in flairs but in comments replying to posts which mention a specific online test. Normalization of scores poses a series of challenges. Firstly, different web sites use different inventories (e.g., HEXACO, NEO PI-R, Aspect-scale), some of which are publicly available while others are proprietary. The different tests use different names for traits (e.g., emotional stability as the opposite of neuroticism) or use abbreviations (e.g., OCEAN, where O stands for openness, etc.). Secondly, test scores may be reported as either raw scores, percentages, or percentiles. Percentiles may be calculated based on the distribution of users that took the test or on distribution of specific groups of offline test-takers (e.g., students), in the latter case commonly adjusted for age and gender. Moreover, scores can be either numeric or descriptive, the former being in different ranges (e.g., -100–100, 0–100, 1–5) and the latter being different for each test (e.g., descriptions typical and average may map to the same underlying score). On top of this, users may decide to copy-paste the results, describe them in their own words (e.g., rock-bottom for low score) – often misspelling the names of the traits – or combine both. Lastly, in some cases the results do not even come from inventory-based assessments but from text-based personality prediction services (e.g., Apply Magic Sauce and Watson Personality).
Extraction.
The fact that Big 5 scores are reported in full-text comments rather than flairs and that their form is not standardized makes it difficult to extract the scores fully automatically. Instead, we opted for a semiautomatic approach as follows. First, we retrieved candidate comments containing three traits most likely to be spelled correctly (agreeableness, openness, and extraversion). For each comment, we retrieved the corresponding post and determined what test it refers to based on the link provided, if the link was present. We first discarded all comment referring to text-based prediction services, and then used a set of regular expressions specific to the report of each test to extract personality scores from the comment. Next, we manually verified all the extracted scores and the associated comments to ensure that the comments indeed refer to a Big 5 test report and that the scores have been extracted correctly. For about 80% of reports the scores were extracted correctly, while for the remaining 20% we extracted the scores manually. This resulted in Big 5 scores for 1027 users, reported from 12 different tests. Left out from this procedure were the comments for which the test is unknown, as they were replying to posts without a link to the test. To also extract scores from these reports, we trained a test identification classifier on the reports of the 1,008 users, using character n-grams as features, and reaching an F1-macro score of 81.4% on held-out test data. We use this classifier to identify the tests referred to in the remaining comments and repeat the previous score extraction procedure. This yielded scores for additional 600 users, for a total of 1,608 users.
Normalization.
To normalize the extracted scores, we first heuristically mapped score descriptions of various tests to numeric values in the 0–100 range in increments of 10. As mentioned, scores may refer to either raw scores, percentiles, or descriptions. Both percentiles and raw scores are mostly reported on the same 0–100 scale, so we refer to the information on the test used to interpret the score correctly. Finally, we convert raw scores and percentages reported by Truity444https://www.truity.com/ and HEXACO555http://hexaco.org/hexaco-online to percentiles based on score distribution parameters. HEXACO reports distribution parameters publicly, while Truity provided us with parameters of the distribution of their test-takers.
Finally, for all users labeled with Big 5 labels, we retrieved all their comments from the year 2015 onward, and add these to the MBTI dataset from §3.1. The resulting dataset consists of 17,640,062 comments written by 10,288 users. There are 393 users labeled with both Big 5 and MBTI.
3.3 Demographic Labels
To obtain age, gender, and location labels, we again turn to textual descriptions provided in flairs. For each of the 10,228 users, we collected all the distinct flairs from all their comments in the dataset, and then manually inspected these flairs for age, gender, and location information. For users who reported their age in two or more flairs at different time points, we consider the age from most recent one. Additionally, we extract comment-level self-reports of users’ age (e.g., I’m 18 years old) and gender (e.g., I’m female/male). As for location, users report location at different levels, mostly countries, states, and cities, but also continents and regions. We normalize location names, and map countries to country codes, countries to continents, and states to regions. Most users are from English speaking countries, and regionally evenly distributed in US and Canada (cf. Appendix). Table 1 shows the average number per user. Lastly, Table 2 gives intersection counts between personality models and other demographic variables.
3.4 Analysis
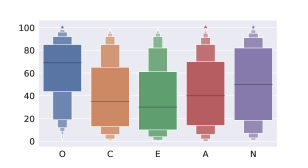
Table 1 and Figure 1 show the distributions of Big 5 scores per trait.666As noted by Gjurković and Šnajder (2018), due to various selection biases involved our dataset may not be representative of Reddit users, and it is certainly not representative of internet users or the general population. We observe that the average user in our dataset is average on neuroticism, more open, and less extraverted, agreeable, and conscientious. Furthermore, males are on average younger, less agreeable, and neurotic than females. Similarly, Table 1 shows that MBTI users have a preference for introversion, intuition (i.e., openness), thinking (i.e., less agreeable), and perceiving (less conscientious). This is not surprising if we look at Table 3, which shows high correlation between particular MBTI dimensions or Enneagram types, and Big 5 traits. Correlations between Big 5 and MBTI follow the same pattern as correlations from existing psychological research McCrae and Costa (1989).
| Big 5 Trait | All | Females | Males |
|---|---|---|---|
| Openness | 62.5 | 62.9 | 64.3 |
| Conscientiousness | 40.2 | 43.3 | 41.6 |
| Extraversion | 37.4 | 39.7 | 37.6 |
| Agreeableness | 42.4 | 44.1 | 38.9 |
| Neuroticism | 49.8 | 51.6 | 46.9 |
| Age | 25.7 | 26.7 | 25.6 |
| # Comments | 1819 | 2004 | 3055 |
| MBTI Dimension | # Users | MBTI Dimension | # Users |
| Introverted | 7134 | Extraverted | 1920 |
| Intuitive | 8024 | Sensing | 1030 |
| Thinking | 5837 | Feeling | 3217 |
| Perceiving | 5302 | Judging | 3752 |
| Variable | Big 5 | MBTI | Enneagram | Unique |
|---|---|---|---|---|
| Gender | 599 | 2695 | 345 | 3084 |
| Female | 232 | 1184 | 149 | 1331 |
| Male | 367 | 1511 | 196 | 1753 |
| Age | 638 | 1890 | 290 | 2324 |
| Country | 235 | 1984 | 182 | 2146 |
| Region | 74 | 800 | 65 | 852 |
| Big 5 | – | 393 | 64 | 1608 |
| MBTI | 393 | – | 793 | 9084 |
| Enneagram | 64 | 793 | – | 794 |
| MBTI / Big 5 | O | C | E | A | N |
|---|---|---|---|---|---|
| Introverted | –.062 | –.062 | –.748 | –.055 | .157 |
| Intuitive | .434 | –.027 | –.042 | .030 | .065 |
| Thinking | –.027 | .138 | –.043 | –.554 | –.341 |
| Perceiving | .132 | –.575 | .145 | .055 | .031 |
| Enneagram 1 | –.139 | .271 | –.012 | .004 | –.163 |
| Enneagram 2 | .038 | .299 | .042 | .278 | –.034 |
| Enneagram 3 | .188 | .004 | .143 | –.069 | –.097 |
| Enneagram 4 | .087 | –.078 | –.137 | .320 | .342 |
| Enneagram 5 | –.064 | .006 | –.358 | –.157 | –.040 |
| Enneagram 6 | –.026 | .003 | –.053 | –.007 | .276 |
| Enneagram 7 | .015 | –.347 | .393 | –.119 | –.356 |
| Enneagram 8 | –.127 | .230 | .234 | –.363 | –.179 |
| Enneagram 9 | –.003 | –.155 | –.028 | .018 | .090 |
4 Experiments
Coupling linguistic data with psycho-demographic profiles sets the stage for many interesting research questions. We showcase this with three experiments on Pandora.
4.1 Predicting Big 5 with MBTI/Enneagram
MBTI and Enneagram are considerably more popular than Big 5 among the social media users. This makes it relatively easy to obtain the MBTI and Enneagram labels (§3.1), and develop well-performing prediction models using supervised machine learning. On the other hand, validity of MBTI and Enneagram has been severely criticized Barbuto Jr (1997); Thyer (2015), which is why they are virtually not used in psychological research. This experiment investigates whether we can combine the best of both worlds: leverage the more abundant MBTI/Enneagram labels in Pandora to predict Big 5 traits from text. We hypothesize that the questionable psychological validity of MBTI/Enneagram labels can be compensated by their number. We base this on moderate to strong correlations observed between the personality models (Table 3) and the presence of a considerable number of users with multiple labels (Table 2).
We frame the experiment as a domain adaptation task of transferring MBTI/Enneagram labels to Big 5 labels, using a simple domain adaptation approach from (Daumé III, 2007) (cf. Appendix for more details). We train four text-based MBTI classifiers on a subset of Pandora users for which we have MBTI labels but no Big 5 labels. We then apply these classifiers on a subset of Pandora users for which we have both MBTI and Big 5 labels, obtaining a type-level accuracy of MBTI prediction of 45%. Table 4 shows correlations between MBTI and Big 5 gold labels and predicted MBTI labels (cf. Appendix for Enneagram correlations). As expected, we observe lower overall correlations in comparison with correlations on gold labels (Table 3). The main observable difference is that extraversion is now moderately correlated with predicted MBTI intuitive dimension. As majority of Big 5 traits significantly correlate with more than one MBTI dimension, we use these scores as features for training five regression models, one for each Big 5 trait. Lastly, we apply both classifiers on the subset of Pandora users for which we have Big 5 labels but no MBTI labels (serving as domain adaptation target set). We use MBTI classifiers to obtain scores for the four MBTI dimensions, and then feed these to Big 5 models to obtain predictions for the five traits. The resulting correlations (Table 5) clearly indicate that predictions based on MBTI help in predicting Big 5 traits. Furthermore, the results justify the use of regression models as predicted Big 5 traits are more correlated with gold Big 5 traits then predicted MBTI dimensions, with the exception of conscientiousness, which is significantly correlated with perceiving/judging MBTI dimension. For instance, predicted openness is a better predictor of openness than the intuitive dimension.
| Predicted | ||||
| Gold | I/E | N/S | T/F | P/J |
| O | –.094 | .251 | –.087 | .088 |
| C | –.003 | .033 | .085 | –.419 |
| E | –.516 | .118 | –.142 | –.002 |
| A | .064 | .068 | –.406 | .003 |
| N | .076 | –.026 | –.234 | .007 |
| I/E | .513 | –.096 | .023 | –.066 |
| N/S | .046 | .411 | –.043 | .032 |
| T/F | –.061 | –.036 | .627 | .141 |
| P/J | –.108 | –.033 | .083 | .587 |
| Predicted | O | C | E | A | N |
|---|---|---|---|---|---|
| I/E | –.082 | .039 | –.262 | –.003 | –.002 |
| N/S | .127 | –.021 | .049 | .060 | .001 |
| T/F | –.001 | .038 | –.039 | –.259 | –.172 |
| P/J | .018 | –0.41 | .007 | .034 | .039 |
| O | .147 | –.082 | .212 | .145 | .070 |
| C | –.007 | .237 | .013 | –.112 | –.090 |
| E | .098 | –.028 | .272 | .044 | .022 |
| A | .006 | –.079 | .023 | .264 | .176 |
| N | –.048 | –.025 | –.042 | .231 | .162 |
4.2 Gender Classification Bias
Gender classification from text is a fundamental task in author profiling, and in particular author profiling on social media has recently received a lot of attention from the NLP community Bamman et al. (2014); Sap et al. (2014); Ciot et al. (2013). Additionally, gender is often in the spotlight of research of fairness and bias in NLP Sun et al. (2019). Biases are often introduced by demographic and other imbalances in training data. Here we look at personality profile as a potential source of bias, and set out to investigate whether a simple gender classification model trained on Reddit exhibits biases that could be traced back to personality traits. This is an important issue, given that Reddit is often used as a source of data for training NLP models, e.g., (Zhang et al., 2017; Cheng et al., 2017; Henderson et al., 2019; Sekulic and Strube, 2019).
To build a gender classifier, we retrieve a separate Reddit dataset and label it automatically for gender. To this end, we again rely on flairs, using strings“/f/” and “/m/” as female and male gender indicators, respectively.777Although the construct of gender is not binary, we limit our present analysis to users who reported binary gender to obtain a more balanced dataset for bias analysis. This method yields a 98.5% precision on Pandora. From the 34k users that used these patterns in their flairs, we sampled a balanced dataset of 24,954 users and retrieved over 30M of their comments, removing quoted text and all comments shorter than five words. Next, we aggregate the comments per user, and divide the users in an 80%–20% train-test split. For classification, we use logistic regression with 500-dimensional SVD vectors derived from Tf-Idf word n-grams. The test accuracy of the classifier was 89.9%. The accuracy of the classifier on 3,084 users from Pandora with known gender was 89.3%.
We now turn to bias analysis. On Pandora, the classifier failed to predict the correct gender for 8.1% male (142/1743) and 14.4% female (192/1331) users. As this is a statistically significant difference (p<0.05 with two-proportion Z-Test), we conclude that the classifier is biased. To investigate this further, we divide male and female users into those for which the predictions were correct and those for which they were incorrect. We then test for statistically significant differences (using two-proportion Z-test for binary variables and Kruskal-Wallis H-test for continuous variables) of psycho-demographic variables between correctly and incorrectly classified cases for both groups. Results are shown in Table 6. Differences are statistically significant for thinking and perceiving MBTI dimensions for both females and males, for extraversion Big 5 trait for males, and for age in females. Thinking and perceiving preference for females makes them more likely to be misclassified for males, and the reverse holds for males. Furthermore, the gender of more extraverted males is more likely to be misclassified. When it comes to age, younger females are more often in misclassified group. These findings clearly indicate that a complete psycho-demographic profile is a useful tool for bias analysis of machine learning models trained on social media text.
| Female | Male | |||||
| Variable | ✓ | ✘ | ✓ | ✘ | ||
| Age | 26.78 | 25.83 | 0.95∗ | 25.46 | 26.90 | –1.44 |
| I/E | 0.78 | 0.72 | 0.06 | 0.76 | 0.82 | –0.06 |
| N/S | 0.86 | 0.91 | –0.05 | 0.92 | 0.93 | –0.01 |
| T/F | 0.47 | 0.64 | –0.17∗∗∗ | 0.61 | 0.29 | 0.32∗∗∗ |
| P/J | 0.39 | 0.56 | –0.17∗∗∗ | 0.53 | 0.39 | 0.14∗∗∗ |
| O | 61.40 | 68.18 | –6,78 | 64.11 | 67.20 | –3.09 |
| C | 45.28 | 36.44 | 8.84 | 41.10 | 47.50 | –6.40 |
| E | 40.67 | 36.44 | 4.23 | 36.68 | 49.60 | –12.92∗ |
| A | 45.07 | 40.78 | 4.29 | 38.43 | 44.70 | –6.27 |
| N | 50.95 | 53.72 | –2.77 | 46.81 | 47.50 | –0.69 |
4.3 Propensity for Philosophy
Our last experiment investigates the usefulness of Pandora for research in social sciences. One obvious type of use cases are confirmatory studies which aim to replicate present theories and findings on a dataset that has been obtained in a manner different from typical datasets in the field. Another type of use cases are exploratory studies that seek to identify new relations between psycho-demographic variables manifested in online talk. Here we present a use case of both types. We focus on propensity for philosophy of Reddit users (manifested as propensity for philosophical topics in online discussions), and seek to confirm its hypothesized positive relationship with openness to experiences Johnson (2014); Dollinger et al. (1996), cognitive processing (e.g., insight), and readability index. We expect this to be confirmed since all four variables share proneness to higher intellectual engagement. For exploratory analysis, we extend our analysis to emotion variables.
We conducted the analysis using hierarchical regression analysis with propensity for philosophical topics as the criterion variable and demographics, personality, emotions, cognitive processing, and text readability as predictors. As a measure of propensity for philosophical topics, we compute the “philosophy” feature (frequency of philosophical words) from Empath Fast et al. (2016) for each user’s comments. Similarly, for the predictors we compute posemo, negemo, and insight features from LIWC Pennebaker et al. (2015) and Flesh-Kincaid Grade Level (F-K GL) readability score Kincaid et al. (1975).888We counted the frequencies per comment, divided it by total number of words in a comment, multiplied with 100, and averaged for total comments. Emotion variables are inserted for the exploratory analysis. In the hierarchical regression analysis, demographics were added as control variables in the first step, Big 5 traits were added in the second step, emotion variables in the third step, and finally insight feature as a cognitive inclination variable and F-K GL readability index were added in the last step. The sample comprises 430 Reddit users, 273 males and 157 females, with the mean age of 26.79 (SD=7.954), who all had gold labels of gender, age, and Big 5.
| Regression coefficients | |||||
| Predictors | Step 1 | Step 2 | Step 3 | Step 4 | Step 5 |
| Gender | –.26∗∗ | –.24∗∗ | –.20∗∗ | –.19∗∗ | –.17∗∗ |
| Age | –.01 | –.03 | –.02 | .00 | .01 |
| O | – | .20∗∗ | .19∗∗ | .15∗∗ | .10∗∗ |
| C | – | .01 | .05 | .08 | .07 |
| E | – | .02 | .03 | .04 | .04 |
| A | – | –.12∗ | –.05 | –.05 | –.06 |
| N | – | –.04 | –.03 | .01 | .02 |
| posemo | – | – | .15∗∗ | .17∗∗ | .03 |
| negemo | – | – | .29∗∗ | .27∗∗ | .29∗∗ |
| insight | – | – | – | .36∗∗ | .27∗∗ |
| F-K GL | – | – | – | – | .34∗∗ |
| .07 | .12 | .22 | .34 | .43 | |
| Adjusted | .06 | .11 | .20 | .32 | .41 |
| change | .07∗∗ | .06∗∗ | .10∗∗ | .12∗∗ | .09∗∗ |
.
The analysis yields interesting results.999Multivariate normality and multicollinearity were satisfied, and homoscedasticity was satisfied after removing 14 outliers based on standardized residuals. Firstly, as much as the 41% of variance in the “philosophy” feature is explained by the 11 predictors. Secondly, openness to experiences, readability index, and insight are, as expected, all significant and positive predictors of the “philosophy” feature. Agreeableness was a negative significant predictor before adding the emotion variables. This is not surprising, as people low in agreeableness are less likely to pander to others, and agreeableness shows significant correlations with both positive (.20) and negative emotions (-.13). Thirdly, the results imply alluring associations with emotion variables. Negative emotions were clearly positive predictors of frequency of discussing philosophical topics. However, positive emotions were a significant predictor until the last step when F-K GL was added to the model. This was due to moderate correlation between posemo and F-K GL (-0.40). Lastly, males had higher frequency of words related to philosophy than females. To sum up, the hypothesis is confirmed and exploratory analysis yields interesting results which could motivate further research.
5 Prediction Models
In this section we describe baseline models for predicting personality and demographic variables from user comments in Pandora.
We consider the following sets of features: (1) N-grams: Tf-Idf weighted 1–3 word ngrams and 2–5 character n-grams; (2) Stylistic: the counts of words, characters, and syllables, mono/polysyllable words, long words, unique words, as well as all readability metrics implemented in Textacy101010https://chartbeat-labs.github.io/textacy; (3) Dictionaries: words mapped to Tf-Idf categories from LIWC Pennebaker et al. (2015), Empath Fast et al. (2016), and NRC Emotion Lexicon Mohammad and Turney (2013) dictionaries; (4) Gender: predictions of the gender classifier from §4.2; (5) Subreddit distributions: a matrix where each row is a distribution of post counts across all subreddits for a particular user, reduced using PCA to 50 features per user; (6) Subreddit other: counts of downs, score, gilded, ups, as well as the controversiality scores for a comment; (7) Named entities: the number of named entities per comment, as extracted using Spacy;111111https://spacy.io/ (8) Part-of-speech: counts for each part-of-speech; (9) Predictions (only for predicting Big 5 traits): MBTI/Enneagram predictions obtained by a classifier built on held-out data. Features (2), (4), and (6–9) are calculated at the level of individual comments and aggregated to min, max, mean, standard deviation, and median values for each user.
We build six regression models (age and Big 5 traits) and eight classification models (four MBTI dimensions, gender, region, Enneagram). We experiment with linear/logistic regression (LR) from sklearn Pedregosa et al. (2011) and deep learning models (NN). We trained a separate NN model for each task. In each model, a single user is represented as a matrix, with rows representing the user’s comments. The comments were encoded using 1024-dimensional vectors derived using BERT Devlin et al. (2019). BERT comment vectors are fed into convolution layers, max pooling, and several fully connected layers. Hyperparameters and additional information can be found in the Appendix.
We evaluate the models using 5-fold cross-validation with a separate stratified split for each target. We use regression F-tests to select top- features, and optimize model hyperparameters and on held-out data for each fold separately.
Results are shown in Table 8. LR performs best when using only the n-gram features. An exception are Big 5 trait predictions, which benefit considerably from adding the MBTI/Enneagram predictions as features, building on Section 4.1 and Table 3. Also, using 1000 comments rather than last 100 (as in NN) increased scores up to 5 points.
| LR | ||||||
| NO | N | O | NOP | NP | NN | |
| Classification (Macro-averaged F1 score) | ||||||
| Introverted | .649 | .654 | .559 | – | – | .546 |
| Intuitive | .599 | .606 | .518 | – | – | .528 |
| Thinking | .730 | .739 | .678 | – | – | .634 |
| Perceiving | .626 | .642 | .586 | – | – | .566 |
| Enneagram | .155 | .251 | .145 | – | – | .143 |
| Gender | .889 | .904 | .825 | – | – | .843 |
| Region | .206 | .626 | .144 | – | – | .478 |
| Regression (Pearson correlation coefficient) | ||||||
| Agreeableness | .181 | .232 | .085 | .237 | .270 | .210 |
| Openness | .235 | .265 | .180 | .235 | .250 | .159 |
| Conscientiousness | .194 | .162 | .093 | .245 | .273 | .120 |
| Neuroticism | .194 | .244 | .138 | .266 | .283 | .149 |
| Extraversion | .271 | .327 | .058 | .286 | .387 | .167 |
| Age | .704 | .750 | .469 | – | – | .396 |
6 Conclusion
Pandora dataset comprises 17M comments, personality, and demographic labels for over 10k Reddit users, including 1.6k users with Big 5 labels. To our knowledge, this is the first Reddit dataset with Big 5 traits, and also the first covering multiple personality models (Big 5, MBTI, Enneagram). We showcased the usefulness of Pandora with three experiments, showing (1) how more readily available MBTI/Enneagram labels can be used to estimate Big 5 traits, (2) that a gender classifier trained on Reddit exhibits bias on users of certain personality traits, and (3) that certain psycho-demographic variables are good predictors of propensity for philosophy of Reddit users. We also trained and evaluated benchmark prediction models for all psycho-demographic variables. The poor performance of deep learning baseline models, the rich set of labels, and the large number of comments per user in Pandora suggest that further efforts should be directed toward efficient user representations and more advanced deep learning architectures.
Acknowledgements
We thank the reviewers for their remarks. This work has been fully supported by the Croatian Science Foundation under the project IP-2020-02-8671 PSYTXT (“Computational Models for Text-Based Personality Prediction and Analysis”).
References
- Argamon et al. (2005) Shlomo Argamon, Sushant Dhawle, Moshe Koppel, and James Pennebaker. 2005. Lexical predictors of personality type. In Proceedings of the Joint Annual Meeting of the Interface and the Classification Society, pages 1–16.
- Bamman et al. (2014) David Bamman, Jacob Eisenstein, and Tyler Schnoebelen. 2014. Gender identity and lexical variation in social media. Journal of Sociolinguistics, 18(2):135–160.
- Barbuto Jr (1997) John E. Barbuto Jr. 1997. A critique of the Myers-Briggs Type Indicator and its operationalization of Carl Jung’s psychological types. Psychological Reports, 80(2):611–625.
- Baumgartner et al. (2020) Jason Baumgartner, Savvas Zannettou, Brian Keegan, Megan Squire, and Jeremy Blackburn. 2020. The pushshift reddit dataset. Proceedings of the International AAAI Conference on Web and Social Media, 14(1):830–839.
- Bess and Harvey (2002) Tammy L. Bess and Robert J. Harvey. 2002. Bimodal score distributions and the myers–briggs type indicator: Fact or artifact? Journal of Personality Assessment, 78(1):176–186.
- Celli and Lepri (2018) Fabio Celli and Bruno Lepri. 2018. Is big five better than mbti? A personality computing challenge using twitter data. In Proceedings of the Fifth Italian Conference on Computational Linguistics (CLiC-it 2018), Torino, Italy, December 10-12, 2018, volume 2253 of CEUR Workshop Proceedings. CEUR-WS.org.
- Celli et al. (2014) Fabio Celli, Bruno Lepri, Joan-Isaac Biel, Daniel Gatica-Perez, Giuseppe Riccardi, and Fabio Pianesi. 2014. The workshop on computational personality recognition 2014. In Proceedings of the 22nd ACM international conference on Multimedia, pages 1245–1246. ACM.
- Celli et al. (2013) Fabio Celli, Fabio Pianesi, David Stillwell, and Michal Kosinski. 2013. Workshop on computational personality recognition: Shared task. In Proceedings of the AAAI Workshop on Computational Personality Recognition, pages 2–5.
- Chang et al. (2019) Kai-Wei Chang, Vinod Prabhakaran, and Vicente Ordonez. 2019. Bias and fairness in natural language processing. In Proceedings of the 2019 Conference on Empirical Methods in Natural Language Processing and the 9th International Joint Conference on Natural Language Processing (EMNLP-IJCNLP): Tutorial Abstracts.
- Cheng et al. (2017) Hao Cheng, Hao Fang, and Mari Ostendorf. 2017. A factored neural network model for characterizing online discussions in vector space. In Proceedings of the 2017 Conference on Empirical Methods in Natural Language Processing, pages 2296–2306, Copenhagen, Denmark. Association for Computational Linguistics.
- Ciot et al. (2013) Morgane Ciot, Morgan Sonderegger, and Derek Ruths. 2013. Gender inference of Twitter users in non-English contexts. In Proceedings of the 2013 Conference on Empirical Methods in Natural Language Processing, pages 1136–1145, Seattle, Washington, USA. Association for Computational Linguistics.
- Cohan et al. (2018) Arman Cohan, Bart Desmet, Andrew Yates, Luca Soldaini, Sean MacAvaney, and Nazli Goharian. 2018. SMHD: a large-scale resource for exploring online language usage for multiple mental health conditions. In Proceedings of the 27th International Conference on Computational Linguistics, pages 1485–1497, Santa Fe, New Mexico, USA. Association for Computational Linguistics.
- Costa et al. (1991) Paul T. Costa, Robert R. McCrae, and David A. Dye. 1991. Facet scales for agreeableness and cpnscientiousness: A revision of the neo personality inventory. Personality and Individual Differences, 12(9):887–898.
- Daumé III (2007) Hal Daumé III. 2007. Frustratingly easy domain adaptation. In Proceedings of the 45th Annual Meeting of the Association of Computational Linguistics, pages 256–263, Prague, Czech Republic. Association for Computational Linguistics.
- De Choudhury et al. (2016) Munmun De Choudhury, Emre Kiciman, Mark Dredze, Glen Coppersmith, and Mrinal Kumar. 2016. Discovering shifts to suicidal ideation from mental health content in social media. In Proceedings of the 2016 CHI conference on human factors in computing systems, pages 2098–2110. ACM.
- Devlin et al. (2019) Jacob Devlin, Ming-Wei Chang, Kenton Lee, and Kristina Toutanova. 2019. BERT: Pre-training of deep bidirectional transformers for language understanding. In Proceedings of the 2019 Conference of the North American Chapter of the Association for Computational Linguistics: Human Language Technologies, Volume 1 (Long and Short Papers), pages 4171–4186, Minneapolis, Minnesota. Association for Computational Linguistics.
- Dollinger et al. (1996) Stephen J. Dollinger, Frederick T. Leong, and Shawna K. Ulicni. 1996. On traits and values: With special reference to openness to experience. Journal of Research in Personality, 30(1):23–41.
- Eisenstein et al. (2010) Jacob Eisenstein, Brendan O’Connor, Noah A Smith, and Eric P Xing. 2010. A latent variable model for geographic lexical variation. In Proceedings of the 2010 conference on empirical methods in natural language processing, pages 1277–1287. Association for Computational Linguistics.
- Elazar and Goldberg (2018) Yanai Elazar and Yoav Goldberg. 2018. Adversarial removal of demographic attributes from text data. In Proceedings of the 2018 Conference on Empirical Methods in Natural Language Processing, pages 11–21, Brussels, Belgium. Association for Computational Linguistics.
- Fast et al. (2016) Ethan Fast, Binbin Chen, and Michael S Bernstein. 2016. Empath: Understanding topic signals in large-scale text. In Proceedings of the 2016 CHI Conference on Human Factors in Computing Systems, pages 4647–4657. ACM.
- Furnham (1996) Adrian Furnham. 1996. The big five versus the big four: the relationship between the Myers-Briggs Type Indicator (MBTI) and NEO-PI five factor model of personality. Personality and Individual Differences, 21(2):303–307.
- Gjurković and Šnajder (2018) Matej Gjurković and Jan Šnajder. 2018. Reddit: A gold mine for personality prediction. In Proceedings of the Second Workshop on Computational Modeling of People’s Opinions, Personality, and Emotions in Social Media, pages 87–97, New Orleans, Louisiana, USA. Association for Computational Linguistics.
- Golbeck et al. (2011) Jennifer Golbeck, Cristina Robles, Michon Edmondson, and Karen Turner. 2011. Predicting personality from Twitter. In Proceedings of 2011 IEEE International Conference on Privacy, Security, Risk and Trust (PASSAT) and IEEE International Conference on Social Computing (SocialCom), pages 149–156.
- Goldberg (1992) Lewis R. Goldberg. 1992. The development of markers for the big-five factor structure. Psychological Assessment, 4(1):26––42.
- Goldberg et al. (2006) Lewis R. Goldberg, John A. Johnson, Herbert W. Eber, Robert Hogan, Mihael C. Ashton, C. Robert Cloninger, and Harrison G. Gough. 2006. The geographic distribution of big five personality traits: Patterns and profiles of human self-description across 56 nations. Journal of Research in Personality, 40(1):84–96.
- Henderson et al. (2019) Matthew Henderson, Paweł Budzianowski, Iñigo Casanueva, Sam Coope, Daniela Gerz, Girish Kumar, Nikola Mrkšić, Georgios Spithourakis, Pei-Hao Su, Ivan Vulić, and Tsung-Hsien Wen. 2019. A repository of conversational datasets. In Proceedings of the First Workshop on NLP for Conversational AI, pages 1–10, Florence, Italy. Association for Computational Linguistics.
- Huang and Paul (2019) Xiaolei Huang and Michael J. Paul. 2019. Neural user factor adaptation for text classification: Learning to generalize across author demographics. In Proceedings of the Eighth Joint Conference on Lexical and Computational Semantics (*SEM 2019), pages 136–146, Minneapolis, Minnesota. Association for Computational Linguistics.
- Iacobelli et al. (2011) Francisco Iacobelli, Alastair J. Gill, Scott Nowson, and Jon Oberlander. 2011. Large scale personality classification of bloggers. In Affective computing and intelligent interaction, pages 568–577. Springer.
- John et al. (1991) Oliver P. John, Eileen M. Donahue, and Robert L. Kentle. 1991. The Big Five Inventory–Versions 4a and 54. Berkeley, CA: University of California,Berkeley, Institute of Personality and Social Research.
- Johnson (2014) John A. Johnson. 2014. Measuring thirty facets of the five factor model with a 120-item public domain inventory: Development of the ipip-neo-120. Journal of Research in Personality, 51:78–89.
- Kincaid et al. (1975) J. Peter Kincaid, Robert P. Jr. Fishburne, Rogers Richard L., and Chissom Brad S. 1975. Derivation of New Readability Formulas (Automated Readability Index, Fog Count and Flesch Reading Ease Formula) for Navy Enlisted Personnel.
- Kosinski et al. (2015) Michal Kosinski, Sandra C. Matz, Samuel D. Gosling, Vesselin Popov, and David Stillwell. 2015. Facebook as a research tool for the social sciences: Opportunities, challenges, ethical considerations, and practical guidelines. American Psychologist, 70(6):543.
- Kosinski et al. (2013) Michal Kosinski, David Stillwell, and Thore Graepel. 2013. Private traits and attributes are predictable from digital records of human behavior. Proceedings of the National Academy of Sciences, 110(15):5802–5805.
- Kulkarni et al. (2018) Vivek Kulkarni, Margaret L Kern, David Stillwell, Michal Kosinski, Sandra Matz, Lyle Ungar, Steven Skiena, and H Andrew Schwartz. 2018. Latent human traits in the language of social media: An open-vocabulary approach. PloS one, 13(11):e0201703.
- Lee and Ashton (2018) Kibeom Lee and Michael C. Ashton. 2018. Psychometric properties of the hexaco-100. Assessment, 25(5):543–556.
- Liu et al. (2017) Pengfei Liu, Xipeng Qiu, and Xuanjing Huang. 2017. Adversarial multi-task learning for text classification. Proceedings of the 55th Annual Meeting of the Association for Computational Linguistics (Volume 1: Long Papers).
- Luyckx and Daelemans (2008) Kim Luyckx and Walter Daelemans. 2008. Personae: A corpus for author and personality prediction from text. In Proceedings of the Sixth International Conference on Language Resources and Evaluation (LREC’08), pages 2981–2987.
- Lynn et al. (2020) Veronica Lynn, Niranjan Balasubramanian, and H. Andrew Schwartz. 2020. Hierarchical modeling for user personality prediction: The role of message-level attention. In Proceedings of the 58th Annual Meeting of the Association for Computational Linguistics, pages 5306–5316, Online. Association for Computational Linguistics.
- Lynn et al. (2017) Veronica Lynn, Youngseo Son, Vivek Kulkarni, Niranjan Balasubramanian, and H. Andrew Schwartz. 2017. Human centered NLP with user-factor adaptation. In Proceedings of the 2017 Conference on Empirical Methods in Natural Language Processing, pages 1146–1155, Copenhagen, Denmark. Association for Computational Linguistics.
- Majumder et al. (2017) N. Majumder, S. Poria, A. Gelbukh, and E. Cambria. 2017. Deep learning-based document modeling for personality detection from text. IEEE Intelligent Systems, 32(2):74–79.
- McCrae and Costa (1989) Robert R. McCrae and Paul T. Costa. 1989. Reinterpreting the Myers-Briggs type indicator from the perspective of the five-factor model of personality. Journal of personality, 57(1):17–40.
- McCrae and John (1992) Robert R. McCrae and Oliver P. John. 1992. An introduction to the five‐factor model and its applications. Journal of Personality, 60(2):175–215.
- Mehl et al. (2001) Matthias R. Mehl, James W. Pennebaker, D. Michael Crow, James Dabbs, and John H. Price. 2001. The electronically activated recorder (EAR): A device for sampling naturalistic daily activities and conversations. Behavior Research Methods, Instruments, & Computers, 33(4):517–523.
- Mehta et al. (2020) Y. Mehta, S. Fatehi, A. Kazameini, C. Stachl, E. Cambria, and S. Eetemadi. 2020. Bottom-up and top-down: Predicting personality with psycholinguistic and language model features. In 2020 IEEE International Conference on Data Mining (ICDM), pages 1184–1189.
- Mehta et al. (2020) Yash Mehta, Navonil Majumder, Alexander Gelbukh, and Erik Cambria. 2020. Recent trends in deep learning based personality detection. Artificial Intelligence Review, 53:2313–2339.
- Mohammad and Turney (2013) Saif M Mohammad and Peter D Turney. 2013. Crowdsourcing a word–emotion association lexicon. Computational Intelligence, 29(3):436–465.
- Myers et al. (1990) Isabel Briggs Myers, Mary H. McCaulley, and Allen L. Hammer. 1990. Introduction to Type: A description of the theory and applications of the Myers-Briggs type indicator. Consulting Psychologists Press.
- Nguyen et al. (2016) Dong Nguyen, A. Seza Doğruöz, Carolyn P. Rosé, and Franciska de Jong. 2016. Survey: Computational sociolinguistics: A Survey. Computational Linguistics, 42(3):537–593.
- Oberlander and Gill (2006) Jon Oberlander and Alastair J. Gill. 2006. Language with character: A stratified corpus comparison of individual differences in e-mail communication. Discourse Processes, 42(3):239–270.
- Park et al. (2015) Gregory Park, H Andrew Schwartz, Johannes C Eichstaedt, Margaret L Kern, Michal Kosinski, David J. Stillwell, Lyle H. Ungar, and Martin E.P. Seligman. 2015. Automatic personality assessment through social media language. Journal of personality and social psychology, 108(6):934.
- Pedregosa et al. (2011) F. Pedregosa, G. Varoquaux, A. Gramfort, V. Michel, B. Thirion, O. Grisel, M. Blondel, P. Prettenhofer, R. Weiss, V. Dubourg, J. Vanderplas, A. Passos, D. Cournapeau, M. Brucher, M. Perrot, and E. Duchesnay. 2011. Scikit-learn: Machine learning in Python. Journal of Machine Learning Research, 12:2825–2830.
- Peersman et al. (2011) Claudia Peersman, Walter Daelemans, and Leona Van Vaerenbergh. 2011. Predicting age and gender in online social networks. In Proceedings of the 3rd international workshop on Search and mining user-generated contents, pages 37–44. ACM.
- Pennebaker et al. (2015) James W. Pennebaker, Ryan L. Boyd, Kayla Jordan, and Kate Blackburn. 2015. The development and psychometric properties of LIWC2015. Technical report.
- Pennebaker and King (1999) James W. Pennebaker and Laura A. King. 1999. Linguistic styles: Language use as an individual difference. Journal of personality and social psychology, 77(6):1296.
- Plank and Hovy (2015) Barbara Plank and Dirk Hovy. 2015. Personality traits on Twitter –or– how to get 1,500 personality tests in a week. In Proceedings of the 6th Workshop on Computational Approaches to Subjectivity, Sentiment and Social Media Analysis (WASSA 2015), pages 92–98.
- Pryzant et al. (2018) Reid Pryzant, Kelly Shen, Dan Jurafsky, and Stefan Wagner. 2018. Deconfounded lexicon induction for interpretable social science. In Proceedings of the 2018 Conference of the North American Chapter of the Association for Computational Linguistics: Human Language Technologies, Volume 1 (Long Papers), pages 1615–1625, New Orleans, Louisiana. Association for Computational Linguistic.
- Quercia et al. (2011) Daniele Quercia, Michal Kosinski, David Stillwell, and Jon Crowcroft. 2011. Our Twitter profiles, our selves: Predicting personality with Twitter. In Proceedings of 2011 IEEE International Conference on Privacy, Security, Risk and Trust (PASSAT) and IEEE International Conference on Social Computing (SocialCom), pages 180–185.
- Ramos et al. (2018) Ricelli Ramos, Georges Neto, Barbara Silva, Danielle Monteiro, Ivandré Paraboni, and Rafael Dias. 2018. Building a corpus for personality-dependent natural language understanding and generation. In Proceedings of the Eleventh International Conference on Language Resources and Evaluation (LREC 2018), Miyazaki, Japan. European Language Resources Association (ELRA).
- Rangel et al. (2015) Francisco Rangel, Paolo Rosso, Martin Potthast, Benno Stein, and Walter Daelemans. 2015. Overview of the 3rd author profiling task at PAN 2015. In CLEF 2015 labs and workshops, notebook papers, CEUR Workshop Proceedings, volume 1391.
- Rissola et al. (2019) Esteban Andres Rissola, Seyed Ali Bahrainian, and Fabio Crestani. 2019. Personality recognition in conversations using capsule neural networks. In IEEE/WIC/ACM International Conference on Web Intelligence, WI ’19, page 180–187, New York, NY, USA. Association for Computing Machinery.
- Sap et al. (2014) Maarten Sap, Gregory Park, Johannes Eichstaedt, Margaret Kern, David Stillwell, Michal Kosinski, Lyle Ungar, and Hansen Andrew Schwartz. 2014. Developing age and gender predictive lexica over social media. In Proceedings of the 2014 Conference on Empirical Methods in Natural Language Processing (EMNLP), pages 1146–1151, Doha, Qatar. Association for Computational Linguistics.
- Schmitt et al. (2007) David P. Schmitt, Juri Allik, Robert R. McCrae, and Veronica Benet-Martinez. 2007. The geographic distribution of big five personality traits: Patterns and profiles of human self-description across 56 nations. Journal of cross-cultural psychology, 38(2):173–212.
- Schmitt et al. (2008) David P. Schmitt, Anu Realo, Martin Voracek, and Juri Allik. 2008. Why can’t a man be more like a woman? sex differences in big five personality traits across 55 cultures. Journal of Personality and Social Psychology, 94(1):168–182.
- Schwartz et al. (2013) Andrew H. Schwartz, Johannes C. Eichstaedt, Margaret L. Kern, Lukasz Dziurzynski, Stephanie M. Ramones, Megha Agrawal, Achal Shah, Michal Kosinski, David Stillwell, Martin E.P. Seligman, et al. 2013. Personality, gender, and age in the language of social media: The open-vocabulary approach. PloS one, 8(9):e73791.
- Sekulic et al. (2018) Ivan Sekulic, Matej Gjurković, and Jan Šnajder. 2018. Not just depressed: Bipolar disorder prediction on Reddit. In Proceedings of the 9th Workshop on Computational Approaches to Subjectivity, Sentiment and Social Media Analysis, pages 72–78, Brussels, Belgium. Association for Computational Linguistics.
- Sekulic and Strube (2019) Ivan Sekulic and Michael Strube. 2019. Adapting deep learning methods for mental health prediction on social media. In Proceedings of the 5th Workshop on Noisy User-generated Text (W-NUT 2019), pages 322–327, Hong Kong, China. Association for Computational Linguistics.
- Soto et al. (2011) Christopher J. Soto, Oliver P. John, Samuel D. Gosling, and Jeff Potter. 2011. Age differences in personality traits from 10 to 65: Big five domains and facets in a large cross-sectional sample. Journal of Personality and Social Psychology, 100(2):330–348.
- Sun et al. (2019) Tony Sun, Andrew Gaut, Shirlyn Tang, Yuxin Huang, Mai ElSherief, Jieyu Zhao, Diba Mirza, Elizabeth Belding, Kai-Wei Chang, and William Yang Wang. 2019. Mitigating gender bias in natural language processing: Literature review. In Proceedings of the 57th Annual Meeting of the Association for Computational Linguistics, pages 1630–1640, Florence, Italy. Association for Computational Linguistics.
- Tandera et al. (2017) Tommy Tandera, Derwin Suhartono, Rini Wongso, Yen Lina Prasetio, et al. 2017. Personality prediction system from Facebook users. Procedia computer science, 116:604–611.
- Thyer (2015) Monica Thyer, Dr Bruce A.; Pignotti. 2015. Science and Pseudoscience in Social Work Practice. Springer Publishing Company.
- Tighe and Cheng (2018) Edward Tighe and Charibeth Cheng. 2018. Modeling personality traits of Filipino twitter users. In Proceedings of the Second Workshop on Computational Modeling of People’s Opinions, Personality, and Emotions in Social Media, pages 112–122, New Orleans, Louisiana, USA. Association for Computational Linguistics.
- Turcan and McKeown (2019) Elsbeth Turcan and Kathy McKeown. 2019. Dreaddit: A Reddit dataset for stress analysis in social media. In Proceedings of the Tenth International Workshop on Health Text Mining and Information Analysis (LOUHI 2019), pages 97–107, Hong Kong. Association for Computational Linguistics.
- Verhoeven et al. (2016) Ben Verhoeven, Walter Daelemans, and Barbara Plank. 2016. TwiSty: A multilingual Twitter stylometry corpus for gender and personality profiling. In Proceedings of the Tenth International Conference on Language Resources and Evaluation (LREC 2016), pages 1632–1637.
- Vu et al. (2020) Huy Vu, Suhaib Abdurahman, Sudeep Bhatia, and Lyle Ungar. 2020. Predicting responses to psychological questionnaires from participants’ social media posts and question text embeddings. In Findings of the Association for Computational Linguistics: EMNLP 2020, pages 1512–1524, Online. Association for Computational Linguistics.
- Wiegmann et al. (2019) Matti Wiegmann, Benno Stein, and Martin Potthast. 2019. Celebrity profiling. In Proceedings of the 57th Annual Meeting of the Association for Computational Linguistics, pages 2611–2618, Florence, Italy. Association for Computational Linguistics.
- Wu et al. (2020) Xiaodong Wu, Weizhe Lin, Zhilin Wang, and Elena Rastorgueva. 2020. Author2vec: A framework for generating user embedding. arXiv preprint arXiv:2003.11627.
- Xue et al. (2018) Di Xue, Lifa Wu, Zheng Hong, Shize Guo, Liang Gao, Zhiyong Wu, Xiaofeng Zhong, and Jianshan Sun. 2018. Deep learning-based personality recognition from text posts of online social networks. Applied Intelligence, pages 1–15.
- Yates et al. (2017) Andrew Yates, Arman Cohan, and Nazli Goharian. 2017. Depression and self-harm risk assessment in online forums. In Proceedings of the 2017 Conference on Empirical Methods in Natural Language Processing, pages 2968–2978, Copenhagen, Denmark. Association for Computational Linguistics.
- Zhang et al. (2017) Amy Zhang, Bryan Culbertson, and Praveen Paritosh. 2017. Characterizing online discussion using coarse discourse sequences. In 11th AAAI International Conference on Web and Social Media (ICWSM), Montreal, Canada. Association for the Advancement of Artificial Intelligence.
- Zhang et al. (2018) Brian Hu Zhang, Blake Lemoine, and Margaret Mitchell. 2018. Mitigating unwanted biases with adversarial learning. In Proceedings of the 2018 AAAI/ACM Conference on AI, Ethics, and Society, AIES ’18, pages 335–340, New York, NY, USA. ACM.
Appendix A Demographics of Pandora
| Continent | # Users | Continent | # Users |
| North America | 1299 | Africa | 4 |
| Europe | 580 | South America | 24 |
| Asia | 103 | Oceania | 85 |
| Country | # Users | Region | # Users |
| US | 1107 | US West | 208 |
| Canada | 180 | US Midwest | 153 |
| UK | 164 | US Southeast | 144 |
| Australia | 72 | US Northeast | 138 |
| Germany | 53 | US Southwest | 100 |
| Netherlands | 37 | Canada West | 50 |
| Sweden | 33 | Canada East | 44 |
| Language | # Comments |
|---|---|
| English | 16637211 |
| Spanish | 87309 |
| French | 72651 |
| Italian | 64819 |
| German | 63492 |
| Portuguese | 32037 |
| Dutch | 30219 |
| Esperanto | 19501 |
| Swedish | 16880 |
| Polish | 15134 |
Table 9 shows that most users are from English speaking countries, and regionally evenly distributed in US and Canada. For mapping states to regions, there are different regional divisions for the U.S. and Canada. We used five regions for US, and three for Canada (for one region there was no users).
Additionally, for each comment we ran fast text based language identification.121212https://fasttext.cc/docs/en/language-identification.html Table 10 shows the number of comments for top 10 languages.
Appendix B Additional Information on Personality Scores
Table 11 shows counts of all 16 MBTI types. Four MBTI types (INTP, INTJ, INFP and INFJ) account for 75 percent of all users. This indicates that there is a shift in personality distributions in contrast to the general public. Table 12 contains means and standard deviations for descriptions and percentiles of every Big 5 trait. Table 13 shows the distribution of tests and their inventories in Pandora.
| MBTI Type | Users | MBTI Type | Users |
|---|---|---|---|
| INTP | 2833 | ISTJ | 194 |
| INTJ | 1841 | ENFJ | 162 |
| INFP | 1071 | ISFP | 123 |
| INFJ | 1051 | ISFJ | 109 |
| ENTP | 627 | ESTP | 71 |
| ENFJ | 616 | ESFP | 51 |
| ISTP | 408 | ESTJ | 43 |
| ENTJ | 319 | ESFJ | 29 |
| Trait | Descriptions | Percentiles |
|---|---|---|
| Agreeableness | ||
| Openness | ||
| Conscientiousness | ||
| Extraversion | ||
| Neuroticism |
| Online test | Based on inventory | # Users | # Pred |
|---|---|---|---|
| Truity | IPIP, NEO-PI-R, | ||
| Goldberg’s (1992) | |||
| markers | 378 | 362 | |
| Understand | |||
| Myself | Big 5 Aspects | 268 | 167 |
| IPIP 120 | IPIP-NEO-120 | 120 | 83 |
| IPIP 300 | IPIP-NEO-300 | 60 | 18 |
| Personality | |||
| Assesor | BFI | 66 | 10 |
| HEXACO | HEXACO-PI-R | 49 | 1 |
| Outofservice | BFI | 38 | 11 |
| Qualtrics | – | 19 | 8 |
| 123test | IPIP-NEO, NEO-PI-R | 16 | 6 |
| Predicted | O | C | E | A | N |
|---|---|---|---|---|---|
| Enneagram 1 | .002 | .032 | –.028 | .047 | .025 |
| Enneagram 2 | –.011 | .108 | .030 | .135 | .046 |
| Enneagram 3 | .085 | .014 | .071 | –.064 | –.069 |
| Enneagram 4 | –.041 | –.017 | –.033 | .166 | .159 |
| Enneagram 5 | .067 | –.035 | –.060 | –.121 | –.076 |
| Enneagram 6 | –.051 | .004 | –.035 | .046 | .113 |
| Enneagram 7 | –.043 | –.019 | .078 | –.085 | –.088 |
| Enneagram 8 | .022 | –.044 | .063 | –.129 | –.075 |
| Enneagram 9 | –.034 | –.016 | –.102 | .041 | –.005 |
Appendix C Predicting Big 5 with MBTI/Enneagram
Here we describe in more details the setup for predicting Big 5 labels using MBTI/Enneagram labels.
We frame the experiment as a domain adaptation task of transferring MBTI/Enneagram labels to Big 5 labels, and use one of the simplest domain adaptation approaches where we use source classifier (MBTI) predictions as features and linearly interpolate them on development set containing both MBTI and Big 5 to make predictions on Big 5 target set (e.g., PRED and LININT baselines from (Daumé III, 2007)). We first partition Pandora into three subsets: comments of users for which we have both MBTI and Big 5 labels (M+B+, n=382), comments of users for which we have the MBTI but no Big 5 labels (M+B-, n=8,691), and comments of users for which we have the Big 5 but no MBTI labels (M-B+, n=1,588). We then proceed in three steps. In the first step, we train on M+B- four text-based MBTI classifiers, one for each MBTI dimension (logistic regression, optimized with 5-fold CV, using 7000 filter-selected, Tf-Idf-weighed 1–5 word and character n-grams as features).
In the second step, we use text-based MBTI classifiers to obtain MBTI labels on M+B+ (serving as domain adaptation source set), observing a type-level accuracy of 45% (82.4% for one-off prediction). The classifiers output probabilities, which can be interpreted as a score of the corresponding MBTI dimension. As majority of Big 5 traits significantly correlate with more than one MBTI dimension, we use these scores as features for training five regression models, one for each Big 5 trait (Ridge regression optimized with 5-fold CV). Additionally, we preformed a correlation analysis between Enneagram types and Big 5 traits. Results are shown in Table 14.
In the third step, we apply both classifiers on M-B+ (serving as domain adaptation target set): we first use MBTI classifiers to obtain scores for the four MBTI dimensions, and then feed these to Big 5 regression models to obtain predictions for the five traits.
Appendix D Parameters of the DL Model
The models consist of three parts: a convolutional layer, a max-pooling layer, and several fully connected (FC) layers. Convolutional kernels are as wide as BERT’s representation and slide vertically over the matrix to aggregate information from several comments. We tried different kernel sizes varying from 2 to 6, and different numbers of kernels varying from 4 to 6. Outputs of the convolutional layer are first sliced into a fixed number of slices and then subject to max pooling. This results in vectors of length per user, one for each kernel, which are passed to several FC layers with Leaky ReLU activations. Regularization (L2-norm and dropout) is applied only to FC layers.
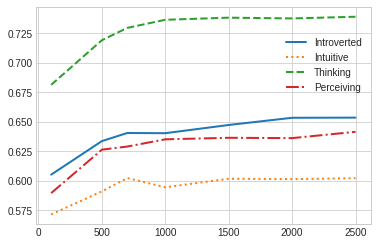
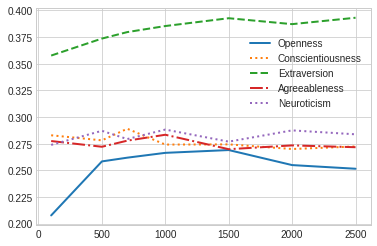
Appendix E Learning Curves for the Logistic Regression Models
Figures 2 and 3 show the learning curves for logistic regression model with 1-gram features: x-axis is the number of comments and y-axis is model’s F1-macro score. Performance plateaus at around 1000 comments, showing little significant changes when increasing the number of comments used for training beyond that amount.