X-ray spectroscopy of rare-earth nickelate LuNiO3: LDA+DMFT study
Abstract
We present a computational study of resonant inelastic x-ray scattering (RIXS) and x-ray absorption in a representative rare-earth nickelate LuNiO3. We study the changes in the spectra across the metal-insulator/site-disproportionation transition. In particular, we address the question of site-selectivity of the two methods in the disproportionated insulating phase and the signature of metal-insulator transition in the fluorescence-like feature of the RIXS spectra. To this end we use the local density approximation + dynamical mean-field theory (LDA+DMFT) approach combined with configuration integration method to compute the core-level spectra.
Core-level spectroscopies present a powerful set of tools for investigation of solids de Groot and Kotani (2014). The strong energy dependence of the x-ray absorption edges on proton number makes the contributions of different elements easy to distinguish. In fact, typical spectral shapes and eV-scale shifts allow the x-ray absorption spectroscopy (XAS) to distinguish and identify different valence states of the same element. Site-selectivity is particularly useful for investigation of disproportionation phenomena, in which inequivalent atoms of the same element appear spontaneously. A much studied example are rare-earth nickelates RNiO3, which exhibit a thermally driven simultaneous structural and metal-insulator transition accompanied by a charge disproportionation (CD) on Ni sites Lu et al. (2018); Fürsich et al. (2019); Green et al. (2016); Mazin et al. (2007); Lee et al. (2011); Park et al. (2012); Lau and Millis (2013); Johnston et al. (2014); Jaramillo et al. (2014); Subedi et al. (2015); Bisogni et al. (2016); Mercy et al. (2017); Varignon et al. (2017); Ruppen et al. (2015).
Formation of an immobile excitonic state between the core-hole and excited -electron limits the information about the ground state and its low-energy excitations that can be extracted from XAS spectra de Groot and Kotani (2014); de Groot et al. (1990). Resonant inelastic x-ray scattering (RIXS) resolves this deficiency and opens a new route to study (charge-neutral) two-particle (2P) excitations in CD materials Lu et al. (2018); Elnaggar et al. (2018, 2019); Fürsich et al. (2019). The price is the necessity of theoretical simulations to interpret the spectra arising from the complex RIXS excitation process Kotani and Shin (2001); Ament et al. (2011); de Groot and Kotani (2014). Similar to XAS, RIXS is element-selective by setting the incoming photon energy at the element-specific absorption edge. Site-selective interpretation of RIXS spectra, proposed in some CD materials Lu et al. (2018); Elnaggar et al. (2018, 2019); Fürsich et al. (2019), remains an open question.
A double peak at the Ni -edge of XAS spectra of RNiO3 was recently associated with two distinct Ni sites in the CD phase by a theoretical analysis using a double-cluster model Green et al. (2016). Bisogni . Bisogni et al. (2016) reported a high-resolution RIXS across the double-peak, which revealed an unusual coexistence of Raman-like (RL) and fluorescence-like (FL) features. The behavior of the FL feature across the transition between the CD-insulating and metallic phases was interpreted as a signature of metal-insulator transition Bisogni et al. (2016). This result, as well as site-selectivity achieved by tuning the incoming photon energy Bisogni et al. (2016); Lu et al. (2018); Fürsich et al. (2019), calls for deeper theoretical investigation.
In this Letter, we study Ni RIXS and XAS spectra of a representative nickelate LuNiO3 across the transition from paramagnetic metal (PMM) to paramagnetic insulator (PMI) at K characteristic for the RNiO3 family Catalano et al. (2018); Torrance et al. (1992); Alonso et al. (1999); Catalan (2008). To this end we use local-density approximation (LDA) + dynamical mean-field theory (DMFT) Georges et al. (1996); Kotliar et al. (2006); Kuneš et al. (2009) augmented with Anderson impurity model (AIM) description of the core-level spectra Hariki et al. (2017, 2018, 2020); Ghiasi et al. (2019); Hariki et al. (2020); Kolorenč (2018). The method provides a computationally feasible description of RIXS, which includes self-consistently coupled inequivalent Ni ions as well as the electron-hole continuum of the extended system.
The calculation proceeds in following steps Hariki et al. (2017, 2018, 2020). First, the LDA bands for high (, 533 K) and low (, 673 K) temperature structures Alonso et al. (2001) are obtained using Wien2K package Blaha et al. , and subsequently are projected onto a tight-binding model spanning Ni 3 and O 2 orbitals Kuneš et al. (2010); Mostofi et al. (2014). The bare energy of the Ni states is obtained from the LDA values by subtracting the so called double-counting correction , which accounts for the interaction present in the LDA calculation. In absence of a unique definition of Kotliar et al. (2006); Karolak et al. (2010), we treat it as a parameter Hariki et al. (2017) adjusted by comparison to the experimental valence photoemission spectra, see Fig. 1c and SM sm for details. The low-temperature structure contains two inequivalent Ni sites with long (short) Ni–O bonds, referred as LB (SB) site. The model is augmented with the local interaction within the Ni 3 shells, with the Coulomb and Hund’s parameters =(7.0 eV, 0.8 eV) adopted form previous LDA+DMFT studies Nowadnick et al. (2015); Haule and Pascut (2017). The DMFT, employing strong-coupling continuous-time quantum Monte Carlo (CT-QMC) impurity solver Werner et al. (2006); Boehnke et al. (2011); Hafermann et al. (2012); Hariki et al. (2015), is used to obtain the site-dependent hybridization function for each Ni site Georges et al. (1996); Park et al. (2012); sm . Construction of the AIM is concluded by analytic continuation of to real frequencies Jarrell and Gubernatis (1996).
Next, we augment the AIM for each Ni site with the orbitals and – interaction 111The 2-3 Coulomb parameters for the anisotropic part (, , ) de Groot and Kotani (2014); Slater (1960) are calculated by an atomic Hartree-Fock calculation. The , and values are scaled down to 75% of their actual values to simulate the effect of intra-atomic configuration interaction from higher basis configurations neglected in the atomic calculation Cowan (1981); Sugar (1972); Tanaka and Jo (1992); Matsubara et al. (2005). We fix Bocquet et al. (1992); Park et al. (1988); Hariki et al. (2017), where () is the configuration-averaged Coulomb parameter in the Ni 2–3 (3–3) interaction. The explicit form of the AIM Hamiltonian is given in SM and Refs. Hariki et al. (2017, 2018); Ghiasi et al. (2019).. The RIXS spectrum is calculated as a sum of site-contribution obtained by the Kramers-Heisenberg formula Kramers and Heisenberg (1925); de Groot and Kotani (2014) for the respective AIM
| (1) |
Here, and are eigenstates of AIM with energies and . Similarly, the XAS sectra are obtained by summing the site contributions, see SM sm . In this approach, the interference between processes on different sites is neglected.
A configuration-interaction (CI) solver is employed to compute RIXS intensities in Eq. (X-ray spectroscopy of rare-earth nickelate LuNiO3: LDA+DMFT study) Hariki et al. (2017, 2018). We used 30 bath levels per impurity spin and orbital. We checked that the CI solver reproduces well the reduced density matrix obtained by the CT-QMC simulation (with the continuum bath). We refer the reader interested in the technical details to SM sm .
| CI | CT-QMC | |||||
|---|---|---|---|---|---|---|
| Sector | LB | SB | PMM | LB | SB | PMM |
| 0.3 | 2.4 | 0.4 | 0.4 | 2.0 | 1.0 | |
| 17.9 | 34.3 | 23.2 | 17.6 | 31.1 | 25.5 | |
| 70.9 | 52.7 | 65.2 | 69.5 | 54.4 | 60.5 | |
| 10.7 | 10.3 | 11.0 | 12.2 | 12.1 | 12.5 | |
| 0.2 | 0.3 | 0.2 | 0.3 | 0.5 | 0.3 | |
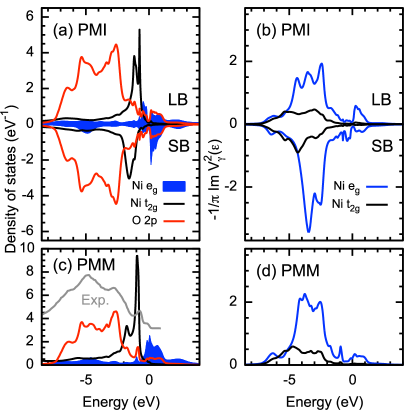
Figures 1ac show the LDA+DMFT one-particle (1P) spectral densities in the PMI and PMM phases. The gross features of the spectra in the two phases are similar spectra to one another. The Ni peak at eV and O peaks at eV and eV, corresponding to non- and anti-bonding states, respectively, match well with the experimental spectra of related nickelate LaNiO3 Eguchi et al. (2009), see Fig. 1c. The hybridization densities , the amplitude of electron hopping between the Ni orbital and the rest of the system at energy 222Since the hybridization intensity is defined via the inverse of the local Green’s function, the valence spectrum and are not proportional each other in general., are shown in Figs. 1bd. The top of the valence band (bottom of the conduction band) is dominated by Ni LB (SB) 3 states in Fig. 1a, although the total Ni -occupation is almost identical on the two sites. The stronger Ni–O bonds at the SB site pushes the anti-bonding states above , leading the sizable CD in at low energies, that is compensated by its bonding counterpart at higher energies (around eV to eV). Somewhat counter-intuitively, we find larger above for LB than for SB site, which follows from the overall low-energy behavior of reflecting the 1P spectral density on the SB site and vice versa. This behavior of the hybridization function is essential for the understanding of XAS and RIXS spectra.
Application of the CI solver to metallic systems raises questions concerning discretization of the bath in AIM, reference state of the impurity or the size of the CI basis (degree of expansion). We discuss these issues in SM. While the choice of the impurity reference state is crucial to minimize the computational effort (degree of CI expansion), we have checked that the same impurity dynamics (spectra) is obtained for different choices. In the present study we combine the spectra obtained from several impurity reference states (corresponding to different charge sectors of the discretized AIM). To benchmark the CI results, we compare the equilibrium local density matrices (abundances of different Ni valence states) obtained with CI to those from CT-QMC in Table 1. The Ni LB site is dominated by () state, expected in ionic Ni2+. The SB site exhibits pronounced charge fluctuations between () and () states. The ground state of is a spin singlet. This behavior matches well with the notion of site-selective Mott state in RNiO3 Park et al. (2012); Subedi et al. (2015); Ruppen et al. (2015).
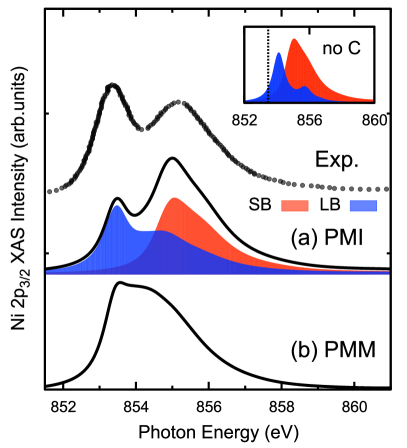
Fig. 2 shows the calculated Ni -XAS spectra in the PMI and PMM phases, together with the experimental data in the PMI phase of LuNiO3 Piamonteze et al. (2005). The experimental data exhibit a double-peak shape, composed of a sharp peak at low energy ( eV) and a broader feature in high ( eV). The LDA+DMFT spectra match the experiment quite well. Note that no by-hand alignment of LB and SB spectra was applied. The low- peak originates from a exciton on the LB side. The broader high- peak originates from the excited electron delocalized to the bath orbitals. This process is dominant on the SB site, but has a sizable contribution on the LB site as well. The delocalization of the excited electron from the LB site is facilitated by the large hybridization intensity above (Fig. 1b). This is demonstrated in the inset of Fig. 2 by setting to zero. There, the broad high- feature in the LB spectra vanishes. The small peak, that remains at eV is due to a core-valence multiplet as observed in typical Ni2+ insulators like NiO Alders et al. (1998); de Groot et al. (1990); de Groot and Kotani (2014). The overlap of the LB and SB signals limits the site-selectivity of XAS in RNiO3 nickelates.
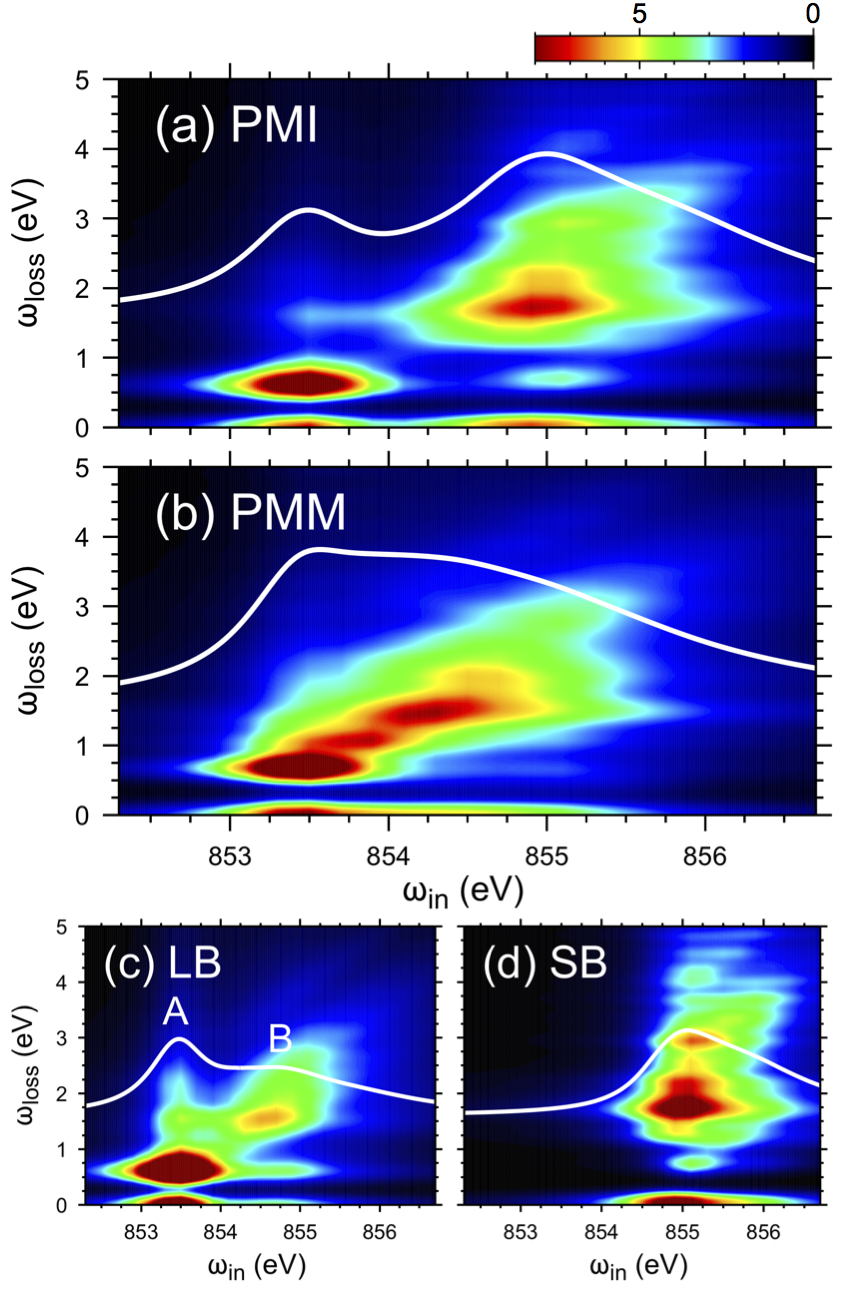
Figs. 3ab show the calculated Ni -RIXS spectra in the PMI and PMM phases, respectively. The results reproduce well the experimental observations by Bisogni . Bisogni et al. (2016): the RL feature ( 1 eV) with a constant emission energy coexists with the FL feature showing a constant behavior, i.e., a linear dependence of on . In the PMI phase, the FL intensity is slightly suppressed at between the double-peak (i.e., at around eV) compared to the one in the PMM phase, which is also observed in the experiment Bisogni et al. (2016). Figs. 3cd show the site-resolved RIXS spectra in the PMI phase. As we mentioned above, the LB -XAS consists of two features marked as (excitonic peak) and (continuum). Their different character is reflected in the -dependence of the LB RIXS spectra: RL feature (due to inter-atomic excitations) resonates mainly at , while the FL feature due to unbound electron-hole pairs gains intensity with approaching . The latter can be understood as the x-ray excited electron, which leaves the LB site in the intermediate state of RIXS, giving rise to an unbound electron-hole pair in the RIXS final state (Fig. 3c). The propensity of the excited electron to escape the TM site is encoded in the hybridization intensity above the Fermi level. The SB signals in Fig. 3d shows an intense CT excitation extending to higher in addition to a less prominent FL feature, which merges with the CT excitations at eV. The bright and (vertically) broad CT feature reflects stronger Ni–O hybridization on the SB site. Since the -peak signal from the LB site largely overlaps with the SB signal, Fig. 2, the site-selectivity cannot be achieved for the corresponding . In RNiO3, only the – excitations at the A-peak can be associated with the LB site.
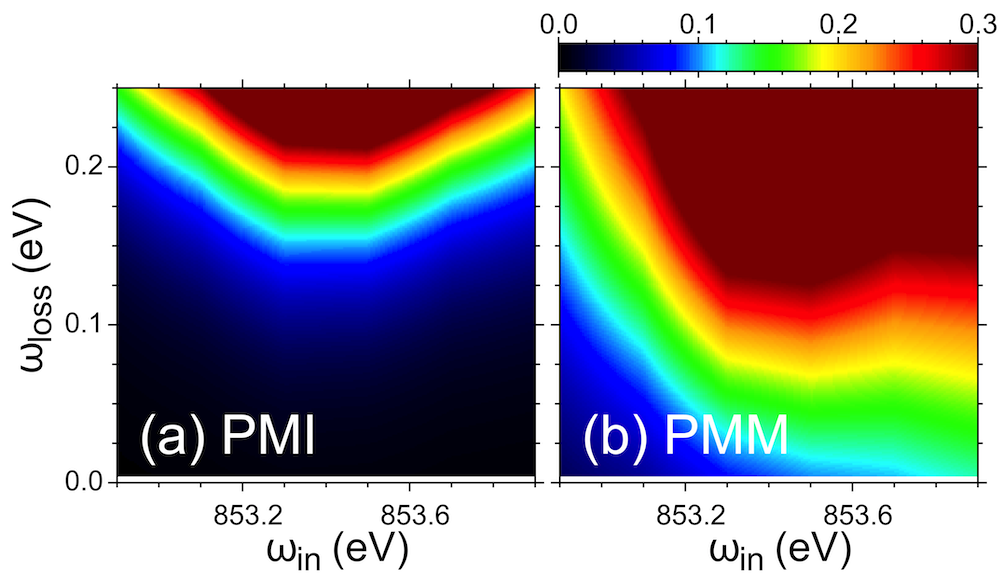
Finally, we zoom at very low to address the behavior reported in Ref. Bisogni et al., 2016. Figs. 4ab show the calculated low- RIXS spectra in the PMI phase and the PMM phase, respectively. The photon energies are set to around the main peak at the LB site. We find a significant difference, gap closing, between the CD-insulating and metallic phases, which matches the experimental observation of Bisogni Bisogni et al. (2016). Thus RIXS can be used to study reconstruction of low-energy electron-hole continuum due to metal-insulator transitions and LDA+DMFT provides an accurate description of it.
In conclusion, we have presented a computational study of XAS and RIXS across the CD/metal-insulator transition in LuNiO3. Our results show that the two peaks present in XAS spectra and reflected in RIXS of the CD insulating phase cannot be uniquely associated with the LB and SB sites. While the low-energy peak originates from the LB site, the high-energy peak combines signals from both sites. The comparison of RIXS spectra in the metallic and insulating phases shows that subtle changes of the FL feature at low can be used to identify the metal-insulator transition as proposed in Ref. Bisogni et al. (2016).
Acknowledgements.
The authors thank V. Bisogni, T. Uozumi and K. Yamagami for valuable discussions. A.H, M.W, and J.K are supported by the European Research Council (ERC) under the European Union’s Horizon 2020 research and innovation programme (Grant Agreement No. 646807-EXMAG). The calculations were performed at the Vienna Scientific Cluster (VSC).References
- de Groot and Kotani (2014) F. de Groot and A. Kotani, Core Level Spectroscopy of Solids (CRC Press, Boca Raton, FL, 2014).
- Lu et al. (2018) Y. Lu, D. Betto, K. Fürsich, H. Suzuki, H.-H. Kim, G. Cristiani, G. Logvenov, N. B. Brookes, E. Benckiser, M. W. Haverkort, G. Khaliullin, M. Le Tacon, M. Minola, and B. Keimer, Phys. Rev. X 8, 031014 (2018).
- Fürsich et al. (2019) K. Fürsich, Y. Lu, D. Betto, M. Bluschke, J. Porras, E. Schierle, R. Ortiz, H. Suzuki, G. Cristiani, G. Logvenov, N. B. Brookes, M. W. Haverkort, M. Le Tacon, E. Benckiser, M. Minola, and B. Keimer, Phys. Rev. B 99, 165124 (2019).
- Green et al. (2016) R. J. Green, M. W. Haverkort, and G. A. Sawatzky, Phys. Rev. B 94, 195127 (2016).
- Mazin et al. (2007) I. I. Mazin, D. I. Khomskii, R. Lengsdorf, J. A. Alonso, W. G. Marshall, R. M. Ibberson, A. Podlesnyak, M. J. Martínez-Lope, and M. M. Abd-Elmeguid, Phys. Rev. Lett. 98, 176406 (2007).
- Lee et al. (2011) S. Lee, R. Chen, and L. Balents, Phys. Rev. Lett. 106, 016405 (2011).
- Park et al. (2012) H. Park, A. J. Millis, and C. A. Marianetti, Phys. Rev. Lett. 109, 156402 (2012).
- Lau and Millis (2013) B. Lau and A. J. Millis, Phys. Rev. Lett. 110, 126404 (2013).
- Johnston et al. (2014) S. Johnston, A. Mukherjee, I. Elfimov, M. Berciu, and G. A. Sawatzky, Phys. Rev. Lett. 112, 106404 (2014).
- Jaramillo et al. (2014) R. Jaramillo, S. D. Ha, D. M. Silevitch, and S. Ramanathan, Nat. Phys. 10, 304 EP (2014).
- Subedi et al. (2015) A. Subedi, O. E. Peil, and A. Georges, Phys. Rev. B 91, 075128 (2015).
- Bisogni et al. (2016) V. Bisogni, S. Catalano, R. J. Green, M. Gibert, R. Scherwitzl, Y. Huang, V. N. Strocov, P. Zubko, S. Balandeh, J.-M. Triscone, G. Sawatzky, and T. Schmitt, Nat Commun. 7, 13017 (2016).
- Mercy et al. (2017) A. Mercy, J. Bieder, J. Íñiguez, and P. Ghosez, Nat. Commun. 8, 1677 (2017).
- Varignon et al. (2017) J. Varignon, M. N. Grisolia, J. Íñiguez, A. Barthélémy, and M. Bibes, npj Quant. Mat. 2, 21 (2017).
- Ruppen et al. (2015) J. Ruppen, J. Teyssier, O. E. Peil, S. Catalano, M. Gibert, J. Mravlje, J.-M. Triscone, A. Georges, and D. van der Marel, Phys. Rev. B 92, 155145 (2015).
- de Groot et al. (1990) F. M. F. de Groot, J. C. Fuggle, B. T. Thole, and G. A. Sawatzky, Phys. Rev. B 42, 5459 (1990).
- Elnaggar et al. (2018) H. Elnaggar, R. Wang, S. Lafuerza, E. Paris, A. C. Komarek, H. Guo, Y. Tseng, D. McNally, F. Frati, M. W. Haverkort, M. Sikora, T. Schmitt, and F. M. F. de Groot, (2018), arXiv:1811.04836 .
- Elnaggar et al. (2019) H. Elnaggar, P. Sainctavit, A. Juhin, S. Lafuerza, F. Wilhelm, A. Rogalev, M.-A. Arrio, C. Brouder, M. van der Linden, Z. Kakol, M. Sikora, M. W. Haverkort, P. Glatzel, and F. M. F. de Groot, Phys. Rev. Lett. 123, 207201 (2019).
- Kotani and Shin (2001) A. Kotani and S. Shin, Rev. Mod. Phys. 73, 203 (2001).
- Ament et al. (2011) L. J. P. Ament, M. van Veenendaal, T. P. Devereaux, J. P. Hill, and J. van den Brink, Rev. Mod. Phys. 83, 705 (2011).
- Catalano et al. (2018) S. Catalano, M. Gibert, J. Fowlie, J. Íñiguez, J.-M. Triscone, and J. Kreisel, Rep. on Prog. in Phys. 81, 046501 (2018).
- Torrance et al. (1992) J. B. Torrance, P. Lacorre, A. I. Nazzal, E. J. Ansaldo, and C. Niedermayer, Phys. Rev. B 45, 8209 (1992).
- Alonso et al. (1999) J. A. Alonso, M. J. Martínez-Lope, M. T. Casais, M. A. G. Aranda, and M. T. Fernández-Díaz, J. of the Am. Chem. Soc. 121, 4754 (1999).
- Catalan (2008) G. Catalan, Phase Transitions 81, 729 (2008).
- Georges et al. (1996) A. Georges, G. Kotliar, W. Krauth, and M. J. Rozenberg, Rev. Mod. Phys. 68, 13 (1996).
- Kotliar et al. (2006) G. Kotliar, S. Y. Savrasov, K. Haule, V. S. Oudovenko, O. Parcollet, and C. A. Marianetti, Rev. Mod. Phys. 78, 865 (2006).
- Kuneš et al. (2009) J. Kuneš, I. Leonov, M. Kollar, K. Byczuk, V. I. Anisimov, and D. Vollhardt, Eur. Phys. J. Spec. Top. 180, 5 (2009).
- Hariki et al. (2017) A. Hariki, T. Uozumi, and J. Kuneš, Phys. Rev. B 96, 045111 (2017).
- Hariki et al. (2018) A. Hariki, M. Winder, and J. Kuneš, Phys. Rev. Lett. 121, 126403 (2018).
- Hariki et al. (2020) A. Hariki, M. Winder, T. Uozumi, and J. Kuneš, Phys. Rev. B 101, 115130 (2020).
- Ghiasi et al. (2019) M. Ghiasi, A. Hariki, M. Winder, J. Kuneš, A. Regoutz, T.-L. Lee, Y. Hu, J.-P. Rueff, and F. M. F. de Groot, Phys. Rev. B 100, 075146 (2019).
- Kolorenč (2018) J. Kolorenč, Physica B Condens. Matter 536, 695 (2018).
- Alonso et al. (2001) J. A. Alonso, M. J. Martínez-Lope, M. T. Casais, J. L. García-Muñoz, M. T. Fernández-Díaz, and M. A. G. Aranda, Phys. Rev. B 64, 094102 (2001).
- (34) P. Blaha, K. Schwarz, G. Madsen, D. Kvasnicka, and J. Luitz, WIEN2k, An Augmented Plane Wave + Local Orbitals Program for Calculating Crystal Properties (Karlheinz Schwarz, Techn. Universitat Wien, Austria, 2001, ISBN 3-9501031-1-2).
- Kuneš et al. (2010) J. Kuneš, R. Arita, P. Wissgott, A. Toschi, H. Ikeda, and K. Held, Comput. Phys. Commun. 181, 1888 (2010).
- Mostofi et al. (2014) A. A. Mostofi, J. R. Yates, G. Pizzi, Y.-S. Lee, I. Souza, D. Vanderbilt, and N. Marzari, Comput. Phys. Commun. 185, 2309 (2014).
- Karolak et al. (2010) M. Karolak, G. Ulm, T. Wehling, V. Mazurenko, A. Poteryaev, and A. Lichtenstein, J. Electron. Spectrosc. Relat. Phenom. 181, 11 (2010).
- (38) See Supplementary Material for details of the computation, double-counting correction dependence of XAS, RIXS and 1P density of states, and hybridization function, which includes Refs. Pavarini et al. (2011); Pavarini (2014); Zaanen et al. (1986); Gunnarsson and Schönhammer (1983).
- Nowadnick et al. (2015) E. A. Nowadnick, J. P. Ruf, H. Park, P. D. C. King, D. G. Schlom, K. M. Shen, and A. J. Millis, Phys. Rev. B 92, 245109 (2015).
- Haule and Pascut (2017) K. Haule and G. L. Pascut, Scient. Rep. 7, 10375 (2017).
- Werner et al. (2006) P. Werner, A. Comanac, L. de’ Medici, M. Troyer, and A. J. Millis, Phys. Rev. Lett. 97, 076405 (2006).
- Boehnke et al. (2011) L. Boehnke, H. Hafermann, M. Ferrero, F. Lechermann, and O. Parcollet, Phys. Rev. B 84, 075145 (2011).
- Hafermann et al. (2012) H. Hafermann, K. R. Patton, and P. Werner, Phys. Rev. B 85, 205106 (2012).
- Hariki et al. (2015) A. Hariki, A. Yamanaka, and T. Uozumi, J. Phys. Soc. Jpn. 84, 073706 (2015).
- Jarrell and Gubernatis (1996) M. Jarrell and J. Gubernatis, Phys. Rep. 269, 133 (1996).
- Eguchi et al. (2009) R. Eguchi, Y. Okamoto, Z. Hiroi, S. Shin, A. Chainani, Y. Tanaka, M. Matsunami, Y. Takata, Y. Nishino, K. Tamasaku, M. Yabashi, and T. Ishikawa, Jour. of App. Phys. 105, 056103 (2009).
- Note (1) The 2-3 Coulomb parameters for the anisotropic part (, , ) de Groot and Kotani (2014); Slater (1960) are calculated by an atomic Hartree-Fock calculation. The , and values are scaled down to 75% of their actual values to simulate the effect of intra-atomic configuration interaction from higher basis configurations neglected in the atomic calculation Cowan (1981); Sugar (1972); Tanaka and Jo (1992); Matsubara et al. (2005). We fix Bocquet et al. (1992); Park et al. (1988); Hariki et al. (2017), where () is the configuration-averaged Coulomb parameter in the Ni 2–3 (3–3) interaction. The explicit form of the AIM Hamiltonian is given in SM and Refs. Hariki et al. (2017, 2018); Ghiasi et al. (2019).
- Kramers and Heisenberg (1925) H. A. Kramers and W. Heisenberg, Z. Phys. 31, 681 (1925).
- Piamonteze et al. (2005) C. Piamonteze, F. M. F. de Groot, H. C. N. Tolentino, A. Y. Ramos, N. E. Massa, J. A. Alonso, and M. J. Martínez-Lope, Phys. Rev. B 71, 020406 (2005).
- Note (2) Since the hybridization intensity is defined via the inverse of the local Green’s function, the valence spectrum and are not proportional each other in general.
- Alders et al. (1998) D. Alders, L. H. Tjeng, F. C. Voogt, T. Hibma, G. A. Sawatzky, C. T. Chen, J. Vogel, M. Sacchi, and S. Iacobucci, Phys. Rev. B 57, 11623 (1998).
- Pavarini et al. (2011) E. Pavarini, E. Koch, A. Lichtenstein, and D. E. Vollhardt, The LDA+DMFT approach to strongly correlated materials, Schriften des Forschungszentrums Jülich : Modeling and Simulation, Vol. 1 (2011) record converted from VDB: 12.11.2012.
- Pavarini (2014) E. Pavarini, “Electronic Structure Calculations with LDA+DMFT,” in Many-Electron Approaches in Physics, Chemistry and Mathematics, Mathematical Physics Studies, ISBN 978-3-319-06378-2. Springer International Publishing Switzerland, 2014, p. 321, edited by V. Bach and L. Delle Site (2014) p. 321.
- Zaanen et al. (1986) J. Zaanen, C. Westra, and G. A. Sawatzky, Phys. Rev. B 33, 8060 (1986).
- Gunnarsson and Schönhammer (1983) O. Gunnarsson and K. Schönhammer, Phys. Rev. B 28, 4315 (1983).
- Slater (1960) J. C. Slater, Quantum Theory of Atomic Structure, Volume I (McGraw-Hill, 1960).
- Cowan (1981) R. D. Cowan, The Theory of Atomic Structure and Spectra (Los Alamos Series in Basic and Applied Sciences) (University of California Press, 1981).
- Sugar (1972) J. Sugar, Phys. Rev. B 5, 1785 (1972).
- Tanaka and Jo (1992) A. Tanaka and T. Jo, J. Phys. Soc. Jpn. 61, 2040 (1992).
- Matsubara et al. (2005) M. Matsubara, T. Uozumi, A. Kotani, and J. C. Parlebas, J. Phys. Soc. Jpn. 74, 2052 (2005).
- Bocquet et al. (1992) A. E. Bocquet, T. Mizokawa, T. Saitoh, H. Namatame, and A. Fujimori, Phys. Rev. B 46, 3771 (1992).
- Park et al. (1988) J. Park, S. Ryu, M.-s. Han, and S.-J. Oh, Phys. Rev. B 37, 10867 (1988).