Gender inequities throughout STEM: Women with higher grades drop STEM majors while men persist
Abstract
Efforts to promote equity and inclusion using evidence-based approaches are vital to correct long-standing societal inequities that have disadvantaged women and discouraged them from pursuing studies, e.g., in many STEM disciplines. We use 10 years of institutional data at a large public university to investigate trends in the majors that men and women declare, drop after declaring, and earn degrees in as well as the GPA of the students who drop or earn a degree. We find that the majors with the lowest number of students also have the highest rates of attrition. Moreover, we find alarming GPA trends, e.g., women who drop majors on average earn higher grades than men who drop those majors, and in some STEM majors, women who drop the majors were earning comparable grades to men who persist in those majors. These quantitative findings call for a better understanding of the reasons students drop a major and for making learning environments equitable and inclusive.
I Introduction and Theoretical Framework
Increasingly, Science, Technology, Engineering, and Mathematics (STEM) departments across the US are focusing on using evidence to improve the learning of all students, regardless of their background and making learning environments equitable and inclusive Johnson (2012); Johnson et al. (2017); Metcalf et al. (2018); King (2016); Maltese and Tai (2011); Maltese and Cooper (2017); Means et al. (2018); Borrego et al. (2008); Borrego and Bernhard (2011); Borrego and Henderson (2014); Henderson and Dancy (2008); Dancy and Henderson (2010); Henderson et al. (2012). However, women are still severely underrepresented in many STEM disciplines National Student Clearinghouse Research Center (2015); National Science Board (2018). In order to understand the successes and shortcomings of the current state of education, the use of institutional data to investigate past and current trends is crucial. In the past few decades, institutions have been keeping increasingly large digital databases of student records. We have now reached the point where there are sufficient data available at many institutions for robust statistical analyses using data analytics that can provide invaluable information for transforming learning environments and making them more equitable and inclusive for all students Baker and Inventado (2014); Papamitsiou and Economides (2014). Studies utilizing many years of institutional data can lead to analyses that were previously limited by statistical power. This is particularly true for studies of performance and persistence in STEM programs that rely on large sample sizes Ohland et al. (2008); Lord et al. (2009); Eris et al. (2010); Maltese and Tai (2011); Min et al. (2011); Lord et al. (2015); Ohland and Long (2016); Matz et al. (2017); Witherspoon and Schunn (2019); King (2016); Safavian (2019); Maltese and Cooper (2017); Means et al. (2018).
In this study, we use 10 year institutional data from a large state-related research university to investigate how patterns of student major-declaration and subsequent degree-earning may differ for men and women. The theoretical framework for this study has two main foundations: critical theory and expectancy value theory.
Critical theories, e.g., of race and gender, focus on historical sources of inequities within society, that is, societal norms that perpetuate obstacles to the success of certain groups of disadvantaged people Gopalan and Nelson (2019); Crenshaw et al. (1995); Kellner (2003); Yosso (2005); Gutiérrez (2009); Taylor et al. (2009); Tolbert et al. (2018); Schenkel and Calabrese Barton (2020); Metcalf et al. (2018). Critical theory tells us that the dominant group in a society perpetuates these norms, which are born out of their interests, and pushes back against support systems that seek to subvert these norms Crenshaw et al. (1995); Kellner (2003); Yosso (2005). In our case, critical gender theory provides a historical perspective on the much-studied gender inequities in STEM.
Much important work has been done that relates to critical theory of gender in STEM education Johnson (2012); Johnson et al. (2017); Bang and Medin (2010); Estrada et al. (2018); Ong et al. (2018); Tolbert et al. (2018); Schenkel and Calabrese Barton (2020); Lord et al. (2009); Seron et al. (2016); Brawner et al. (2012, 2015); Metcalf et al. (2018); Ganley et al. (2018). One mechanism by which historical societal stereotypes and biases about gender can influence student choice of major is proposed by Leslie et al., who showed that disciplines with a higher attribution of “brilliance” also have a lower representation of women Leslie et al. (2015) due to pervasive stereotypes about men being “brilliant” in those disciplines. These brilliance-attributions affect all levels of STEM education, starting with early childhood where girls have already acquired these notions that girls are not as brilliant as boys Bian et al. (2017); Bian (2017), which can later influence their interest in pursuing certain STEM disciplines Bian et al. (2018a), and even affect how likely they are to be referred for employment in these disciplines in professional contexts Bian et al. (2018b).
Expectancy value theory (EVT) is another framework that is central to our investigation and states that a student’s persistence and engagement in a discipline are related to student’s expectancy about their success as well as how the student values the task Eccles (Parsons); Eccles et al. (1990); Eccles (1994). In an academic context, “expectancy,” which refers to the individual’s beliefs about their success in the discipline, is closely related to Bandura’s construct of self-efficacy, defined as one’s belief in one’s capability to succeed at a particular task or subject Bandura (1991, 1994, 1997, 1999, 2001, 2005); Eccles (Parsons); Eccles et al. (1990); Eccles (1994).
There are four main factors that influence students’ expectancy or self-efficacy, namely vicarious experiences (e.g., instructors or peers as role models), social persuasion (e.g., explicit mentoring, guidance, and support), level of anxiety Bandura (1991, 1994, 1997, 1999, 2001, 2005), and performance feedback (e.g., via grades on assessment tasks). Women generally have lower self-efficacy than men in many STEM disciplines because these four factors negatively influence them Johnson (2012); Johnson et al. (2017); Bang and Medin (2010); Estrada et al. (2018); Ong et al. (2018); Tolbert et al. (2018); Schenkel and Calabrese Barton (2020). For example, in many STEM fields women are underrepresented in their classrooms, and less likely to have a female role model among the faculty National Student Clearinghouse Research Center (2015); National Science Board (2018). Further, the stereotypes surrounding women in many STEM disciplines can affect how they are treated by mentors, even if such an effect is subconscious Astin (1993); Johnson (2012); Felder et al. (1995, 1998); Cheryan et al. (2017); Bianchini et al. (2002); Britner and Pajares (2006); Hilts et al. (2018). Moreover, women are susceptible to stress and anxiety from stereotype threat (i.e., the fear of confirming stereotypes about women in many STEM disciplines) which is not experienced by their male peers Astin (1993); Johnson (2012); Felder et al. (1995, 1998); Cheryan et al. (2017); Bianchini et al. (2002); Britner and Pajares (2006); Hilts et al. (2018). This stress and anxiety can rob them of their cognitive resources, especially during high-stakes assessments such as exams.
Expectancy can influence grades earned as well as the likelihood to persist in a program Bandura (1991, 1994, 1997, 1999, 2001, 2005). Stereotype threats that women in many STEM disciplines experience can increase anxiety in learning and test-taking situations and lead to deteriorated performance. Since anxiety can increase when performance deteriorates, these factors working against women in STEM can force them into a feedback loop and hinder their performance further, which can further lower their self-efficacy and can continue to affect future performance Bandura (1991, 1994, 1997, 1999, 2001, 2005).
In EVT, value is typically defined as having four facets: intrinsic value (i.e., interest in the task), attainment value (i.e., the importance of the task for the student’s identity), utility value (i.e., the value of the task for future goals such as career), and cost (i.e., opportunity cost or psychological effects such as stress and anxiety) Eccles (Parsons); Eccles et al. (1990); Eccles (1994). In the context of women’s enrollment and persistence in many STEM disciplines, the societal stereotypes can influence all facets of the students’ value of these STEM disciplines. Intrinsic value can be informed by societal stereotypes and brilliance-attributions of the STEM disciplines, and attainment and utility values can be further tempered by these stereotypes. Utility value is an important facet of student education in STEM, since a degree in a STEM field provides many job opportunities for graduating students. In addition, the psychological cost of majoring in these disciplines can be inflated by the stereotype threat. All of these effects can conspire to suppress the likelihood of women choosing and/or persisting in various STEM disciplines.
In order to measure the long-term effects of these systemic disadvantages, we investigate the differences in attrition rates and choices of major of men and women over the course of their studies at one large public research university using 10 years of institutional data. Since these disadvantages to students can be context-dependent, we will consider the attrition rates in many different STEM majors and non-STEM majors in order to understand the trends in each discipline.
I.1 Research Questions
Our research questions regarding the relationships between gender, degree attainment, attrition, performance and persistence pertaining to a college degree over a 10 year period are as follows.
-
RQ1.
How many students major in each discipline? How many men and women major in each discipline?
-
RQ2.
Do rates of attrition from the various majors differ? Do rates of attrition from the various majors differ for men and women?
-
RQ3.
Among those students who drop a given major, what degree, if any, do those students earn? How do these trends differ for men and women?
-
RQ4.
What fraction of declared majors ultimately earn a degree in that major in each STEM subject area? How do these trends differ for men and women?
-
RQ5.
What are the GPA trends over time among students who earn a degree in a given major and those who drop that major? How do these trends differ for men and women?
II Methodology
II.1 Sample
Using the Carnegie classification system, the university at which this study was conducted is a public, high-research doctoral university, with balanced arts and sciences and professional schools, and a large, primarily residential undergraduate population that is full-time and reasonably selective with low transfer-in from other institutions Indiana University Center for Postsecondary Research (2018).
The university provided for analysis the de-identified institutional data records of students with International Review Board approval. In this study, we examined these records for undergraduate students enrolled in two schools within the university: the School of Engineering and the School of Arts and Sciences. This sample of students includes all of those from ten cohorts who met several selection criteria, namely that the students had first enrolled at the university in a Fall semester from Fall 2005 to Fall 2014, inclusive, had provided the university with a self-reported gender, and the students had either graduated and earned a degree, or had not attended the university for at least a year as of Spring 2019. This sample of students is 49.9% female and had the following race/ethnicities: 77.7% White, 11.1% Asian, 6.8% Black, 2.5% Hispanic, and 2.0% other or multiracial.
II.2 Measures
II.2.1 Gender
In this study, we focus on gender differences in student trajectories as they progress towards degrees. We acknowledge that gender is not a binary construct, however in self-reporting their gender to the university students were given the options of “male” or “female” and so those are the two self-reported genders that we are able to analyze. The student responses to this question were included in the institutional data provided by the university. Very few students opted not to provide a gender, and so were not considered in this study. We used the answers of those students who chose either “male” (“M”) or “female” (“F”) to group students in order to calculate summary statistics on the measures described in this section.
II.2.2 Academic Performance
Measures of student academic performance were also included in the provided data. High school GPA was provided by the university on a weighted scale from 0-5 that includes adjustments to the standard 0-4 scale for Advanced Placement and International Baccalaureate courses. The data also include the grade points earned by students in each course taken at the university. Grade points are on a 0-4 scale with , , , , , where the suffixes “” and “” add or subtract, respectively, grade points (e.g., ), with the exception of which is reported as the maximum 4 grade points. The courses were categorized as either STEM or non-STEM courses, with STEM courses being those courses taken from any of the following departments: biological sciences, chemistry, computer science, economics, any engineering department, geology and environmental science, mathematics, neuroscience, physics and astronomy, and statistics. We note that for the purposes of this paper, “STEM” does not include the social sciences other than economics, which has been included due to its mathematics-intensive content.
II.2.3 Declared Major and Degree Earned
For each student, the data include their declared major(s) in each semester as well as the major(s) in which they earned a degree, if any. The data were transformed into a set of binary flags for each semester, one flag for each possible STEM major as well as psychology and a general non-STEM category for all other majors. A similar set of flags was created for the degrees earned by students. From these flags, we tabulated a number of major-specific measures in each semester, including
-
•
current number of declared majors,
-
•
number of newly declared majors from the previous semester,
-
•
number of dropped majors from the previous semester,
-
•
number of retained majors from the previous semester.
The total number of unique students that ever declared or dropped a major were also computed. The subset of students that dropped each major were further investigated and the major in which they ultimately earned a degree, if any, was determined.
Throughout this paper we group the STEM majors into two clusters: chemistry, computer science, engineering, mathematics, and physics and astronomy; and biological sciences, economics, geology and environmental science, neuroscience, and statistics. When ordering majors (i.e., in figures and tables), the majors will be presented in the order they are listed in the previous sentence (first by group, then alphabetically within each group), followed by non-STEM and psychology. Further, we group the final three STEM majors (geology and environmental science, neuroscience, and statistics) into a category labeled “Other STEM” for figures and tables. Similarly, “engineering” groups together all engineering majors for departments in the School of Engineering at the studied university. These majors include chemical, computer, civil, electrical, environmental, industrial, and mechanical engineering as well as bioengineering and materials science.
Finally, we will make use of shortened labels for the majors in figures and tables. These shortened labels are defined in Table 1.
| Major | Short Label |
|---|---|
| Chemistry | Chem |
| Computer Science | CS |
| Engineering | Engr |
| Mathematics | Math |
| Physics and Astronomy | Phys |
| Biological Sciences | Bio |
| Economics | Econ |
| Geology and | Other STEM |
| Environmental Science | |
| Neuroscience | Other STEM |
| Statistics | Other STEM |
| Non-STEM | Non-STEM |
| Psychology | Psych |
II.2.4 Year of Study
Finally, the year in which the students took each course was calculated from the students’ starting term and the term in which the course was taken. Since the sample only includes students who started in fall semesters, each “year” contains courses taken in the fall and subsequent spring semesters, with courses taken over the summer omitted from this analysis. For example, if a student first enrolled in Fall 2007, then their “first year” occurred during Fall 2007 and Spring 2008, their “second year” during Fall 2008 and Spring 2009, and so on in that fashion. If a student is missing both a fall and spring semester during a given year but subsequently returns to the university, the numbering of those post-hiatus years is reduced accordingly. If instead a student is only missing one semester during a given year, no corrections are made to the year numbering.
II.3 Analysis
For each student, we calculate their grade point average (GPA) across courses taken in each year of study from their first to sixth years. In addition, we calculate the student’s STEM GPA in each year, that is, the GPA in STEM courses alone. The mean GPA as well as the standard error of the mean is computed for various groupings of students Freedman et al. (2007).
Further, proportions of students in various groups (i.e., grouped by major and/or gender) are calculated along with the standard error of a proportion Freedman et al. (2007). In particular, the proportions we report are
-
•
the proportion of students in each major that are men or women,
-
•
the proportion of men and women, respectively, that declare each subject as a major,
-
•
the proportion of declared majors that drop the major,
-
•
the proportion of those who drop each major that earn a degree in another major, and
-
•
the proportion of all declared majors that ultimately earn a degree in that major.
III Results
III.1 Major Declaration Patterns
There are many angles with which we can approach RQ1 and investigate patterns of student major declaration. First, Fig. 1 shows the number of students that ever declared each major. This is done both overall (Fig. 1a) and for female students (Fig. 1b) and male students (Fig. 1c) separately. These results provide an important context for the upcoming analyses that may be partially explained by the number of students in each major.
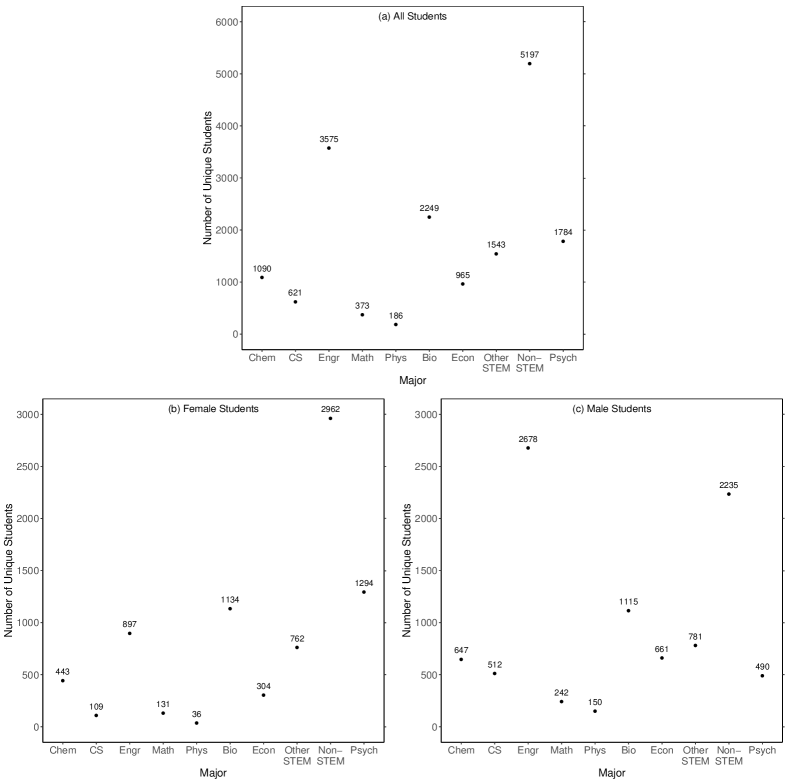
Figures 1b and 1c begin to hint at gender differences in enrollment patterns, such as a higher proportion of women majoring in non-STEM than men, or a higher proportion of men majoring in engineering than women. These gender patterns are explored further in Fig. 2 by standardizing the scales in two ways. In Fig. 2a, we consider the populations of each major separately and calculate the percentage of that population that are men or women. This provides insight into what these students might be seeing in the classes for their major. For instance, in the biological sciences there is a roughly even split, so students in biology classes for biology majors might see a classroom that is equally representative of men and women. On the other end of the spectrum, around 80% of both computer science and physics and astronomy majors are men.
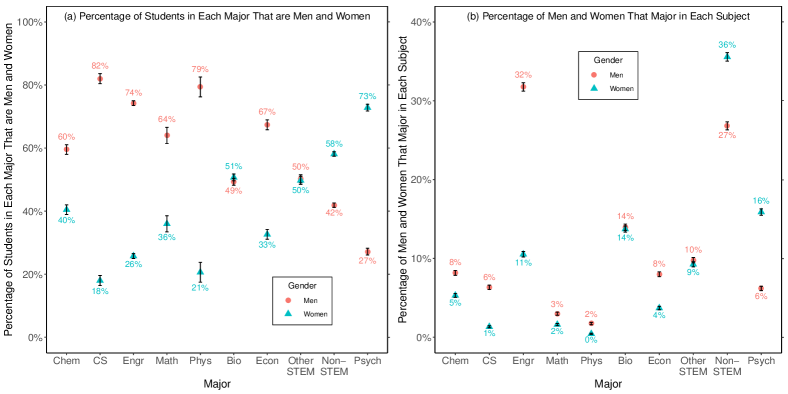
Another way to represent the population of these majors is to consider what percentage of all men or women choose each major, as seen in Fig. 2b. While the main signal of this plot mimics that of Figs. 1b and 1c, we can now see the differences noted earlier more clearly. In particular, the clearest differences in this view (Fig. 2b) are in engineering (32% of men and 11% of women declare an engineering major), non-STEM (27% of men and 36% of women declare a non-STEM major), and psychology (6% of men and 16% of women declare a psychology major).
Finally, another piece of information about enrollment patterns that is missing from Figs. 1 and 2 is when these students declare each major. Figure 3 shows, for each major, the average term in which students added the major as well as the peak term (that is, the term with the highest number of new students adding the major). As with Fig. 1, this is done separately for all students (Fig. 3a), female students (Fig. 3b), and male students (Fig. 3c).
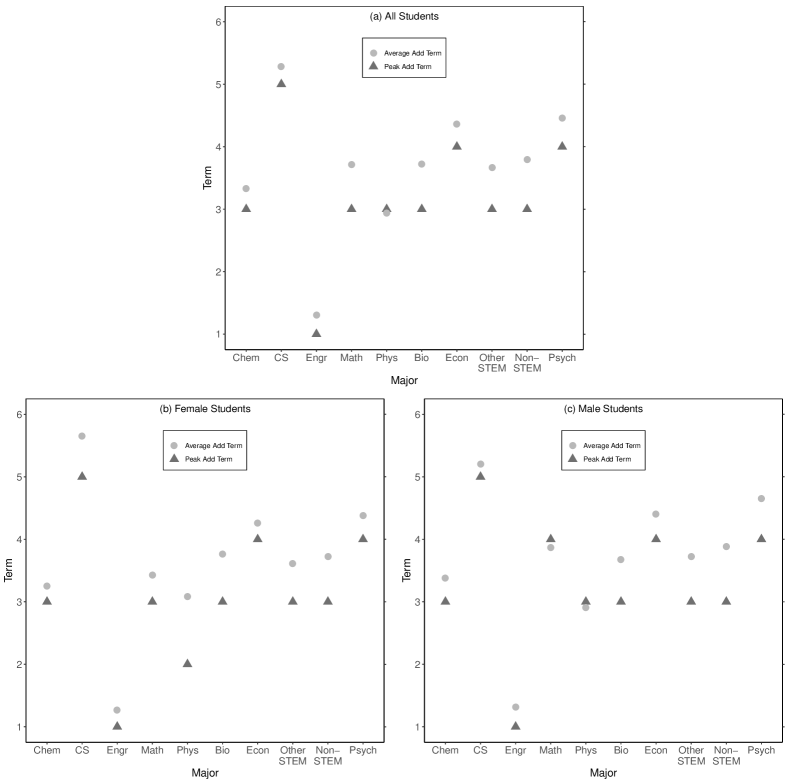
For the majority of majors in Fig. 3a, the peak of students adding the major is in the third term (that is, the start of their second year), with an average of three to four terms. Two majors, economics and psychology, depart slightly from this general trend, each with a peak in the fourth term and an average between four and five terms. Two other majors, computer science and engineering, depart more significantly from the general trend in ways that can be explained by their particular implementation at the studied university.
Engineering has a peak in the first term in Fig. 3a, with an average only slightly later. Since all students who enroll in the School of Engineering are considered “undeclared engineering” majors (the specific sub-discipline within engineering is not assigned in the first year), the majority of engineering students can be identified in their first term. Computer science instead has the latest peak term in Fig. 3a, namely in the fifth term with a slightly higher average. This is due to the structure of the computer science program at the studied university, which does not allow students to declare the major until they have completed five of the required courses for the major. These trends in engineering and computer science are important to keep in mind while considering the results presented later in this paper, since in computer science we are not able to capture attrition that occurs (of students intending to major) during the terms before a student officially declares a major. Conversely in engineering, we are able to capture almost all attrition in the first year due to the unique enrollment conditions of engineering students, which is not possible for majors within the School of Arts and Sciences (where students can declare their major at any time after the first year).
Turning then to Figs. 3b and 3c, we see almost identical trends as in Fig. 3a. The two exceptions are that the peak declaration of physics majors for women occurs one semester earlier in the second term (Fig. 3b). This is because the overall enrollment in physics is primarily in two semesters, the second and third, which happens to result in different peaks but similar averages for men and women. Similarly, the peak declaration of mathematics majors for men occurs one semester later in the fourth term (Fig. 3c), again since mathematics majors overall are most likely to declare in the third or fourth term. Apart from these minor differences, these trends in major declaration term between men and women are virtually identical.
A more detailed accounting of the number of students that enroll in each term for each major are reported in Tables 3 and 4 in Appendix A. Also, summaries of total number of unique students as well as the peak term and number of concurrent students in each major, students adding each major, and students dropping each major are available in Tables 5, 7, and 6 in Appendix B.
III.2 Attrition Rates
In order to answer RQ2, we further considered patterns of attrition rates by gender. In Fig. 4, we consider the drop rates of different subsets of students (all students, male students, and female students) in each major or group of majors. In Fig. 4a, we see that computer science, non-STEM, and psychology students are the least likely to drop their major, while physics and mathematics students are the most likely to drop. We note that the relatively low drop rate of computer science majors could be due to the late declaration of the computer science major seen in Fig. 3. That is, attrition from computer science prior to when students are allowed to declare the major is not accounted for in Fig. 4.
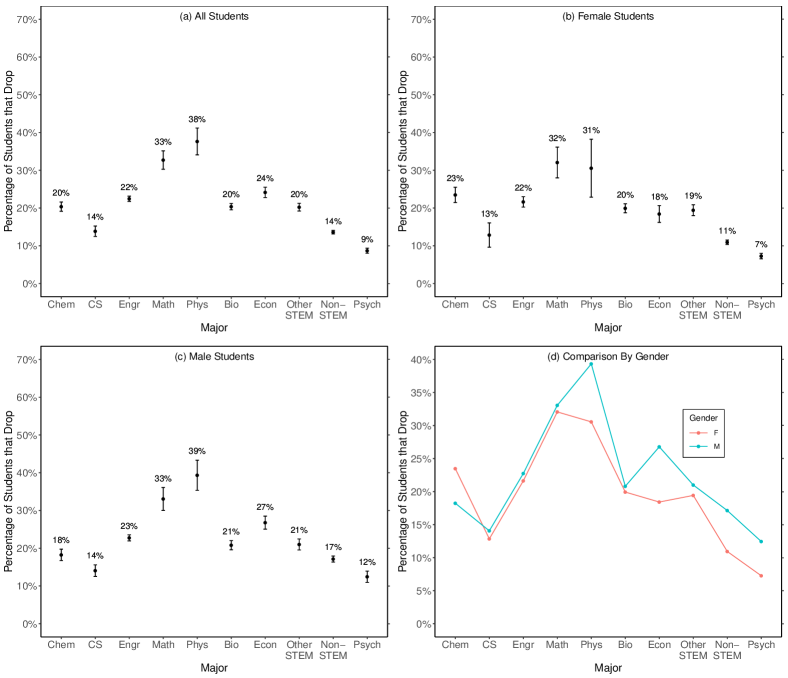
Though the patterns in each subset of students largely mimic the pattern overall in Fig. 4a, there are a few potential exceptions. Figure 4d shows the drop rates by gender without the error bars, which eases comparison between men and women, however the size of the standard error shown in Figs. 4b and 4c indicates that these differences may not be statistically significant. In particular, in physics women are less likely to drop than men, with 31% of female physics majors dropping the major (Fig. 4b) and . Similarly, only 18% of female economics majors drop that major, while 27% of male economics majors drop that major.
III.3 Trajectories of Students After Dropping a Major
After discussing how many students drop each major, we answer RQ3 by plotting in Fig. 5 where those dropped majors ended up. In particular, the major indicated in the legends of Fig. 5a and 5b shows which major was dropped, while the plot shows the percentage of those who dropped that major and ultimately earned a degree in each of the majors on the horizontal axis, including the case when“no degree” was earned. For example in Fig. 5a, we see that among the students that drop the physics major (indicated by the line color in the legend), roughly 15% of them end up earning a degree in mathematics (by looking at this line’s value above “Math” on the horizontal axis). The figure also shows that the two most common destinations for those who drop any major is either no degree or a degree in non-STEM, except for non-STEM majors who are most likely to earn no degree or a degree in psychology.
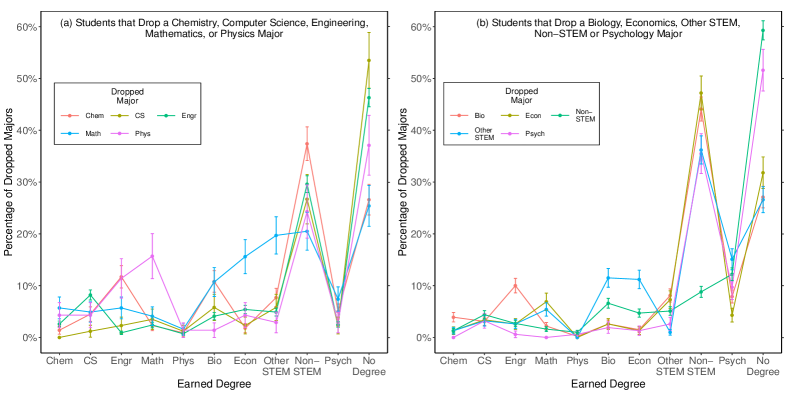
Apart from that main signal of dropped STEM majors later earning degrees in non-STEM or leaving the university without a degree, we see a few other interesting spikes. For instance, those who drop a physics major are likely to earn a degree in mathematics (Fig. 5a) and those who drop chemistry and physics (Fig. 5a) as well as biological science (Fig. 5b) are likely to earn engineering degrees. Further, those who drop from the “other STEM” category (geology and environmental science, neuroscience, and statistics) are likely to major in economics and biology (Fig. 5b). While all students who drop any major are very likely to earn no degree, the percentage of dropped majors in this category exceeds 50% for computer science (Fig. 5a), non-STEM, and psychology.
In order to further answer RQ3, Fig. 6 plots these same proportions of degrees earned by students who drop a major separately for men (Figs. 6a and 6b) and women (Figs. 6c and 6d). We see for the most part very similar patterns between men and women, with a few notable differences. For example, among students who drop a mathematics degree, we see that roughly 23% of the women eventually earn a degree in economics (Fig. 6c) compared with roughly 10% of the men (Fig. 6a). We see a similar pattern with the roles reversed among those students who drop a major in the Other STEM category (see Table 1), with roughly 18% of the men earning a degree in economics (Fig. 6b) compared with only 5% of the women (Fig. 6d).
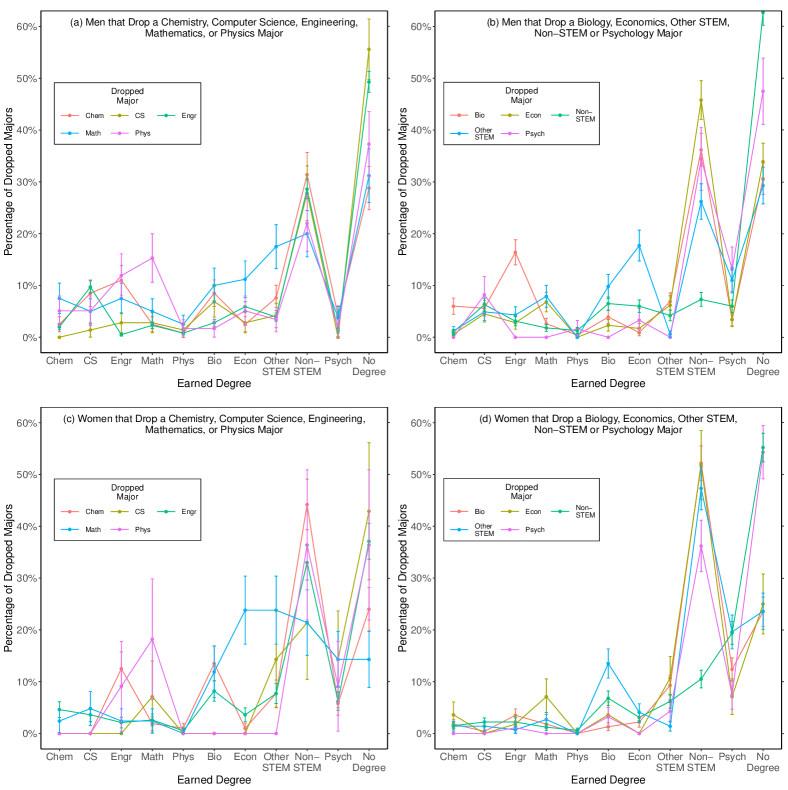
A few other examples of gender differences in the trajectories of those who drop a major are that men are more likely than women to earn computer science degrees after dropping a chemistry major (Figs. 6a and 6c), and similarly men are more likely than women to earn engineering degrees after dropping a biological science major (Figs. 6b and 6d). Finally, we note that across all of Fig. 6 in every major except psychology, the women who drop that major are more likely than the men to earn a degree in another major rather than leaving the university (that is, the women have a lower rate of earning “No Degree”).
III.4 Degree-Earning Rates
In order to answer RQ4, we investigated how many students successfully earn a degree in each major. Figure 7a shows these degree-earning rates for all students in each major, while Fig. 7b shows these rates for female students and Fig. 7c for male students. While these are broadly similar to an inverse of the drop rates in Fig. 4, since some students drop a major and subsequently declare the same major again, these degree-earning rates are a more direct measurement of persistence in a major.
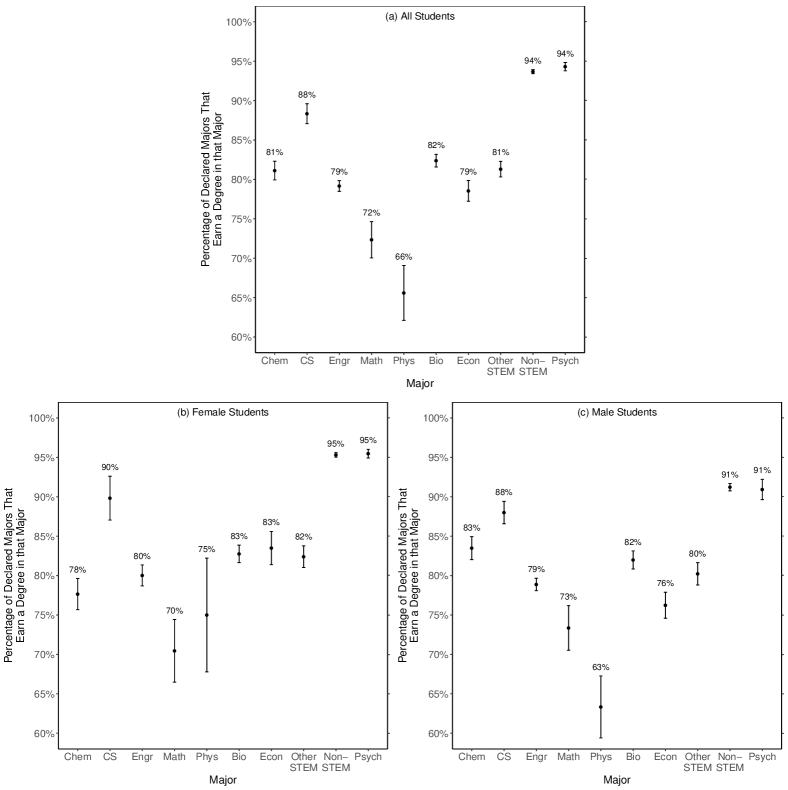
Looking first at the overall rates in Fig. 7a, there are fairly wide differences across majors, from the lowest rate in physics of about 66% to the highest in psychology and non-STEM, each at about 94%. The highest degree-earning rate in STEM occurs in computer science, with about 88% of declared computer science majors completing the degree requirements. As in Fig. 4, this can be at least partially explained by the requirements prior to declaring the major, which causes only students who have already progressed through a significant portion of the computer science curriculum to have declared a computer science major.
Considering then the differences for women (Fig. 7b) and men (Fig. 7c), we see relatively few gender differences in these degree-earning rates. While the slightly higher completion rate of women in non-STEM and psychology or men in chemistry may turn out to be statistically significant, the effect sizes appear to be small due to differences of only 4-5%. As in Fig. 4, the largest difference between men and women seen here appears to be in physics, with 75% of female physics majors earning a physics degree compared to 63% of male physics majors. However, the large error on these proportions, driven by the low sample size in physics shown in Fig. 1, makes it difficult to draw any conclusions from this gender difference in physics degree-earning rates. Similarly, women are more likely to complete a degree in economics, but again the size of the standard error prevents any conclusive statements about this difference.
Across all of Fig. 7, we note that since we have combined many majors for the “non-STEM” category, this is only a measure of the number of non-STEM majors who successfully earn a degree in any non-STEM major. That is, a student who drops one non-STEM major but earns a degree in a different non-STEM major will still be counted as having successfully earned a non-STEM degree. The same is true for the “other STEM” and “engineering” categories which also combine several majors. The high “success rates” of computer science and psychology may be due in part to the structure of their program encouraging students to declare slightly later than other disciplines, and so this measure may not be capturing attrition that happens prior to an official declaration of major (e.g., a student intending to major in a discipline decides against it before ever declaring that major). On the other hand, since all students enrolled in the engineering school are considered “undeclared engineering,” the relatively low degree-earning rate of engineering reflects attrition even from the first to the second term, which is not captured for many other majors in which most students have not yet formally declared a major in their first term. Thus, each reported degree-earning rate here is a ceiling on the true rate that would include those students who intended to major but never declared.
III.5 Mean GPA of Degree-Earners vs. Major-Droppers
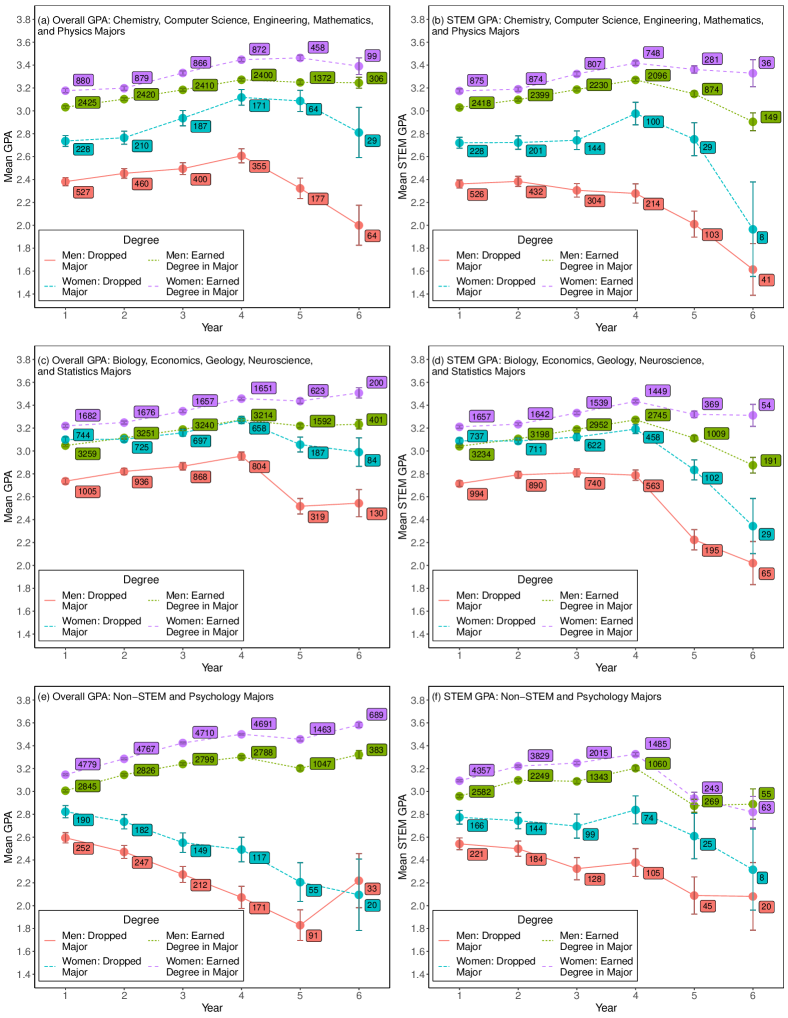
In order to further our understanding of why students may have dropped a given major and answer RQ5, Fig. 8 plots the mean GPA of students who declared different sets of majors and then either earned a degree within that set of majors or dropped those majors. Note that students who dropped a major could have gone on to earn a degree with a different major or left the university without a degree. Both overall GPA (Figs. 8a, 8c, and 8e) and STEM GPA (Figs. 8b, 8d, and 8f) are plotted. Across all of Fig. 8, the large drop in sample size from year four to five and again from five to six is primarily due to students graduating.
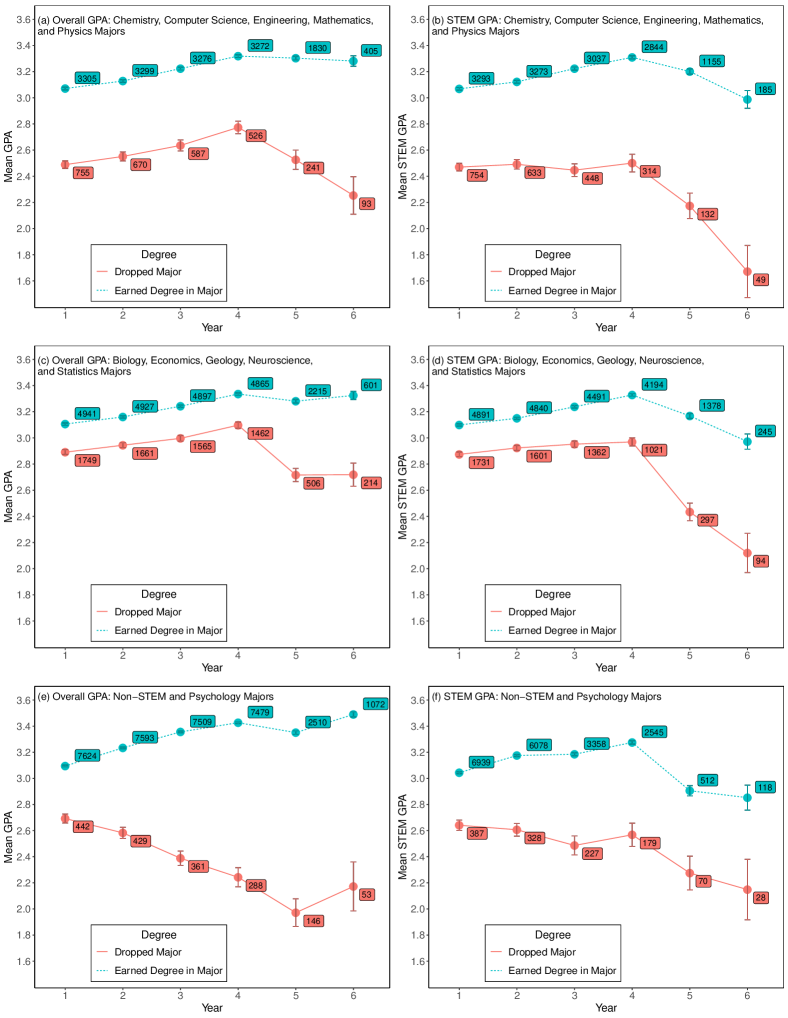
We observe that in general, the students who drop that major have a lower GPA and STEM GPA than students who earned a degree in that major. However, the difference between the two groups varies based on which cluster of majors we consider. For chemistry, computer science, engineering, mathematics, and physics and astronomy majors (Figs. 8a and 8b), those that earned a degree in this set of majors have a GPA of roughly 0.6 grade points higher than those that dropped. This is consistent through the first four years of study, and similar between overall GPA and STEM GPA. This difference in grade points represents a difference of one to two letter grades at the studied university, where, for example, the difference between a B and B is 0.25 grade points and between a B and A is 0.5 grade points. Further, the number of students dropping from this set of majors is roughly 19% of the total.
For biological science, economics, geology and environmental science, neuroscience, and statistics majors (Fig. 8c and 8d), those that earned a degree in this set of majors have a GPA of roughly 0.2 grade points higher than those that dropped, with roughly 26% of majors dropping. As with the first set of majors, this is consistent between overall GPA and STEM GPA, and across the first four years of study.
Finally, for non-STEM majors including psychology (Fig. 8e and 8f), the overall GPA disparity widens over time from roughly 0.4 grade points in the first year to roughly 1.2 grade points in the fourth year, while in STEM courses the GPA disparity rises from roughly 0.4 grade points in the first year to roughly 0.7 grade points in the fourth year. Notably, a much smaller fraction of students are dropping from this set – about 5% of the total number of students – which could be due in part to the wide net of considering all non-STEM majors.
We further consider the same measures separately for men and women in Fig. 9, with the same subfigure structure as Fig. 8. That is, overall GPA is plotted in Figs. 9a, 9c, and 9e and STEM GPA in Figs. 9b, 9d, and 9f. And students belonging to different clusters of majors are considered separately: chemistry, computer science, engineering, mathematics, and physics and astronomy majors are included in Figs. 9a and 9b; biological science, economics, geology and environmental science, neuroscience, and statistics majors in Figs. 9c and 9d; and non-STEM and psychology majors in Figs. 9e and 9f.
In all cases, the main finding is that women are earning higher grades on average than men, both among those who drop a given major and those who earn a degree in that major. However, the grade differences between men and women who dropped the major and men and women who earned a degree in the major are inconsistent. In particular, we see that during the first four years in Fig. 9b that among those who drop one of the listed STEM majors, women earn 0.4 to 0.6 grade points higher than men on average. More specifically, these women have roughly a B average while the men have a C average. Comparing this to those who earn a degree in those majors (Fig. 9b), where women earn only 0.1 to 0.2 grade points higher than men on average, we see a trend where, on average, men will drop a major if they have significantly lower grades than their peers while women are dropping their major with only somewhat lower grades than their peers.
This trend is also reflected in the overall GPA of the same population (Fig. 9a) as well as the overall and STEM GPA of the remainder of STEM majors (Figs. 9c and 9d) and non-STEM majors including psychology (Figs. 9e and 9f). The trend is even more pronounced among students in the second cluster of STEM majors where in both overall GPA (Fig. 9c) and STEM GPA (Fig. 9d), the women who drop those majors have, on average, the same GPA as the men who earn a degree in those majors.
In order to test these differences, we report in Tables 2a and 2b the results from four comparisons. We compare the STEM GPA of the women who drop each set of STEM majors (Figs. 9b and 9d) with the STEM GPA of men who both drop (Table 2a) and earn a degree (Table 2b) in the same majors. These comparisons are performed with two measures: the -value from a two-tailed -test and the effect size from Cohen’s Freedman et al. (2007); Cohen (1988). These tests were not performed for non-STEM majors since such a low percentage of the students, roughly 5%, dropped from the non-STEM majors (including psychology) altogether (Fig. 8).
Considering the STEM GPA of the first set of STEM majors in Table 2a, namely chemistry, computer science, engineering, mathematics, and physics majors (corresponding to Fig. 9b), we see again that the women who drop these majors are earning statistically significantly higher grades on average than the men who drop these majors (). Further, Cohen’s indicates a medium effect size (i.e., ) Cohen (1988), showing that the women who drop are earning meaningfully higher grades on average than the men who drop. Table 2b compares the women who drop with the men who persist and earn degrees in the majors, and we again see a statistically significant gender difference () with a “medium” effect size () Cohen (1988), now with the men having higher grades on average. Notably, the effect sizes are similar in magnitude in both tables, which is consistent with these women who drop the major having an average STEM GPA roughly midway between the men who drop and the men who persist.
We turn then to the gendered STEM GPA differences of the other group of majors in Tables 2a and 2b, namely biology, economics, geology, neuroscience, and statistics majors (corresponding to Fig. 9d). We see a similar pattern among the students who drop these majors (Table 2a) as in the other set of majors: the women earn statistically significantly higher grades on average () with a medium effect size (). However, there is a notable difference when considering the men who earn degrees in these majors. In particular, Table 2b shows that the women who drop these majors are earning on average the same grades as men who persist, with indicating only marginal statistical significance for an effect size () that does not reach the threshold for “small” effect sizes (i.e., ) Cohen (1988). Thus, the women who are dropping these majors have, on average, the same grades as the men who persist and statistically significantly higher grades than the men who drop.
IV Discussion
In this section, we will begin by discussing the general trends (i.e., setting aside the gender differences), and then follow up with a discussion of the gender differences.
IV.1 General Enrollment Patterns
Despite large differences in the number of students enrolling in different STEM disciplines at the studied university (Fig. 1a), there are broadly similar patterns of when those students declare the major (Fig. 3a), with some some exceptions (i.e., engineering and computer science due to the constraints on when a student can declare a major). However, there are notable differences in the attrition of students from the different majors (Fig. 4a), and the corresponding degree-earning rates (Fig. 7a). Notably, a few STEM disciplines stand out as having particularly high rates of attrition (or low rates of degree completion for students who declared those majors),e.g., mathematics and physics. This is consistent with the Leslie et al. study which identifies mathematics and physics as the two STEM disciplines with the highest “ability belief” (i.e., emphasis on brilliance) Leslie et al. (2015). This trend of high attrition rates is particularly problematic for mathematics and physics, since these disciplines recruit very few students in the first place (Fig. 1). Moreover, mathematics and physics are also two disciplines with deeply hierarchical knowledge structures, which could influence student decision making, e.g., whether to leave the discipline after unsatisfactory experiences in earlier courses.
IV.2 Gendered Enrollment Patterns
The most notable example of gender differences in enrollment patterns observed in our analysis is in Fig. 2. In biological science, geological and environmental science, neuroscience, and statistics we see a balanced representation of men and women. However, we see an underrepresentation of women in chemistry, computer science, engineering, mathematics, physics, and economics, and a corresponding overrepresentation of women in non-STEM including psychology (Fig. 2a). Again, the results observed here are roughly consistent with those observed by Leslie et al. Leslie et al. (2015). The gender imbalance in these STEM disciplines itself plays a pernicious role in recruitment and retention of women who do not have many role models and also affects the performance of women, who are constantly forced to prove themselves and counter the societal stereotypes working against them in these fields.
Furthermore, despite these differences in the number of men and women in these STEM disciplines, we see very few differences in the remainder of the enrollment measures, including the time of major-declaration (Figs. 3b and 3c), rates of attrition (Figs. 4b and 4c), and rates of degree-attainment (Figs. 7b and 7c). There are some hints towards differing rates of attrition in physics and economics but these differences suffer from large standard error, particularly in physics, due to a low sample size. Moreover, we hypothesize that the higher attrition rate of men in physics and economics may be due to the pressure that women experience not to enroll in these disciplines in the first place, which would have occurred prior to the declaration of majors and instead manifests in the stark underrepresentation of women in these disciplines noted earlier (Fig. 2a). There have been many studies that find highly problematic gender inequities in introductory physics and mathematics that could at least partly contribute to this underrepresentation Johnson et al. (2017); Marshman et al. (2017, 2018); Matz et al. (2017).
IV.3 Trajectories of Students Who Drop a Major
As with the attrition and degree-earning rates, we see broadly similar patterns between men and women who drop the various STEM majors (Fig. 6). One notable exceptions to this are that women who drop a mathematics major are more likely to instead earn a degree in economics than men who drop a mathematics major. Moreover, we find that across all disciplines (including non-STEM majors) except psychology, women who drop a major are more likely to subsequently earn a degree in a different major at the same university than men who drop a major (see the “No Degree” entries in Fig. 6), who are more likely to leave the university altogether, either by dropping out of college completely or transferring to another university. This may be easier to see in Tables 9 and 10 in Appendix C.
IV.4 Gendered GPA Differences
We find pervasive and deeply troubling gendered trends in the overall GPA and STEM GPA of those students who drop different STEM majors. In particular, Fig. 9 shows that the women who drop a STEM major have a higher average GPA than the men who drop a STEM major, and these differences are shown to be statistically significant as shown in Table 2a. This implies that on average, women are more likely to drop these majors with a significantly better GPA than men. In chemistry, computer science, engineering, mathematics, and physics and astronomy (Fig. 9a and 9b), the women dropping these majors have an average GPA (B to B) that is halfway between the men who drop these majors (C to B) and the men who earn degrees with these majors (B to B). This trend is even worse in biology, economics, geological and environmental science, neuroscience, and statistics (Fig. 9c and 9d), where the women who drop these majors have the same GPA as the men who earn degrees in these majors, both around B to B (see Table 2b). Thus, on average, among students with the same GPA, the women in all STEM majors are more likely to drop the majors than the men, who are more likely to persist. It is important to note that this is even true among the STEM majors with gender imbalances in the population as well as those majors without imbalances.
While it is true that women at the studied university on average earn higher grades than men in most STEM courses, that does not explain why women are choosing to drop STEM majors with the same grades as men who persist. The difference must then be coming from another source, for example inequitable and non-inclusive learning environments and lack of mentoring and support for women who may have lower self-efficacy Bandura (1991, 1994, 1997, 1999, 2001, 2005). Women may also have a lower sense of belonging and value pertaining to remaining in these disciplines Eccles (Parsons); Eccles et al. (1990); Eccles (1994); Safavian (2019) if learning environments are not equitable and inclusive, especially because they must bear the high cost of managing the burden of societal stereotypes and the ensuing stereotype threats. We hypothesize that the brilliance attributions of STEM disciplines Leslie et al. (2015) and who is likely to excel in them could influence women away from a discipline in which they could have succeeded. Thus, without explicit effort to improve the learning environments in these disciplines, the culture and stereotypes surrounding STEM in general may be creating an environment in which women are being unfairly driven out of these fields in which they could have thrived while their male counterparts are not subjected to these same pressures and are persisting with worse performance.
IV.5 Limitations and Implications
One limitation of this study is that physics which has the most consistently problematic gender differences also has the lowest number of students. Future studies can make use of more data (either data available further back in time or as more data continues to accumulate) to explore the gender differences in physics better. This study also limits its considerations to gender. Other studies with larger data sets could investigate how other underserved populations are being left behind in STEM, such as underrepresented minority students, first-generation college students, or low-income students.
A critically important extension of this work would be for other institutions of different types and sizes to do similar analyses in order to broaden the wealth of knowledge available and continue to work towards the goal of equitable and inclusive education. Other institutions noting similar highly problematic trends can help pinpoint common sources of inequities, while institutions that do not observe these trends may be able to identify how they have structured their programs to avoid these inequitable trends. Studies such as this can thus provide a framework for other institutions to perform similar analyses, and for particular departments to understand how their own trends differ from those of other departments at their own university. For instance, our findings here for, e.g., physics and mathematics drop out rates indicate that there is substantial room to improve their support of their intended majors so they do not drop out. Focus on increasing equity and inclusion in learning is especially important in the early courses for these majors, since they are fraught with problematic gender differences and may be contributing to the underrepresentation of women in these majors in the first place. Similar steps should be taken for the other majors that have low representation of women, especially computer science and engineering, and to a lesser extent chemistry.
The other STEM majors (biological sciences, economics, geology and environmental science, neuroscience, and statistics) should also take a closer look at which students are choosing to leave those disciplines, and why women choosing to leave have similar GPAs as the men who persist and earn degrees in those disciplines. These are signs of inequity even in majors in which women are not underrepresented. All of these issues should be addressed since they are critical for improving equity and inclusion in higher education STEM learning environments.
V Acknowledgments
This research is supported by the National Science Foundation Grant DUE-1524575 and the Sloan Foundation Grant G-2018-11183.
References
- Johnson (2012) A. Johnson, The mathematics of sex: How biology and society conspire to limit talented women and girls, Science Education 96, 960 (2012).
- Johnson et al. (2017) A. Johnson, M. Ong, L. T. Ko, J. Smith, and A. Hodari, Common challenges faced by women of color in physics, and actions faculty can take to minimize those challenges, The Physics Teacher 55, 356 (2017).
- Metcalf et al. (2018) H. Metcalf, D. Russell, and C. Hill, Broadening the science of broadening participation in stem through critical mixed methodologies and intersectionality frameworks, American Behavioral Scientist 62, 580 (2018), https://doi.org/10.1177/0002764218768872 .
- King (2016) B. King, Does postsecondary persistence in stem vary by gender?, AERA Open 2, 2332858416669709 (2016), https://doi.org/10.1177/2332858416669709 .
- Maltese and Tai (2011) A. V. Maltese and R. H. Tai, Pipeline persistence: Examining the association of educational experiences with earned degrees in STEM among US students, Science Education 95, 877 (2011).
- Maltese and Cooper (2017) A. V. Maltese and C. S. Cooper, Stem pathways: Do men and women differ in why they enter and exit?, AERA Open 3, 2332858417727276 (2017), https://doi.org/10.1177/2332858417727276 .
- Means et al. (2018) B. Means, H. Wang, X. Wei, E. Iwatani, and V. Peters, Broadening participation in stem college majors: Effects of attending a stem-focused high school, AERA Open 4, 2332858418806305 (2018), https://doi.org/10.1177/2332858418806305 .
- Borrego et al. (2008) M. Borrego, R. A. Streveler, R. L. Miller, and K. A. Smith, A new paradigm for a new field: Communicating representations of engineering education research, Journal of Engineering Education 97, 147 (2008).
- Borrego and Bernhard (2011) M. Borrego and J. Bernhard, The emergence of engineering education research as an internationally connected field of inquiry, Journal of Engineering Education 100, 14 (2011).
- Borrego and Henderson (2014) M. Borrego and C. Henderson, Increasing the use of evidence-based teaching in STEM higher education: A comparison of eight change strategies, Journal of Engineering Education 103, 220 (2014).
- Henderson and Dancy (2008) C. Henderson and M. H. Dancy, Physics faculty and educational researchers: Divergent expectations as barriers to the diffusion of innovations, American Journal of Physics 76, 79 (2008).
- Dancy and Henderson (2010) M. Dancy and C. Henderson, Pedagogical practices and instructional change of physics faculty, American Journal of Physics 78, 1056 (2010).
- Henderson et al. (2012) C. Henderson, M. Dancy, and M. Niewiadomska-Bugaj, Use of research-based instructional strategies in introductory physics: Where do faculty leave the innovation-decision process?, Phys. Rev. ST Phys. Educ. Res. 8, 020104 (2012).
- National Student Clearinghouse Research Center (2015) National Student Clearinghouse Research Center, Science & Engineering Degree Attainment: 2004 – 2014, (National Student Clearinghouse, 2015) available at https://nscresearchcenter.org/snapshotreport-degreeattainment15/.
- National Science Board (2018) National Science Board, Science and Engineering Indicators 2018, NSB-2018-1 (National Science Foundation, Alexandria, VA, 2018) available at https://www.nsf.gov/statistics/indicators/.
- Baker and Inventado (2014) R. S. Baker and P. S. Inventado, Educational data mining and learning analytics, in Learning Analytics (Springer, 2014) pp. 61–75.
- Papamitsiou and Economides (2014) Z. Papamitsiou and A. A. Economides, Learning analytics and educational data mining in practice: A systematic literature review of empirical evidence, Journal of Educational Technology & Society 17, 49 (2014).
- Ohland et al. (2008) M. W. Ohland, S. D. Sheppard, G. Lichtenstein, O. Eris, D. Chachra, and R. A. Layton, Persistence, engagement, and migration in engineering programs, Journal of Engineering Education 97, 259 (2008).
- Lord et al. (2009) S. M. Lord, M. M. Camacho, R. A. Layton, R. A. Long, M. W. Ohland, and M. H. Wasburn, Who’s persisting in engineering? A comparative analysis of female and male Asian, black, Hispanic, Native American, and white students, Journal of Women and Minorities in Science and Engineering 15, 167 (2009).
- Eris et al. (2010) O. Eris, D. Chachra, H. L. Chen, S. Sheppard, L. Ludlow, C. Rosca, T. Bailey, and G. Toye, Outcomes of a longitudinal administration of the persistence in engineering survey, Journal of Engineering Education 99, 371 (2010).
- Min et al. (2011) Y. Min, G. Zhang, R. A. Long, T. J. Anderson, and M. W. Ohland, Nonparametric survival analysis of the loss rate of undergraduate engineering students, Journal of Engineering Education 100, 349 (2011).
- Lord et al. (2015) S. M. Lord, R. A. Layton, and M. W. Ohland, Multi-institution study of student demographics and outcomes in electrical and computer engineering in the USA, IEEE Transactions on Education 58, 141 (2015).
- Ohland and Long (2016) M. W. Ohland and R. A. Long, The multiple-institution database for investigating engineering longitudinal development: An experiential case study of data sharing and reuse, Advances in Engineering Education 5, 1 (2016).
- Matz et al. (2017) R. L. Matz, B. P. Koester, S. Fiorini, G. Grom, L. Shepard, C. G. Stangor, B. Weiner, and T. A. McKay, Patterns of gendered performance differences in large introductory courses at five research universities, AERA Open 3, 1 (2017).
- Witherspoon and Schunn (2019) E. B. Witherspoon and C. D. Schunn, Locating and understanding the largest gender differences in pathways to science degrees, Science Education 104, 144 (2019).
- Safavian (2019) N. Safavian, What makes them persist? expectancy-value beliefs and the math participation, performance, and preparedness of hispanic youth, AERA Open 5, 2332858419869342 (2019), https://doi.org/10.1177/2332858419869342 .
- Gopalan and Nelson (2019) M. Gopalan and A. A. Nelson, Understanding the racial discipline gap in schools, AERA Open 5, 2332858419844613 (2019), https://doi.org/10.1177/2332858419844613 .
- Crenshaw et al. (1995) K. Crenshaw, N. Gotanda, G. Peller, and K. Thomas, Critical Race Theory: The Key Writings that Formed the Movement (The New Press, 1995).
- Kellner (2003) D. Kellner, Toward a critical theory of education, Democracy & Nature 9, 51 (2003).
- Yosso (2005) T. J. Yosso, Whose culture has capital? A critical race theory discussion of community cultural wealth, Race Ethnicity and Education 8, 69 (2005).
- Gutiérrez (2009) R. Gutiérrez, Framing equity: Helping students “play the game” and “change the game”, Teaching for Excellence and Equity in Mathematics 1, 4 (2009).
- Taylor et al. (2009) E. Taylor, D. Gillborn, and G. Ladson-Billings, Foundations of critical race theory in education (Routledge, 2009).
- Tolbert et al. (2018) S. Tolbert, A. Schindel, and A. J. Rodriguez, Relevance and relational responsibility in justice-oriented science education research, Science Education 102, 796 (2018).
- Schenkel and Calabrese Barton (2020) K. Schenkel and A. Calabrese Barton, Critical science agency and power hierarchies: Restructuring power within groups to address injustice beyond them, Science Education (2020).
- Bang and Medin (2010) M. Bang and D. Medin, Cultural processes in science education: Supporting the navigation of multiple epistemologies, Science Education 94, 1008 (2010).
- Estrada et al. (2018) M. Estrada, A. Eroy-Reveles, and J. Matsui, The influence of affirming kindness and community on broadening participation in STEM career pathways, Social Issues and Policy Review 12, 258 (2018).
- Ong et al. (2018) M. Ong, J. M. Smith, and L. T. Ko, Counterspaces for women of color in STEM higher education: Marginal and central spaces for persistence and success, Journal of Research in Science Teaching 55, 206 (2018).
- Seron et al. (2016) C. Seron, S. S. Silbey, E. Cech, and B. Rubineau, Persistence is cultural: Professional socialization and the reproduction of sex segregation, Work and Occupations 43, 178 (2016).
- Brawner et al. (2012) C. E. Brawner, M. M. Camacho, S. M. Lord, R. A. Long, and M. W. Ohland, Women in industrial engineering: Stereotypes, persistence, and perspectives, Journal of Engineering Education 101, 288 (2012).
- Brawner et al. (2015) C. E. Brawner, S. M. Lord, R. A. Layton, M. W. Ohland, and R. A. Long, Factors affecting women’s persistence in chemical engineering, International Journal of Engineering Education 31, 1431 (2015).
- Ganley et al. (2018) C. M. Ganley, C. E. George, J. R. Cimpian, and M. B. Makowski, Gender equity in college majors: Looking beyond the stem/non-stem dichotomy for answers regarding female participation, American Educational Research Journal 55, 453 (2018), https://doi.org/10.3102/0002831217740221 .
- Leslie et al. (2015) S.-J. Leslie, A. Cimpian, M. Meyer, and E. Freeland, Expectations of brilliance underlie gender distributions across academic disciplines, Science 347, 262 (2015).
- Bian et al. (2017) L. Bian, S.-J. Leslie, and A. Cimpian, Gender stereotypes about intellectual ability emerge early and influence children’s interests, Science 355, 389 (2017).
- Bian (2017) L. Bian, The roots of gender gaps: investigating the development of gender stereotypes about intelligence, Ph.D. thesis, University of Illinois at Urbana-Champaign (2017).
- Bian et al. (2018a) L. Bian, S.-J. Leslie, M. C. Murphy, and A. Cimpian, Messages about brilliance undermine women’s interest in educational and professional opportunities, Journal of Experimental Social Psychology 76, 404 (2018a).
- Bian et al. (2018b) L. Bian, S.-J. Leslie, and A. Cimpian, Evidence of bias against girls and women in contexts that emphasize intellectual ability, American Psychologist 73, 1139 (2018b).
- Eccles (Parsons) J. Eccles (Parsons), T. Adler, and J. Meece, Sex differences in achievement: A test of alternative theories, Journal of Personality and Social Psychology 46, 26 (1984).
- Eccles et al. (1990) J. S. Eccles, J. E. Jacobs, and R. D. Harold, Gender role stereotypes, expectancy effects, and parents’ socialization of gender differences, Journal of Social Issues 46, 183 (1990).
- Eccles (1994) J. S. Eccles, Understanding women’s educational and occupational choices: Applying the Eccles et al. model of achievement-related choices, Psychology of Women Quarterly 18, 585 (1994).
- Bandura (1991) A. Bandura, Social cognitive theory of self-regulation, Organizational Behavior and Human Decision Processes 50, 248 (1991).
- Bandura (1994) A. Bandura, Self-efficacy, in Encyclopedia of Psychology, Vol. 3, edited by R. J. Corsini (Wiley, 1994) pp. 368–369.
- Bandura (1997) A. Bandura, Self-efficacy: The Exercise of Control (Macmillan, 1997).
- Bandura (1999) A. Bandura, Social cognitive theory of personality, in Handbook of Personality, Vol. 2, edited by L. A. Pervin and O. P. John (Oxford University Press, 1999) pp. 154–196.
- Bandura (2001) A. Bandura, Social cognitive theory: An agentic perspective, Annual Review of Psychology 52, 1 (2001).
- Bandura (2005) A. Bandura, The evolution of social cognitive theory, in Great Minds in Management, edited by K. G. Smith and M. A. Hitt (Oxford University Press, 2005) pp. 9–35.
- Astin (1993) A. W. Astin, What Matters in College, Vol. 9 (Jossey-Bass, 1993).
- Felder et al. (1995) R. M. Felder, G. N. Felder, M. Mauney, C. E. Hamrin Jr., and E. J. Dietz, A longitudinal study of engineering student performance and retention. III. Gender differences in student performance and attitudes, Journal of Engineering Education 84, 151 (1995).
- Felder et al. (1998) R. M. Felder, G. N. Felder, and E. J. Dietz, A longitudinal study of engineering student performance and retention. V. Comparisons with traditionally-taught students, Journal of Engineering Education 87, 469 (1998).
- Cheryan et al. (2017) S. Cheryan, S. A. Ziegler, A. K. Montoya, and L. Jiang, Why are some STEM fields more gender balanced than others?, Psychological Bulletin 143, 1 (2017).
- Bianchini et al. (2002) J. A. Bianchini, D. J. Whitney, T. D. Breton, and B. A. Hilton-Brown, Toward inclusive science education: University scientists’ views of students, instructional practices, and the nature of science, Science Education 86, 42 (2002).
- Britner and Pajares (2006) S. L. Britner and F. Pajares, Sources of science self-efficacy beliefs of middle school students, Journal of Research in Science Teaching: The Official Journal of the National Association for Research in Science Teaching 43, 485 (2006).
- Hilts et al. (2018) A. Hilts, R. Part, and M. L. Bernacki, The roles of social influences on student competence, relatedness, achievement, and retention in STEM, Science Education 102, 744 (2018).
- Indiana University Center for Postsecondary Research (2018) Indiana University Center for Postsecondary Research, The Carnegie Classification of Institutions of Higher Education, Tech. Rep. (Indiana University Center for Postsecondary Research, Bloomington, IN, 2018).
- Freedman et al. (2007) D. Freedman, R. Pisani, and R. Purves, Statistics, 4th ed. (W. W. Norton & Co., 2007).
- R Core Team (2019) R Core Team, R: A Language and Environment for Statistical Computing, R Foundation for Statistical Computing, Vienna, Austria (2019).
- Wickham (2017) H. Wickham, tidyverse: Easily Install and Load the ‘tidyverse’ (2017), R package version 1.2.1.
- Cohen (1988) J. Cohen, Statistical Power Analysis for the Behavioral Sciences, 2nd ed. (Lawrence Erlbaum Associates, 1988).
- Marshman et al. (2017) E. Marshman, Z. Y. Kalender, C. Schunn, T. Nokes-Malach, and C. Singh, A longitudinal analysis of students’ motivational characteristics in introductory physics courses: Gender differences, Canadian Journal of Physics 96, 391 (2017).
- Marshman et al. (2018) E. M. Marshman, Z. Y. Kalender, T. Nokes-Malach, C. Schunn, and C. Singh, Female students with A’s have similar physics self-efficacy as male students with C’s in introductory courses: A cause for alarm?, Phys. Rev. Phys. Educ. Res. 14, 020123 (2018).
Appendix A: Number of Current Majors and those who Added or Dropped each Major by Term
(a) Chemistry,
| Term | Number of Majors [% of ] | ||
|---|---|---|---|
| Current | Added | Dropped | |
| 1 | 15 [1.4] | 15 [1.4] | 1 [0.1] |
| 2 | 102 [9.4] | 87 [8.0] | 1 [0.1] |
| 3 | 821 [75.3] | 724 [66.4] | 10 [0.9] |
| 4 | 912 [83.7] | 150 [13.8] | 61 [5.6] |
| 5 | 942 [86.4] | 71 [6.5] | 42 [3.9] |
| 6 | 926 [85.0] | 24 [2.2] | 41 [3.8] |
| 7 | 910 [83.5] | 14 [1.3] | 25 [2.3] |
| 8 | 884 [81.1] | 1 [0.1] | 15 [1.4] |
| 9 | 414 [38.0] | 6 [0.6] | 10 [0.9] |
| 10 | 161 [14.8] | 1 [0.1] | 7 [0.6] |
| 11 | 32 [2.9] | 0 [0.0] | 5 [0.5] |
| 12 | 16 [1.5] | 1 [0.1] | 4 [0.4] |
(c) Engineering,
| Term | Number of Majors [% of ] | ||
|---|---|---|---|
| Current | Added | Dropped | |
| 1 | 3228 [90.3] | 3228 [90.3] | 47 [1.3] |
| 2 | 2980 [83.4] | 14 [0.4] | 262 [7.3] |
| 3 | 2968 [83.0] | 159 [4.4] | 171 [4.8] |
| 4 | 2902 [81.2] | 55 [1.5] | 121 [3.4] |
| 5 | 2902 [81.2] | 64 [1.8] | 64 [1.8] |
| 6 | 2901 [81.1] | 27 [0.8] | 28 [0.8] |
| 7 | 2881 [80.6] | 21 [0.6] | 40 [1.1] |
| 8 | 2847 [79.6] | 5 [0.1] | 25 [0.7] |
| 9 | 1609 [45.0] | 4 [0.1] | 15 [0.4] |
| 10 | 636 [17.8] | 1 [0.0] | 15 [0.4] |
| 11 | 114 [3.2] | 0 [0.0] | 8 [0.2] |
| 12 | 49 [1.4] | 0 [0.0] | 7 [0.2] |
(b) Computer Science,
| Term | Number of Majors [% of ] | ||
|---|---|---|---|
| Current | Added | Dropped | |
| 1 | 1 [0.2] | 1 [0.2] | 0 [0.0] |
| 2 | 20 [3.2] | 19 [3.1] | 0 [0.0] |
| 3 | 100 [16.1] | 81 [13.0] | 1 [0.2] |
| 4 | 214 [34.5] | 116 [18.7] | 5 [0.8] |
| 5 | 395 [63.6] | 188 [30.3] | 8 [1.3] |
| 6 | 459 [73.9] | 74 [11.9] | 10 [1.6] |
| 7 | 502 [80.8] | 65 [10.5] | 17 [2.7] |
| 8 | 495 [79.7] | 27 [4.3] | 12 [1.9] |
| 9 | 241 [38.8] | 37 [6.0] | 10 [1.6] |
| 10 | 147 [23.7] | 11 [1.8] | 11 [1.8] |
| 11 | 69 [11.1] | 2 [0.3] | 10 [1.6] |
| 12 | 36 [5.8] | 2 [0.3] | 2 [0.3] |
(d) Mathematics,
| Term | Number of Majors [% of ] | ||
|---|---|---|---|
| Current | Added | Dropped | |
| 1 | 24 [6.4] | 24 [6.4] | 0 [0.0] |
| 2 | 91 [24.4] | 68 [18.2] | 1 [0.3] |
| 3 | 185 [49.6] | 102 [27.3] | 10 [2.7] |
| 4 | 259 [69.4] | 95 [25.5] | 23 [6.2] |
| 5 | 270 [72.4] | 36 [9.7] | 26 [7] |
| 6 | 286 [76.7] | 27 [7.2] | 13 [3.5] |
| 7 | 278 [74.5] | 14 [3.8] | 15 [4.0] |
| 8 | 264 [70.8] | 4 [1.1] | 13 [3.5] |
| 9 | 81 [21.7] | 8 [2.1] | 9 [2.4] |
| 10 | 61 [16.4] | 1 [0.3] | 2 [0.5] |
| 11 | 18 [4.8] | 1 [0.3] | 6 [1.6] |
| 12 | 7 [1.9] | 0 [0.0] | 4 [1.1] |
(e) Physics & Astronomy,
| Term | Number of Majors [% of ] | ||
|---|---|---|---|
| Current | Added | Dropped | |
| 1 | 17 [9.1] | 17 [9.1] | 0 [0.0] |
| 2 | 74 [39.8] | 58 [31.2] | 1 [0.5] |
| 3 | 124 [66.7] | 62 [33.3] | 14 [7.5] |
| 4 | 151 [81.2] | 34 [18.3] | 8 [4.3] |
| 5 | 148 [79.6] | 8 [4.3] | 12 [6.5] |
| 6 | 144 [77.4] | 4 [2.2] | 8 [4.3] |
| 7 | 134 [72.0] | 2 [1.1] | 12 [6.5] |
| 8 | 128 [68.8] | 1 [0.5] | 6 [3.2] |
| 9 | 46 [24.7] | 1 [0.5] | 4 [2.2] |
| 10 | 38 [20.4] | 0 [0.0] | 2 [1.1] |
| 11 | 3 [1.6] | 0 [0.0] | 1 [0.5] |
| 12 | 1 [0.5] | 0 [0.0] | 2 [1.1] |
(a) Biological Sciences,
| Term | Number of Majors [% of ] | ||
|---|---|---|---|
| Current | Added | Dropped | |
| 1 | 17 [0.8] | 17 [0.8] | 0 [0.0] |
| 2 | 69 [3.1] | 54 [2.4] | 3 [0.1] |
| 3 | 1224 [54.4] | 1159 [51.5] | 12 [0.5] |
| 4 | 1730 [76.9] | 582 [25.9] | 88 [3.9] |
| 5 | 1968 [87.5] | 311 [13.8] | 84 [3.7] |
| 6 | 1960 [87.1] | 71 [3.2] | 85 [3.8] |
| 7 | 1910 [84.9] | 44 [2.0] | 76 [3.4] |
| 8 | 1824 [81.1] | 11 [0.5] | 49 [2.2] |
| 9 | 354 [15.7] | 7 [0.3] | 34 [1.5] |
| 10 | 225 [10.0] | 2 [0.1] | 16 [0.7] |
| 11 | 41 [1.8] | 1 [0.0] | 6 [0.3] |
| 12 | 13 [0.6] | 0 [0.0] | 5 [0.2] |
(c) Psychology,
| Term | Number of Majors [% of ] | ||
|---|---|---|---|
| Current | Added | Dropped | |
| 1 | 6 [0.3] | 6 [0.3] | 0 [0.0] |
| 2 | 62 [3.5] | 56 [3.1] | 0 [0.0] |
| 3 | 404 [22.6] | 343 [19.2] | 4 [0.2] |
| 4 | 1011 [56.7] | 620 [34.8] | 25 [1.4] |
| 5 | 1446 [81.1] | 458 [25.7] | 23 [1.3] |
| 6 | 1594 [89.3] | 174 [9.8] | 29 [1.6] |
| 7 | 1657 [92.9] | 95 [5.3] | 13 [0.7] |
| 8 | 1552 [87.0] | 23 [1.3] | 28 [1.6] |
| 9 | 265 [14.9] | 18 [1.0] | 12 [0.7] |
| 10 | 138 [7.7] | 4 [0.2] | 10 [0.6] |
| 11 | 32 [1.8] | 0 [0.0] | 6 [0.3] |
| 12 | 16 [0.9] | 0 [0.0] | 5 [0.3] |
(b) Economics,
| Term | Number of Majors [% of ] | ||
|---|---|---|---|
| Current | Added | Dropped | |
| 1 | 17 [1.8] | 17 [1.8] | 0 [0.0] |
| 2 | 104 [10.8] | 89 [9.2] | 5 [0.5] |
| 3 | 306 [31.7] | 210 [21.8] | 9 [0.9] |
| 4 | 562 [58.2] | 271 [28.1] | 22 [2.3] |
| 5 | 708 [73.4] | 175 [18.1] | 31 [3.2] |
| 6 | 766 [79.4] | 89 [9.2] | 33 [3.4] |
| 7 | 766 [79.4] | 70 [7.3] | 53 [5.5] |
| 8 | 717 [74.3] | 28 [2.9] | 30 [3.1] |
| 9 | 183 [19.0] | 12 [1.2] | 22 [2.3] |
| 10 | 92 [9.5] | 4 [0.4] | 15 [1.6] |
| 11 | 34 [3.5] | 4 [0.4] | 4 [0.4] |
| 12 | 11 [1.1] | 0 [0.0] | 9 [0.9] |
(d) Other STEM,
| Term | Number of Majors [% of ] | ||
|---|---|---|---|
| Current | Added | Dropped | |
| 1 | 16 [1.0] | 16 [1.0] | 0 [0.0] |
| 2 | 143 [9.3] | 128 [8.3] | 4 [0.3] |
| 3 | 781 [50.6] | 648 [42.0] | 13 [0.8] |
| 4 | 1212 [78.5] | 476 [30.8] | 52 [3.4] |
| 5 | 1345 [87.2] | 188 [12.2] | 58 [3.8] |
| 6 | 1333 [86.4] | 42 [2.7] | 56 [3.6] |
| 7 | 1284 [83.2] | 27 [1.7] | 56 [3.6] |
| 8 | 1222 [79.2] | 9 [0.6] | 23 [1.5] |
| 9 | 263 [17.0] | 9 [0.6] | 19 [1.2] |
| 10 | 135 [8.7] | 0 [0.0] | 14 [0.9] |
| 11 | 36 [2.3] | 1 [0.1] | 6 [0.4] |
| 12 | 12 [0.8] | 0 [0.0] | 11 [0.7] |
(e) Non-STEM,
| Term | Number of Majors [% of ] | ||
|---|---|---|---|
| Current | Added | Dropped | |
| 1 | 259 [5.0] | 259 [5.0] | 1 [0.0] |
| 2 | 1038 [20.0] | 811 [15.6] | 41 [0.8] |
| 3 | 2502 [48.1] | 1507 [29] | 51 [1.0] |
| 4 | 3600 [69.3] | 1186 [22.8] | 110 [2.1] |
| 5 | 4225 [81.3] | 759 [14.6] | 84 [1.6] |
| 6 | 4437 [85.4] | 308 [5.9] | 70 [1.3] |
| 7 | 4449 [85.6] | 221 [4.3] | 113 [2.2] |
| 8 | 4201 [80.8] | 109 [2.1] | 110 [2.1] |
| 9 | 818 [15.7] | 45 [0.9] | 68 [1.3] |
| 10 | 454 [8.7] | 11 [0.2] | 32 [0.6] |
| 11 | 115 [2.2] | 5 [0.1] | 15 [0.3] |
| 12 | 58 [1.1] | 3 [0.1] | 12 [0.2] |
Appendix B: Summary Tables Pertaining to different Declared Majors
| All Students | Unique | Peak Concurrent | Peak Added | Peak Dropped |
|---|---|---|---|---|
| Major | Majors | Majors [Term] | Majors [Term] | Majors [Term] |
| Biological Sciences | 2249 | 1968 [5] | 1159 [3] | 88 [4] |
| Chemistry | 1090 | 942 [5] | 724 [3] | 61 [4] |
| Computer Science | 621 | 502 [7] | 188 [5] | 17 [7] |
| Economics | 965 | 766 [7] | 271 [4] | 53 [7] |
| Engineering | 3575 | 3228 [1] | 3228 [1] | 262 [2] |
| Mathematics | 373 | 286 [6] | 102 [3] | 26 [5] |
| Physics and Astronomy | 186 | 151 [4] | 62 [3] | 14 [3] |
| Psychology | 1784 | 1657 [7] | 620 [4] | 29 [6] |
| Other STEM | 1543 | 1345 [5] | 648 [3] | 58 [5] |
| Non-STEM | 5197 | 4449 [7] | 1507 [3] | 113 [7] |
| Men Only | Unique | Peak Concurrent | Peak Added | Peak Dropped |
|---|---|---|---|---|
| Major | Majors | Majors [Term] | Majors [Term] | Majors [Term] |
| Biological Sciences | 1115 | 962 [6] | 620 [3] | 52 [4] |
| Chemistry | 647 | 567 [6] | 434 [3] | 28 [4] |
| Computer Science | 512 | 413 [7] | 156 [5] | 14 [7] |
| Economics | 661 | 514 [7] | 189 [4] | 36 [7] |
| Engineering | 2678 | 2410 [1] | 2410 [1] | 189 [2] |
| Mathematics | 242 | 185 [6] | 59 [4] | 13 [5] |
| Physics and Astronomy | 150 | 124 [4] | 54 [3] | 11 [7] |
| Psychology | 490 | 447 [7] | 141 [4] | 14 [8] |
| Other STEM | 781 | 678 [5] | 320 [3] | 38 [7] |
| Non-STEM | 2235 | 1853 [7] | 613 [3] | 63 [7] |
| Women Only | Unique | Peak Concurrent | Peak Added | Peak Dropped |
|---|---|---|---|---|
| Major | Majors | Majors [Term] | Majors [Term] | Majors [Term] |
| Biological Sciences | 1134 | 1013 [5] | 539 [3] | 53 [6] |
| Chemistry | 443 | 377 [5] | 290 [3] | 33 [4] |
| Computer Science | 109 | 89 [7] | 32 [5] | 3 [7] |
| Economics | 304 | 252 [7] | 82 [4] | 17 [7] |
| Engineering | 897 | 818 [1] | 818 [1] | 73 [2] |
| Mathematics | 131 | 101 [6] | 47 [3] | 13 [5] |
| Physics and Astronomy | 36 | 28 [6] | 13 [2] | 4 [3] |
| Psychology | 1294 | 1210 [7] | 479 [4] | 20 [6] |
| Other STEM | 762 | 667 [5] | 328 [3] | 34 [5] |
| Non-STEM | 2962 | 2596 [7] | 894 [3] | 56 [4] |
Appendix C: Degrees Earned by Students who Dropped a Major
| All Students | % of in a Given Major That Subsequently Earned Degree in Each Major | |||||||||||
|---|---|---|---|---|---|---|---|---|---|---|---|---|
| Other | Non- | No | ||||||||||
| Major | Bio | Chem | CS | Econ | Engr | Math | Phys | Psych | STEM | STEM | Degree | |
| Biological Sciences | 458 | 2.6 | 3.9 | 3.1 | 1.5 | 10.0 | 2.2 | 0.2 | 7.9 | 8.1 | 44.1 | 27.1 |
| Chemistry | 222 | 10.8 | 1.4 | 4.5 | 1.8 | 11.7 | 2.3 | 0.9 | 5.0 | 7.7 | 37.4 | 26.6 |
| Computer Science | 86 | 5.8 | 0.0 | 1.2 | 2.3 | 2.3 | 3.5 | 1.2 | 2.3 | 5.8 | 26.7 | 53.5 |
| Economics | 233 | 2.6 | 1.3 | 3.4 | 1.3 | 2.6 | 6.9 | 0.0 | 4.3 | 7.3 | 47.2 | 31.8 |
| Engineering | 803 | 4.1 | 2.6 | 8.2 | 5.4 | 0.9 | 2.4 | 0.7 | 2.5 | 4.9 | 29.6 | 46.3 |
| Mathematics | 122 | 10.7 | 5.7 | 4.9 | 15.6 | 5.7 | 4.1 | 1.6 | 7.4 | 19.7 | 20.5 | 25.4 |
| Physics and Astronomy | 70 | 1.4 | 4.3 | 4.3 | 4.3 | 11.4 | 15.7 | 1.4 | 2.9 | 2.9 | 24.3 | 37.1 |
| Psychology | 155 | 1.9 | 0.0 | 3.2 | 1.3 | 0.6 | 0.0 | 0.6 | 9.7 | 2.6 | 35.5 | 51.6 |
| Other STEM | 312 | 11.5 | 1.3 | 3.2 | 11.2 | 2.6 | 5.4 | 0.0 | 15.1 | 1.0 | 36.2 | 26.6 |
| Non-STEM | 707 | 6.6 | 1.3 | 4.4 | 4.7 | 2.7 | 1.6 | 1.0 | 12.2 | 5.1 | 8.8 | 59.3 |
| Men Only | % of in a Given Major That Subsequently Earned Degree in Each Major | |||||||||||
|---|---|---|---|---|---|---|---|---|---|---|---|---|
| Other | Non- | No | ||||||||||
| Major | Bio | Chem | CS | Econ | Engr | Math | Phys | Psych | STEM | STEM | Degree | |
| Biological Sciences | 232 | 3.9 | 6.0 | 5.6 | 0.9 | 16.4 | 2.6 | 0.4 | 3.4 | 6.9 | 36.2 | 30.6 |
| Chemistry | 118 | 8.5 | 2.5 | 8.5 | 2.5 | 11.0 | 2.5 | 0.8 | 4.2 | 7.6 | 31.4 | 28.8 |
| Computer Science | 72 | 6.9 | 0.0 | 1.4 | 2.8 | 2.8 | 2.8 | 1.4 | 0.0 | 4.2 | 27.8 | 55.6 |
| Economics | 177 | 2.3 | 0.6 | 4.5 | 1.7 | 2.8 | 6.8 | 0.0 | 3.4 | 6.2 | 45.8 | 33.9 |
| Engineering | 609 | 2.8 | 2.0 | 9.7 | 5.9 | 0.5 | 2.3 | 0.8 | 1.3 | 3.9 | 28.6 | 49.3 |
| Mathematics | 80 | 10.0 | 7.5 | 5.0 | 11.2 | 7.5 | 5.0 | 2.5 | 3.8 | 17.5 | 20.0 | 31.2 |
| Physics and Astronomy | 59 | 1.7 | 5.1 | 5.1 | 5.1 | 11.9 | 15.3 | 1.7 | 1.7 | 3.4 | 22.0 | 37.3 |
| Psychology | 61 | 0.0 | 0.0 | 8.2 | 3.3 | 0.0 | 0.0 | 1.6 | 13.1 | 0.0 | 34.4 | 47.5 |
| Other STEM | 164 | 9.8 | 1.2 | 4.9 | 17.7 | 4.3 | 7.9 | 0.0 | 11.0 | 0.6 | 26.2 | 29.3 |
| Non-STEM | 383 | 6.5 | 1.0 | 6.3 | 6.0 | 3.1 | 1.8 | 1.3 | 6.0 | 4.2 | 7.3 | 62.7 |
| Women Only | % of in a Given Major That Subsequently Earned Degree in Each Major | |||||||||||
|---|---|---|---|---|---|---|---|---|---|---|---|---|
| Other | Non- | No | ||||||||||
| Major | Bio | Chem | CS | Econ | Engr | Math | Phys | Psych | STEM | STEM | Degree | |
| Biological Sciences | 226 | 1.3 | 1.8 | 0.4 | 2.2 | 3.5 | 1.8 | 0.0 | 12.4 | 9.3 | 52.2 | 23.5 |
| Chemistry | 104 | 13.5 | 0.0 | 0.0 | 1.0 | 12.5 | 1.9 | 1.0 | 5.8 | 7.7 | 44.2 | 24.0 |
| Computer Science | 14 | 0.0 | 0.0 | 0.0 | 0.0 | 0.0 | 7.1 | 0.0 | 14.3 | 14.3 | 21.4 | 42.9 |
| Economics | 56 | 3.6 | 3.6 | 0.0 | 0.0 | 1.8 | 7.1 | 0.0 | 7.1 | 10.7 | 51.8 | 25.0 |
| Engineering | 194 | 8.2 | 4.6 | 3.6 | 3.6 | 2.1 | 2.6 | 0.5 | 6.2 | 7.7 | 33.0 | 37.1 |
| Mathematics | 42 | 11.9 | 2.4 | 4.8 | 23.8 | 2.4 | 2.4 | 0.0 | 14.3 | 23.8 | 21.4 | 14.3 |
| Physics and Astronomy | 11 | 0.0 | 0.0 | 0.0 | 0.0 | 9.1 | 18.2 | 0.0 | 9.1 | 0.0 | 36.4 | 36.4 |
| Psychology | 94 | 3.2 | 0.0 | 0.0 | 0.0 | 1.1 | 0.0 | 0.0 | 7.4 | 4.3 | 36.2 | 54.3 |
| Other STEM | 148 | 13.5 | 1.4 | 1.4 | 4.1 | 0.7 | 2.7 | 0.0 | 19.6 | 1.4 | 47.3 | 23.6 |
| Non-STEM | 324 | 6.8 | 1.5 | 2.2 | 3.1 | 2.2 | 1.2 | 0.6 | 19.4 | 6.2 | 10.5 | 55.2 |