A parameter-free mechanistic model of the adhesive wear process of rough surfaces in sliding contact
Abstract
In order to develop predictive wear laws, relevant material parameters and their influence on the wear rate need to be identified. Despite decades of research, there is no agreement on the mathematical form of wear equations and even the simplest models, such as Archard’s, contain unpredictable fit parameters. Here, we propose a simple model for adhesive wear in dry sliding conditions that contains no fit parameters and is only based on material properties and surface parameters. The model connects elastoplastic contact solutions with the insight that volume detachment from sliding surfaces occurs in the form of wear particles, the minimum size of which can be estimated. A novelty of the model is the explicit tracking of the sliding process, which allows us to meaningfully connect particle emission rates and sizes to the macroscopic wear rate. The results are qualitatively promising, but we identify the necessity for more controlled wear experiments and the parameters needed from such work in order to fully verify and improve our model.
keywords:
Wear prediction , Contact mechanics , Self-affine surface , Boundary element method , Elastic–plastic material[table]style=plaintop \floatsetupcapbesideposition=right
1 Introduction
In engineering practice, wear is usually predicted by (semi-)empirical laws instead of mechanistically informed models. Unfortunately, these laws are numerous and not necessarily transferable, while experiments which reveal sufficient information to validate them are scarce (Meng and Ludema, 1995). In order to further our fundamental understanding of the wear process, parameter-free wear predictions based on microscopic mechanisms are needed. The main obstacle in this path is the multitude of those mechanisms (reviewed in Vakis et al., 2018), spanning from corrosion, local melting, subsurface plasticity, and phase transformation to fatigue and fracture from the nanoscale to the macroscale. A universal, multi-physics description of this process is thus currently out of reach and scientific progress in this area relies on describing idealized wear modes.
Hence, our focus lies here on the case of adhesive wear of brittle materials in the unlubricated regime. Adhesive wear is perhaps one of the most common types of wear, in which wear particles detach at points where strong enough junctions form between asperities from two contacting surfaces sliding relative to one another (Rabinowicz, 1995). The earliest works on wear already recognized that the wear volume —i.e., the loss of volume of relatively sliding surfaces—is proportional to the applied normal force and the relative sliding distance , at least in a certain load range (Reye, 1860; Rabinowicz and Tabor, 1951). The value of interest is therefore the prediction of the wear rate . Bowden and Tabor (1939) provided the critical insight that all surfaces are rough at some level and that the value of the real contact area thus depends on . With this, Holm (1967), Burwell and Strang (1952), and Archard (1953) developed wear equations of the form
| (1) |
which assume that the wear rate is proportional to the real contact area given by divided by the material’s hardness with some proportionality constant . The contribution of Archard (1953) is the insight that wear progresses due to the detachment of wear particles at contact junctions between the surfaces instead of by atom-by-atom attrition. Nevertheless, the predictive power of Eq. 1 is low, since the constant , commonly called “wear coefficient”, remains an empirical parameter whose values can span several orders of magnitude.
While Archard (1953) treated the wear particle formation as a random event with as the detachment probability, recent computer modeling efforts (Aghababaei et al., 2016, 2017; Aghababaei, 2019; Brink and Molinari, 2019) confirmed and expanded on an old hypothesis by Rabinowicz (1958) that there is a critical length scale for wear particle formation. If contact junctions are smaller than this critical size, they do not detach from the surface, but show some sort of plastic activity. The model is based on the amount of energy that can be stored locally in a contact and is thus available to propagate the crack that leads to particle detachment. The critical length scale relates to a value for the junction diameter and can be expressed, based on the material’s properties, as (Aghababaei et al., 2016)
| (2) |
where is a geometry factor (often set to , see Aghababaei et al. (2016) and Brink and Molinari (2019) for a detailed discussion and derivation), is the fracture energy, and is the elastic energy density of an asperity with shear modulus when it is loaded to its shear limit . It should be noted that this concept has only been tested with relatively brittle material models and an extension to materials with ductile fracture behavior is outstanding, hence our limitation to the brittle regime in the present paper.
A first approach to advance Archard’s model based on this deterministic particle formation criterion was developed by Frérot et al. (2018) using elastic contact solutions of synthesized, self-affine, rough surfaces. There, is no longer a detachment probability, but related to the fraction of asperities with . This model is revisited in section 2, so we simply summarize that it does not reproduce a wear coefficient that is constant over a large load range as experimentally observed (e.g., by Archard and Hirst, 1956). Another approach by Popov and Pohrt (2018) is also based on elastic contact solutions of synthesized, self-affine, rough surfaces, but tries to avoid defining an asperity or contact junction directly, instead applying the energetic criterion underlying Eq. 2 to arbitrary areas of the surface. This model predicts that infinitely large wear particles can form and yields superlinear wear rates even when imposing an upper limit on particle size. The reason is (most likely) that having sufficient elastic energy available is only a necessary condition for fracture and wear particle detachment; as already implicit in the fracture model of Griffith (1921), there must also always be a stress concentration to propagate a crack.
Based on these results, it is not yet clear if the critical length scale of Eq. 2 is helpful in predicting macroscopic wear rates. Indeed, the value of decreases with increasing hardness of the material, which might suggest that a harder material can more easily produce wear debris even from small contacts and thus wear more, in contradiction to the typical experimental observation. The mechanistic model by Frérot et al. (2018) shares this shortcoming: Wear rates increase with decreasing .
The goal of the present contribution is therefore to show that a critical ingredient of the wear process was not considered in sufficient detail before: The surfaces slide relative to each other during wear. The explicit inclusion of a very simple facsimile of the sliding process into our model allows us to make sense of the seeming contradiction between the microscopic length scale and the macroscopic wear laws. Furthermore, we find that the material properties used to calculate cannot be divorced from the physics of the contact solution and that the relation between wear particle formation and wear rate is nontrivial. A comparison with an experimental work by Kim et al. (1986) that contains sufficient data to feed our model yields some qualitative agreement, but ultimately more detailed experiments are needed to develop predictive wear models.
2 Complementing a static model with plasticity
Our proposed new wear modeling approach is based on the work of Frérot et al. (2018), the basic ingredient of which is an elastic contact solution. Figure 1(a) illustrates the steps to obtain such a solution: First, two rough, fractal surfaces are generated for each simulation, representing the two sliding bodies. A fractal description is chosen because self-affinity is often observed in experiments of rubbing surfaces (Majumdar and Tien, 1990; Persson et al., 2005; Persson, 2014; Davidesko et al., 2014; Candela and Brodsky, 2016), as well as in simulations (Milanese et al., 2019, 2020; Hinkle et al., 2020). The surfaces are square and periodic in and direction and represent half spaces in direction. Periodic synthetic surfaces are generated in the Fourier domain with a fixed power spectrum and a uniform distribution of phases (Wu, 2000). Since all efficient contact algorithms describe a rough-on-flat geometry, the model uses Johnson’s assumption that the rough-on-flat solution is equivalent to the rough-on-rough solution, provided that the former is solved using the gap of the latter as the rough surface (Johnson et al., 1985).
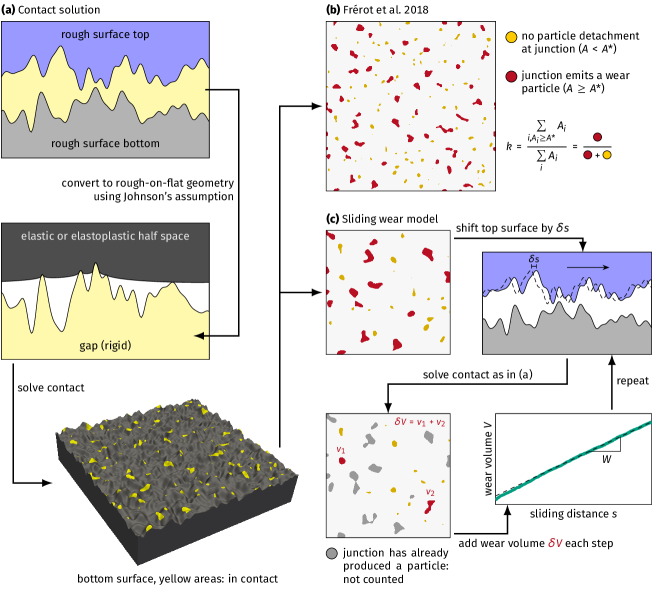
Now, for a given contact solution at normal load , all contact junctions are identified using a flood-fill algorithm. Assuming that the contacts are approximately circular, the critical length scale is translated into a critical area and junctions are divided into plastically deforming and wear particle forming based on their size (see Fig. 1(b)). The idea is now that Archard’s wear coefficient indicates how many junctions can form particles. The wear rate for each junction is obtained using Archard’s estimation that a junction fully detaches after a sliding distance roughly equal to its diameter (Archard, 1953), therefore obtaining a wear rate equal to volume divided by diameter, i.e., proportional to the junction’s contact area. Note that this means that the sliding distance needed to form a wear particle is different for each junction. Archard’s wear coefficient is thus calculated as
| (3) |
where is the area of contact junction and the sum is over all junctions. The wear rate is then simply , where is an average shape factor on the order of unity that accounts for the local contact and wear particle geometries. We call this model “static” because the relative sliding motion is only implied in the derivation of the per-junction wear rate.
It is clear that a purely elastic contact solution is not realistic (Bowden and Tabor, 1939; Weber et al., 2018) and our first step to improve upon the above model is to introduce an elastoplastic contact solution. While at least full von Mises plasticity is desirable for realistic contact calculations, the required computing time is prohibitive for a large number of simulations (Pei et al., 2005; Frérot et al., 2019b). In order to keep the computational demands reasonable, we thus opted for a saturated-pressure solution as described by Almqvist et al. (2007) and as implemented in tamaas (Frérot et al., 2019a, 2020b). The model relies on the common assumption that in elastic-plastic contact the surface pressure should not exceed the hardness of the material. To this end, saturated-plasticity approaches used in rough contact (e.g., Akchurin et al., 2016; Weber et al., 2018) solve an elastic contact problem with the additional constraint that the contact pressure should be smaller or equal to , the flow pressure. Often, this flow pressure is taken to be equal to the indentation hardness , which can in turn be estimated from the material’s uniaxial yield strength as under the assumption of spherical indentation (Tabor, 1951). Note that this is an approximation of the full elastoplastic contact solution and the readers are referred to Frérot et al. (2020a) for a comparison between von Mises plasticity and saturation pressure models.
We start our model development by investigating the influence of plasticity on the wear prediction for the static wear model. For this set of simulations, we describe all quantities in reduced units in terms of the Young’s modulus and the side length of the surface. We used five realizations of each pair of rough surfaces, each surface being discretized into pixels and described by a Hurst exponent (a typical value observed experimentally, see Persson et al., 2005), a lower wavelength cutoff of , an upper wavelength cutoff of , and a root mean square (RMS) of heights of . For each of those pairs, 1280 different offsets parallel to the surface planes between the top and bottom surface were used, since they were needed anyway for the sliding model described in section 3 later on.
We used an isotropic material with Poisson’s ratio . For the shear strength, values of were chosen, from which the flow pressure was derived as . Values for the fracture energy were . The geometry factor was set to under the assumption of spherical asperities, leading to a range of to , i.e., in between and . Sixteen different normal loads were used, so that in total 409,600 contact solutions were computed (the fracture energy only appears in and has no bearing on the contact solution).
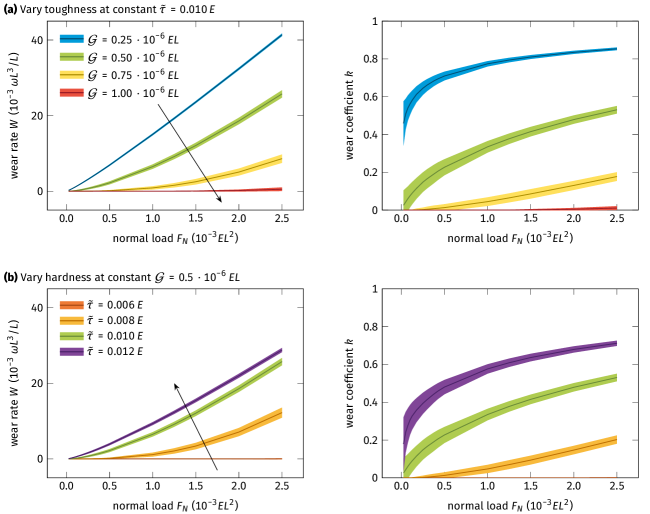
Despite the addition of more realistic contact physics, the results resemble the work of Frérot et al. (2018), see Fig. 2. The wear rate is superlinear and the wear coefficient increases with load, tending towards a limit of one. Additionally, it should be noted that while the wear rate increases with decreasing fracture energy (first row of Fig. 2), which seems reasonable, it also increases with increasing hardness (second row of Fig. 2), which contradicts Archard’s wear law. This is the same in the original work and is a simple consequence of using as a wear particle formation criterion: The bigger , the fewer junctions on a given contact map form wear particles. Since , this effect cannot be offset by the increasing real contact due to plasticity, which is less than quadratic with (Bowden and Tabor, 1939).
The intermediate conclusion is either that the critical length scale model contradicts experimental evidence or that a wear model based on a single, static contact solution is missing a critical ingredient. We will argue for the latter by implementing a simple sliding process.
3 Sliding Model
In order to explicitly include the evolution of wear particle formation during the sliding process in our simulations, we extended the model presented in the previous section by continuously displacing the top and bottom surfaces against each other. We do not calculate wear rates directly from the real contact areas, but instead estimate wear volumes under the assumption that the junctions are circular and the resulting wear particles spherical (take as the area of the contact spot and use , resulting in a wear particle volume ). The algorithm—also shown in Fig. 1(c)—works as follows:
-
1.
Solve the contact, find all contact junctions, and record the instantaneous wear volume as
where the sum goes over all contact junctions , which were identified using a flood-fill algorithm.
-
2.
Displace the top surface by a sliding increment and recompute the contact solution. Due to the periodic boundary conditions, the part of the top surface that leaves the simulation box on one side is in fact reinserted on the opposite side.
-
3.
Find all contact junctions. Iterate over them and mark any junction that shares at least one pixel with a junction that has formed a wear particle in the previous step as “disabled”. The same for any junction that shares at least one pixel with a junction that was in the disabled state in the previous step. All other junctions are marked “active”.
Thus, a junction (which represents an asperity–asperity contact) goes through several phases: When it first appears, it is approximately a single point and only grows during further sliding. Should it reach a size of before disappearing, a wear particle is formed and the junction is marked as disabled afterwards. It will retain its disabled state until the junction shrinks and disappears, at which point its state is no longer stored. This mimics the ongoing detachment of a wear particle, whose volume should only be counted once, but which still contributes to carrying normal load. Because the long-distance rolling of a wear particle cannot be modeled in the present framework, we assume the particle is lost quickly.
-
4.
Increment the wear volume by
-
5.
Unless the desired total sliding distance was reached, go to step 2.
The output of this algorithm is a cumulative wear volume as a function of sliding distance. We chose a total sliding distance of . Video 1 shows an example simulation of a smaller surface. The surface size was reduced to make the features of the model more easily visible.
[9cm]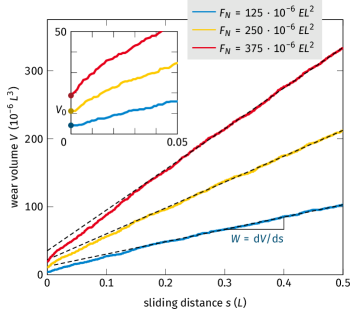
Figure 3 shows that the wear volume increases linearly with the sliding distance after a running-in period, in which the increase can be steeper. As in virtually all experiments (Reye, 1860; Rabinowicz and Tabor, 1951; Burwell and Strang, 1952; Archard, 1953; Archard and Hirst, 1956), our wear rate prediction (obtained through linear regression as ) reaches a constant value, yielding a first confirmation that the sliding implementation is reasonable. Note also that the instantaneous wear volume is much higher than the increments . We expect this effect to be very hard to observe experimentally, since it takes place at the exact onset of sliding. Nevertheless, it has an analogy in the well-established observation that friction at rest is increased compared to friction during sliding. As can be seen in Fig. 3, the system retains a “memory” of that initial contact and the wear rate stabilizes only after a while. Such running-in periods with higher wear volume are well known from experiment (Queener et al., 1965), although they can have many causes not included in our model, such as changes of the surface roughness parameters. A measure of this memory in the present work is the number of remaining contacts that were present at , which we found to decay exponentially with sliding distance (as reported before by Dieterich and Kilgore, 1994; Pei, 2006). We could, however, not find a way to predict the running-in distance: The decay constant is not uniform for different surfaces or normal loads and there is no relation between the size of the largest contacts and running in, as one might have suspected.
For the following study, we thus defined a sliding distance of as a safety margin after which the system is definitely run in, which we confirmed by inspecting the simulation data. This running-in distance has no physical meaning. We chose a sliding increment corresponding to 4 pixels in the running-in period and 1 pixel afterwards.333We tested several, uniform values of for the whole sliding distance, but found that changes in slope, i.e., wear rate, due to large steps occur quickly. Increasing the step size only in the running-in phase did not however influence the slope after running in up to a running-in step size corresponding to 16 pixels. We thus settled on the present values as sufficient safety margins, while still accelarating the simulations significantly.
Additionally, we verified that the ratio , where is the side length of a pixel, gives an acceptable discretization error. The details can be found in A.
3.1 Role of the critical length scale
The critical length scale provides a minimum size for a junction to form a wear particle and therefore a minimum wear particle volume . The result in the static model of section 2 is a variety of wear particle sizes (see, e.g., Fig. 1(b)) and a strong dependence of the wear coefficient on the maximum wear particle size (Frérot et al., 2018). In the initial step of our simple sliding model, this is the same and we obtain a relatively high instantaneous wear volume with a large number of wear particles of different sizes. The ongoing sliding process, however, changes the distribution of particle sizes. All junctions with an initial size are already worn off. During sliding, more asperities come into contact and their contact junctions grow with . As soon as they reach a size of (if they do not shrink again prior to reaching it) they immediately form a wear particle of volume before they can grow bigger. That means that the wear volume increment is made up of wear particles of volume . This reveals the role of the critical length scale as not only the minimum size of wear particles, but probably also the common size. Thus infinite particle sizes, as featured in the work of Popov and Pohrt (2018), do not occur in reality because contact junctions simply wear off before they can grow that big. It is known from experiments, e.g., by Rabinowicz (1953, 1995) or more recently by Kirk et al. (2020), that there is a distribution of particle sizes. This can have two reasons. On one hand, is not uniquely defined on a real surface due to fluctuations of the adhesion and local geometry, which are both expected to affect (Brink and Molinari, 2019). On the other hand, once particles have detached, they continue to evolve and grow, losing the connection to their initial size (Milanese et al., 2019; Aghababaei, 2019). Experimentally, even sintering of particles has been observed (see, e.g., Kirk et al., 2020).
Given that the contribution of the initial particle creation to the wear rate is large compared to the particle growth rate (Milanese et al., 2019), we neglect any wear due to particle growth. The wear rate can thus be defined by both and the rate at which new contact junctions appear and reach during sliding:
| (4) |
Here, ( in the present work) is again a shape factor accounting for the wear particle shape and is the total number of wear particles formed during the sliding distance , which is also the cumulative number of junctions that have newly grown to a size of at least . This number should be a linear function of to obtain a constant wear rate. Note that the total number of junctions greater than at a given sliding distance, denoted , is roughly constant after running in. For more details, see B.
3.2 Apparent contact area
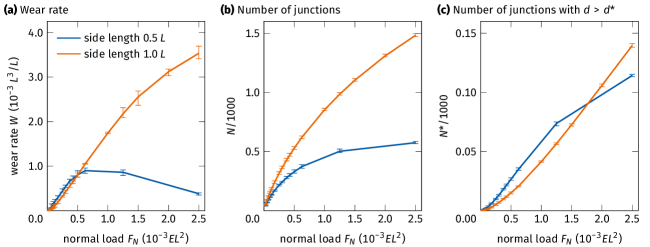
Typically, it is assumed that the wear rate, just like the real contact area, is independent of the apparent contact area (Archard, 1953). We tested if this is the case in our model (see C for the details) and found for two surfaces with different side lengths that the wear rates are comparable up to a given load, after which the smaller surface exhibits a breakdown of the wear rate with increasing load. This is not related to a breakdown of the total number of contact junctions—which strongly depends on the surface size—but to a breakdown of the scaling of with , i.e., the number of contact junctions greater than . This seems to have direct implications on and thus the wear rate. Here, we treat this as an effect of the limited size of our surfaces and regard the data after the “breakdown” as unreliable. If such a limit to Archard-like scaling with is a real effect remains to be investigated.
3.3 Lower wavelength cutoff and the RMS of heights
In elastic contact solutions, the real contact area scales linearly with the inverse of the RMS of slopes (Bush et al., 1975; Hyun et al., 2004). Because the latter is strongly dependent on , the true contact area is sensitive to local fluctuations at short wavelengths and in extenso to the resolution down to which the system is measured or modeled (Ciavarella et al., 2000; Persson, 2001; Ciavarella and Papangelo, 2017). This is a problem for elastic contact simulations, since it becomes necessary to include the shortest wavelength of roughness that exists in the system, which might be much smaller than and which is likely unknown due to experimental measurement limitations (Jacobs et al., 2017). However, in elastoplastic contact solutions, plasticity can “smooth out” small wavelengths (Pei et al., 2005). We found that this also is the case in our model, see D. While it is hard to generalize to other elastoplastic models, it at least means that the present model is robust against (in practice) immeasurable small disturbances of the rough surfaces.
Another surprising property is that the wear rates do not change between two values of the RMS of heights tested by us (see E). For an elastic contact solution this would be unexpected, since the RMS of heights also influences the RMS of slopes and thus the contact solution. In our case, it seems that the nature of the sliding model combined with the saturated-pressure contact solution cancels any influence of , at least in a certain range of and . This can be rationalized by first taking into account that sharper peaks also increase the local pressure and thereby provide the necessary energy to flatten them, as well as the fact that the wear rates in our model depend more strongly on the number of contact junctions, which is likely not affected as strongly by . Further study is necessary to draw definite conclusions.
4 Results
4.1 Influence of material properties
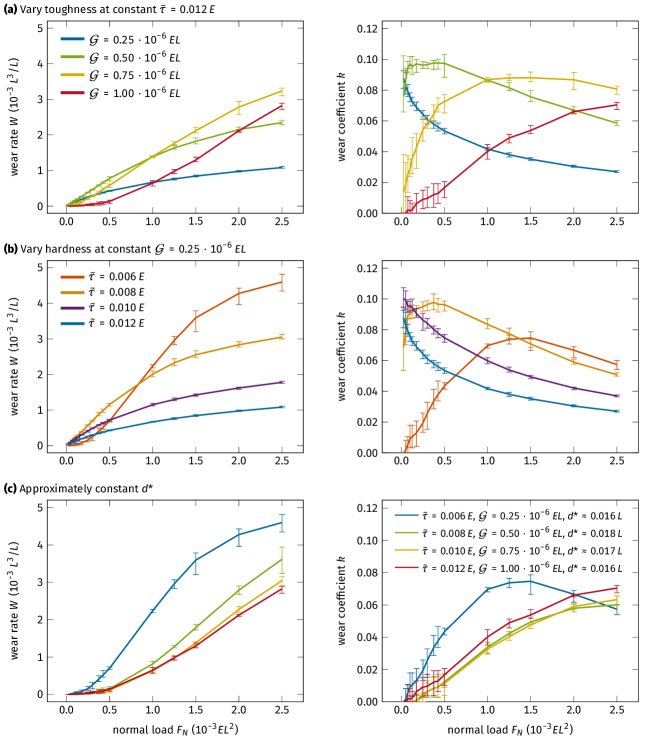
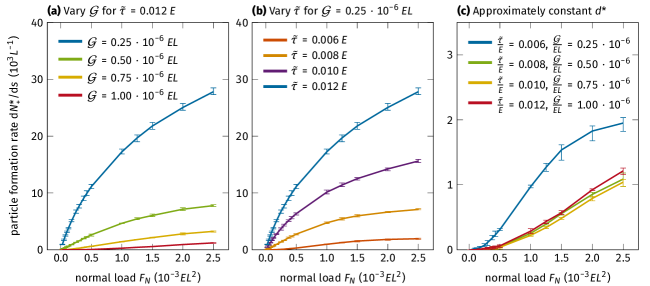
We used the surfaces described in section 2 as input to our sliding model with identical variations of material parameters. The results are shown in Fig. 4 and Supplementary Figs. S.1 and S.2. We observe that wear rates and wear coefficients are an order of magnitude smaller than in the static model (Fig. 2). They reside in the high end of reported experimental values for dry sliding experiments of ceramics (Zum Gahr, 1989; Hokkirigawa, 1991; Wang and Hsu, 1996) or of steel on steel (Archard and Hirst, 1956), which range from to . Unlike the results shown in section 2, the wear coefficient here does not asymptotically tend to unity, but remains smaller than around in all cases. More insights can be gained by exploring the influence of the material parameters.
First, we kept the material hardness constant and varied the fracture energy (Fig. 4(a)). This means that the distribution of contact patches remains the same for these simulations, since the contact solution does not depend on the fracture energy. However, the wear particle formation criterion is affected, because . At low loads, the systems with smaller fracture energy wear more. This is due to the same mechanism we have discussed in section 2 with regards to the static model: When is large, most junctions that form between the two surfaces are too small to be able to detach as wear particles. When the load is increased, more and more large junctions occur. If a sufficient number of junctions grow to a size of , the larger wear particle volume of the tougher materials ultimately makes them wear more than the less tough ones. Nevertheless, the increase of the wear coefficient with is slower for tougher materials and they reach their maximum value of at higher . This slow increase of the wear coefficient is exemplified by the simulation with , whose wear coefficient is still increasing as a function of the normal load at and has not yet surpassed the simulation with in wear rate, even though it has a larger .
Second, by keeping the fracture energy constant and varying the material strength , we can observe the effects of simultaneously changing the contact solution—which is a function of the indentation hardness —and the critical length scale (Fig. 4(b)). Again, larger leads to higher wear rates at high loads. As before, we would expect that the systems with large wear less at low loads. However, this is only the case for the simulation with the lowest hardness, making the effect less pronounced than in the previous set of simulations. The reason is the interplay between and the contact solution: Reducing the material strength decreases the indentation hardness and leads to larger contact junctions even at low loads, counteracting the increase of .
Finally, by keeping approximately constant and varying and together (Fig. 4(c)), we see that the wear coefficients approach the same maximum value of –. Again, stronger and tougher materials reach this maximum at somewhat higher normal loads.
It is also instructive to look at the number of wear particles, or rather the rate at which they are emitted over a given sliding distance: . This is shown in Fig. 5 for the same set of simulations. It should be noted that while the hardest material and the material with the lowest fracture toughness wear the least, they emit the most wear particles. Since these particles are quite small in these cases, though, the wear rates are also small. This means that more severe wear is due to the detachment of large wear particles, which is also sometimes observed experimentally (Zhang and Alpas, 1997). Of course, when is roughly constant, the wear particle formation rate (Fig. 5(c)) and the wear rate (Fig. 4(c)) exhibit similar trends. Thus, if one wants to minimize the emission of fine particles, our current model suggests to use a soft but tough material.
Experiments often exhibit wear coefficients at least one or two orders of magnitude below the present results (Archard and Hirst, 1956; Zum Gahr, 1989; Hokkirigawa, 1991; Wang and Hsu, 1996), which is likely due to reduced adhesion even in dry experimental conditions. We assumed in this work that the junctions have bulk strength, although surface contamination is always present and will reduce the adhesion between the two bodies in contact. Indeed, it is well known that friction in vacuum is increased and that this is further amplified upon wearing off of surface contaminants, although the effect is smaller for brittle materials (such as ceramics) than for metals (Kato, 1990; Zum Gahr et al., 2001). The reduced adhesion in normal atmosphere would lead to an increased (Brink and Molinari, 2019; Aghababaei, 2019), while not affecting the bulk hardness and contact solution. This is equivalent to increasing while keeping all other material parameters the same (see Eq. 2). Figure 4(a) shows that this leads to a reduction of wear compared to simulations with smaller at low loads, since there are less junctions with size at low . By significantly reducing adhesion (possibly by lubrication), even the onset of wear can be delayed to very high loads in the present model, see for example Supplementary Fig. S.1(a). As noted in Brink and Molinari (2019) and Milanese et al. (2020), though, the critical junction size becomes geometry dependent in the reduced adhesion case and some wear particles can be formed, thereby resulting in a reduced, but non-zero wear coefficient. Unfortunately, the actual microscopic junction shear strength for reduced adhesion is not easily accessible experimentally and the above hypothesis remains to be tested against realistic data.
4.2 Comparison to data from Kim et al. (1986)
A direct comparison to experimental data is not easy, since we could not find any work which simultaneously reports the surface roughness parameters, material properties, and wear rates for dry sliding conditions. Nevertheless, we could use the data for Si3N4, SiC, and Al2O3 from Kim et al. (1986), who at least report the RMS of heights for their surfaces in addition to material properties and wear rates (see Table 1), even if only for rolling friction experiments.
In terms of the surface geometries, we used a side length of (roughly the apparent contact area of the experiment, although their contact area is an ellipse due to Hertzian contact); , , and . As such, lies in between and , keeping the computational demands (discretization) reasonable. The RMS of heights was chosen to be the steady-state value of the wear experiment (see Table 1). Note that the values for and lie in the same range as the values we used for our generic simulations with reduced units, verifying that the choice of parameters was reasonable, at least for ceramics.
| Material | (GPa) | (GPa) | (J/m2) | () | () | |||
|---|---|---|---|---|---|---|---|---|
| Si3N4 | 294 | 0.27 | 2.89 | 0.0098 | 91.97 | 7.64 | 4.0 | |
| SiC | 392 | 0.16 | 4.80 | 0.0122 | 45.00 | 1.98 | 5.0–10.0 | |
| Al2O3 | 343 | 0.25 | 3.37 | 0.0098 | 46.65 | 3.93 | 20.0 |
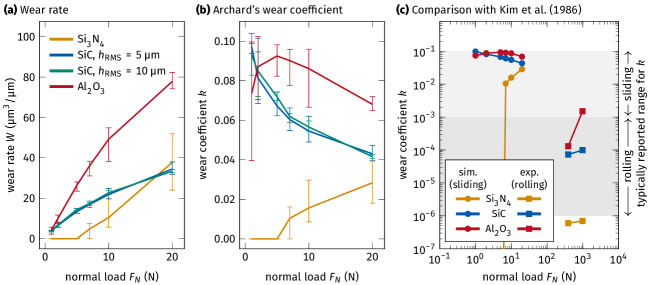
The results are plotted in Figs. 6(a)–(b) and the wear coefficients are in the same range as the previous simulations (Fig. 4), as expected. The authors of the experimental work proposed a wear law based on “contact severity”, which does not seem to yield insights beyond Archard’s wear law. It is discussed for completeness’s sake in F. Apart from this, Fig. 6(c) shows that our wear coefficients are at least two to three orders of magnitude higher than the experimental ones ( to ), although this is expected since the experiment was a rolling friction setup, which often has such a large difference in compared to sliding friction setups (Hokkirigawa, 1991). The hierarchy of wear resistance matches the experimental observation: Al2O3 wears the most and Si3N4 the least for the presented load range. While the crossover between Al2O3 and SiC at low loads observed in the simulation is also somewhat suggested by the experimental trends, the available measurement data is insufficient to affirm a correspondence. In contrast, the wear rate of Si3N4 predicted by our model increases towards the higher loads in accordance with the results of section 4.1, since it has the highest . It is unclear if that behavior of our model is realistic or not, since we cannot translate the load ranges in sliding to the equivalent load ranges in rolling friction. It is quite possible that the typical experimental load ranges never reach the point where the wear rate of Si3N4 picks up and surpasses the other materials. Some hints can be found in the sliding wear experiments on different ceramics of Adachi et al. (1997). They report wear rates up to the order of in dry conditions for normal loads in the range of to , which corresponds roughly to our results. Instead of normal loads, data is presented as a function of “contact severity” (a compound value of different, independent parameters), which makes further comparison impossible.
Ultimately, we hope to inspire more detailed experiments that adequately report on material parameters, surface roughness, adhesion (preferably at the individual junction level), and wear rates over large load ranges in order to verify and improve our model. Recent advances in the mass resolution and wear mapping of sliding experiments, as for instance proposed by Garabedian et al. (2019), can be helpful in this context because they allow observations at the onset of wear and can resolve asperity-level mechanisms.
5 Outlook on wear modeling
Due to the computational demands, the present model is relatively simple. It is clear that a saturated-pressure contact solution is not as satisfactory as a more realistic von Mises plasticity (Frérot et al., 2020a), but existing approaches (Pei et al., 2005; Frérot et al., 2019b) are computationally too demanding for the large number of contact solutions required at present. Similarly, the spectrum of the fractal roughness is not very broad, once again to keep computational demands low. Finally, Johnson’s assumption is likely invalid for elastoplastic contact and true rough-on-rough contact algorithms should be developed. Mechanistic wear modeling could greatly benefit from any advances in these areas, if only to verify the validity of the approximations used here.
There are also several physical processes that are not explicitly included. First, a reduced adhesion between the surfaces, either due to surface contamination or lubrication, is known to modify (Brink and Molinari, 2019). However, a purely geometric treatment of as used here would additionally need the contact angles (Brink and Molinari, 2019), which are not well defined when using Johnson’s assumption. Perhaps it would be more fruitful to work on including the fracture process directly in the simulation instead, as attempted by Frérot et al. (2020a). Moreover, coupling of a fracture model to the contact solution could inherently include asperity interactions (Aghababaei et al., 2018; Pham-Ba et al., 2020), which are expected to greatly affect the wear rates at high loads. Finally, we assumed that the debris particles are somehow evacuated quickly and no extended third body forms, which is of course an oversimplification in many cases.
Despite all of this, a major advantage of the current work is the simplicity of Eq. 4. The main complication is to provide a reliable estimate of or . If a closed form solution could be obtained, the computational demand would be significantly reduced and the model could be widely and cheaply tested and applied.
6 Conclusion
We developed a wear model based on a combination of a simple elastoplastic contact solution algorithm, an evolution of the contact interface through a sliding process, and a critical length scale criterion for wear particle formation. The model contains no fit parameters and yields at least qualitatively reasonable results. We find that the critical length scale , i.e., the minimum size a contact needs to have to detach and form a wear particle, is a necessary ingredient in this model: It defines not only a minimum wear particle size, but rather a typical wear particle size. Often, this leads to materials with larger wearing more, which are materials that are soft but tough (see Eq. 2), thereby reconciling the concept of the critical length scale with Archard’s wear law. For smaller loads increased toughness can suppress wear particle formation since no large enough contact junction forms, making tough materials more wear resistant in some load ranges. The statistical distribution of contact junctions that form during sliding is thus also a relevant parameter. It remains to be seen if the behaviors at different load ranges can be related to experiments.
Nevertheless, an Archard-like wear behavior is approximately recovered and the qualitative agreement with an experimental work is promising. However, the present comparison is not quantitatively satisfying, since we can only compare to rolling wear, while we intrinsically model sliding wear, for which we could not find sufficient data. It is our hope that such modeling inspires more detailed dry, adhesive wear experiments, which report simultaneously the necessary material parameters, surface roughness description after running in, and resulting wear rates. Preferably the work would be performed over large load ranges in order to evaluate and improve models such as the one presented in the present paper.
CRediT author contribution statement
Tobias Brink: Conceptualization, Methodology, Investigation, Writing – Original Draft, Visualization. Lucas Frérot: Methodology, Software, Writing – Review & Editing. Jean-François Molinari: Conceptualization, Writing – Review & Editing, Supervision, Funding acquisition.
Acknowledgments
This work was supported by École polytechnique fédérale de Lausanne (EPFL) through the use of the facilities of its Scientific IT and Application Support Center.
Appendix A Discretization
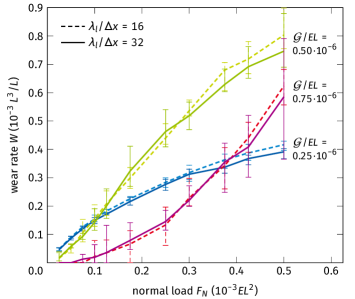
In order to verify that the discretization errors are sufficiently small, we ran simulations with a ratio as used in the results in this paper, as well as , i.e., a two times finer discretization. All test simulations, presented in Fig. 7, used roughness parameters of , , , and , as well as material properties of , and varying as indicated in the figure. We found no difference between the two settings within the error of the simulation and thus opted for a value of in the interest of reducing computational demand due to discretization.
[9cm]
Appendix B Number of wear particles
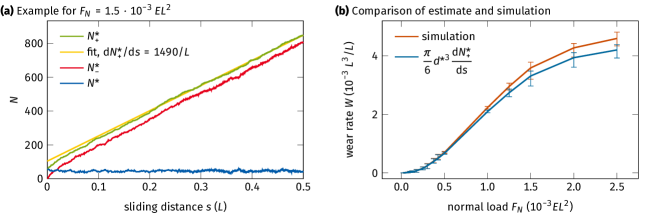
Equation 4 indicates the importance of the number of wear particles that are created over a given sliding distance . Figure 8 presents a detailed look at this data for one of the main simulations with and . In Fig. 8(a), we see the number of wear particles formed , the cumulative number of junctions that have shrunk below during a sliding distance , and the number of junctions greater than at a given sliding distance . It is , wherefore closely follows after some steps. Just like the wear rate, the wear particle formation rate is linear with sliding distance. The slope is obtained by linear regression, cf. the wear rate in Fig. 3. Figure 8(b) demonstrates that Eq. 4 with slightly underestimates our simulation results obtained by directly summing the volumes of wear particles, even if the simulation also assumes spherical particles. The reason is that—due to discretization—contacts may grow a little bit bigger than before they detach. In reality, particles would not be perfectly spherical and adjustments to have to be made in any case.
Appendix C Apparent contact area
In order to study the behavior of our model as a function of the apparent contact area, we also produced five pairs of surfaces with a side length of (we will not normalize material properties and results to , but stay with as a length unit for easier comparison). Otherwise, all surface and material parameters were the same as for the surfaces with side length : , , , and , as well as material properties of , , and .
Figure 9(a) shows that the wear rates are indeed comparable up to normal loads of . At higher loads, the larger surface continues a roughly linear increase of wear rate with load, while the wear rate of the smaller surface breaks down. Since the wear rate depends on the number of junctions growing to the critical size, we also looked at the average number of contact junctions as a function of load (Fig. 9(b)). This analysis proves to be not very enlightening on its own, though: The larger surface has more contact spots, but does not wear more, and there is no crossover in behavior as a function of normal load. A comparison of the number of contact junctions that are larger than the critical size reveals more. In Fig. 9(c) we can see that breaks down from its approximately linear scaling at the same time as the wear rate does. We interpret this to mean that smaller surfaces statistically have less contact spots overall and thus cannot accommodate the necessary number of large contact spots to keep up the linear growth of wear rate with load. Video 2 shows a simulation in the high-load regime of an even smaller surface and indicates that contact junctions also start to merge, which additionally reduces the number of individual contacts. This might well be connected to a transition to severe wear, since the contacts are expected to interact if they come closer together, at which point their wear particle sizes are no longer predictable from the individual contact areas (Aghababaei et al., 2018; Pham-Ba et al., 2020). Such phenomena are not included in the present model, and we have to treat data after this “breakdown” as unreliable.
Note that we chose the larger surface to obtain the results in the main text since it can sustain a larger range of loads. Because we originally started our investigations with the smaller surface, though, it was used for the verification studies in the appendices unless otherwise noted.
Appendix D Lower wavelength cutoff of the surface spectrum
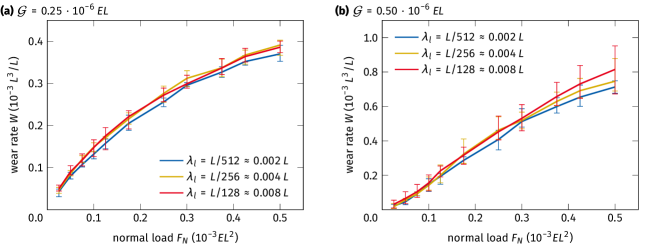
We studied the influence of the lower wavelength cutoff of the surface spectrum (Fig. 10) using surfaces with roughness parameters of , , , as well as material properties of , . The parameters and were varied as indicated in the figure. Within the error of the simulation and the range of values studied, the model is robust against changes of .
Appendix E RMS of heights
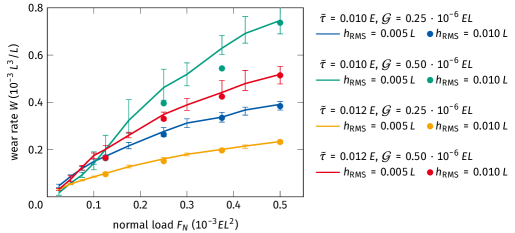
We studied the influence of the RMS of heigths of the surface spectrum (Fig. 11) using surfaces with roughness parameters of , , , as well as material properties of and different and as indicated in the figure. We see that has no influence in the range of values investigated, likely because the number of junctions matters more and because high peaks are flattened by plasticity.
Appendix F Wear law based on “contact severity”
For the sake of completeness, we will shortly comment on a proposed wear parameter in the publication of Kim et al. (1986), where
| (5) |
with
| (6) |
In contrast to Archard (1953), the hardness does not play a role, but the toughness does. The experimental data in Kim et al. (1986) consists of only two loads per material and Eq. 5 is fitted to a log–log plot, where it works approximately, with values of and . The same is true for our simulations, see Fig. 12, although with fit parameters of and and some deviation for Si3N4. It is not clear if Eqs. 5 and 6 are predictive, especially since we do not find a strong dependence on , which seems to have been included for the convenience of having a unitless . The influence of hardness is completely ignored. Indeed, later publications did not find a clear correlation between and and rather propose that the maximum stress leads to the correlation, similar to in Archard’s wear law (Hsu and Shen, 2004). It is therefore safe to say that such a model does not fare better than other empirical wear laws and an agreement between our values for and and the ones of Kim et al. (1986) should not be expected.
[9cm]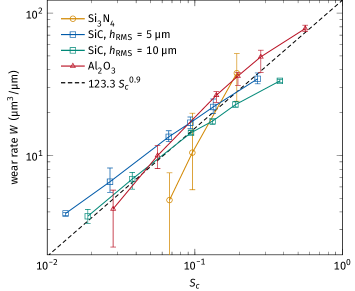
Appendix G Supplementary data
Supplementary data related to this article can be found at the end of this document. Videos are freely available at https://arxiv.org/abs/2004.00559 and https://doi.org/10.1016/j.jmps.2020.104238.
References
- Adachi et al. (1997) Adachi, K., Kato, K., Chen, N., 1997. Wear map of ceramics. Wear 203–204, 291–301. doi:10.1016/S0043-1648(96)07363-2.
- Aghababaei (2019) Aghababaei, R., 2019. Effect of adhesion on material removal during adhesive wear. Phys. Rev. Mater. 3, 063604. doi:10.1103/PhysRevMaterials.3.063604.
- Aghababaei et al. (2018) Aghababaei, R., Brink, T., Molinari, J.F., 2018. Asperity-level origins of transition from mild to severe wear. Phys. Rev. Lett. 120, 186105. doi:10.1103/PhysRevLett.120.186105.
- Aghababaei et al. (2016) Aghababaei, R., Warner, D.H., Molinari, J.F., 2016. Critical length scale controls adhesive wear mechanisms. Nat. Commun. 7, 11816. doi:10.1038/ncomms11816.
- Aghababaei et al. (2017) Aghababaei, R., Warner, D.H., Molinari, J.F., 2017. On the debris-level origins of adhesive wear. Proc. Natl. Acad. Sci. U.S.A. 114, 7935–7940. doi:10.1073/pnas.1700904114.
- Akchurin et al. (2016) Akchurin, A., Bosman, R., Lugt, P.M., 2016. A stress-criterion-based model for the prediction of the size of wear particles in boundary lubricated contacts. Tribol. Lett. 64, 35. doi:10.1007/s11249-016-0772-x.
- Almqvist et al. (2007) Almqvist, A., Sahlin, F., Larsson, R., Glavatskih, S., 2007. On the dry elasto-plastic contact of nominally flat surfaces. Tribol. Int. 40, 574–579. doi:10.1016/j.triboint.2005.11.008.
- Archard (1953) Archard, J.F., 1953. Contact and rubbing of flat surfaces. J. Appl. Phys. 24, 981–988. doi:10.1063/1.1721448.
- Archard and Hirst (1956) Archard, J.F., Hirst, W., 1956. The wear of metals under unlubricated conditions. Proc. R. Soc. Lond. A 236, 397–410. doi:10.1098/rspa.1956.0144.
- Bowden and Tabor (1939) Bowden, F.P., Tabor, D., 1939. The area of contact between stationary and between moving surfaces. Proc. R. Soc. Lond. A 169, 391–413. doi:10.1098/rspa.1939.0005.
- Brink and Molinari (2019) Brink, T., Molinari, J.F., 2019. Adhesive wear mechanisms in the presence of weak interfaces: Insights from an amorphous model system. Phys. Rev. Mater. 3, 053604. doi:10.1103/PhysRevMaterials.3.053604.
- Burwell and Strang (1952) Burwell, J.T., Strang, C.D., 1952. On the empirical law of adhesive wear. J. Appl. Phys. 23, 18–28. doi:10.1063/1.1701970.
- Bush et al. (1975) Bush, A.W., Gibson, R.D., Thomas, T.R., 1975. The elastic contact of a rough surface. Wear 35, 87–111. doi:10.1016/0043-1648(75)90145-3.
- Candela and Brodsky (2016) Candela, T., Brodsky, E.E., 2016. The minimum scale of grooving on faults. Geology 44, 603–606. doi:10.1130/G37934.1.
- Ciavarella et al. (2000) Ciavarella, M., Demelio, G., Barber, J.R., Jang, Y.H., 2000. Linear elastic contact of the Weierstrass profile. Proc. R. Soc. Lond. A 456, 387–405. doi:10.1098/rspa.2000.0522.
- Ciavarella and Papangelo (2017) Ciavarella, M., Papangelo, A., 2017. Discussion of “Measuring and understanding contact area at the nanoscale: A review” (Jacobs, T. D. B., and Ashlie Martini, A., 2017, ASME Appl. Mech. Rev., 69(6), p. 060802). Appl. Mech. Rev. 69, 065502. doi:10.1115/1.4038188.
- Davidesko et al. (2014) Davidesko, G., Sagy, A., Hatzor, Y.H., 2014. Evolution of slip surface roughness through shear. Geophys. Res. Lett. 41, 2013GL058913. doi:10.1002/2013GL058913.
- Dieterich and Kilgore (1994) Dieterich, J.H., Kilgore, B.D., 1994. Direct observation of frictional contacts: New insights for state-dependent properties. Pure Appl. Geophys. 143, 283–302. doi:10.1007/BF00874332.
- Frérot et al. (2018) Frérot, L., Aghababaei, R., Molinari, J.F., 2018. A mechanistic understanding of the wear coefficient: From single to multiple asperities contact. J. Mech. Phys. Solids 114, 172–184. doi:10.1016/j.jmps.2018.02.015.
- Frérot et al. (2020a) Frérot, L., Anciaux, G., Molinari, J.F., 2020a. Crack nucleation in the adhesive wear of an elastic-plastic half-space. J. Mech. Phys. Solids 145, 104100. doi:10.1016/j.jmps.2020.104100.
- Frérot et al. (2019a) Frérot, L., Anciaux, G., Rey, V., Pham-Ba, S., Molinari, J.F., 2019a. Tamaas, a high-performance library for periodic rough surface contact. Version 2.0.0. Zenodo. URL: https://c4science.ch/tag/tamaas/, doi:10.5281/zenodo.3479237.
- Frérot et al. (2020b) Frérot, L., Anciaux, G., Rey, V., Pham-Ba, S., Molinari, J.F., 2020b. Tamaas: a library for elastic-plastic contact of periodic rough surfaces. J. Open Source Softw. 5, 2121. doi:10.21105/joss.02121.
- Frérot et al. (2019b) Frérot, L., Bonnet, M., Molinari, J.F., Anciaux, G., 2019b. A Fourier-accelerated volume integral method for elastoplastic contact. Comput. Methods Appl. Mech. Eng. 351, 951–976. doi:10.1016/j.cma.2019.04.006.
- Garabedian et al. (2019) Garabedian, N.T., Bhattacharjee, A., Webster, M.N., Hunter, G.L., Jacobs, P.W., Konicek, A.R., Burris, D.L., 2019. Quantifying, locating, and following asperity-scale wear processes within multiasperity contacts. Tribol. Lett. 67, 89. doi:10.1007/s11249-019-1203-6.
- Griffith (1921) Griffith, A.A., 1921. VI. The phenomena of rupture and flow in solids. Phil. Trans. R. Soc. Lond. A 221, 163–198. doi:10.1098/rsta.1921.0006.
- Hinkle et al. (2020) Hinkle, A.R., Nöhring, W.G., Leute, R., Junge, T., Pastewka, L., 2020. The emergence of small-scale self-affine surface roughness from deformation. Sci. Adv. 6, eaax0847. doi:10.1126/sciadv.aax0847.
- Hokkirigawa (1991) Hokkirigawa, K., 1991. Wear mode map of ceramics. Wear 151, 219–228. doi:10.1016/0043-1648(91)90250-X.
- Holm (1967) Holm, R., 1967. Electric Contacts: Theory and Application. 3rd ed., Springer, Berlin, Germany.
- Hsu and Shen (2004) Hsu, S.M., Shen, M., 2004. Wear prediction of ceramics. Wear 256, 867–878. doi:10.1016/j.wear.2003.11.002.
- Hyun et al. (2004) Hyun, S., Pei, L., Molinari, J.F., Robbins, M.O., 2004. Finite-element analysis of contact between elastic self-affine surfaces. Phys. Rev. E 70, 026117. doi:10.1103/PhysRevE.70.026117.
- Jacobs et al. (2017) Jacobs, T.D.B., Junge, T., Pastewka, L., 2017. Quantitative characterization of surface topography using spectral analysis. Surf. Topogr. Metrol. Prop. 5, 013001. doi:10.1088/2051-672X/aa51f8.
- Johnson et al. (1985) Johnson, K.L., Greenwood, J.A., Higginson, J.G., 1985. The contact of elastic regular wavy surfaces. Int. J. Mech. Sci. 27, 383–396. doi:10.1016/0020-7403(85)90029-3.
- Kato (1990) Kato, K., 1990. Tribology of ceramics. Wear 136, 117–133. doi:10.1016/0043-1648(90)90075-L.
- Kim et al. (1986) Kim, S.S., Kato, K., Hokkirigawa, K., Abé, H., 1986. Wear mechanism of ceramic materials in dry rolling friction. J. Tribol. 108, 522–526. doi:10.1115/1.3261255.
- Kirk et al. (2020) Kirk, A.M., Shipway, P.H., Sun, W., Bennett, C.J., 2020. Debris development in fretting contacts – debris particles and debris beds. Tribol. Int. 149, 105592. doi:10.1016/j.triboint.2019.01.051.
- Majumdar and Tien (1990) Majumdar, A., Tien, C.L., 1990. Fractal characterization and simulation of rough surfaces. Wear 136, 313–327. doi:10.1016/0043-1648(90)90154-3.
- Meng and Ludema (1995) Meng, H.C., Ludema, K.C., 1995. Wear models and predictive equations: their form and content. Wear 181–183, 443–457. doi:10.1016/0043-1648(95)90158-2.
- Milanese et al. (2019) Milanese, E., Brink, T., Aghababaei, R., Molinari, J.F., 2019. Emergence of self-affine surfaces during adhesive wear. Nat. Commun. 10, 1116. doi:10.1038/s41467-019-09127-8.
- Milanese et al. (2020) Milanese, E., Brink, T., Aghababaei, R., Molinari, J.F., 2020. Role of interfacial adhesion on minimum wear particle size and roughness evolution. Phys. Rev. E 102, 043001. doi:10.1103/PhysRevE.102.043001.
- Pei (2006) Pei, L., 2006. A numerical model for contact between fractal rough surfaces. Phd thesis. Johns Hopkins University.
- Pei et al. (2005) Pei, L., Hyun, S., Molinari, J.F., Robbins, M.O., 2005. Finite element modeling of elasto-plastic contact between rough surfaces. J. Mech. Phys. Solids 53, 2385–2409. doi:10.1016/j.jmps.2005.06.008.
- Persson (2001) Persson, B.N.J., 2001. Theory of rubber friction and contact mechanics. J. Chem. Phys. 115, 3840–3861. doi:10.1063/1.1388626.
- Persson (2014) Persson, B.N.J., 2014. On the fractal dimension of rough surfaces. Tribol. Lett. 54, 99–106. doi:10.1007/s11249-014-0313-4.
- Persson et al. (2005) Persson, B.N.J., Albohr, O., Tartaglino, U., Volokitin, A.I., Tosatti, E., 2005. On the nature of surface roughness with application to contact mechanics, sealing, rubber friction and adhesion. J. Phys.: Condens. Matter 17, R1. doi:10.1088/0953-8984/17/1/R01.
- Pham-Ba et al. (2020) Pham-Ba, S., Brink, T., Molinari, J.F., 2020. Adhesive wear and interaction of tangentially loaded micro-contacts. Int. J. Solids Struct. 188–189, 261–268. doi:10.1016/j.ijsolstr.2019.10.023.
- Popov and Pohrt (2018) Popov, V.L., Pohrt, R., 2018. Adhesive wear and particle emission: Numerical approach based on asperity-free formulation of Rabinowicz criterion. Friction 6, 260–273. doi:10.1007/s40544-018-0236-4.
- Queener et al. (1965) Queener, C.A., Smith, T.C., Mitchell, W.L., 1965. Transient wear of machine parts. Wear 8, 391–400. doi:10.1016/0043-1648(65)90170-5.
- Rabinowicz (1953) Rabinowicz, E., 1953. A quantitative study of the wear process. Proc. Phys. Soc. London, Sect. B 66, 929. doi:10.1088/0370-1301/66/11/304.
- Rabinowicz (1958) Rabinowicz, E., 1958. The effect of size on the looseness of wear fragments. Wear 2, 4–8. doi:10.1016/0043-1648(58)90335-1.
- Rabinowicz (1995) Rabinowicz, E., 1995. Friction and wear of materials. 2nd ed., Wiley, New York.
- Rabinowicz and Tabor (1951) Rabinowicz, E., Tabor, D., 1951. Metallic transfer between sliding metals: an autoradiographic study. Proc. R. Soc. Lond. A 208, 455–475. doi:10.1098/rspa.1951.0174.
- Reye (1860) Reye, T., 1860. Zur Theorie der Zapfenreibung. Der Civilingenieur 6, 235–255.
- Tabor (1951) Tabor, D., 1951. The hardness of metals. Monographs on the physics and chemistry of materials, Clarendon Press, Oxford.
- Vakis et al. (2018) Vakis, A.I., Yastrebov, V.A., Scheibert, J., Nicola, L., Dini, D., Minfray, C., Almqvist, A., Paggi, M., Lee, S., Limbert, G., Molinari, J.F., Anciaux, G., Aghababaei, R., Echeverri Restrepo, S., Papangelo, A., Cammarata, A., Nicolini, P., Putignano, C., Carbone, G., Stupkiewicz, S., Lengiewicz, J., Costagliola, G., Bosia, F., Guarino, R., Pugno, N.M., Müser, M.H., Ciavarella, M., 2018. Modeling and simulation in tribology across scales: An overview. Tribol. Int. 125, 169–199. doi:10.1016/j.triboint.2018.02.005.
- Wang and Hsu (1996) Wang, Y., Hsu, S.M., 1996. Wear and wear transition modeling of ceramics. Wear 195, 35–46. doi:10.1016/0043-1648(95)06750-7.
- Weber et al. (2018) Weber, B., Suhina, T., Junge, T., Pastewka, L., Brouwer, A.M., Bonn, D., 2018. Molecular probes reveal deviations from Amontons’ law in multi-asperity frictional contacts. Nat. Commun. 9, 888. doi:10.1038/s41467-018-02981-y.
- Wu (2000) Wu, J.J., 2000. Simulation of rough surfaces with FFT. Tribol. Int. 33, 47–58. doi:10.1016/S0301-679X(00)00016-5.
- Zhang and Alpas (1997) Zhang, J., Alpas, A.T., 1997. Transition between mild and severe wear in aluminium alloys. Acta Mater. 45, 513–528. doi:10.1016/S1359-6454(96)00191-7.
- Zum Gahr (1989) Zum Gahr, K.H., 1989. Sliding wear of ceramic-ceramic, ceramic-steel and steel-steel pairs in lubricated and unlubricated contact. Wear 133, 1–22. doi:10.1016/0043-1648(89)90109-9.
- Zum Gahr et al. (2001) Zum Gahr, K.H., Blattner, R., Hwang, D.H., Pöhlmann, K., 2001. Micro- and macro-tribological properties of SiC ceramics in sliding contact. Wear 250, 299–310. doi:10.1016/S0043-1648(01)00595-6.
See pages 1,2,3 of supplementary.pdf