Physical properties and thermal stability of Fe5-xGeTe2 single crystals
Abstract
The magnetic and transport properties of Fe-deficient Fe5GeTe2 single crystals (Fe5-xGeTe2 with 0.3) were studied and the impact of thermal processing was explored. Quenching crystals from the growth temperature has been previously shown to produce a metastable state that undergoes a strongly hysteretic first-order transition upon cooling below 100 K. The first-order transition impacts the magnetic properties, yielding an enhancement in the Curie temperature from 270 to 310 K. In the present work, 550 K has been identified as the temperature above which metastable crystals are obtained via quenching. Diffraction experiments reveal a structural change at this temperature, and significant stacking disorder occurs when samples are slowly cooled through this range. The transport properties are demonstrated to be similar regardless of the crystal’s thermal history. The scattering of charge carriers appears to be dominated by moments fluctuating on the Fe(1) sublattice, which remain dynamic down to 100-120 K. Maxima in the magnetoresistance and anomalous Hall resistance are observed near 120 K. The Hall and Seebeck coefficients are also impacted by magnetic ordering on the Fe(1) sublattice. The data suggest that both electrons and holes contribute to conduction above 120 K, but that electrons dominate at lower when all of the Fe sublattices are magnetically ordered. This study demonstrates a strong coupling of the magnetism and transport properties in Fe5-xGeTe2 and complements the previous results that demonstrated strong magnetoelastic coupling as the Fe(1) moments order. The published version of this manuscript is DOI:10.1103/PhysRevMaterials.3.104401 (2019).
I Introduction
Van der Waals (vdW) bonded materials with quasi-2D crystal structures present many scientific opportunities for materials physics and can promote advanced functionality by combining complementary properties in van der Waals heterostructures.Geim and Grigorieva (2013) Magnetically-active vdW materials are particularly attractive for complementing the electrical and optical properties of materials like graphene and transition metal dichalcogenides.Burch et al. (2018); Li et al. (2019) Indeed, several magnetic vdW materials have been exfoliated to the monolayer limit and magnetic order was found to persist, typically with a reduction in critical temperature relative to that of the bulk.Park (2016); Duong et al. (2017); Burch et al. (2018); Li et al. (2019) Naturally, such pursuits promote a desire to identify vdW materials with magnetic order above room temperature.
Fe5-xGeTe2, sometimes referred to as Fe5GeTe2 , has recently emerged as an interesting vdW material.Stahl et al. (2018); May et al. (2019) This phase is unique from Fe3-xGeTe2,Deiseroth et al. (2006); Chen et al. (2013); Verchenko et al. (2015); May et al. (2016); Liu et al. (2017); Wang et al. (2017); Yi et al. (2017); Nguyen et al. (2018) which has been studied as a vdW ferromagnet that can be exfoliated to the monolayer limit.Fei et al. (2018); Deng et al. (2018) In the bulk, Fe5-xGeTe2 has a higher Curie temperature (260-310 K) than Fe3-xGeTe2 (150-240 K).Deiseroth et al. (2006); Chen et al. (2013); Verchenko et al. (2015); May et al. (2016); Stahl et al. (2018); May et al. (2019) For Fe5-xGeTe2, magnetic order has been demonstrated near room temperature in exfoliated flakes with thicknesses of 10 nm.May et al. (2019) In both materials, Fe vacancies likely play a key role in determining the physical properties. Based on chemical analysis via wavelength dispersive spectroscopy, the vapor-grown crystals utilized in this study have a composition of Fe4.7(2)GeTe2.May et al. (2019)
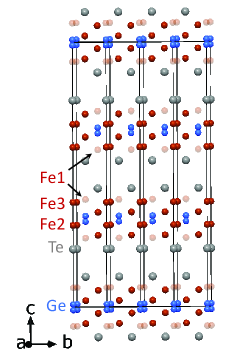
Two similar crystal structures have been reported for Fe5-xGeTe2, with structures derived from single-crystal diffraction data collected using crystals that were synthesized differently.Stahl et al. (2018); May et al. (2019) These structures with rhombohedral lattice centering have three Fe5-xGeTe2 layers per unit cell, as shown in Fig.1, and at complete occupancy the composition would reach Fe5GeTe2 if the vdW gaps remain empty. Both reported structures possess vacancy-induced disorder and a Ge split site. Our model, obtained using data collected on quenched crystals has a higher symmetry (space group , No. 166)May et al. (2019) than that reported by Stahl et al (space group , No. 160).Stahl et al. (2018) As illustrated in Fig.1, this model contains 3 Fe sites per unit cell. The Fe(1) position is treated as a split-site and it can be occupied either above or below the neighboring Ge atom, or Fe(1) can be vacant. Depending on occupation, the Ge atoms shift along the -axis to maintain an appropriate bond distance (hence a split site for Ge). In the lower symmetry model, the Fe(1) equivalent positions are not treated as split sites and are always ‘up’ in a layer. STEM imaging on vapor grown crystals observed different types of short range order associated with the Fe(1) site occupation, supporting the Fe(1) split site model for such crystals.May et al. (2019) The lower symmetry model comes from data collected on crystals that were cooled naturally in the furnace and the higher symmetry model came from crystals that were vapor grown and quenched from 1023 K into an ice-water bath. The act of quenching was observed to greatly reduce the broadening of x-ray diffraction peaks,May et al. (2019) which were modeled by Stahl et al as due to domains containing stacking faults.Stahl et al. (2018) These prior results suggest a phase transition in Fe5-xGeTe2 exists between 1023 K and room temperature, making quenched crystals metastable. Addressing the thermal stability of quenched crystals is one aspect of this manuscript.
Fe5-xGeTe2 is essentially an easy-axis ferromagnet with moments preferring to orient along [001], though the magnetism is not particularly simple due to the presence of multiple Fe sublattices. Depending on the thermal history, ranges from 260 to 310 K. The compositional dependence of has not been established. Mössbauer spectroscopy on a polycrystalline sample revealed that moments on the Fe(1) sublattice order below 100-120 K while the majority of moments order at . Interestingly, crystals that are quenched from the growth temperature have 270 K, but upon cooling below 100 K they undergo a ‘permanent’ first-order transition to a state with enhanced magnetization for which =310 K.May et al. (2019) This is reminiscent of relaxation effects that occur in FeMnP-based magnetocaloric materials upon their first thermal cycling.Tegus et al. (2013) A reversible magnetoelastic effect was observed in polycrystalline Fe5-xGeTe2 that is coupled to the ordering on the Fe(1) moments.May et al. (2019) The dynamic behavior of the Fe(1) sublattice and the associated magnetoelastic effect appear to be dominant in Fe5-xGeTe2 crystals regardless of their thermal histories. The intrinsic magnetoelastic effect is likely a driving force for the first-order transition in the metastable, quenched crystals. After the first thermal cycle, the magnetization () of the quenched crystals are not thermally-hysteretic (for 2 K 380 K). A magnetoelastic effect associated with the magnetic order of the Fe(1) sublattice is expected to persist even in the phase with enhanced . Non-quenched crystals (furnace cooled) also have non-hysteretic () but they are distinct from those of quenched crystals. In all cases, the saturation moment at 2 K is 2/Fe and the Fe(1) sublattice remains (mostly) dynamic down to approximately 100 K.
In this work, we compare the magneto-transport and magnetic properties among Fe5-xGeTe2 crystals (0.3) with the thermal histories described above. The temperature dependence of the resistivity and the behaviors of the Hall effect and magnetoresistance are essentially independent of the processing conditions, indicating these that properties are not particularly sensitive to stacking faults. A maximum is observed in the magnetoresistance and in the anomalous Hall effect near 120 K, close to where the Fe(1) sublattice orders magnetically. The transport data suggest that both electrons and holes contribute above 120 K, but electrons appear to dominate transport at lower . X-ray diffraction experiments up to 693 K were performed and reveal a structural transition near 550 K. Magnetization measurements confirm that crystals quenched from above this temperature are metastable.
II Methods
Single crystals of Fe5-xGeTe2 were grown in the presence of iodine under nearly-isothermal conditions (muffle furnace).May et al. (2019) Nominal compositions ranging from Fe4.7GeTe2 to Fe6.0GeTe2 were explored and similar magnetic properties were observed for the resulting crystals. Previous wavelength dispersive spectroscopy experiments suggested a composition of Fe4.7(2)GeTe2 for these crystals, while refinement of single crystal x-ray diffraction data yielded Fe4.87(2)GeTe2. We utilize the composition based on chemical analysis as the identifier for these crystals. A few growth temperatures were also explored and the only processing condition that impacted the observed magnetic behavior was the cooling rate. This implies that the growths occur at a fairly specific composition under these conditions.
The crystal growths occurred in vacuum sealed, argon-purged silica ampoules. The ampoules were generally 150 mm long with an inner diameter of 22 mm and an outer diameter of 25 mm; 0.1-0.2 g of iodine was utilized in such growths. Some growths were allowed to cool naturally in the furnace and these batches produced ‘non-quenched crystals’ while other growths were quenched into ice-water baths from 1023 K. For quenched crystals, iodine was rinsed from the surface using acetone and/or alcohol. When crystal growth was performed in an intentional temperature gradient, the binary Fe1+xTe phase sometimes formed at the cold end and the Fe5-xGeTe2 phase grew at the hot end on the source material. Crystal growths were performed starting with elemental Fe (99.98%, granules), Ge (99.999%, pieces) and Te (99.9999%, shot) with metals basis purity listed. A polycrystalline sample was also studied, which was synthesized using elemental powders that were ground together in a glovebox and the product was quenched from the reaction temperature of 973 K. Some of this polycrystalline sample was previously utilized for neutron powder diffraction and Mössbauer spectroscopy.May et al. (2019) For annealing studies, the samples were sealed in silica ampoules with argon exchange gas and quenched into an ice-water bath from the annealing temperature.
X-ray powder diffraction data were collected on as-quenched samples without grinding to minimize the impact of preferred orientation and samples were spun during data collection. Room-temperature data were collected with a PANalytical X’Pert Pro MPD utilizing a Cu K (=1.5406 Å) incident beam monochromator.
High temperature x-ray diffraction data were collected on a PANalytical Empyrian X-ray diffractometer with Cu K radiation. An Anton Paar XRK900 heating stage employing automatic variable temperature height adjustment was used to obtain data at each temperature, with helium flowing over the sample to minimize oxidation. Experiments performed on a single crystal utilized an average ramp rate of 2 K/min (including time spent as isothermal measurements every 20 K). For the polycrystalline experiments, an initial 6 h data collection and purging were performed at 298 K. The sample was then heated at 5 K/min to 373 K and subsequent ramping between data collections at 373 and 693 K were performed at 2 K/min. For the first two cycles, the measurement times at 373 K and 693 K were six hours each, and thereafter data collections of 3 h were employed. These measurements on powders were perfomed in 0.5 h scans and the patterns evolved during the first 1-2 h at 373 K on the warming cycle. The PANalytical software HighScore was utilized to sum consecutive scans and strip the diffraction from K radiation, as well as to obtain -spacings of individual reflections. Le Bail fitting and Rietveld refinements were performed using the program FullProf.Rodríguez-Carvajal (1993)
Physical property measurements were performed in Quantum Design Physical and Magnetic Property Measurement Systems. The properties of non-quenched crystals are not thermally hysteretic, at least in the range 2 380 K,May et al. (2019) while the magnetic properties of the quenched crystals are impacted by a first-order transition that occurs during the first cooling cycle to cryogenic temperatures. Data were collected upon cooling in an applied field unless otherwise noted.
III Results and Discussion
We begin by stating the nomenclature utilized to differentiate the thermal histories investigated. The crystals are non-quenched (NQ), quenched but not cooled below 200 K (Q-HT), and quenched plus thermally cycled (Q-C) to well below 100 K to induce the first order transition that enhances . The identifier Q-HT is meant to convey that the crystals are quenched with a high- phase and thus metastable. We also examined some polycrystalline specimens. The powders do not possess a first order transition even though they are quenched from the reaction temperature. The lack of thermal hysteresis in the magnetization of quenched powders is perhaps due to the inability to rapidly quench powders (lightly sintered and large masses), the lack of microstrain in powders due to the presence of additional defects, or some subtle differences in composition and/or short range orderings. A reversible magnetoelastic effect has been observed in the powder samples near 100 K via neutron powder diffraction.May et al. (2019) This coupling of magnetism and the lattice involves the magnetic order on the Fe(1) sublattice, and the behavior is expected to be present in all versions of Fe5-xGeTe2 inspected here (even Q-C).
III.1 Metastability in Quenched Fe5-xGeTe2 Crystals
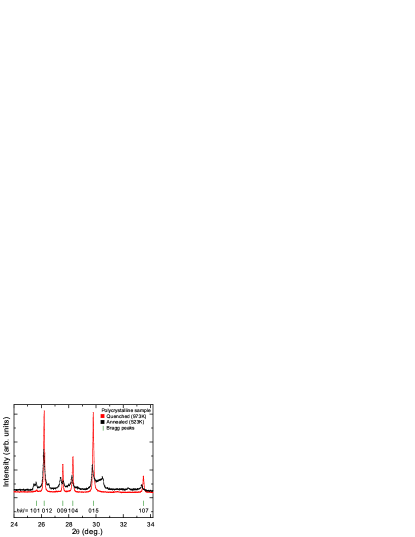
The impact of annealing on the x-ray powder diffraction data is shown in Fig. 2 for a polycrystalline sample of nominal composition Fe4.7GeTe2. When quenched from the reaction temperature of 973 K, the diffraction data are characterized by sharp Bragg peaks. Rietveld refinement of the data yield =4.0348(2)Å and =29.088(1)Å. We note that the single crystals and the powders reported previously had slightly larger -axis lattice parameters and it is difficult to know if this is an effect of composition or thermal history.Stahl et al. (2018); May et al. (2019) Figure 2 shows that annealing the quenched powder at 523 K for 257 h (followed by quenching) causes the diffraction data to have broadened reflections, as well as the emergence of some small peaks that might be due to impurities. The two curves in Fig. 2 were generated using two different potions of a 12 g polycrystalline reaction. Similar diffraction data are observed for polycrystalline samples that are allowed to cool to 300 K in the furnace after the high temperature reaction.Stahl et al. (2018) This reveals that some structural modification (or degredation) occurs between 523 and 973 K. Upon annealing at 523 K, both lattice parameters increase, though the data are not well modeled due to the broadening and peak shifting that is likely caused by stacking faults.Stahl et al. (2018) We also infer an increase in the -axis lattice parameter upon annealing quenched crystals at 523 K by inspecting diffraction data collected from the facets of quenched/annealed single crystals.
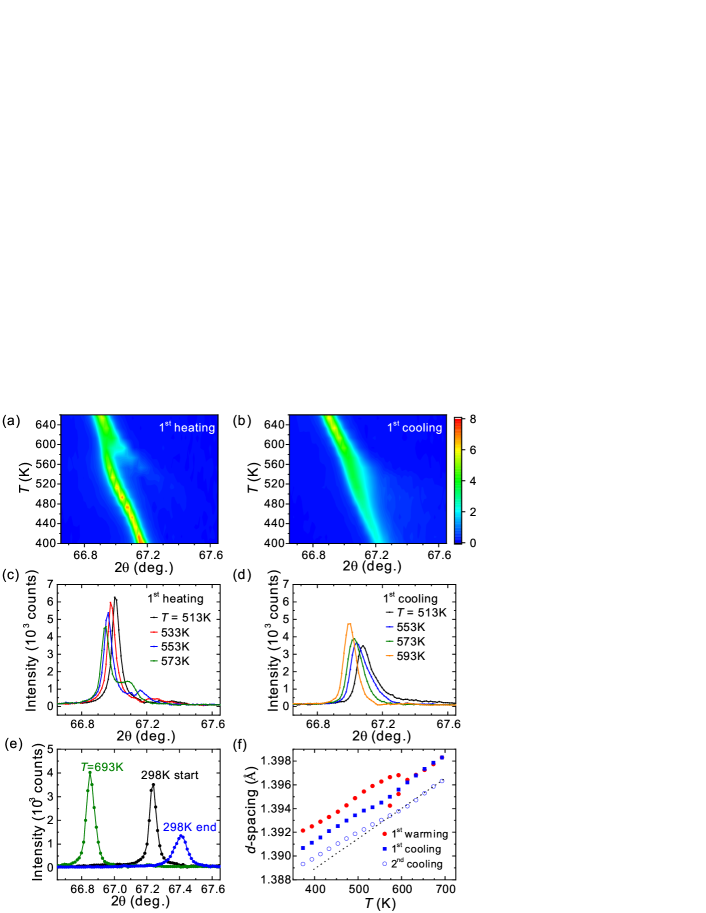

To provide more evidence for the structural change that is implied by the diffraction data in Fig. 2, we performed a temperature-dependent x-ray diffraction study on a quenched single crystal. Results are shown in Fig. 3 for the 0 0 21 Bragg reflection, which is representative of the behavior of all the 00 reflections. The behavior of the =21 reflection upon the first heating and cooling is shown in Fig. 3(a-d). Upon warming, the reflection broadens towards higher-angles and a second peak is observed starting near 530 K (Fig. 3(c)). Similar behavior was observed upon warming the second time as well. This may suggest a coexistence of structural phases, which is consistent with a first-order structural change, though clear coexistence is not observed upon cooling (Fig. 3(d)) where the transition looks more second-order. For a given 00 reflection, a single peak is clearly observed above 600 K. Upon cooling, the broadening returns (Fig. 3(b)) and the intensity decreases (Fig. 3(d)). Based upon these results, we define the transition temperature as 550 K. After thermal cycling, the diffraction peaks are broadened as compared to the first scan on the quenched crystal (Fig. 3(e)), consistent with the behavior of the polycrystalline samples. After thermal cycling, the integrated area for the highest intensity reflection (0 0 9) is within 4% of its starting value. The sharpest reflections and highest peak intensities are observed in the high state. After the high-temperature x-ray diffraction experiment, the magnetization () data obtained for this crystal were consistent with the data obtained on non-quenched crystals.
An irreversible change in the -axis lattice spacing occurred during the high-temperature diffraction experiment. This is qualitatively illustrated by the position of the reflection in Fig. 3(e). The shift in 2 at 298 K between the first scan and the last scan corresponds to a decrease in the -axis lattice parameter after warming above the transition and cooling back through . Results for the -axis parameter obtained from Le Bail fittings are shown in Table 1; data containing 00 reflections between 5 and 100 degrees 2 were fit. The results are consistent with our previous STEM experiments that revealed a smaller -axis parameter for non-quenched crystals in comparison to that observed in quenched crystals. Recall this crystal is starting the experiment in a quenched and metastable state.
| Scan No. | (K) | () |
|---|---|---|
| 1 | 298 | 29.2370(10) |
| 2 | 373 | 29.2549(6) |
| 18 | 639 | 29.3876(8) |
| 34 | 373 | 29.209(2) |
| 50 | 639 | 29.354(2) |
| 67 | 298 | 29.177(1) |
The changes in lattice spacing that occur while warming/cooling through the structural change can be viewed by tracking the -spacing of a given Bragg reflection, as shown in Fig. 3(f). The -spacing, which is directly proportional to the layer spacing in the crystal structure, decreased upon warming into the high- structure during both the first and second warming cycles. The changes upon cooling are more subtle, but clearly noticeable when the effect of thermal expansion is also considered (the dotted line in Fig.3(f) is meant to reveal this effect). The fact that the -spacing decreased again on the second thermal cycle may suggest a change in composition is occurring across the transition, but these details are not accessible with the current data and the trends could be caused by continuous changes in short range order or locations of atoms within the cell (kinetically limited). The data in Fig. 2 for powders annealed for over 10 d suggest that perhaps some impurities are formed but that the phase remains after a long-duration at a just below .
A temperature-dependent diffraction experiment was also completed using a polycrystalline sample and the results are shown in Fig. 4. A quenched powder with well-defined Bragg peaks was utilized (Fig. 4 panel 1); a small amount of unknown impurity was detected in this portion of sample (peak at 2=44.2∘). The experiment revealed that transformation to a state with significant stacking disorder happens rapidly at 373 K in the powder sample. This is evidenced by the significant suppression of intensity for 0 reflections in panel 2 of Fig. 4. However, the 110 Bragg reflection remains sharp at 373 K (even after cooling from high temperature, see panel 4). This indicates that the in-plane structure is not strongly affected by the structural change. These results are generally consistent with those in Fig. 2 for the powder annealed at 523 K. The in situ diffraction experiments resulted in greater stacking disorder, however, as evidenced by a stronger suppression of 0 reflections. The results in Fig. 4 were obtained using a portion of the quenched polycrystalline sample that was also utilized to perform the annealing study (Fig. 2). The powder looked slightly oxidized (brownish) after the in situ measurements, which may relate to the increase in impurity content. The measurements were performed in the following sequence: 1) quenched powder at 298 K, 2) 373 K, 3) 693 K, 4) 373 K, 5) 693 K, 6) 373 K, 7) 298 K. Data for steps 1-5 are shown in Fig. 4 with panels labeled by the step number. Data collected in steps 6 and 7 are not shown and are consistent with those in steps 2 and 4 (broadened 0 peaks). After this experiment, despite some apparent oxidation, the temperature-dependence of the magnetization of the powder is consistent with that of the furnace cooled single crystals.
These results do not directly probe the kinetics of the transformation of the metastable phase below but some information is gained. The polycrystalline sample shows the impacts of disorder (transformation) in diffraction data rapidly at 373 K. The data in panel 2 of Fig. 4 were collected after 3 h at 373 K because the diffraction pattern was clearly evolving during the first 1-2 h of data collection. The data obtained for Q-HT single crystals do not show broadening until over 500 K, although the 00 reflections are not especially sensitive to the stacking disorder that evidences the transition (and duration at 373 K was different for the two experiments). It is certainly possible that the kinetics are different in the crystals and the powders, and it is worth noting again that the polycrystalline sample had slightly different lattice parameters and the magnetic properties were not thermally hysteretic at low . It is also worth highlighting that the experiment does not probe the stability of the Q-C phase with the highest . This phase is probably more stable than the Q-HT phase, since the first-order transition relieves strain along [001] and induces stacking faults.May et al. (2019)
The high-temperature diffraction data clearly demonstrate a structural transition occurs near 550 K. Significant stacking disorder occurs upon cooling into the low state ( 550 K). The in-plane structure and average layer stacking remain coherent, although a reduction in domain size may occur. The transition appears to be reversible because both powder measurements at 693 K produced patterns with sharp diffraction peaks at similar positions. Also, the total integrated intensity of the 009 reflection does not change significantly during the single crystal experiment. These results imply that a simple decomposition is not likely to be the source for the structural change. Nanoscale probes would be necessary to determine if the transition relates to a eutectoid reaction that is kinetically or chemically hindered.
Stahl et al found that a combination of faultless and faulted domains best described the diffraction data of Fe5-xGeTe2 powders containing significant amounts of stacking disorder.Stahl et al. (2018) In light of the current results, the simulations by Stahl et al may have revealed that in some regions of the material the structural change upon cooling through is incomplete (kinetics) or incompatible with the local composition or the local short range order. The main impact on the average structure is the stacking disorder, which implies that a stacking-related transition occurs. Several types of symmetry changes could be associated with such a stacking transition, including the shift to a monoclinic cell as in vdW CrI3 and CrCl3.McGuire et al. (2015, 2017) In those systems, the main effect is a change in layer spacing with a larger layer spacing observed in the monoclinic phases that are the high states. Other types of stacking-related transitions are also possible, such as transitioning to one layer per unit cell or from the rhombohedral ABC stacking to a primitive AAA stacking. For all of these cases, intrinsic disorder (structural or chemical) could hinder a coherent structural transition and result in a crystal with significant stacking disorder. It is worth emphasizing that the structural model in Fig. 1 is an average structure for the high state because quenched (Q-HT) crystals were utilized for the single crystal x-ray diffraction data collection. The model obtained from the metastable quenched crystal has a higher symmetry and an associated increase in disorder (entropy) as compared to the model obtained by Stahl et al on naturally cooled samples.Stahl et al. (2018) Both models utilize rhombohedral lattice centering with ABC stacking.
Another explanation for the change in layer spacing, which could occur simultaneously with a change in space group, would be the existence of a small amount of Fe residing within the gap at high temperature. This may increase the bonding between the layers and reduce the layer spacing, which is what we observe upon warming above . The presence of Fe in the vdW gap at high would be entropically favored and could lead to a greater importance of kinetics in our in situ experiments. Fe atoms leaving the van der Waals gap and entering the metallic slabs (below ) would likely increase the lattice parameter, consistent with our annealing studies. Our original single crystal diffraction data on quenched crystals did not clearly reveal electron density within the van der Waals gap. However, a small amount of disordered Fe within the gap could be difficult to detect. The movement of copper into and out of the van der Waals gap was observed in CuInP2S6, where copper leaves the metallic slabs and enters the vdW gap above 315 K.Maisonneuve et al. (1997) Movement of copper ions is fairly common in materials, though the defects in Fe5-xGeTe2 may promote the movement of Fe. Due to the significant amount of stacking disorder, quantitative refinements of the diffraction data collected below 550 K were not possible. Utilizing single crystal diffraction (four circle) to examine the thermal displacement parameters upon cooling towards may prove especially insightful in isolating the microscopic origins of the phase transition. The extent to which the behavior around varies with Fe content could also be particularly informative, if the Fe content can be manipulated. Magnetization measurements after annealing at 523 K did not reveal a soft ferromagnetic component in () data at 350 K, and thus there is currently no evidence that any significant amount of Fe is being ejected from the crystal below .
With regard to Fe5-xGeTe2 , it may be useful to consider the lattice trends in Fe3-xGeTe2, another metallic vdW material with atomic disorder. In Fe3-xGeTe2, the -axis parameter decreases while expands upon the filling of Fe vacancies in the metallic slab.May et al. (2016) Such a decrease in can be viewed as typical for a quasi-2D material where the layer spacing is dominated by the bond distance between the large anions (which are forced apart when the intralayer distances increase, causing a compression along to compensate). The scenario would be different in Fe5-xGeTe2 if the total Fe content is fixed and Fe moves in and out of the vdW gap. The role of short range orders may be critical in Fe5-xGeTe2 , necessitating the use of real-space local probes such as scanning transmission electron microscope (STEM). In this regard, it is worth noting that previous STEM experiments revealed two types of short rage order. One of them produced alternating slab thicknesses, and could thus drive incoherence along [001] (see supporting information for Ref. 7).
These results demonstrate that Fe5-xGeTe2 crystallizes into a high- state and a structural transition that results in significant stacking disorder occurs upon cooling through 550 K. By quenching from , a metastable crystal is thus obtained and we identify such crystals by the label Q-HT. When the metastable Q-HT crystal is cooled sufficiently low in temperature (100 K), it undergoes a transition to a new state that we identify using the label Q-C. The Q-HT and Q-C states are magnetically unique from one another and from the state that is obtained by cooling slowly in the furnace (non-quenched, label NQ). The Q-C and NQ crystals have a large concentration of stacking faults that precluded us from solving the crystal structures via single crystal x-ray diffraction.
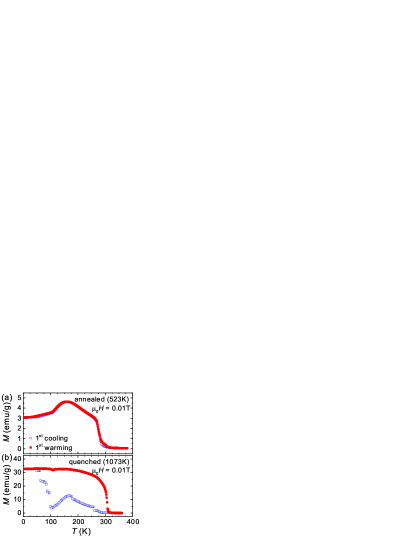
The impact of thermal history on the magnetization of quenched single crystals is introduced in Fig. 5. Figure 5(a) plots the temperature-dependent magnetization of a single crystal that was annealed at 523 K for 257 h. The crystal was originally quenched from its growth temperature of 1023 K and was also quenched from the annealing temperature of 523 K. The observed () is similar to what is seen in NQ single crystals that are allowed to cool naturally in the furnace (see below). The () data for a quenched crystal are shown in Fig. 5(b). Quenched crystals display a strong thermal hysteresis upon the first cooling below 100 K, with enhanced magnetization observed below 100 K and upon warming. Remarkably, the first-order phase transition near 100 K impacts the magnetization near 300 K with an enhancement in that is non-hysteretic in subsequent thermal cycling to cryogenic temperatures.
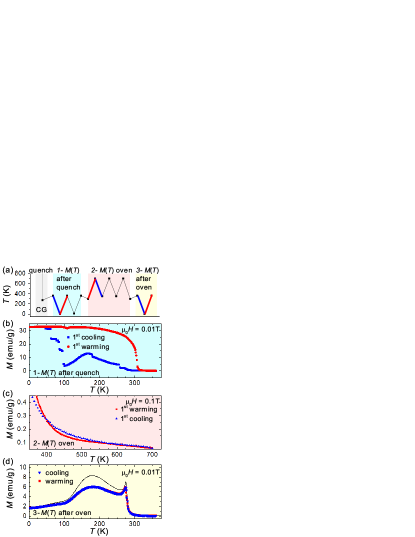
The thermal stability of quenched and non-quenched crystals was examined by () measurements during thermal cycling. The results shown in Fig. 6 demonstrate the existence of the different states of Fe5-xGeTe2 crystals in the order of Q-HT, Q-C, and finally NQ. The thermal history for this experiment is illustrated in Fig.6(a). The experiment began with quenching from the crystal growth (CG) temperature of 1023 K. In sequence, () data were obtained while crystals were cooled to 2 K (1 - light blue area), heated to 700 K (2 - light red area) and then cooled to 2 K (3 - yellow area). The data shown in Fig. 6(b-d) correspond to the blue (cooling) and red (warming) curves outlined in Fig. 6(a). The data in Fig.6(b-d) were collected on a single set of non-orientated crystals using a silica sample holder. While the crystals are not strictly oriented, the largest field projection was for and the crystals are free to rotate somewhat; these plate-like crystals align when placed on a permanent magnet at room temperature. Thus, it is reasonable to compare the data in Fig.6 to results for () with (at least for K), such as in Figs. 5(a),7,8 and Ref.7.
The first-order transition between Q-HT and Q-C is demonstrated in Fig.6(b) (repeated in Fig. 5(b)). The transition occurs at 100 K, where a sharp increase in the magnetization is observed upon the first cooling cycle of Q-HT crystals. In the () data, the transition is very sharp for small applied fields and the enhancement in is very apparent. If not cooled to near the transition at 100 K, the magnetization of the quenched Q-HT crystals is reversible with a Curie temperature similar to that in NQ crystals ( 270 K).
Magnetization data collected while warming to 700 K are shown in Fig. 6(c). These data are collected after those in Fig. 6(b), and thus the data for warming correspond to the Q-C state with = 310 K. Heating and cooling rates during the magnetization measurements are relatively slow, ranging from 2-4 K/min; isothermal sections were not utilized. Thus, after the measurement in the oven the crystals are expected to behave like the non-quenched crystals. This was indeed found to be the case, as illustrated in Fig. 6(d) by the lack of hysteresis and the overall shape of () upon measuring from 360 to 2 to 360 K . Magnetization data for an NQ crystal are shown as the solid curve in Fig. 6(d) for comparison ().
In Fig. 6(c), the warming and cooling curves are converged above 570 K. The diffraction data shown in Fig. 3 were collected more slowly than the magnetization data in Fig. 6(c), and the diffraction data reveal the onset of a structural change as low as perhaps 530 K for the metastable crystal. However, the diffraction data were collected using a Q-HT crystal (not Q-C crystal). Upon cooling, the single crystal diffraction peaks start broadening around 560-580 K, consistent with the magnetization results. The change in () near is negligible upon cooling, likely due to the fact that the dominant structure within each Fe5-xGeTe2 slab remains intact across the transition according to the sharpness of the 110 and related reflections. Thus, the response in the paramagnetic region is not expected to be significant.
Additional measurements were performed to further verify that metastable crystals are obtained by quenching from above 550 K, but the data are not shown for simplicity. Crystals annealed at 573 K (and quenched) displayed hysteretic () behavior consistent with a Q-HT to Q-C transition (similar to Fig. 6(b)). In addition, magnetization measurements on NQ crystals up to 700 K demonstrated a convergence of heating/cooling data above 575 K.
The () data suggest that the Q-C state of Fe5-xGeTe2 crystals can be stable up to at most 570 K. While powders and crystals may present different kinetics for the transformation, the quenched powder samples show signs of transfomation to a state with significant stacking disorder by 373 K. However, magnetization measurements show that the Curie temperature of Q-C crystals is stable and reversible in the range 2-380 K. This suggests that the first-order transition from Q-HT to Q-C, which relieves lattice strain,May et al. (2019) results in a more stable state that can perhaps survive up to the transition at . However, the rapid rate of magnetization measurements could skew the results and a more detailed investigation of the kinetics is necessary.
III.2 Magnetization
This section compares the magnetization in non-quenched (NC) to quenched plus thermally-cycled (Q-C) crystals. The Q-C crystals have =310 K that is coupled to the first-order transition observed upon first cooling Q-HT crystals below 100 K, as discussed in the previous section. The non-quenched (furnace-cooled) crystals have =275 K. As demonstrated by Fig. 7, the main differences in () are observed above 250 K. For NQ and Q-C crystals in the temperature ranges inspected in this section, the () data are not thermally hysteretic.
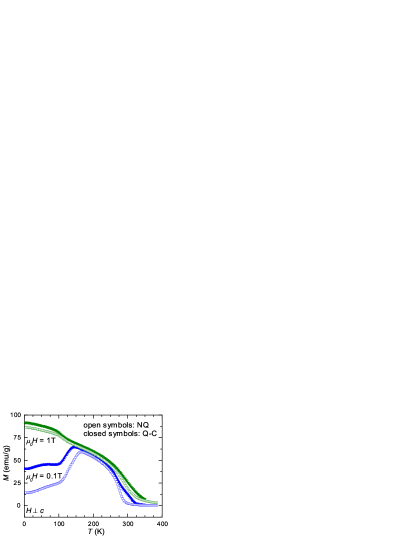
As shown in Fig. 7, the existence of several characteristic features in () suggests that the magnetism is not necessarily simple. The magnetization in small magnetic fields is characterized by a sharp onset near , followed by an increase in upon cooling towards a broad cusp. The temperature at which the cusp occurs depends on the orientation and magnitude of the applied field.May et al. (2019) A prominent feature is observed near 100-120 K with a reduced for cooling in small applied fields and a small enhancement in the magnetization for large applied fields. As was demonstrated in Ref. 7, the majority of the Fe(1) sublattice is magnetically disordered above 100-120 K. At 1.5 K, when Fe(1) is ordered, neutron diffraction data were modeled equally well by a ferrimagnetic model or a ferromagnetic model. However, at 160 K, the neutron powder diffraction data suggested ferromagnetic order.May et al. (2019) Together with the maximum in () for fields less than the saturation field ( 1 T), these results may suggest that Fe(1) moments are not aligned with the others, either due to spin canting or anti-parallel alignment (ferrimagnet) for .
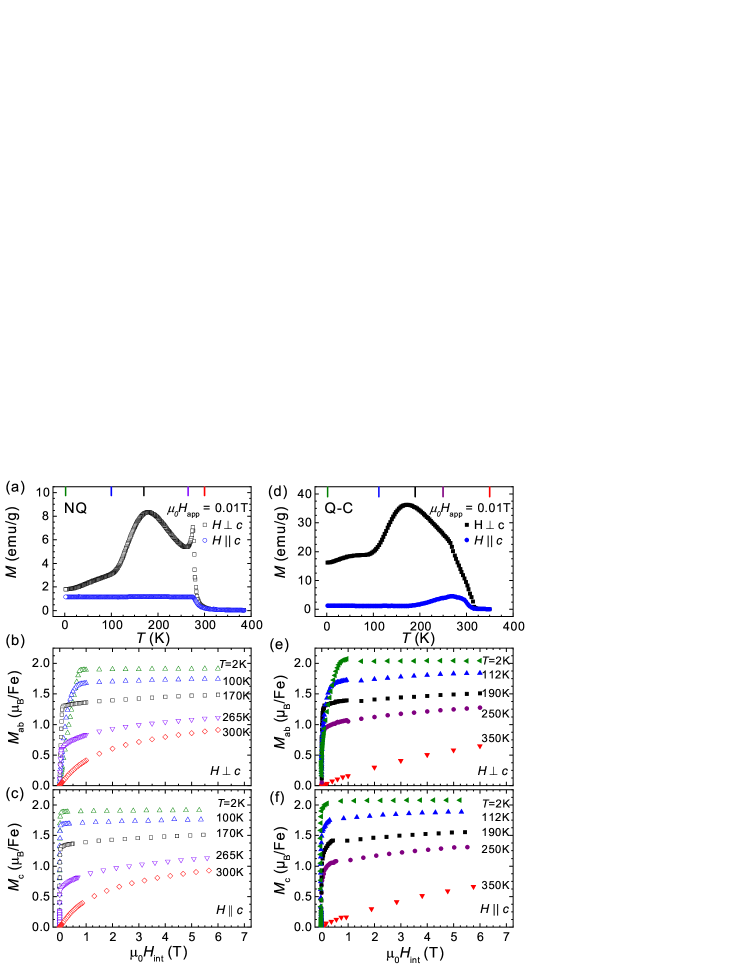
The anisotropic magnetization data are presented in Fig. 8. In the upper panels, Fig. 8(a,d), () are shown for an applied field of 0.01 T (data collected upon cooling). For this relatively small applied field, a strong cusp is observed near 275 K in () of the NQ crystal for , while the data for Q-C crystals display a shoulder at this temperature. The cusp may be a particularly interesting feature, perhaps relating to some complex spin texture or domain structure,Onose et al. (2005); Chattopadhyay et al. (2009); Ghimire et al. (2013) though canting or the onset of ferrimagnetism could also cause such behavior. The low-field results also differ in the extent to which the data for change with , with slightly more temperature dependence observed for the Q-C crystals (likely due to the sublattice component with =310 K).
As shown in Fig. 8(a,d), the induced moment is larger for fields applied within the basal plane compared to when the field is applied along the -axis. However, demagnetization effects impact the apparent anisotropy and () since the total field (external plus demagnetizing) is changing significantly as a function of temperature. Due to this complication, examining anisotropy via () or a susceptibility-like quantity as is not particularly useful or valid.
The anisotropy of the magnetization is best examined through isothermal magnetization data () ; such data for NQ crystals are shown in Fig. 8(b,c) (left panels) while data for Q-C crystals are shown in Fig. 8(e,f) (right panels). The data suggest that the moments in Fe5-xGeTe2 are easily polarized with relatively little anisotropy observed; easy-axis anisotropy with moments preferring to orient along [001] exists below at least 100 K. This behavior appears to be independent of thermal history. The effect of a demagnetizing field has been estimated for using =0.9 to obtain the internal field = - where is the magnetization per unit volume and the multiplier is necessary for cgs units.Chen et al. (2002) Without applying a demagnetization correction, Fe5-xGeTe2 appears to have essentially zero anisotropy. Even with the correction, the anisotropy is somewhat small and increases when all of the Fe sublattices are ordered. The easy-axis magnetism of Fe4.7GeTe2 crystals has an anisotropy field on the order of 1 T at 2 K. It is reasonable to speculate that this may change significantly between samples if the Fe-content varies.
In Fe3-xGeTe2, the anisotropy changes strongly with Fe content.May et al. (2016) For Fe3-xGeTe2 compositions with small , the anisotropy reaches 5 T with easy-axis magnetism observed.Deiseroth et al. (2006); Chen et al. (2013) While for large vacancy concentrations (Fe2.75GeTe2), the anisotropy is reduced to approximately 1 T. One goal for chemical manipulation of Fe5-xGeTe2 would be to enhance the magnetic anisotropy, particularly at high . It would be interesting to see if this property could be tuned by extrinsic substitutions, as well as by controlling the Fe content.
III.3 Transport Properties
The transport properties of non-quenched and quenched single crystals are quite similar, as shown in Fig. 9. All reported data are for transport within the basal plane (). The electrical resistivity did not possess any significant hysteresis around the first-order transition between the Q-HT and Q-C phases, making transport appear rather different than the magnetization. It would be interesting to see if a different behavior were observed for the resistance along the axis, since the structural transition clearly disrupts the layer stacking but not necessarily the in-plane structures. The lack of hysteresis for in-plane transport is likely related to the lack of temperature dependence in above 120 K. This temperature dependence suggests that magnetic fluctuations on the Fe(1) sublattice provide the dominant temperature-dependent source of carrier scattering. Such Fe(1) moment fluctuations seemingly exist in all Fe5-xGeTe2 phases above 100-120 K. The magnetotransport data reported in this section further support this picture. The relatively large resistivity is likely further caused by static structural disorder that adds a temperature-independent scattering term that reduces the carrier lifetime.
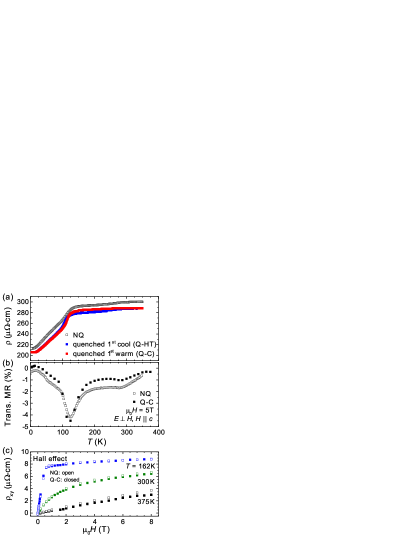
As shown in Fig. 9(b), the magnetoresistance (MR) has a maximum at 120 K, near where Fe(1) orders, and similar behavior is observed for the different Fe5-xGeTe2 phases/crystals (NQ, Q-C). The Hall effect data are also similar for the different types of crystals, as shown in Fig. 9(c). The data in Fig. 9(b) are for transverse MR, with and electric current flowing within the basal plane. The magnetoresistance is determined by MR = , and only the even contribution is included, . The data in Fig. 9(b) for the NQ crystal are an exception because these MR results only utilized the value of T to evaluate the temperature dependence of MR. For all Hall effect data, only the odd contribution is included, .
Hall effect data are shown in Fig. 9(c) for both NQ and Q-C crystals. Quantitative agreement of the data is observed for these two crystals. This further reveals that the thermal histories have little impact on the transport properties, though we are primarily concerned with the qualitative behaviors observed. The same Q-C crystal was used to collect the Hall effect data in Fig. 9(c) and the MR data in Fig. 11, as well as the Hall effect data in Figs. 12, 13, 14. A six wire configuration was employed to collect MR and Hall effect data simultaneously, thus allowing a calculation of the Hall conductivity . Additional samples were also measured for comparison and the results were consistent with those shown.
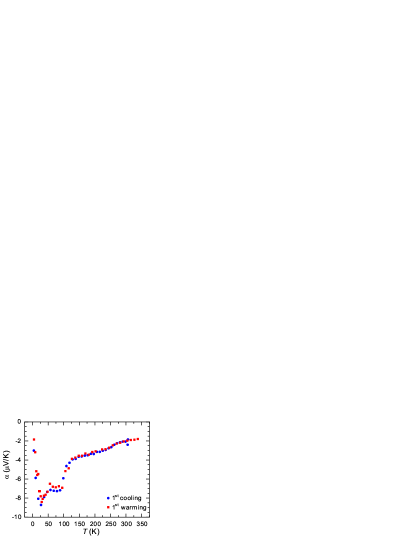
The Hall effect data at and above room temperature suggest hole-like conduction (Hall coefficient ). However, as shown in Fig. 10, the Seebeck coefficient is negative. Like the Hall coefficient, the sign of the Seebeck coefficient is typically taken as an indication of the type of charge carrier ( for -type, for -type in a single carrier system). The behavior of and thus suggest that both holes and electrons contribute to conduction. Indeed, the temperature dependence of is not consistent with a single carrier-type metal. In a simple metal or heavily-doped semiconductor, the magnitude of increases linearly with . In Fe5-xGeTe2 , is trending towards zero above 125 K and this suggests a compensated system (contributions from holes and electrons cancel one another). Upon cooling below 120 K, the negative value of the Seebeck coefficient is increased and some sharp features are observed at lower . necessarily goes to zero at . These results suggest a change in the electronic structure occurs when the Fe(1) moments order. While the Seebeck coefficient is senstivie to changes in carrier scattering, it is the energy dependence of the relaxation time that impacts the Seebeck coefficient and not the absolute value of the carrier’s relaxation time.Fistul (1969); Ziman (1963) Thus, this effect is likely different from that driving the temperature depedence of the resistivity, even though they are both linked to magnetism on the Fe(1) sublattice. A change in electronic structure is reasonable given that a magnetoelastic effect was previously observed around 100 K via neutron powder diffraction.May et al. (2019) It was demonstrated that upon cooling through 100 K, the lattice parameter increases and the lattice parameter decreases. The ratio increases upon cooling from 300 K to 125 K, decreases at the transition and then decreases upon cooling below 100 K. In light of the Seebeck coefficient results, there appears to be a strong coupling between the lattice, magnetism and electronic structure in Fe5-xGeTe2 . To complement these results, the temperature evolution of the magnetotransport is considered in detail below.
III.3.1 Magnetoresistance
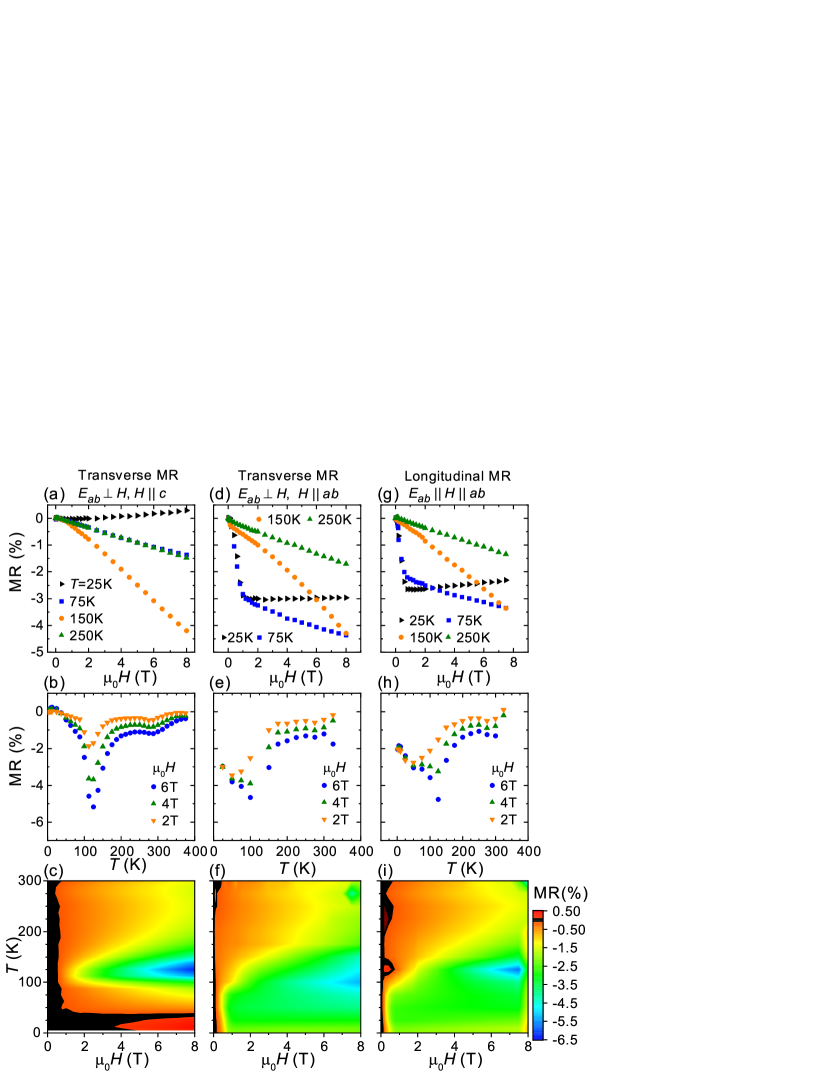
Various MR data are shown in Fig. 11; data are for a Q-C crystal but similar results are expected for all crystal types based on the results in Fig. 9. The three columns contain data for different orientations of the applied magnetic field. In all cases, the electric field is within the plane . For transverse MR, the magnetic field and electric current are perpendicular to one another. Two transverse MR configurations were examined, defined by (Fig. 11(a,b,c)) and (Fig. 11(d,e,f)). The longitudinal MR has both the magnetic field and the electric current within the plane and parallel to one another (Fig. 11(g,h,i)). For these three columns, the top row (panels a,d,g) presents the field-dependent data at a few temperatures. The middle row presents the temperature dependence at a few fixed fields. The color of the contour plots in Fig. 11(c,f,i) relates to the MR as indicated in the legend, with black indicating that the MR0 (MR0.1%). Data were collected down to 25 K using steps of 25 K, followed by measurements at 10, 5, and 2 K. The magnitude of the magnetic field was decreased from 8 T by 0.5 T down to 2 T, then by 0.2 T down to 0.2 T, followed by a step size of 0.025 T to =0.
For all MR orientations, MR is predominantly negative and reaches a maximum magnitude near 120 K. A small peak in MR is observed near 300 K (Fig. 11(b)), suggesting that the loss of fluctuations at have some impact on the MR. Typically, MR will peak near the Curie temperature in a ferromagnet due to scattering by such fluctuations. The maximum in MR near 120 K is thus evidence of the strong scattering of electrons by critical fluctuations on the Fe(1) magnetic sublattice. For transverse MR with , the MR has a small and positive value at the lowest temperature and largest field. This is likely due to loss of fluctuating moments at low (for ) combined with the normal increase in resistance due to Lorentz effects.
Saturation of the MR with increasing field is easily observed when , for , as shown in Fig. 11(d,g). While MR never becomes positive for , the high-field slope of MR() does become positive for low temperatures. This indicates that a positive MR contribution (presumably from Lorentz forces) exists on top of the step-like drop in resistance that occurs when the moments are polarized into the basal plane by the applied field. The step-like drop in resistance when is likely related to a reconfiguration of the Fermi surface upon reorienting the moments in this itinerant system. The ordering of the Fe(1) sublattice clearly impacts the Fermi surface, as demonstrated through Hall and Seebeck coefficient data. It is reasonable that the orientation of the moments may also impact the electronic structure. Anisotropic electron-spin scattering may also be important to some degree.
III.3.2 Hall Effect
Upon cooling towards and below , non-linearity in develops due to an anomalous Hall contribution (see Fig. 9(c)). Multi-carrier conduction can also cause non-linearity in the field dependence of the Hall coefficient, though such field dependence is dictated by properties of the carriers. For Fe5-xGeTe2 , the clear evolution of an anomalous contribution with temperature suggests that magnetic polarization effects are influencing the Hall coefficient even above .
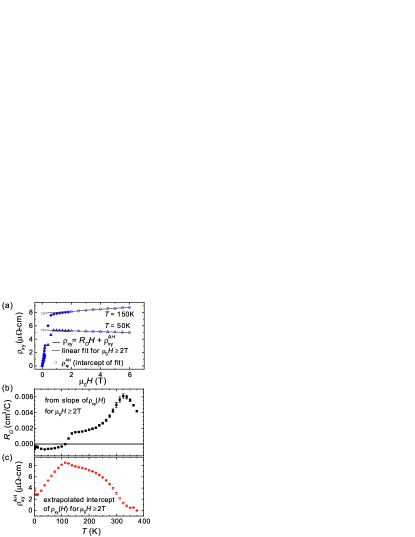
When an anomalous Hall effect is present, the Hall coefficient is typically considered as a sum of an ordinary () and an anomalous contribution ( or ).Nagaosa et al. (2010) The Hall resistivity is measured experimentally and a common representation is
| (1) |
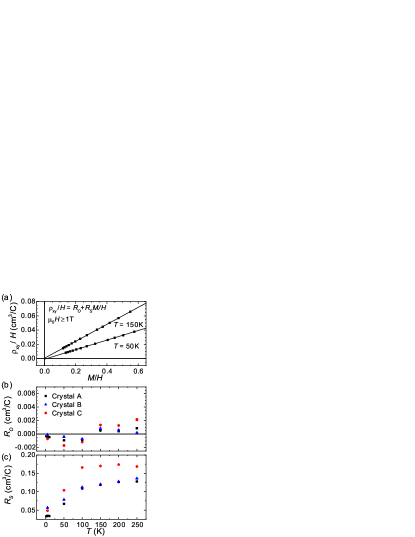
The anomalous resistivity is typically obtained as the intercept of a linear fit to versus at fields where is linear in (when the induced magnetization is saturated). The slope of this linear fit provides the ordinary Hall coefficient, allowing access to the carrier density in the traditional manner when a single band model is appropriate. Such an analysis is demonstrated in Fig. 12(a). The anomalous Hall resistivity can be written as originating from an anomalous Hall coefficient () and the magnetization () parallel to the applied field, . This allows one to address the impact of the magnetization on the Hall effect data, and one approach for such an analysis is to transform Eqn. 1 into
| (2) |
By plotting versus , the ordinary Hall coefficient is obtained from the intercept and the anomalous Hall coefficient from the slope. This method can be more rigorous than utilizing Eqn. 1 to obtain , because it includes the field dependence of instead of assuming it is a constant. can be positive or negative, regardless of . For Fe5-xGeTe2 , both approaches give the same qualitative results; some quantitative differences in the ordinary Hall coefficient are observed.
The data are first analyzed using the approach of Eqn.1, as illustrated in Fig. 12(a). As shown in Fig. 12(b), the ordinary Hall coefficient changes sign near 120 K, indicating a dominance of electron-like contributions for 120 K. Around this same temperature, the anomalous Hall resistivity reaches a maximum (Fig. 12(c)), as does the MR. While the magnitude of the ordinary Hall coefficient obtained in this manner may be slightly impacted by the magnetization, the qualitative result is supported by the more detailed analysis that considers the impact of the induced magnetization (Eqn. 2). The largest artifacts are likely observed near , where strong polarization effects are observed in () without clear saturation.
The data are analyzed using the approach of Eqn.2 in Fig. 13. The results are generally consistent with those reported in Fig. 12, and the change in sign of near 100 K is again observed. To illustrate reliability of these trends, results from measurements on three separate Q-C crystals are shown in Fig. 13(b,c), where one set of () values were utilized but data were collected for each crystal. Crystal A is the same as that utilized to generate the data shown in Figs. 11 and 12.
The analysis method employing Eqn.2 is illustrated in Fig. 13(a). This approach yields an anomalous Hall coefficient, which is the proportionality between the anomalous resistivity and the magnetization. When anomalous scattering effects are not important, this coefficient should be related to the band structure of the ordered state, and it is thus reasonable that is relatively independent of temperature for 100 K 250 K where ordered moments are well established. We note that the resistivity is also independent of in this region, and is typically proportional to in a manner that depends on the model being considered.Nagaosa et al. (2010) Below 100 K, the Fe(1) sublattice orders and this causes a clear change in the band structure as indicated by the change in the sign of the ordinary Hall coefficient. Upon cooling below 100 K, begins to decrease, and this leads to the maximum in observed in Fig. 12(c). We note that the same results are obtained when is replaced with in Eqn.2 and the effects of the internal and demagnetizing fields are incorporated into the analysis.
From a theoretical perspective, the anomalous Hall conductivity is typically considered. When intrinsic, this conductivity is related to Berry curvature in the electronic structure and can be addressed from first principles calculations. It is thus a property of topological significance. Experimentally, it is difficult to determine when is due to intrinsic electronic structure effects as opposed to scattering effects.Nagaosa et al. (2010) Due to the nature of the conductivity matrix, the longitudinal resistivity impacts the Hall conductivity: = /(()2+()2) (and this is usually /()2). Since the anomalous Hall conductivity is nominally an =0 effect in a ferromagnet, we utilize the =0 values for and to obtain .
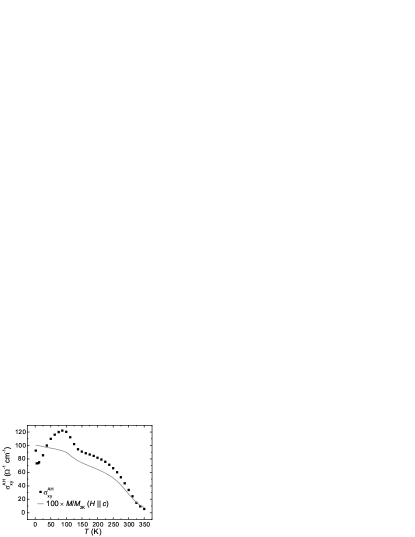
The anomalous Hall conductivity of Fe4.7(2)GeTe2 is plotted as a function of temperature in Fig. 14. reaches a maximum just below the ordering temperature of the Fe(1) sublattice. Above approximately 150 K, the results reveal an order-parameter like increase that can be considered as driven by the magnetization. It is difficult to know if the behavior at lower is intrinsic and driven by changes in the electronic structure that were evidenced by and and are perhaps associated with changes in the magnetization itself. At this point, scattering effects and/or changes in cannot the excluded. We note that is not linear with either or below 125 K where some temperature dependence of is observed. Thus, we can only say that the conductivity shown in Fig. 14 generally represents the maximum intrinsic anomalous Hall conductivity for Fe4.7GeTe2 crystals (within error).
The transport properties share some similarities with those observed in Fe3-xGeTe2. In both of these ternary Fe-Ge-Te phases, a positive Hall coefficient and negative Seebeck coefficient are observed above , demonstrating that both electrons and holes contribute to conduction. The anomalous Hall contribution is positive for both materials. The resistivity values at 300 K are similar in both compounds and the scattering of carriers by vacancies is expected to be significant. Magnetic fluctuations appear to provide the dominant temperature-dependent source for carrier scattering in both materials. For flux-grown Fe3-xGeTe2 with , there is little temperature dependence of above 150 K.May et al. (2016)
IV Summary
The thermal stability of quenched Fe4.7(2)GeTe2 crystals was examined by in-situ diffraction and magnetization measurements to 700 K as well as annealing studies, and a transition was observed at 550 K. This is the critical temperature for a transition between a low- and high- crystal structure, though the microscopic change in structure remains unclear. Samples quenched from above are thus metastable, and upon cooling to cryogenic temperatures these crystals undergo a first-order transition below 100 K to a state with higher . Based upon magnetization measurements, this state with enhanced appears stable to at most . The extent to which this instability remains in exfoliated samples would be interesting to determine since the transition at appears to mainly affect layer stacking.
The transport data provide a complementary perspective on the magnetic complexity of Fe4.7(2)GeTe2. The in-plane transport data do not appear to be strongly impacted by thermal history. This is consistent with the diffraction-based evidence that the in-plane crystal structure is not strongly impacted across . The in-plane transport data reveal that dynamic moments on the Fe(1) sublattice strongly scatter charge carriers (above 120 K). A maximum in the magnetoresistance and anomalous Hall resistivity is observed near 120 K, above which the resistivity has very little temperature dependence. The Hall and Seebeck coefficients reveal that both holes and electrons contribute to charge transport when Fe(1) moments are fluctuating. However, it appears that hole conduction is eliminated or strongly suppressed when the Fe(1) moments order. This reconstruction of the Fermi surface could be interesting to inspect using various spectroscopic techniques. In this regard, it is worth noting that the magnetic ordering of the Fe(1) sublattice is coupled to the lattice via a magnetoelastic effect that is expected to be present, and reversible, in all Fe4.7(2)GeTe2 specimens. In addition to employing other characterization techniques and theoretical calculations, it would be valuable to find a way to vary the Fe-content in crystals and explore how the physical properties and metastability depend on composition.
V Acknowledgments
This work was supported by the U. S. Department of Energy, Office of Science, Basic Energy Sciences, Materials Sciences and Engineering Division. High-temperature x-ray diffraction experiments (C.A.B.) were sponsored by the Laboratory Directed Research and Development Program of Oak Ridge National Laboratory, managed by UT-Battelle, LLC, for the U. S. Department of Energy. We thank Brian Sales and Satoshi Okamoto for useful discussions.
References
- Geim and Grigorieva (2013) A. K. Geim and I. V. Grigorieva, Nature 499, 419 (2013).
- Burch et al. (2018) K. S. Burch, D. Mandrus, and J.-G. Park, Nature 563, 47 (2018).
- Li et al. (2019) H. Li, S. Ruan, and Y.-J. Zeng, Adv. Mater.early online, 1900065 (2019).
- Park (2016) J.-G. Park, J. Phys.: Condens. Matter 28, 301001 (2016).
- Duong et al. (2017) D. L. Duong, S. J. Yun, and Y. H. Lee, ACS Nano 11, 11803 (2017).
- Stahl et al. (2018) J. Stahl, E. Shlaen, and D. Johrendt, Z. Anorg. Allg. Chem. 644, 1923 (2018).
- May et al. (2019) A. F. May, D. Ovchinnikov, Q. Zheng, R. Hermann, S. Calder, B. Huang, Z. Fei, Y. Liu, X. Xu, and M. A. McGuire, ACS Nano 13, 4436 (2019).
- Deiseroth et al. (2006) H.-J. Deiseroth, K. Aleksandrov, C. Reiner, L. Kienle, and R. K. Kremer, Eur. J. Inorg. Chem. 2006, 1561 (2006).
- Chen et al. (2013) B. Chen, J.-H. Yang, H.-D. Wang, M. Imai, H. Ohta, C. Michioka, K. Yoshimura, and M.-H. Fang, J. Phys. Soc. Jap. 82, 124711 (2013).
- Verchenko et al. (2015) V. Y. Verchenko, A. A. Tsirlin, A. V. Sobolev, I. A. Presniakov, and A. V. Shevelkov, Inorg. Mater. 54, 8598 (2015).
- May et al. (2016) A. F. May, S. Calder, C. Cantoni, H. Cao, and M. A. McGuire, Phys. Rev. B 93, 014411 (2016).
- Liu et al. (2017) S. Liu, X. Yuan, Y. Zou, Y. Sheng, C. Huang, E. Zhang, J. Ling, Y. Liu, W. Wang, C. Zhang, J. Zou, K. Wang, and F. Xiu, npj 2D Mater. Appl. 1, 30 (2017).
- Wang et al. (2017) Y. Wang, C. Xian, J. Wang, B. Liu, L. Ling, L. Zhang, L. Cao, Z. Qu, and Y. Xiong, Phys. Rev. B 96, 134428 (2017).
- Yi et al. (2017) J. Yi, H. Zhuang, Q. Zou, Z. Wu, G. Cao, S. Tang, S. A. Calder, P. R. C. Kent, D. Mandrus, and Z. Gai, 2D Mater. 4, 011005 (2017).
- Nguyen et al. (2018) G. D. Nguyen, J. Lee, T. Berlijn, Q. Zou, S. M. Hus, J. Park, Z. Gai, C. Lee, and A.-P. Li, Phys. Rev. B 97, 014425 (2018).
- Fei et al. (2018) Z. Fei, B. Huang, P. Malinowski, W. Wang, T. Song, J. Sanchez, W. Yao, D. Xiao, X. Zhu, A. F. May, W. Wu, D. H. Cobden, J.-H. Chu, and X. Xu, Nat. Mater 17, 778 (2018).
- Deng et al. (2018) Y. Deng, Y. Yu, Y. Song, J. Zhang, N. Z. Wang, Z. Sun, Y. Yi, Y. Z. Wu, S. Wu, J. Zhu, J. Wang, X. H. Chen, and Y. Zhang, Nature 563, 94 (2018).
- Tegus et al. (2013) O. Tegus, B. Li-Hong, and S. Lin, Chin. Phys. B 22, 037506 (2013).
- Rodríguez-Carvajal (1993) J. Rodríguez-Carvajal, Physica B 192, 55 (1993).
- McGuire et al. (2015) M. A. McGuire, H. Dixit, V. R. Cooper, and B. C. Sales, Chem. Mater. 27, 612 (2015).
- McGuire et al. (2017) M. A. McGuire, G. Clark, S. KC, W. M. Chance, G. E. Jellison, V. R. Cooper, X. Xu, and B. C. Sales, Phys. Rev. Materials 1, 014001 (2017).
- Maisonneuve et al. (1997) V. Maisonneuve, V. B. Cajipe, A. Simon, R. Von Der Muhll, and J. Ravez, Phys. Rev. B 56, 10860 (1997).
- Onose et al. (2005) Y. Onose, N. Takeshita, C. Terakura, H. Takagi, and Y. Tokura, Phys. Rev. B 72, 224431 (2005).
- Chattopadhyay et al. (2009) M. Chattopadhyay, P. Parul Arora, and S. Roy, J. Phys.: Condens. Matter 21, 296003 (2009).
- Ghimire et al. (2013) N. J. Ghimire, M. A. McGuire, D. S. Parker, B. Sipos, S. Tang, J.-Q. Yan, B. C. Sales, and D. Mandrus, Phys. Rev. B 87, 104403 (2013).
- Chen et al. (2002) D.-X. Chen, E. Pardo, and A. Sanchez, IEEE Trans. Magn. 38, 1742 (2002).
- Fistul (1969) V. I. Fistul, Heavily Doped Semiconductors (Plenum Press, New York, 1969).
- Ziman (1963) J. M. Ziman, Electrons and Phonons. The Theory of Transport Phenomena in Solids (Oxford University Press, London, 1963).
- Nagaosa et al. (2010) N. Nagaosa, J. Sinova, S. Onoda, A. H. MacDonald, and N. P. Ong, Rev. Mod. Phys. 82, 1539 (2010).