Automated Discovery for Emulytics
Abstract
Sandia has an extensive background in cybersecurity research and is currently extending its state-of-the-art modeling via emulation capability. However, a key part of Sandia’s modeling methodology is the discovery and specification of the information-system under study, and the ability to recreate that specification with the highest fidelity possible in order to extrapolate meaningful results.
This work details a method to conduct information system discovery and develop tools to enable the creation of high-fidelity emulation models that can be used to enable assessment of our infrastructure information system security posture and potential system impacts that could result from cyber threats. The outcome are a set of tools and techniques to go from network discovery of operational systems to emulating complex systems.
As a concrete usecase, we have applied these tools and techniques at Supercomputing 2016 to model SCinet, the world’s largest research network. This model includes five routers and nearly 10,000 endpoints which we have launched in our emulation platform.
1 Introduction
Our Nation’s critical infrastructure depends on distributed information systems, which must be resilient against malicious attempts to disrupt their operation. Security mechanisms must be deployed and continuously assessed in order to prevent adversaries from disrupting critical infrastructure. These information systems employ a broad range of technologies including fixed Ethernet, point-to-point wireless, and cellular communications. Additionally, these systems employ enterprise architectures, cloud based data centers, and emergency response wireless architectures. With the extensive reliance of critical infrastructure on secure information systems, techniques and mechanisms to assess security must be created.
Assessing the security posture of information systems used in critical infrastructures necessitates, in cases, the capability to assess security on a representation of the operational system. Performing security analysis on real operational systems, in most cases, is prohibitive and assessing security on simulated systems lacks fidelity. A cost-effective solution is to create an emulation of the system and its components to enable system-level analysis. An emulated system model can be used to conduct red teams and assess risks and vulnerabilities of a system. A major challenge in creating an emulated system model is obtaining an accurate specification of the system of interest.
Initially security practitioners may examine original system design and specification documents, if available. This typically results in a poor description and specification of the system since the system has been modified for several possible reasons:
-
•
Original specification was modified during original deployment
-
•
Device configurations not completely specified and/or modified over time
-
•
Original device firmware and/or software upgraded
-
•
Original system topology modified for system growth
-
•
Device selection changes resulting from vendor performance improvements
In order to obtain an up-to-date and accurate view of the information system a dynamic system discovery and mapping capability must be developed and employed. The capability developed here enables system analysts to diagram, inventory, audit, and analyze the system of interest. Our solution encompasses two areas: System Discovery and System Emulation.
We have developed an information system discovery platform that can be used as a centralized discovery station. The platform accounts both for application (and service representation) as well as network configuration. System discovery in critical infrastructure systems can pose a significant challenge because of the diversity of devices not normally used in traditional corporate IT systems. System devices may include embedded devices that do not respond to traditional discovery techniques and discovery might be limited to network protocol scanning mechanisms.
Our developed capability fuses data from both commercial and open-source solutions. We can employ both active device discovery and mapping techniques along with passive discovery techniques to discover and create maps of information systems of interest.
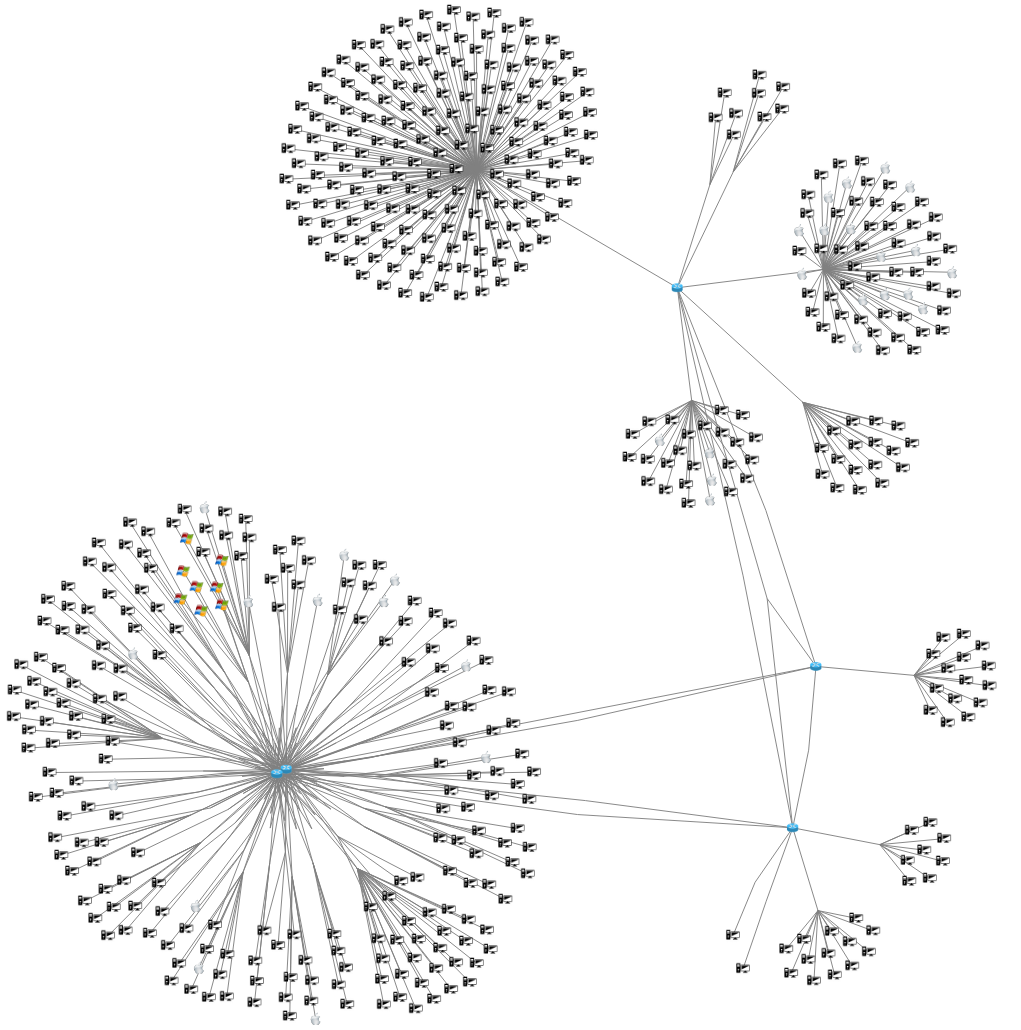
The contributions of this work are as follows: we present the discovery toolset111Available at https://github.com/sandia-minimega/discovery and associated intermediate representation (IR) as a means to automate the map-to-model process and apply the toolset to the Supercomputing 2016 network (SCinet) to demonstrate its utility (shown in Figure 1).
2 Background
Sandia has a long history in large-scale network emulation [21] using virtual machines (VMs). Specifically, Sandia has developed minimega222http://minimega.org, an open-source VM orchestration tool. minimega supports Sandia’s Emulytics333https://www.sandia.gov/emulytics/ program that combines large-scale network emulation with data analytics.
minimega is fast, easy to deploy, and can scale to run on massive clusters with virtually no setup. minimega uses QEMU/KVM [1, 9] to launch VMs (which can run unmodified Windows and Linux operating system). These VMs can be configured to have different resource allocations (e.g., VCPUs and memory) and properties (e.g., disk images, number of serial ports). For higher density, minimega also includes support for lightweight virtualization using Linux containers. Importantly, minimega uses Open vSwitch [15] to connect these VMs and containers using virtual switches to create arbitrary network topologies according to the user’s specifications.
Once configured, minimega includes many capabilities to launch and manage the VMs and containers (simply referred to as VMs here). minimega has a scheduler that launches the VMs across a cluster of machines to evenly distribute resource allocations. Once launched, minimega has APIs to start, pause, and kill VMs as well as inspect their current state. minimega also has a command-and-control system that talks to agents running within the VMs to send and receive files and execute commands. For example, this can be used to start traffic generation and then pull the log files for analysis. Additionally, minimega has APIs to configure and deploy routers based on BIRD [7]. These routers provide routing, DNS, and DHCP for the VMs. Finally, minimega has APIs to record traffic from the VM networks for further analysis.
These capabilities allow experimenters to build complex networks of VMs and conduct tests with minimega. However, the output quality of these emulations is bounded by the quality of the input system specification.
3 Related Work
Many tools have been built to date for network discovery. Tools can generally be divided into two categories: topology and endpoint discovery. Topology discovery tools try to determine the structure of the network while endpoint discovery tools provide detailed information about individual endpoints. These tools can be further categorized into active tools, when the tool is allowed to probe the network, and passive tools, when they are not.
Traceroute [11] is an example of an active tool that has been used to infer network topologies. Traceroute enumerates the routing path between a source and destination. Many techniques have been developed on top of traceroute to construct a topology from the paths [8, 12, 20]. Nmap [13] is an active scanning tool to enumerate properties of endpoints. Nmap can discover operating systems, open ports, and sometimes versions for applications listening on those open ports. In order to do so, Nmap generates many probes that may be blocked by firewalls. There are other, passive, tools that provide situational awareness built on top of NetFlow [3, 22]. These tools can be used for both topology and endpoint discovery.
These network discovery tools are all complementary to our system – we envision our system ingesting output from any and all these tools to build a detailed and rich model of the network. In fact, we prefer to use these other tools and write parsers for their outputs rather than implement the full tool ourselves. This simplifies our development and allows us to leverage the decades of development that have gone into these other tools.
Mirkovic et al. [14] present Distributed Experiment Workflows (DEW) which describes experiment topology as well as experiment behavior and topological constraints. Our approach could be combined with DEW to allow researchers to define experiments on automatically discovered topologies.
In addition to Sandia’s minimega, there are other emulation platforms such as DETER [2], Emulab [10], and CloudLab [19]. Each of the emulation platforms have their own set of design principles and goals and could have been used instead of minimega. Fortunately, the majority of the discovery toolset is platform agnostic. The final step which emits minimega commands could be replaced with a separate tool that automates the APIs of these other platform.
Depending the application of the network model, full-system emulation may not be necessary. In which case, tools like mininet [5], which is a tool for software-defined network developers to prototype large networks on a single computer using lightweight virtualization, may be appropriate.
4 Methodology
There are two key aspects involved in this work. First, to investigate methods for rapid, automated, and flexible network structure and behavior specification (raw data to map). This effort required studying issues both in data transforms appropriate for an Emulytics environment, but also issues in composing data in constructive ways. Second, given a suitable representation of a network, create a mechanism to emit Emulytics models with variable levels of abstraction suitable for operators to create, adjust, and analyze.
4.1 Rapid, automated, flexible network specification (raw data to map)
The overall goal of this work is to investigate mechanisms to create Emulytics models from source data (e.g., network packet capture, active network scans, router configurations). We decouple this operation into transforming sensor data into an intermediate representation and then transliterating the intermediate representation into an Emulytics model. This is not unlike the process most code compilers use – take human readable source, transform into an intermediate representation (parse tree), make optimizations, transform into machine code or other representations. By creating an intermediate representation, we create opportunities to perform analyses on the specification such as identifying partitions in the network, as well as create a portable and reusable specification for the model generator to create multiple models from.
The intermediate representation (IR) is a simple graph, with unstructured key/value pairs on each node (i.e., an endpoint or switch in a network), as well as unstructured key/value pairs on each edge (i.e., a network connection). Nodes and edges are populated with descriptive data about their role and operation on a network (e.g., IP and MAC address, running services, hostname).
We have created a number of parsers for a variety of source data types that can interact with the data already in the graph. For example, when parsing network packet capture data, the parser may find that a node with IP address 10.0.0.1 is communicating to a specific web server. To capture this behavioral artifact, the parser searches the graph for a node with IP 10.0.0.1. If it finds one, it adds this metadata to the node specification (perhaps incrementing a total byte count of traffic as well). If the node does not exist, it simply creates one, attaching it to the correct subnet (assuming that it can be inferred), and moves to the next packet. Using this model, we support both creating any number of discrete parsers and provide a path to transliterate data from existing commercial or open source tools (by modifying those tools or creating “shim” parsers).
The host IR also enables us to automatically perform “gap” analysis before emitting an Emulytics model. Continuing with the above example, a compiler is able to perform certain checks on the IR of software such as ensuring that certain semantics are met such as that variables are defined before they are used. We envision performing similar semantic checks on the host IR. For example, it would be syntactically valid to define a machine with thousands of interfaces in our host IR but such a machine would be physically unrealizable and, thus, a semantic checker of the host IR would reject it as invalid and suggest potential alternatives.
Likewise, we could encode the best practices of networking engineers as semantic checkers. These semantic checkers could also identify blind spots in the network where it can identify the host IR is incomplete. Without an IR, such checks would not be feasible.
4.2 Tunable model specification (map to model)
The second stage of creating an Emulytics model from source data is to generate a model from a suitable IR that has been created, optimized, and validated. For the purposes of this project, we assume that we have sufficient data in the intermediate representation to create a bootable Emulytics experiment (i.e., all endpoints have IP addresses or are configured for DHCP). The primary goal of the map-to-model stage is to support translating the IR to an Emulytics model. This stage also allows for tuning the translation to support emitting variations of the model. For example, the IR may be comprised of 250,000 Windows-based endpoints. This is too many Windows virtual machines to boot on most clusters. Instead, the operator should be able to identify that only some subsection of endpoints are important to a given experiment and need to actually run Windows virtual machines. The rest of the model may safely be made up of generic Linux containers, which allow for greater density, without impacting the validity of the experiment. This specification abstraction does not modify the source IR, simply the generated model, meaning that the operator can revisit the intermediate representation with new model criteria for other experiments.
5 Implementation
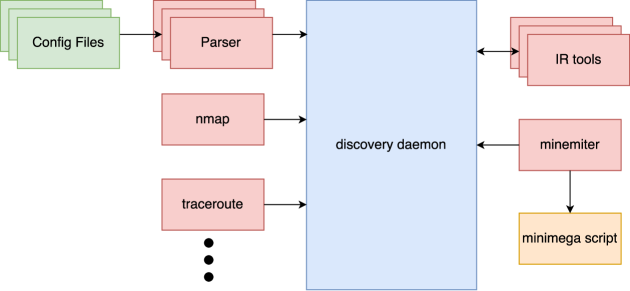
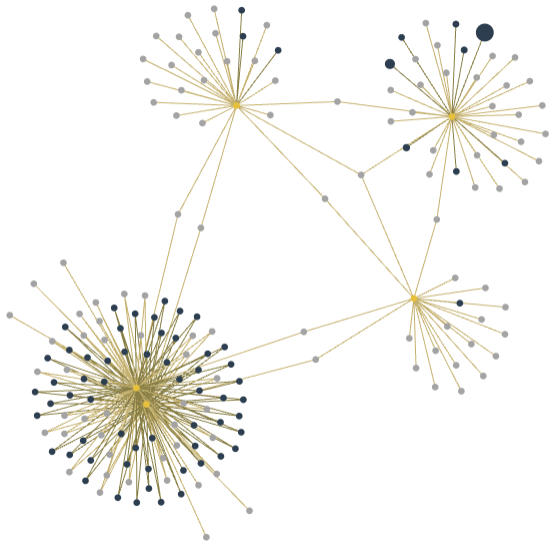
We built the discovery toolset to integrate into the existing minimega ecosystem. As such, all of the tools are implemented in Go. discovery is the main tool in the toolset. It acts as the central tool which all other tools, parsers, model generators, etc. communicate with, and stores the IR of experiments, as well as other configuration data. In addition to storing the IR, the discovery tool also hosts a simple web server that provides a real-time visualization of the experiment (as seen in Figure 1 and Figure 4). Figure 2 shows an overview of the toolset’s interactions.
{
    "NID": 1,
    "Edges": [
        {
            "N": 63,
            "D": {
                "ip": "10.0.0.1/24",
                "mac": "de:ad:be:ef:ca:fe"
            }
        }
    ],
    "D": {
        "hostname": "irc.example.com",
        "os": "linux",
        "ports": "22,6667"
    }
}
The discovery tool maintains a single IR at runtime, and supports a simple JSON-encoded RESTful interface for queries and updates. The tool can read and write experiments to disk as well. Figure 3 shows an example of JSON encoded data for a single node in the IR. Node and edge data is stored in unstructured maps that are later parsed by the model generator. Each node and network can by referenced by its ID.
The tool also maintains a simple map of configuration data, intended to be used to store information about model specific details, such as the location of disk images that will be used by an experiment.
5.1 Parsers
We developed several parsers for the output from existing tools including nmap and traceroute. We also develop a new PCAP parser based on GoPacket444https://github.com/google/gopacket.
For nmap, we walk the XML output from the tool and create an endpoint for each host that nmap identifies, storing the identified operating system and open ports in the metadata. Our implementation of this parser assumes that the structure of the network is already known – all routers and their connected subnets are already represented in the IR.
For traceroute, we parse the hop-by-hop output and create an endpoint for each hop. This demonstrates the basic concept but has a number of shortcomings including alias resolution and determining the IPs for “backward” edges. These shortcomings could be addressed by incorporating prior work [8, 12, 20].
We implement our own PCAP parser to perform passive endpoint discovery and record the results in the IR. Specifically, we parse packets using GoPacket, and extract information from ARP, Multicast DNS, DHCP, ICMPv4, and TCP SYN packets.
ARP [16] is used by endpoints to identify the hardware address associated with a network address. The ARP Replies are recorded in the IR, creating new endpoints if the IR does not already contain a given hardware or network address.
Multicast DNS [4] is a service discovery protocol used in local networks. By snooping on multicast DNS packets, our PCAP parser can identify which services are available on the network as well as the IP addresses of the endpoints and store these in the IR.
DHCP [6] is a network bootstrapping protocol that allows endpoints to exchange configuration, including which network address to use. Our PCAP parser uses these to create or update endpoints in the IR, based on hardware address, with their assigned network addresses.
ICMP [17] is a protocol that is used for network status messages and diagnostics. Our parser creates new endpoints based on echo and echo reply messages.
TCP SYN [18] is the first packet in a TCP connection that includes many parameters for the connection. Previous work has shown that the TCP parameters are operating system dependent which can be fingerprinted (implemented in p0f [23]). We ported p0f to Go and to run on top of GoPacket so that our PCAP parser could annotate endpoints with its suspected operating system.
Our PCAP parser combines data from these various protocols to create endpoints and populate their metadata. There are many inconsistencies that can occur passively monitoring a live network. Our default behavior is to drop inconsistent endpoints. In future work, developing a more rigorous approach to resolving inconsistencies would substantially improve the quality of the generate IR.
5.2 minemiter
minemiter is the model generation tool for the discovery IR. It walks the IR, invoking one or more templates for every node in the graph, and emits a minimega script that can then be used to boot the model. The core feature of minemiter is its use of user definable templates (based on Go’s template package555https://golang.org/pkg/text/template) to provide actions on qualities of endpoints. For example, a node in the IR may have a network connection on network 63, and a MAC address of de:ad:be:ef:ca:fe, as is shown in Figure 3. From this, a templated action to generate the necessary minimega command could look like:
{{ if $e.D.mac }}
vm config net network-{{$e.N}},{{$e.D.mac}}
{{ end }}
This production would generate the valid minimega command:
vm config net network-63,de:ad:be:ef:ca:fe
Templates are executed in sorted-name order, and minemiter expects template names to begin with a single letter (A-Z) and a two-digit number, such as S70network.template. Using this scheme, minemiter will execute every “A” template in numeric order against every node in the IR, followed by every “B” template, and so on. This enables the template writer to have up to 26 passes across every node in the IR.
By processing templates in this way, the designer can approach model building iteratively. For example, a default set of templates will generate an abstract, Linux container-based experiment with no behavioral model. From this point, the model designer can write templates specific to their experiment, such as a template that generates Windows KVM-based endpoints. In this case, the Windows template would be ordered before the default Linux container templates, and any endpoints that matched on the template criteria (such as having the metadata os=windows), would emit a Windows VM configuration. The Windows template would then indicate not to continue in this pass for this node. If the criteria do not match, minemiter simply falls through to the next template, in this case the default Linux container templates. By using this approach, the model designer can both iterate on successively higher fidelity models without having to modify the source IR, as well as easily modify the level of abstraction in the experiment by simply adding or removing key templates.
The templates are so flexible that different sets of templates could even be used to generate models for different emulation platforms. Alternatively, it may be simpler to transliterate the discovery IR to whatever IR the other desired emulation platforms supports.
6 SCinet 2016
During Supercomputing 2016, we worked to build a discovery-based model of SCinet 2016 as NRE participants.
6.1 Router Configurations
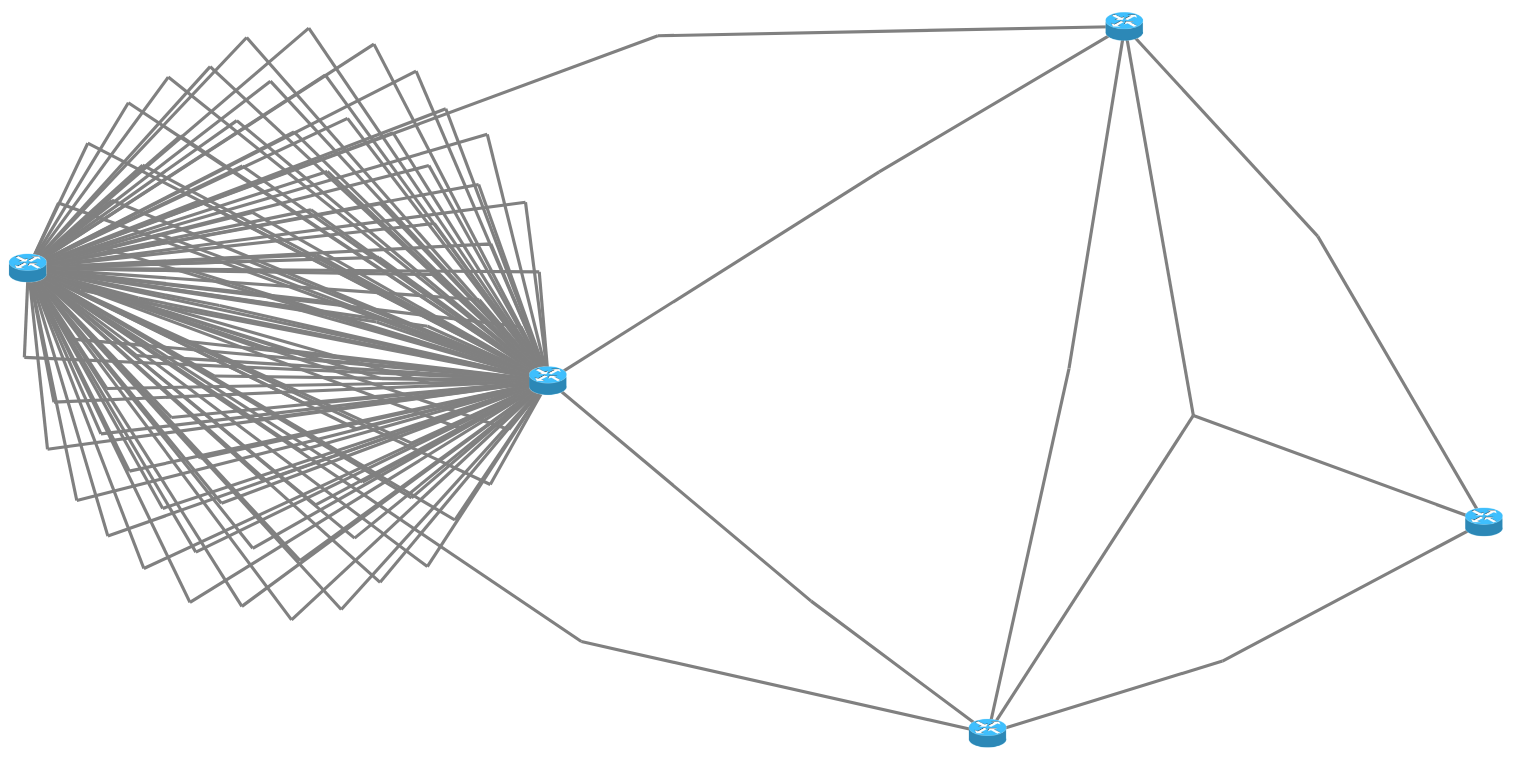
Our first step to modeling SCinet was to parse the router configurations in order to determine the structure of the network. SCinet 2016 included five routers from four different vendors: Arista, Brocade, Juniper, and Cisco. The parser for each configuration file created a new node in the IR and created an edge for each IP assigned to the router. The parsers inspect the IP address and subnet assigned to each edge and connect the edges that share the same subnet. We were only interested in constructing a simple layer-3 model so we ignored other configurations such as VLAN-tagging for certain interfaces. Figure 4 shows a picture of the resulting IR.
6.2 dhcpd Logs
Once we had the structure of the network, we built a new parser for dhcpd logs to populate the endpoints on the network. We chose to use dhcpd logs for several reasons. First, they include devices across many of the conference subnets. Second, these logs are simple to parse. Third, they are small in comparison to the terabytes of PCAP that we would otherwise have to process to obtain the same information.
The parser scans the logs looking for DHCP acknowledgements (ACK). ACKs are of the format:
DHCPACK on 140.221.X.Y to <MAC> \
    (<HOSTNAME>) via 140.221.X.1
For each ACK, the parser queries the IR to see if it already contains an endpoint with the given MAC and if it does not, it creates one. It then updates the endpoint with the leased IP address and hostname. This parser took only a few hours to implement and run on the logs which demonstrates a strength of the discovery toolset – adding new parsers is trivial.
Figure 1 shows a picture of the resulting IR, omitting the two largest subnets: the wireless network and the classrooms. These subnets make the graph too large to easily display. To omit these subnets, we simply wrote a small trim tool that walks the IR and marks nodes for deletion based on a query. We ran this for each subnet, unmarked the nodes representing routers, and then ran it again to delete the marked nodes.
The dhcpd logs that we processed contained a total of 9,525 endpoints. From the hostnames they request, we estimate that there were at least 2,100 Android and 1,900 iPhone devices. Another 500 were iPads and another 71 were Windows devices. Based on this information, we changed the icon in the visualization to show where the different OSes appear in the network. Upon doing so, we discovered that one subnet is entirely Windows devices.
6.3 Emulation
We took the resulting IR and used minemiter to create a minimega script to boot a Emulytics model of SCinet 2016. For simplicity, the environment is based on the default templates – all endpoints are represented with containers and all IPs were statically assigned. The script contained over 128k minimega commands and took just over 14 minutes to run, launching the 8,416 containers across 10 machines. When booting the containers, we discarded endpoints that had the same IP address or the same hostname. These discarded endpoints suggest improvements that we can make to our dhcpd parser – there should be no duplicate IPs for the time that the DHCP lease is valid and hostnames should be deduplicated by appending an integer.
7 Discussion
We chose the simplest emulation for SCinet 2016: an all container environment with static IP addresses. There are many ways in which we can improve the fidelity of the environment using the IR and templates built into the toolset. However, an open question is how much effort to put into improving the emulation. For example, we could replace the containers with KVM-based VMs and launch operating systems matching those of the real devices but that may not provide any benefit over an all container environment if we are only interested in studying properties of a firewall or IDS appliance between the registration network and the WiFi devices.
Furthermore, there is the question of how well our model matches the real network. So far, we have compared graphs from the Emulytics environment to the IR-based graphs and the IR-based graphs to the SCinet network diagrams. A more rigorous analysis of whether the Emulytics model matches the IR model which, in turn, matches the real network, would be required before claims about the real network could be made using the Emulytics model. Fortunately, many of the applications of Emulytics do not require this level of rigor. For example, to continue with the previous example, studying properties of a firewall or IDS appliance.
8 Future Work
To date, most of our efforts have been towards understanding a static snapshot of the network we that wish to emulate. In the real-world, networks evolve over time as when endpoints are added, removed, or simply move to a different location within the network. This evolution is particularly interesting with laptops and mobile devices which have high mobility.
The templated model generation technique we employ could be used to perform transforms on already running experiments. For example, say source network data from a given network is captured a day apart, and two IRs are created from that data. The model generator can be used to create a “base” model, representing the first data snapshot. Once the base model is running, the model generator can use a separate set of templates to determine the difference from the second model (created from data taken a day later), and create Emulytics platform commands to modify the booted model. This allows creating temporal snapshots of experiments and modifying experiments to reflect those temporal changes. Alternatively, because our IR includes an unstructured map, we could also annotate devices based on time and change our tools to be aware of time. This may require significant changes to our tools that currently expect uniqueness in fields such as MAC address and IP address.
9 Conclusion
In conclusion, we have presented our discovery toolset which aims to automate the map to model process for Emulytics. The toolset contains a daemon that stores the IR and provides a RESTful API for tools, parsers, and model generators to communicate with. On the backend, we describe minemiter, a tool that takes a template-based approach to generate commands to instantiate a model of the network in an emulation platform. We have applied our tools and techniques to model SCinet 2016 which we booted in minimega.
Acknowledgements
Sandia National Laboratories is a multimission laboratory managed and operated by National Technology & Engineering Solutions of Sandia, LLC, a wholly owned subsidiary of Honeywell International Inc., for the U.S. Department of Energy’s National Nuclear Security Administration under contract DE-NA0003525.
This paper describes objective technical results and analysis. Any subjective views or opinions that might be expressed in the paper do not necessarily represent the views of the U.S. Department of Energy or the United States Government.
References
- [1] Bellard, F. QEMU, a Fast and Portable Dynamic Translator. In USENIX Annual Technical Conference, FREENIX Track (2005), pp. 41–46.
- [2] Benzel, T., Braden, R., Kim, D., Neuman, C., Joseph, A., Sklower, K., Ostrenga, R., and Schwab, S. Experience with DETER: A Testbed for Security Research. In Testbeds and Research Infrastructures for the Development of Networks and Communities, 2006. TRIDENTCOM 2006. 2nd International Conference on (2006), IEEE, pp. 10–pp.
- [3] Berthier, R., Cukier, M., Hiltunen, M., Kormann, D., Vesonder, G., and Sheleheda, D. Nfsight: Netflow-based Network Awareness Tool. In Proceedings of LISA’10: 24th Large Installation System Administration Conference (2010), p. 119.
- [4] Cheshire, S., and Krochmal, M. Multicast DNS. RFC 6762, Feb. 2013.
- [5] De Oliveira, R. L. S., Shinoda, A. A., Schweitzer, C. M., and Prete, L. R. Using Mininet for Emulation and Prototyping Software-Defined Networks. In Communications and Computing (COLCOM), 2014 IEEE Colombian Conference on (2014), IEEE, pp. 1–6.
- [6] Droms, R. Dynamic Host Configuration Protocol. RFC 2131, Mar. 1997.
- [7] Filip, O., Forst, L., Machek, P., Mares, M., and Zajicek, O. BIRD Internet Routing Daemon. NANOG-48, Austin, TX (2010).
- [8] Govindan, R., and Tangmunarunkit, H. Heuristics for internet map discovery. In INFOCOM 2000. Nineteenth Annual Joint Conference of the IEEE Computer and Communications Societies. Proceedings. IEEE (2000), vol. 3, IEEE, pp. 1371–1380.
- [9] Habib, I. Virtualization with kvm. Linux Journal 2008, 166 (2008), 8.
- [10] Hibler, M., Ricci, R., Stoller, L., Duerig, J., Guruprasad, S., Stack, T., Webb, K., and Lepreau, J. Large-scale Virtualization in the Emulab Network Testbed. In USENIX Annual Technical Conference (2008), pp. 113–128.
- [11] Jacobson, V. Traceroute Software. Lawrence Berkeley Laboratories (1988).
- [12] Kim, S., and Harfoush, K. Efficient estimation of more detailed internet ip maps. In Communications, 2007. ICC’07. IEEE International Conference on (2007), IEEE, pp. 377–384.
- [13] Lyon, G. F. Nmap Network Scanning: The Official Nmap Project Guide to Network Discovery and Security Scanning. Insecure, 2009.
- [14] Mirkovic, J., Bartlett, G., and Blythe, J. DEW: Distributed experiment workflows. In 11th USENIX Workshop on Cyber Security Experimentation and Test (CSET 18) (Baltimore, MD, 2018), USENIX Association.
- [15] Pfaff, B., Pettit, J., Koponen, T., Jackson, E. J., Zhou, A., Rajahalme, J., Gross, J., Wang, A., Stringer, J., Shelar, P., et al. The Design and Implementation of Open vSwitch. In NSDI (2015), pp. 117–130.
- [16] Plummer, D. C. An Ethernet Address Resolution Protocol: Or Converting Network Protocol Addresses to 48.bit Ethernet Address for Transmission on Ethernet Hardware. RFC 826, Nov. 1982.
- [17] Postel, J. Internet Control Message Protocol. RFC 792, Sept. 1981.
- [18] Postel, J. Transmission Control Protocol. RFC 793, Sept. 1981.
- [19] Ricci, R., and Eide, E. Introducing CloudLab: Scientific Infrastructure for Advancing Cloud Architecturesand Applications. ; login: 39, 6 (2014), 36–38.
- [20] Spring, N., Mahajan, R., and Wetherall, D. Measuring isp topologies with rocketfuel. ACM SIGCOMM Computer Communication Review 32, 4 (2002), 133–145.
- [21] Urias, V., Van Leeuwen, B., Stout, W., and Wright, B. Emulytics at Sandia National Laboratories. MODSIM World 2015 (2015).
- [22] Yin, X., Yurcik, W., Treaster, M., Li, Y., and Lakkaraju, K. VisFlowConnect: Netflow Visualizations of Link Relationships for Security Situational Awareness. In Proceedings of the 2004 ACM Workshop on Visualization and Data Mining for Computer Security (2004), ACM, pp. 26–34.
- [23] Zalewski, M. p0f v3 (version 3.08 b), 2014.