Now at: ] SLAC National Accelerator Laboratory, Menlo Park, CA 94205, USA Now at: ] Argonne National Laboratory, Argonne, IL 60439, USA COHERENT collaboration
First Measurement of Coherent Elastic Neutrino-Nucleus Scattering on Argon
Abstract
We report the first measurement of coherent elastic neutrino-nucleus scattering (CEvNS) on argon using a liquid argon detector at the Oak Ridge National Laboratory Spallation Neutron Source. Two independent analyses prefer CEvNS over the background-only null hypothesis with greater than significance. The measured cross section, averaged over the incident neutrino flux, is (2.2 0.7) 10-39 cm2 — consistent with the standard model prediction. The neutron-number dependence of this result, together with that from our previous measurement on CsI, confirms the existence of the CEvNS process and provides improved constraints on non-standard neutrino interactions.
Introduction —
Coherent elastic neutrino-nucleus scattering (CEvNS) Freedman (1974); Kopeliovich and Frankfurt (1974) occurs when a neutrino interacts coherently with the total weak nuclear charge, necessarily at low momentum transfer, leaving the ground state nucleus to recoil elastically. It is the dominant interaction for neutrinos of energy MeV and provides a sensitive test of standard model (SM) and beyond-SM processes Barranco et al. (2005, 2007); Dutta et al. (2016); Krauss (1991).
In this Letter, we report the first measurement of CEvNS in a light nucleus (argon) complementing our earlier result on cesium and iodine Akimov et al. (2017), thus establishing the behavior predicted by the standard model. This result also improves constraints on non-standard interactions between neutrinos and quarks.
CEvNS is sensitive to these non-standard interactions (NSI), which are crucial to understand for the success of the long-baseline neutrino oscillation program Coloma and Schwetz (2016); Coloma et al. (2017a, b); Liao et al. (2016). The process also probes the weak nuclear charge Amanik and McLaughlin (2009); Cadeddu and Dordei (2019); Patton et al. (2012); Cadeddu et al. (2018); Aristizabal Sierra et al. (2019); Hoferichter et al. (2019) and the weak mixing angle at novel momentum transfer Krauss (1991); Cañas et al. (2018). Additionally, CEvNS-sensitive detectors could play future roles as non-intrusive nuclear reactor monitors Barbeau et al. (2003); Hagmann and Bernstein (2004); Kim (2016).
CEvNS has numerous connections to possible hidden-sector particles. It is sensitive to models which could explain the theoretical tension with measurements of the muon anomalous magnetic moment Davoudiasl et al. (2014). CEvNS from solar and atmospheric neutrinos constitute the so-called “neutrino floor” background in future dark matter searches Gonzalez-Garcia et al. (2018), and CEvNS cross section measurements quantify this background. CEvNS experiments at accelerators are also sensitive to sub-GeV accelerator-produced dark matter particle models deNiverville et al. (2015); Ge and Shoemaker (2018); Dutta et al. (2020, 2019); Akimov et al. (2019a). The potential relevance of CEvNS to core-collapse supernovae was quickly recognized Freedman et al. (1977), and though its role in supernova dynamics is uncertain Janka (2012); Balasi et al. (2015), CEvNS is expected to be the source of neutrino opacity in these events Bruenn and Mezzacappa (1997). Supernova neutrinos convey information about supernova dynamics, and could be detected via CEvNS Horowitz et al. (2003).
CEvNS measurements require detectors with low nuclear-recoil-energy threshold in a low-background environment with an intense neutrino flux. The COHERENT collaboration has deployed a suite of detectors in a dedicated neutrino laboratory (“Neutrino Alley”) at the Spallation Neutron Source (SNS) at Oak Ridge National Laboratory (ORNL) Akimov et al. (2017, 2018). We reported the first observation of CEvNS on heavy nuclei using a 14.6-kg, low-background, low-threshold CsI[Na] detector located 19.3 m from the SNS target Akimov et al. (2017).
As part of the COHERENT program, we deployed the 24-kg active-mass liquid-argon (LAr) CENNS-10 scintillator detector (Fig. 1) in Neutrino Alley to detect CEvNS in a light nucleus. The initial CENNS-10 deployment set a limit on the CEvNS cross section for argon and quantified backgrounds Akimov et al. (2019b). A subsequent upgrade provided a lower energy threshold with an eight-fold improvement in light collection efficiency.

Experiment —
The 1-GeV, 1.4-MW proton beam of the SNS accelerator strikes a liquid-\ceHg target in FWHM pulses at to produce neutrons that are moderated and delivered to experiments. Additionally, are produced for each proton-on-target (POT) leading to a large flux of pion-decay-at-rest neutrinos. The produce a prompt along with a , which subsequently decays yielding a three-body spectrum of and with an endpoint energy of . This time structure is convolved with the proton beam pulse yielding a prompt neutrino flux followed by a delayed flux of and Akimov et al. (2017, 2018).
The CENNS-10 detector, designed and built at Fermilab Brice et al. (2014), sits 27.5 m from the SNS target in Neutrino Alley. The active volume of CENNS-10 is defined by a cylindrical polytetrafluoroethylene (PTFE) shell and two 8” Hamamatsu R5912-02MOD photomultiplier tubes (PMTs) resulting in active mass of 24 kg of atmospheric argon (99.6% ). The PTFE and PMT glass are coated with a 0.2 mg/cm2 layer of 1,1,4,4-tetraphenyl-1,3-butadiene (TPB) to wavelength-shift the 128-nm argon scintillation light to a distribution peaked at 420 nm where the PMTs have quantum efficiency of %. This configuration provides a keVnr (nuclear-recoil) energy threshold.
Argon scintillation light from particle interactions is produced from both “fast” singlet ( ns) and “slow” triplet ( ns) excited molecular states Hitachi et al. (1983). Electron recoils (ER) and argon nuclear recoils (NR) populate these states in different proportions, allowing for pulse-shape discrimination (PSD) to suppress ER backgrounds from electron-gamma background sources compared to the CEvNS NR recoil signal. Neutron sources, from the accelerator or surrounding materials, will also create a NR signal, so shielding is required to reduce this background.
During SNS operation, each PMT waveform is digitized at 250 MHz in a 33- window around each POT pulse (“on-beam” data) together with a subsequent 33- window between POT pulses (“off-beam” data) to allow a measure of beam-unrelated backgrounds. Calibration data were acquired using and sources placed within the water shield, a sample of 83mKr gas injected via the argon re-circulation system Akimov et al. (2020a), as well as an external americium-beryllium (AmBe) neutron source. A pulsed visible-spectrum LED, along with triplet light from low light-yield calibration pulses, was used to determine the response of the PMTs to single-photoelectron (SPE) signals. These calibration runs were performed on a weekly basis to correct for drifts in detector response due to PMT gain or light output changes.
Analysis —
In order to avoid experimenter bias, the analysis methods and event selection criteria were established, prior to examining the on-beam data set, by two independent analysis groups — labeled as “A” and “B” below.
The PMT waveforms were integrated over a 6 s window after the initial PMT pulse and summed to form the integrated event amplitude, . Also, the integrated amplitude in the first ns, , was calculated and the PSD parameter defined. Off-beam and on-beam windows were treated identically, providing an unbiased measurement of the beam-unrelated backgrounds. The -ray sources were used to calibrate scintillation yield to electron-equivalent energy (keVee) with % uncertainty. The energy resolution was 9% at the keVee 83mKr line. A comparison of the calibration source signals to SPE signals from a pulsed LED and from delayed low-light-yield events resulted in an estimated photoelectrons (PE) per keVee.
The detector response to CEvNS NR events compared to calibration ER events is quantified via the so-called “quenching factor” (). We performed a linear fit to the world data Agnes et al. (2018); Cao et al. (2015); Creus et al. (2015); Gastler et al. (2012) for QF on argon in the energy range keVnr following the Particle Data Group prescription for combining measurements Tanabashi et al. (2018), incorporating the correlated uncertainties reported in Ref. Gastler et al. (2012). With this fit and the ER calibration from above, the response to CEvNS NR events can be simulated. At 20 keVnr, the fit yields . The AmBe neutron source data were used to determine the PSD response for NR events via the use of the quantity with energy dependence consistent with other measurements in LAr Hitachi et al. (1983); Regenfus et al. (2012).
A Geant4-based Agostinelli et al. (2003) program modeled the detector response for both CEvNS and neutron events to determine the CEvNS detection efficiency and construct predicted event distributions. The program simulates the production and quenching of LAr scintillation light, TPB absorption and re-emission, and propagation of optical photons to the PMTs. The material optical parameters and LAr scintillation properties were adjusted to reproduce the calibration data and then used to estimate the CEvNS response and detection efficiency.
The beam-unrelated “steady-state” (SS) background was measured in situ using the off-beam triggers occuring one-for-one with on-beam triggers. The time window within the off-beam trigger can be made larger that the on-beam time window, allowing for an “oversampling” of the background, thus reducing the systematic uncertainty on the measured rate to . In addition, the energy and distributions are also precisely measured, eliminating the need for knowledge of the exact source of this background and for any additional systematic errors. Qualitatively, the measured spectrum is consistent with a dominant background from the 565 keVee-endpoint -decay of in the detector volume. The remainder is mostly from -rays from surrounding materials or a nearby SNS target radioactive gas exhaust pipe, which are suppressed by the Pb shielding. Relative to the on-beam signal, these backgrounds are -fold suppressed due to the pulsed SNS beam structure and -fold further suppressed by PSD in the event selection.
The beam-related background events are caused by neutrons originating in the SNS target that elastically scatter in the argon, producing a NR event. Though this beam-related neutron (BRN) rate is highly suppressed in Neutrino Alley, the events occur in time with the beam, and the rate competes with the CEvNS rate in the detector. The BRN flux at the CENNS-10 location was measured with the SciBath neutron detector Tayloe et al. (2006); Cooper et al. (2011) in 2015, was further studied with the CENNS-10 engineering run Akimov et al. (2019b), and was measured as part of this analysis in a three-week (0.54 GWhr) “no-water” run in which the water shielding around the detector was drained. Neutrino-induced neutrons from neutrino interactions in the lead shielding Kolbe and Langanke (2001) can also produce prompt NR events; however, the water shielding between the lead and detector reduces their contribution to 1 event in this data set.
The data used for this CEvNS analysis correspond to total integrated beam power of 6.12 GWhr (13.7 1022 POT) collected between July 2017 – December 2018. Events are selected from both on-beam and off-beam data sets with identical cuts. Candidate events are initiated by requiring pulses with PE in both PMTs occurring within ns of each other. This cut largely determines the energy threshold and rejects 15% of the predicted CEvNS events at lowest recoil energies. Pulses within an event must not exhibit preceding or delayed “pileup” pulses, rejecting a further 4% of events. In addition, Analysis B required that each PMT recorded at least 20% of the total light in an event, reducing some background events that occur near either PMT while reducing the CEvNS event selection efficiency by 10%.
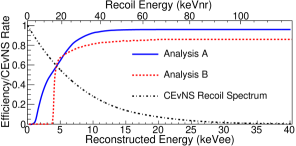
Further, candidate events were required to lie in the NR band to reject ER- and Cherenkov-like events. A time range was chosen using , where is the expected start time of the neutrino beam at the detector, to include both prompt and delayed neutrinos. An energy range was chosen to include the region of interest for a CEvNS signal ( keVnr keVee). The specific values for the fit ranges, summarized in Table 1, differed between analyses A and B because of different strategies for signal and background optimization. For example, Analysis A used a wider energy range to include more high-energy BRN events to anchor that background so an extra delayed-BRN component would be better constrained. The resulting energy-dependent efficiency for detecting CEvNS is shown in Fig. 2.
| fit ranges | Analysis A | Analysis B | ||||
|---|---|---|---|---|---|---|
| 0.5 | 0.9 | 0.5 | 0.8 | |||
| (keVee) | 0.0 | 120.0 | 4.1 | 30.6 | ||
| (s) | 8.0 | |||||
| total events selected | 3752 | 1466 | ||||
| input values | ||||||
| 128 | 17 | 101 | 12 | |||
| , prompt | 497 | 160 | 226 | 33 | ||
| , delayed | 33 | 33 | ||||
| 3152 | 25 | 1155 | 45 | |||
| total events predicted | 3779 | 1482 | ||||
| fit values | ||||||
| 159 | 43 | 121 | 36 | |||
| , prompt | 553 | 34 | 222 | 23 | ||
| , delayed | 10 | 11 | ||||
| 3131 | 23 | 1112 | 41 | |||
| total events fit | 3853 | 1455 | ||||
| fit systematic errors | ||||||
| CEvNS dependence | 4.5% | 3.1% | ||||
| CEvNS mean | 2.7% | 6.3% | ||||
| BRN dist. | 5.8% | 5.2% | ||||
| BRN mean | 1.3% | 5.3% | ||||
| BRN width | 3.1% | 7.7% | ||||
| total CEvNS sys. error | 8.5% | 13% | ||||
| fit results | ||||||
| null significance (stat. only) | 3.9 | 3.4 | ||||
| null significance (stat.+sys.) | 3.5 | 3.1 | ||||
| cross section | ||||||
| SM-predicted ( cm2) | 1.8 | |||||
| systematic errors: | ||||||
| detector efficiency | 3.6% | 1.6% | ||||
| energy calibration | 0.8% | 4.6% | ||||
| F90 calibration | 7.8% | 3.3% | ||||
| quenching factor | 1.0% | 1.0% | ||||
| nuclear form factor | 2.0% | 2.0% | ||||
| neutrino flux | 10% | 10% | ||||
| total cross section sys. error | 13% | 12% | ||||
| measured ( cm2) | 2.3 0.7 | 2.2 0.8 | ||||
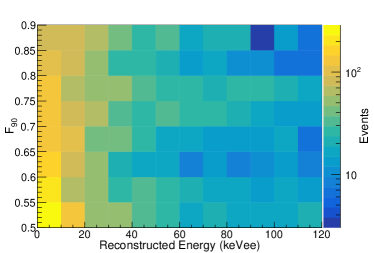
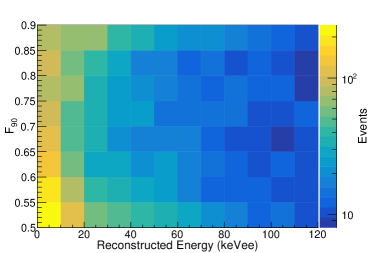
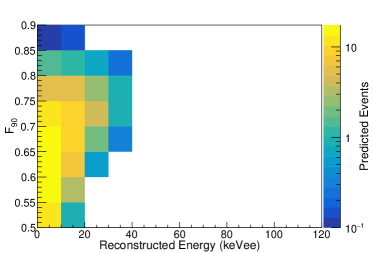
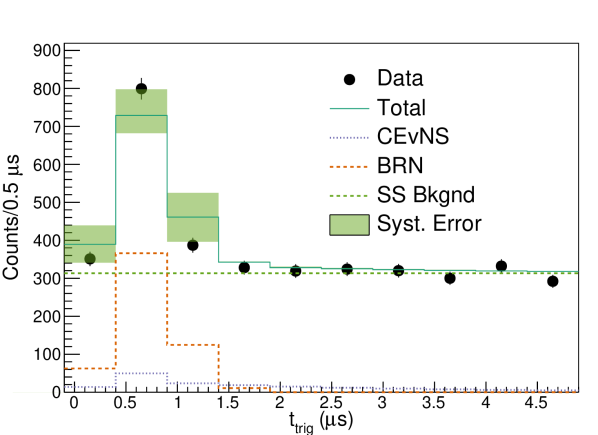
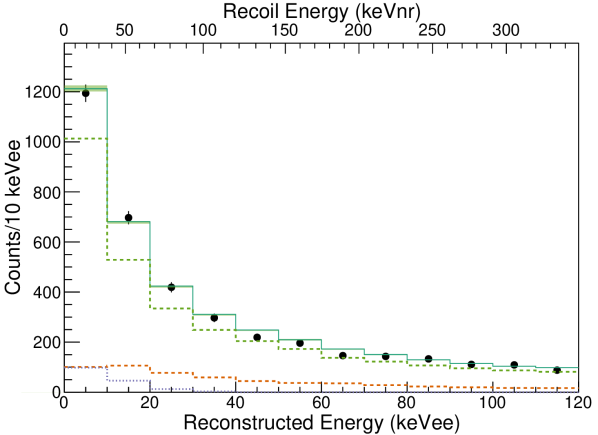
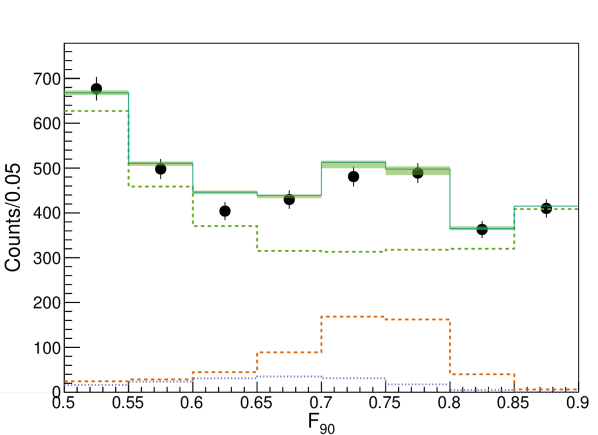
For the extraction of CEvNS events amid BRN and SS backgrounds, we performed an extended maximum-likelihood fit to the on-beam data binned in , , and . These data were modeled by distributions with associated number of events for . The best-fit number of CEvNS events, , was unconstrained in the fit. was determined from a simulation of CEvNS events to provide the PSD and energy distributions, then combining with the neutrino arrival-time dependence.
For the backgrounds, the total number of SS events, , was Gaussian-constrained by the statistical error from the off-beam measurement of () for Analysis A (B). The distribution was formed by binning the off-beam events in and and assuming a constant time dependence. Analysis A Gaussian-constrained based on associated BRN measurements; Analysis B allowed to float freely. Analysis A also included a separate delayed ( s) BRN component in the fit to permit the possibility of late BRN events. For , the --dependence was extracted from the simulation with a time dependence extracted from a fit to the no-water data.
Pseudo-data sets were generated using RooFit Verkerke and Kirkby (2003) to demonstrate a robust and unbiased fitting procedure, and to estimate uncertainties before fitting the on-beam data. Only systematic uncertainties that affect the shape of the affect the fit value of . The individual contributions are treated as independent and added in quadrature for the total systematic error on the fit number of CEvNS events.
Results —
The input parameters, errors, and results for the maximum likelihood fit of for both analyses are summarized in Table 1. The significance of this result compared to the null hypothesis, incorporating systematic errorsas explained above, is () for Analysis A (B). Both analyses yield within 1 of the SM prediction. Note that the large SS background is not as detrimental to signal significance as expected with a simple signal to background argument because it is well-measured and of different character than signal in the distributions.
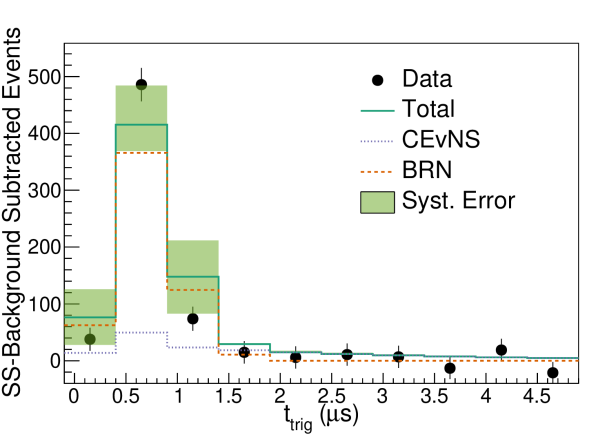
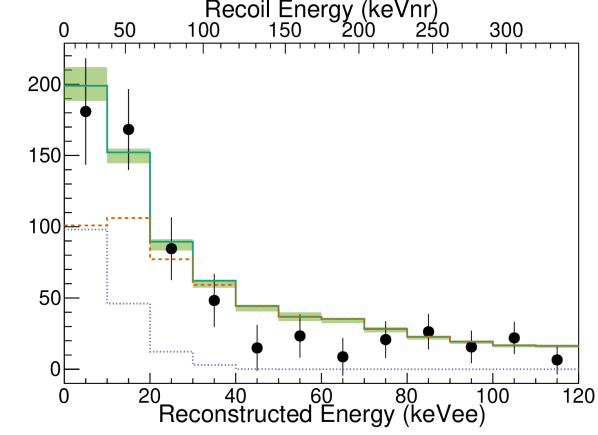
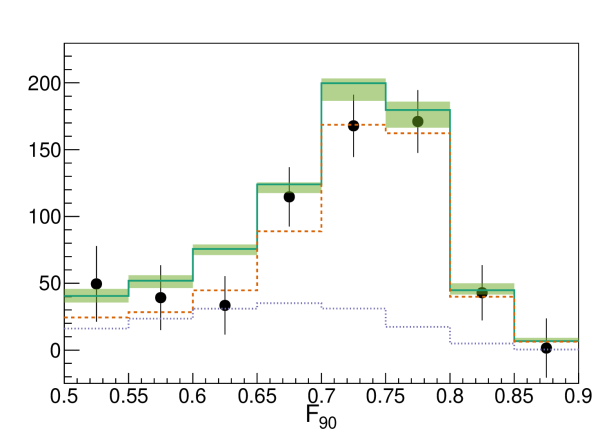
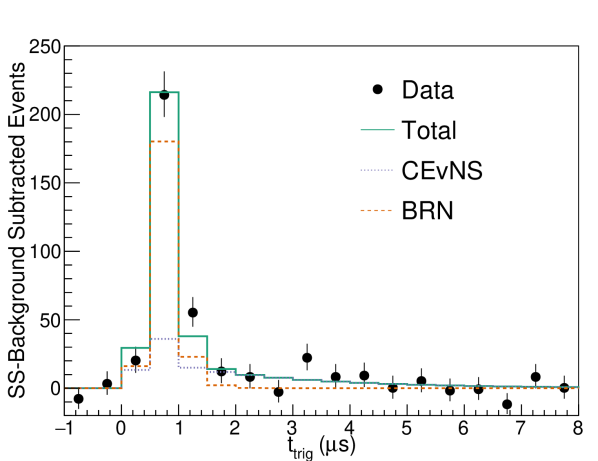
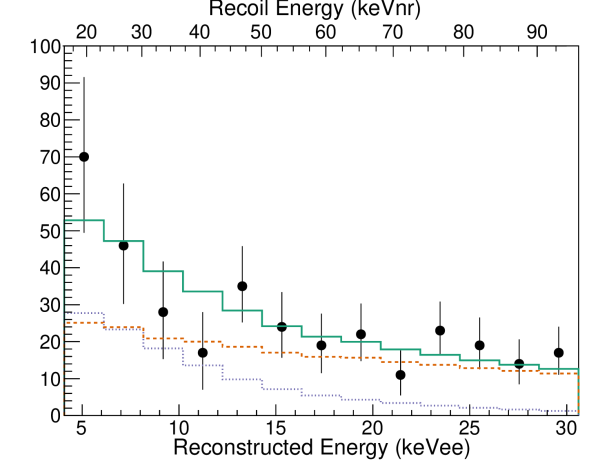
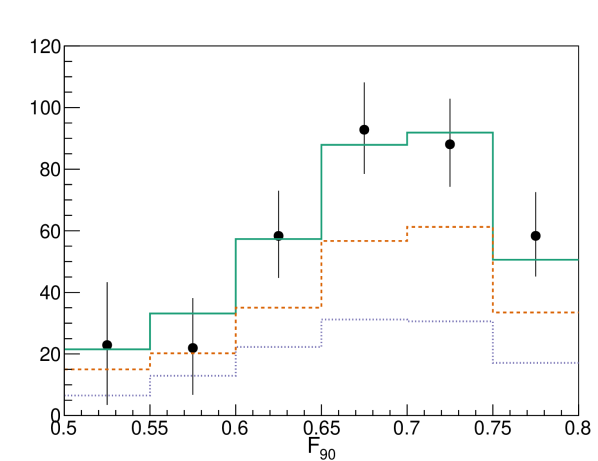
The data and best fit for analysis A are shown in Fig. 3, projected along , , and . Extraction of the relatively low-energy CEvNS signal is robust in the presence of the large prompt BRN background because of the latter’s much harder spectrum.
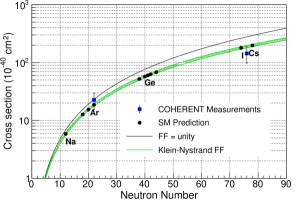
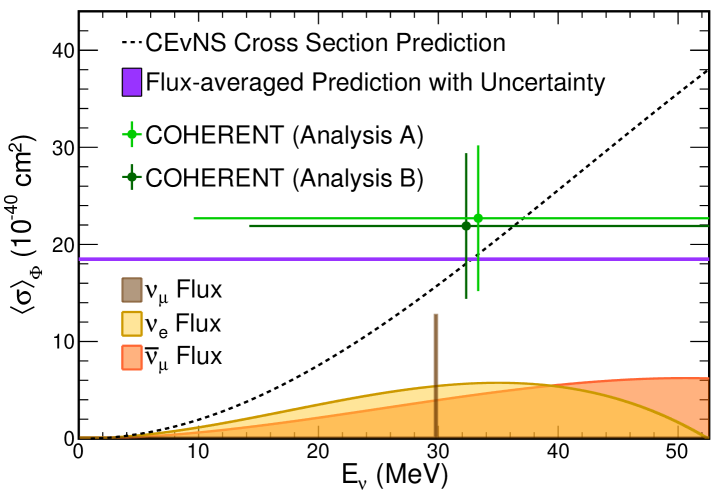
We compute the CEvNS flux-averaged cross section on argon (99.6% ) from the ratio of the best-fit to that predicted by the simulation using the SM prediction of cm2. This incorporates the total uncertainty on the fit along with additional systematic uncertainties, dominated by the 10% incident neutrino flux uncertainty, that do not affect the signal significance. The values are summarized along with extracted cross section values in Table 1. The measured flux-averaged cross sections are consistent between the two analyses and with the SM prediction as shown in Fig. 4. We average the results of the two analyses to obtain cm2 with uncertainty dominated by the % statistical uncertainty on .
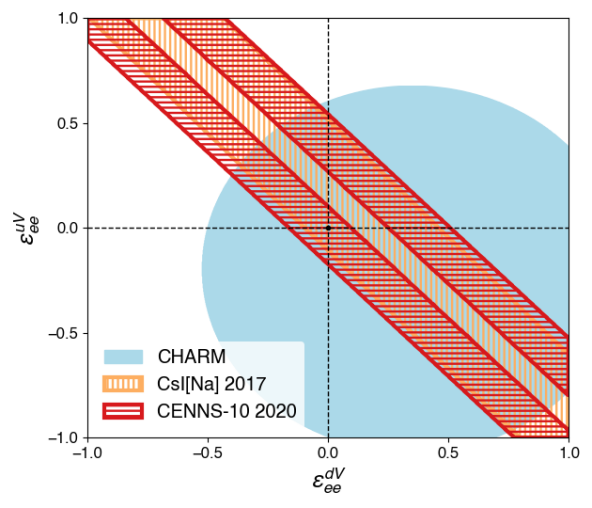
This result is used to constrain neutrino-quark NSI mediated by a new heavy vector particle using the framework developed in Refs. Barranco et al. (2005); Coloma et al. (2017b). Here we consider the particular case of non-zero vector-like quark- NSI couplings, and , as these two are the least experimentally constrained. The other couplings in this framework Coloma et al. (2017a) are assumed to be zero. A comparison of the measured CEvNS cross section reported here to the predicted cross section including these couplings is used to determine the 90% CL (1.65 ) regions of NSI parameters as shown in Fig. 5. The same procedure was separately applied using our previous CsI[Na] result Akimov et al. (2017) and also plotted in Fig. 5. The Ar measurement, with a slight excess over the SM prediction, favors a slightly different region than CsI[Na] and results in a bifurcated region because the central area corresponds to values of and that yield a cross section somewhat less than the SM value. The data and predicted background are available Akimov et al. (2020b) for alternative fits.
Summary —
A 13.7 1022 protons-on-target sample of data, collected with the CENNS-10 detector in the SNS neutrino alley at 27.5 m from the neutron production target, was analyzed to measure the CEvNS process on argon. Two independent analyses observed a more than 3 excess over background, resulting in the first detection of CEvNS in argon. We measure a flux-averaged cross section of cm2 averaged over and consistent between the two analyses. This is the second, and much lighter, nucleus for which CEvNS has been measured, verifying the expected neutron-number dependence of the cross section and improving constraints on non-standard neutrino interactions. CENNS-10 is collecting additional data which will provide, along with refined background measurements, more precise results in near future.
Acknowledgments —
The COHERENT collaboration acknowledges the generous resources provided by the ORNL Spallation Neutron Source, a DOE Office of Science User Facility, and thanks Fermilab for the continuing loan of the CENNS-10 detector. This material is based upon work supported by the U.S. Department of Energy, Office of Science, Office of Workforce Development for Teachers and Scientists, Office of Science Graduate Student Research (SCGSR) program. The SCGSR program is administered by the Oak Ridge Institute for Science and Education (ORISE) for the DOE. ORISE is managed by ORAU under contract number DE-SC0014664. We also acknowledge support from the Alfred P. Sloan Foundation, the Consortium for Nonproliferation Enabling Capabilities, the Institute for Basic Science (IBS-R017-D1-2020-a00/IBS-R017-G1-2020-a00), the National Science Foundation, and the Russian Foundation for Basic Research (projs. 17-02-01077_a, 20-02-00670_a, and 18-32-00910 mol_a). The work was supported by the Ministry of Science and Higher Education of the Russian Federation, Project “Fundamental properties of elementary particles and cosmology” No 0723-2020-0041 and the Russian Science Foundation, contract No.18-12-00135. Laboratory Directed Research and Development funds from ORNL also supported this project. This research used the Oak Ridge Leadership Computing Facility, which is a DOE Office of Science User Facility. This manuscript has been authored by UT-Battelle, LLC, under contract DE-AC05-00OR22725 with the US Department of Energy (DOE). The US government retains and the publisher, by accepting the article for publication, acknowledges that the US government retains a nonexclusive, paid-up, irrevocable, worldwide license to publish or reproduce the published form of this manuscript, or allow others to do so, for US government purposes. DOE will provide public access to these results of federally sponsored research in accordance with the DOE Public Access Plan (http://energy.gov/downloads/doe-public-access-plan).
References
- Freedman (1974) D. Freedman, Phys. Rev. D 9, 1389 (1974).
- Kopeliovich and Frankfurt (1974) V. B. Kopeliovich and L. L. Frankfurt, JETP Lett. 19, 145 (1974), [Pisma Zh. Eksp. Teor. Fiz.19,236(1974)].
- Barranco et al. (2005) J. Barranco, O. G. Miranda, and T. I. Rashba, J. High Energy Phys. 12, 021 (2005), arXiv:hep-ph/0508299 [hep-ph] .
- Barranco et al. (2007) J. Barranco, O. G. Miranda, and T. I. Rashba, Phys. Rev. D 76, 073008 (2007), arXiv:hep-ph/0702175 [hep-ph] .
- Dutta et al. (2016) B. Dutta, R. Mahapatra, L. E. Strigari, and J. W. Walker, Phys. Rev. D 93, 013015 (2016), arXiv:1508.07981 [hep-ph] .
- Krauss (1991) L. M. Krauss, Phys. Lett. B269, 407 (1991).
- Akimov et al. (2017) D. Akimov et al. (COHERENT), Science 357, 1123 (2017), arXiv:1708.01294 [nucl-ex] .
- Coloma and Schwetz (2016) P. Coloma and T. Schwetz, Phys. Rev. D 94, 055005 (2016), [Erratum: Phys. Rev. D 95,no.7,079903(2017)], arXiv:1604.05772 [hep-ph] .
- Coloma et al. (2017a) P. Coloma, P. B. Denton, M. C. Gonzalez-Garcia, M. Maltoni, and T. Schwetz, J. High Energy Phys. 04, 116 (2017a), arXiv:1701.04828 [hep-ph] .
- Coloma et al. (2017b) P. Coloma, M. C. Gonzalez-Garcia, M. Maltoni, and T. Schwetz, Phys. Rev. D 96, 115007 (2017b), arXiv:1708.02899 [hep-ph] .
- Liao et al. (2016) J. Liao, D. Marfatia, and K. Whisnant, Phys. Rev. D 93, 093016 (2016).
- Amanik and McLaughlin (2009) P. S. Amanik and G. C. McLaughlin, J. Phys. G 36, 015105 (2009).
- Cadeddu and Dordei (2019) M. Cadeddu and F. Dordei, Phys. Rev. D 99, 033010 (2019), arXiv:1808.10202 [hep-ph] .
- Patton et al. (2012) K. Patton, J. Engel, G. C. McLaughlin, and N. Schunck, Phys. Rev. C 86, 024612 (2012), arXiv:1207.0693 [nucl-th] .
- Cadeddu et al. (2018) M. Cadeddu, C. Giunti, Y. F. Li, and Y. Y. Zhang, Phys. Rev. Lett. 120, 072501 (2018), arXiv:1710.02730 [hep-ph] .
- Aristizabal Sierra et al. (2019) D. Aristizabal Sierra, J. Liao, and D. Marfatia, J. High Energy Phys. 06, 141 (2019), arXiv:1902.07398 [hep-ph] .
- Hoferichter et al. (2019) M. Hoferichter, P. Klos, J. Menéndez, and A. Schwenk, Phys. Rev. D 99, 055031 (2019), arXiv:1812.05617 [hep-ph] .
- Cañas et al. (2018) B. C. Cañas, E. A. Garcés, O. G. Miranda, and A. Parada, Phys. Lett. B 784, 159 (2018), arXiv:1806.01310 [hep-ph] .
- Barbeau et al. (2003) P. S. Barbeau, J. I. Collar, J. Miyamoto, and I. Shipsey, IEEE Transactions on Nuclear Science 50, 1285 (2003).
- Hagmann and Bernstein (2004) C. Hagmann and A. Bernstein, IEEE Transactions on Nuclear Science 51, 2151 (2004).
- Kim (2016) Y. Kim, Nuclear Engineering and Technology 48, 285 (2016).
- Davoudiasl et al. (2014) H. Davoudiasl, H.-S. Lee, and W. J. Marciano, Phys. Rev. D 89, 095006 (2014), arXiv:1402.3620 [hep-ph] .
- Gonzalez-Garcia et al. (2018) M. C. Gonzalez-Garcia et al., J. High Energy Phys. 2018, 19 (2018).
- deNiverville et al. (2015) P. deNiverville, M. Pospelov, and A. Ritz, Phys. Rev. D 92, 095005 (2015), arXiv:1505.07805 [hep-ph] .
- Ge and Shoemaker (2018) S.-F. Ge and I. M. Shoemaker, J. High Energy Phys. 11, 066 (2018), arXiv:1710.10889 [hep-ph] .
- Dutta et al. (2020) B. Dutta, D. Kim, S. Liao, J.-C. Park, S. Shin, and L. E. Strigari, Phys. Rev. Lett. 124, 121802 (2020), arXiv:1906.10745 [hep-ph] .
- Dutta et al. (2019) B. Dutta, S. Ghosh, and J. Kumar, Phys. Rev. D 100, 075028 (2019).
- Akimov et al. (2019a) D. Akimov et al. (COHERENT), (2019a), arXiv:1911.06422 [hep-ex] .
- Freedman et al. (1977) D. Z. Freedman, D. N. Schramm, and D. L. Tubbs, Ann. Rev. Nucl. Sci. 27, 167 (1977).
- Janka (2012) H.-T. Janka, Annu. Rev. Nucl. Part. Sci. 62, 407 (2012).
- Balasi et al. (2015) K. Balasi, K. Langanke, and G. Martínez-Pinedo, Prog. Part. Nucl. Phys. 85, 33 (2015), arXiv:1503.08095 [nucl-th] .
- Bruenn and Mezzacappa (1997) S. W. Bruenn and A. Mezzacappa, Phys. Rev. D 56, 7529 (1997).
- Horowitz et al. (2003) C. J. Horowitz, K. J. Coakley, and D. N. McKinsey, Phys. Rev. D 68, 023005 (2003).
- Akimov et al. (2018) D. Akimov et al. (COHERENT), (2018), arXiv:1803.09183 [physics.ins-det] .
- Akimov et al. (2019b) D. Akimov et al. (COHERENT), Phys. Rev. D 100, 115020 (2019b), arXiv:1909.05913 [hep-ex] .
- Brice et al. (2014) S. J. Brice et al., Phys. Rev. D 89, 072004 (2014), arXiv:1311.5958 [physics.ins-det] .
- Hitachi et al. (1983) A. Hitachi, T. Takahashi, N. Funayama, K. Masuda, J. Kikuchi, and T. Doke, Phys. Rev. B 27, 5279 (1983).
- Akimov et al. (2020a) D. Akimov et al. (COHERENT), (2020a), arXiv:2010.11258 [physics.ins-det] .
- Agnes et al. (2018) P. Agnes et al., Phys. Rev. D 97, 112005 (2018), arXiv:1801.06653 [physics.ins-det] .
- Cao et al. (2015) H. Cao et al. (SCENE), Phys. Rev. D 91, 092007 (2015), arXiv:1406.4825 [physics.ins-det] .
- Creus et al. (2015) W. Creus, Y. Allkofer, C. Amsler, A. D. Ferella, J. Rochet, L. Scotto-Lavina, and M. Walter, JINST 10, P08002 (2015), arXiv:1504.07878 [physics.ins-det] .
- Gastler et al. (2012) D. Gastler, E. Kearns, A. Hime, L. C. Stonehill, S. Seibert, J. Klein, W. H. Lippincott, D. N. McKinsey, and J. A. Nikkel, Phys. Rev. C 85, 065811 (2012), arXiv:1004.0373 [physics.ins-det] .
- Tanabashi et al. (2018) M. Tanabashi et al. (Particle Data Group), Phys. Rev. D 98, 030001 (2018).
- Regenfus et al. (2012) C. Regenfus, Y. Allkofer, C. Amsler, W. Creus, A. Ferella, J. Rochet, and M. Walter, J. Phys.: Conf. Ser. 375, 012019 (2012).
- Agostinelli et al. (2003) S. Agostinelli et al. (GEANT4), Nucl. Instrum. Meth. A 506, 250 (2003).
- Tayloe et al. (2006) R. Tayloe, H. Meyer, D. Cox, J. Doskow, A. Ferguson, T. Katori, M. Novak, and D. Passmore, Nucl. Instrum. Meth. A 562, 198 (2006).
- Cooper et al. (2011) R. Cooper, L. Garrison, H. O. Meyer, T. Mikev, L. Rebenitsch, and R. Tayloe, in Particles and fields. Proceedings, Meeting of the Division of the American Physical Society, DPF 2011, Providence, USA, August 9-13, 2011 (2011) arXiv:1110.4432 [hep-ex] .
- Kolbe and Langanke (2001) E. Kolbe and K. Langanke, Phys. Rev. C 63, 025802 (2001), arXiv:0003060 [nucl-th] .
- Verkerke and Kirkby (2003) W. Verkerke and D. P. Kirkby, Statistical Problems in Particle Physics, Astrophysics and Cosmology (PHYSTAT 05): Proceedings, Oxford, UK, September 12-15, 2005, eConf C0303241, MOLT007 (2003), [,186(2003)], arXiv:physics/0306116 [physics] .
- Akimov et al. (2020b) D. Akimov et al. (COHERENT), (2020b), 10.5281/zenodo.3903810, arXiv:2006.12659 [nucl-ex] .
- Dorenbosch et al. (1986) J. Dorenbosch et al. (CHARM), Phys. Lett. B 180, 303 (1986).
- Klein and Nystrand (1999) S. R. Klein and J. Nystrand, Phys. Rev. C 60, 014903 (1999), arXiv:9902259 [hep-ph] .
*
a)
 b)
b)
 c)
c)
 d)
d)
Appendix A Appendix
In this section, we present supplementary information supporting the material reported above.
A.1 Pulse shape discrimination
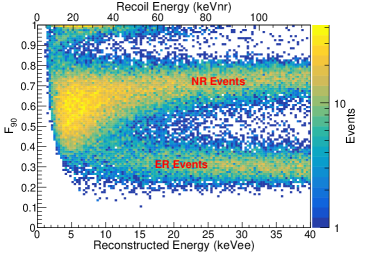
The signal in this analysis is an argon nuclear recoil (NR) in liquid argon. These NR events are separated from electron recoils (ER) via pulse-shape discrimination (PSD). The PSD parameter, , is formed from the total number of photoelectrons, , extracted from the corrected waveform in a 6 s window after the initial pulse and the fast signal, , dominated by singlet light, from the first ns of the pulse.
AmBe neutron source data are used to characterize the PSD response for NR events. The distribution versus for these data as a function of energy is shown in Fig. 6a). This AmBe source provides both neutrons and photons which explains the NR band at and the ER band at . The collection of events at are from beam-unrelated Cherenkov events. The behavior is broadly consistent with measurements from other LAr detectors Hitachi et al. (1983); Regenfus et al. (2012). The mean value of for both NR and ER events is parameterized versus energy for use in the simulation and construction of the expected distributions that are shown in Figs. 6b)-6d).
A.2 Liquid Argon Quenching Factor
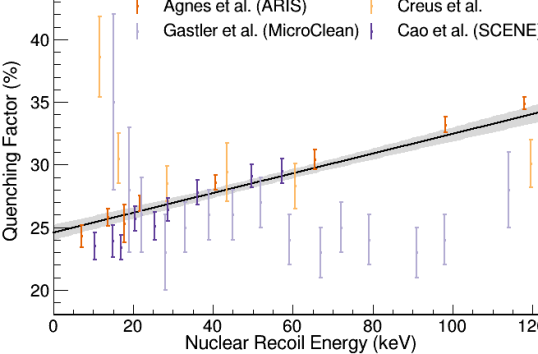
The predicted detector response to CEvNS NR events relative to that for ER events is quantified with the so-called “quenching factor” , defined as the ratio of the light output from NR events to that of ER events at the same kinetic energy. The most recent measurements of the for liquid argon in the energy range – keVnr Agnes et al. (2018); Cao et al. (2015); Creus et al. (2015); Gastler et al. (2012) are shown in Figure 7. While there appears to be some tension between data sets, there is no a priori reason to discard any particular measurement. Therefore, we decided to do a simultaneous fit of these data with a complete treatment of the errors. Since CENNS-10 has little efficiency for keVnr, and any evidence for a more complex energy dependence is not clear, we assumed a linear model for the energy dependence of the .
The simultaneous fit to this data utilized a standard least-squares method Tanabashi et al. (2018), with an error matrix to handle any correlations in a particular data set. While it is reasonable to assume that all individual data sets contained correlated error, only Ref. Gastler et al. (2012) reported them, so the error matrix contained off-diagonal terms only for these data. We suggest here in passing that future measurements report correlated errors (as would occur, for example, with an overall energy calibration uncertainty) with the data, allowing for a more correct treatment of errors in fits to world data. The linear fit to this data with the reported errors yielded a of 138.1/36. Following the recommended method of Ref. Tanabashi et al. (2018), the errors on all data points were simultaneously scaled by a factor of 2.0 such that . This yields with a correlation coefficient of -0.79 between the slope and intercept. This fit and resulting error band are shown in Figure 7. A factor of 2 increase in the errors brings the data into reasonable agreement when correlated errors are considered.
A 2% error on the efficiency for acceptance of CEvNS events resulted from this uncertainty and was calculated by varying the used in the simulation within the error band of Figure 7. Other scenarios for the energy dependence below 20 keVnr were also considered to quantify extreme possibilities. If the data only from Refs. Agnes et al. (2018); Cao et al. (2015) (Creus et al. (2015); Gastler et al. (2012)) are used for the fit of below 20 keVnr, a change in the CEvNS acceptance of -1% (+12%) results.
A.3 Maximum Likelihood Analysis
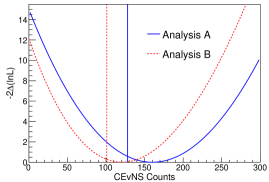
A maximum likelihood fit was used to find the best estimate of for the results reported here. The statistics-only null significance is determined by forming the quantity,
| (1) |
that depends on the difference between the likelihoods at a given value of and at the best-fit value of , . The value of this quantity at determines the statistics-only null-rejection significance with the assumption that it is distributed as a function with 1 degree of freedom. This assumption was tested with pseudo-data and supports our simple treatment of systematic errors in this analysis. Figure 8 shows profiled over the number of SS and BRN background events for the data sets in analyses A and B. Figure 9 shows the projections of the likelihood fit for analysis B. Figure 10 shows the projections of the likelihood fit for analysis A, but without subtraction of the SS background distribution.
A.4 CEvNS Cross Section Dependence
With the result reported here, the COHERENT collaboration has measured the flux-weighted CEvNS cross section with different nuclei. These results, along with the SM prediction, are shown in Figure 11.