Observations of a quasi-periodic pulsation in the coronal loop and microwave flux during a solar preflare phase
Abstract
We report a quasi-periodic pulsation (QPP) event simultaneously detected from the spatial displacements of coronal loop at both EUV images and microwave emission during the preflare phase of a C1.1 flare on 2016 March 23. Using the motion magnification technique, a low-amplitude transverse oscillation with the growing period is discovered in a diffuse coronal loop in Atmospheric Imaging Assembly (AIA) image sequences at wavelength of 171 Å, and the initial oscillation period is estimated to be 397 s with a slow growth rate of 0.045. At the same time, a QPP with growing periods from roughly 300 s to nearly 500 s is discovered in the microwave flux in the same active region. Based on the imaging observations measured at EUV wavelengths by the AIA and at microwave 17 GHz by Nobeyama Radioheliograph, the diffuse coronal loop and the microwave radiation source are found to be connected through a hot loop seen in AIA images at wavelength of 94 Å. The growing period of the QPP should be related to the modulation of LRC-circuit oscillating process in a current-carrying plasma loop. The existence of electric currents may imply the non-potentialities in the source region during the preflare phase.
1 Introduction
Quasi-periodic pulsations (QPPs) are frequently identified as temporal oscillations of electromagnetic radiation in solar flares (see, Nakariakov, & Melnikov, 2009; Van Doorsselaere et al., 2016, for reviews). The QPP was first discovered by Parks, & Winckler (1969) in a solar X-ray event, and then the observational studies of QPPs were reported in more and more wavebands. So far, they could be observed in almost all the wavelengths, i.e., radio/microwave, extreme-ultraviolet and ultraviolet (EUV/UV), soft and hard X-ray (SXR/HXR), and the detected periods can cover a broad range, which are from sub-seconds to dozens of minutes (e.g., Tan & Tan, 2012; Tan et al., 2016; Milligan et al., 2017; Kolotkov et al., 2018; Nakariakov et al., 2018; Hayes et al., 2019; Shen et al., 2019). Utilizing the high spatial and temporal resolution imaging and spectroscopic observations, QPPs are also observed as spatial motions of the oscillating system, i.e., the spatial displacement oscillations in coronal loops (Nakariakov et al., 1999; Wang et al., 2012; Anfinogentov et al., 2015; Yuan, & Van Doorsselaere, 2016; Goddard et al., 2018), the Doppler shift oscillations in coronal or flaring loops (Ofman, & Wang, 2002; Mariska & Muglach, 2010; Tian et al., 2012; Li et al., 2018). Due to the limitation of the time and spatial resolutions of available observational facilities, most of the spatial motions of QPPs are discovered in EUV and X-ray images or spectral lines, and their oscillation periods are found to be from dozens of seconds to tens of minutes (Aschwanden et al., 1999; Brosius, & Daw, 2015; Tian et al., 2016; Duckenfield et al., 2018; Su et al., 2018). QPPs in coronal/flaring loops often exhibit two different oscillation behaviors, one is large amplitude but damping rapidly (e.g., Nakariakov et al., 1999; Ofman, & Wang, 2002; Wang et al., 2015; Li et al., 2017a; Nakariakov et al., 2019), and the other one has a low amplitude without significant damping (e.g., Tian et al., 2012; Nisticò et al., 2013; Thurgood et al., 2014; Anfinogentov et al., 2015; Li et al., 2018).
Based on the use of multi-instrumental and -wavelength data, the observational study of QPPs has become an important research avenue. To understand the generation mechanisms of the observed QPPs, various kinds of theoretical models have been proposed (see, Nakariakov, & Verwichte, 2005; Nakariakov, & Melnikov, 2009; Van Doorsselaere et al., 2016, for the reviews of various theoretical models). In particular, the QPP could be related to a self-oscillatory regime of spontaneous magnetic reconnection (i.e., magnetic dripping mechanism), or it might be driven by the magnetohydrodynamic (MHD) oscillation in flaring plasma structures, or it is caused by the induced repetitive magnetic reconnection which can be modulated by MHD waves, such as fast kink waves, slow magnetoacoustic waves, and global sausage waves (e.g., Kliem et al., 2000; Chen & Priest, 2006; Nakariakov, & Melnikov, 2009; Su et al., 2012; Anfinogentov et al., 2015; Wang et al., 2015; Tian et al., 2016; Goddard et al., 2018). It is likely that different mechanisms/models generate different types of QPPs, and it is impossible to find one physical model to explain all the discovered QPPs (Nakariakov, & Verwichte, 2005; Tan et al., 2010; Van Doorsselaere et al., 2016).
QPPs in coronal loops such as damping oscillations are generally thought to be triggered by the solar eruptions, i.e., flares, jets or EUV waves (e.g., Nakariakov et al., 1999; Nakariakov, & Verwichte, 2005; Zimovets, & Nakariakov, 2015; Su et al., 2018). However, the QPP in the coronal loop during the preflare phase is rarely reported. In this letter, using the imaging observations measured by the Atmospheric Imaging Assembly (AIA, Lemen et al., 2012) on board the Solar Dynamics Observatory (SDO) and the Nobeyama Radioheliograph (NoRH, Nakajima et al., 1994), we investigate a low-amplitude transverse oscillation in the coronal loop in AIA 171 Å before a C1.1 flare. Meanwhile, a similar QPP is detected in microwave flux at the frequency of 17 GHz. The microwave source and the EUV coronal loop are found to be connected through a hot loop in AIA 94 Å. To the best of our knowledge, this is the first report of QPPs simultaneously discovered from the spatial displacements of coronal loop at both EUV images and microwave emission during the preflare phase, which could be helpful for understanding the precursor of a solar flare.
2 Observation
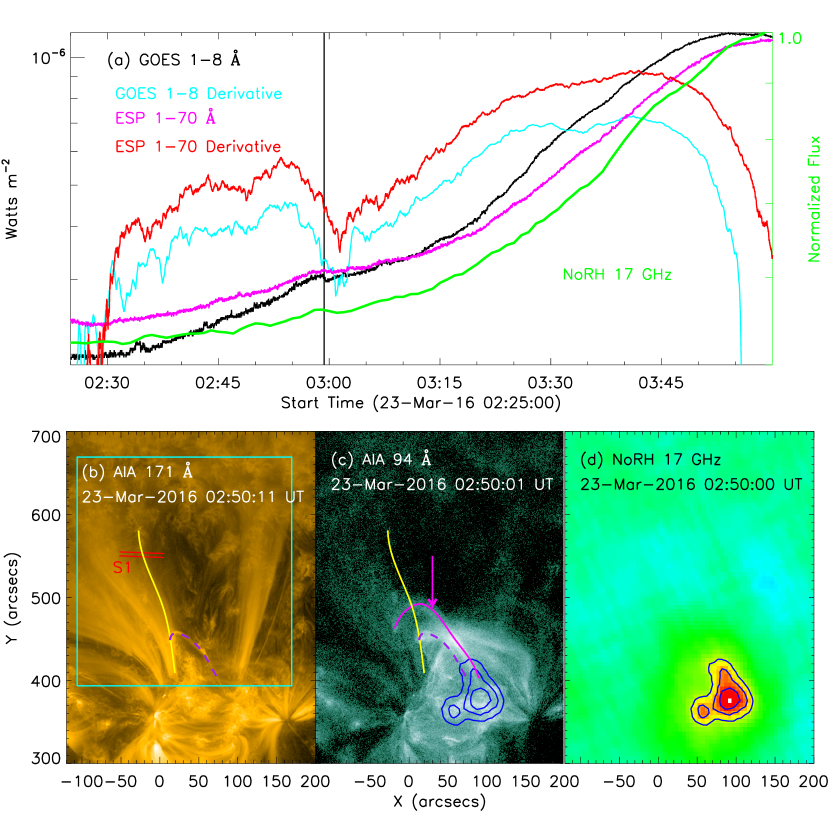
We analyze observations of a coronal loop in the active region of NOAA 12524 on 2016 March 23. We focus on a low-amplitude transverse oscillation during 02:4103:01 UT in the EUV coronal loop before a C1.1 flare which starts at about 02:59 UT in the GOES SXR flux at 18 Å. Figure 1 (a) shows that the light curve in GOES 18 Å (black curve) appears to increase slowly from 02:30 UT, which is earlier than the flare onset time (vertical black line). Moreover, the time derivative (cyan curve) derived from GOES 18 Å exhibits a clear enhancement before the solar flare, i.e., during 02:3003:01 UT. The similar feature can be discovered in the light curves in EUV SpectroPhotometer (ESP) 170 Å (magenta curve) and its time derivative (red cure) measured by the Extreme Ultraviolet Variability Experiment (EVE, Woods et al., 2012) aboard SDO, such as a slight increase in SXR flux but a prominent enhancement in its time derivative during the same time interval. Here, the weak enhancement observed in GOES and ESP SXR flux is regarded as the preflare phase rather than a separate subflare (see, Li et al., 2017b, for details). In panel (a), some light curves are shifted in height to display them clearly in the same window. Finally, the normalized microwave flux (green curve) at the frequency of 17 GHz recorded by the NoRH also show a very weak radiation enhancement from 02:35 to 03:01 UT. Notice that the microwave flux is integrated over the active region such as NOAA 12524, rather than over the full-disk Sun.
Figure 1 (b)(d) shows the simultaneous snapshots at around 02:50 UT with the same field-of-view (FOV) of 320400 in EUV and microwave channels measured by the SDO/AIA (0.6″/pixel) and the NoRH (4.9″/pixel), respectively. The AIA images are pre-processed with the standard routine of ‘aia_prep.pro’ (Lemen et al., 2012) included in the solar software package. Panels (b) and (c) present the EUV images in AIA 171 Å and 94 Å, respectively. A number of loop structures can be seen in AIA images at wavelength of 171 Å, and a large diffuse loop with a bubble-like profile is studied in this work, as indicated by a yellow curve that only outlines the left part of the diffuse loop. Two red short lines outline the slice (S1) positions used to make the time-distance plot, while the cyan box marks the FOV of a movie (see, 171_94.mp4). A highly sheared arch which is close to the diffuse coronal loop (see, Li et al., 2017b) can be seen in AIA images at wavelength of 171 Å, as marked by a purple dashed line. However, the diffuse coronal loop is not identified in AIA images at wavelength of 94 Å, but a faint hot loop appears above the sheared arch (purple dashed line), as outlined by a magenta curve (or arrow). The movie of 171_94.mp4 further suggests that the hot loop in AIA 94 Å begins to appear at around 02:30 UT and then becomes brighter and brighter, as marked by a magenta arrow. Finally, an enhancement of the microwave emission at NoRH 17 GHz (blue contours) is discovered at the end of the hot loop seen in the AIA image at wavelength of 94 Å, as shown in panels (c) and (d).
3 Data reduction and Result
The movie of 171_94.mp4 shows the temporal evolution of coronal loops in AIA 171 Å and 94 Å during 02:3003:00 UT with a time cadence of 12 s. From which, we can see that a diffuse coronal loop with bubble-like profiles rises slowly with time during the preflare phase (see details in Li et al., 2017b) in AIA 171 Å. The coronal loop starts to oscillate at about 02:41 UT, and could last for nearly 20 minutes. The oscillation is transverse and significant at the left-upper part of the coronal loop, as indicated by two red lines. However, it is impossible to identify the oscillation feature at the other region of the diffuse coronal loop.
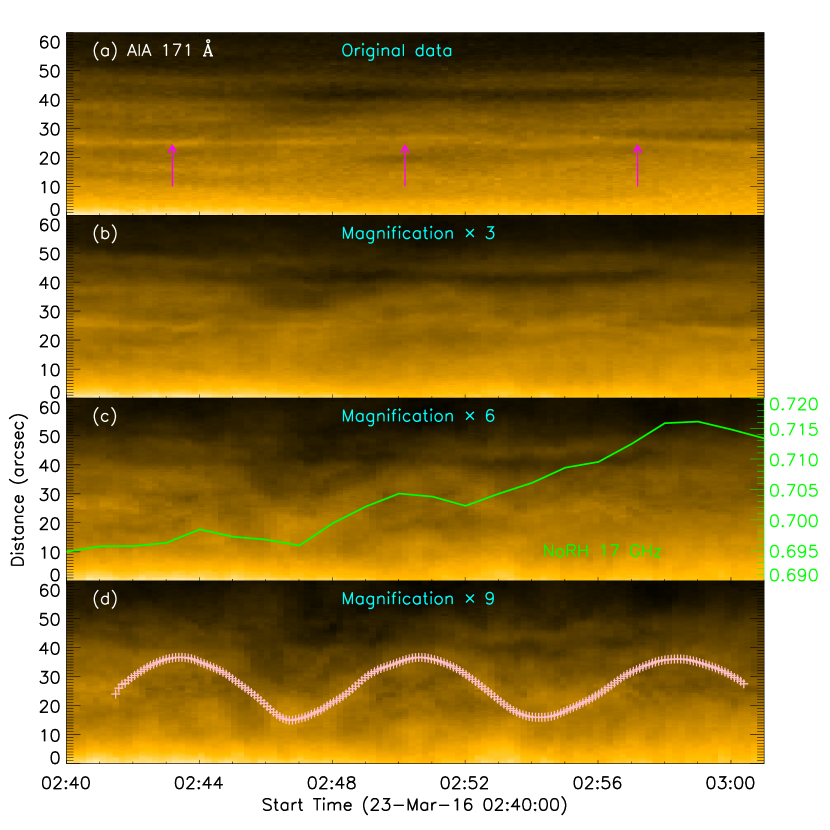
Figure 2 presents the time-distance plots along the slice of S1, which are derived from the AIA 171 Å image sequences. It is hard to identify any apparent signature of the oscillation from the original data but only a diffuse faint loop which is centered at around 25″, as marked with the magenta arrows in panel (a). To detect the low-amplitude oscillation at the coronal loop, we then perform a motion magnification method to the original data, which enable us to magnify the quasi-periodic transverse motions of contrast features with a very low amplitude such as 0.2 Mm in image sequences, but it does not change the image scale (e.g., Anfinogentov, & Nakariakov, 2016). In our study, the magnification factors of 3, 6 and 9 are applied to the AIA 171 Å image sequences, respectively. Panels (b)(d) shows time-distance plots after the motion magnification technique. We can find a very weak transverse oscillation in panel (b), which displays with a magnification factor of 3. Then, with the increasing of magnification factors, the transverse oscillation is more and more clear. Finally, we perform a magnification factor of 9, and a transverse oscillation with three pronounced peaks can be found obviously in the time-distance plot, as indicated by the pink pluses (‘+’) in panel (d). The over-plotted green line in panel (c) represents the normalized microwave flux in NoRH 17 GHz measured from the active region of NOAA 12524, as shown in Figure 1 (d). The microwave flux exhibits three small-scale peaks, which are well corresponding to the three peaks in the transverse oscillation of coronal loop (pink pluses), suggesting that they might come from the same heating process. However, we could not discover the corresponding three peaks from the time derivatives of SXR fluxes in GOES 18 Å and ESP 1-70 Å, which could be due to the fact that the SXR fluxes are measured as full-disk radiations, so the small-scale QPP occurred in a relatively active region can not be detected.
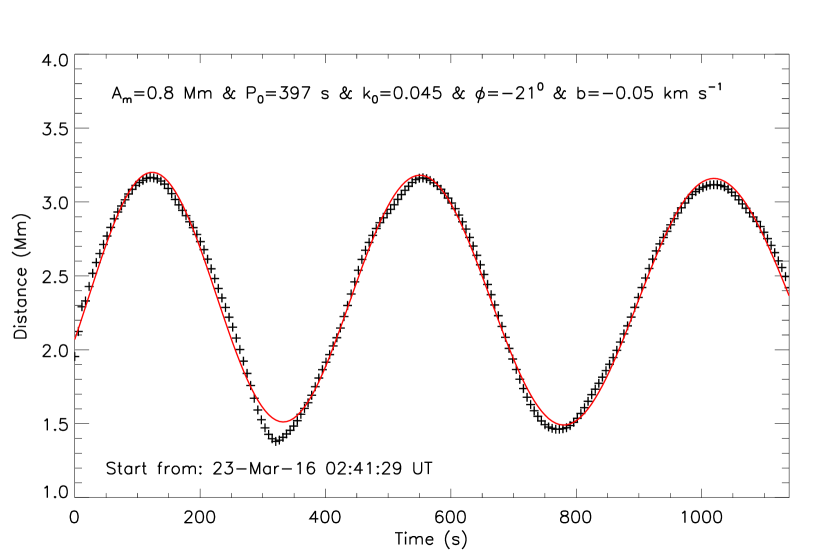
To take a close look at the period of the low-amplitude transverse oscillation in the EUV coronal loop, we manually extracted the oscillation positions and applied a sine function with a linear trend (Eq. 1) to fit them, which was a widely adopted function (e.g., Nakariakov et al., 1999; Zhang et al., 2017; Su et al., 2018), but without the damping term (see, Thurgood et al., 2014; Anfinogentov et al., 2015).
| (1) |
Where is the oscillation amplitude, and represent the initial position and initial phase, indicates the drifting speed of oscillation loop. The oscillation period is a function of time, represents the initial period, while refers the changing (decreasing/growth) rate of the oscillation period. Figure 3 presents the temporal evolution of the loop locations (pluses) during the low-amplitude transverse oscillation. Here the low-amplitude transverse oscillation has been reduced to the real amplitude, i.e., multiple a factor of 1/9 to offset the motion magnification technique. The best fitted curve for the loop oscillation is shown with a red line, and the fitted results are also given. The oscillation amplitude is about 0.8 Mm, while the initial oscillation period is 397 s, which is slowly growing with a growth rate of 0.045.
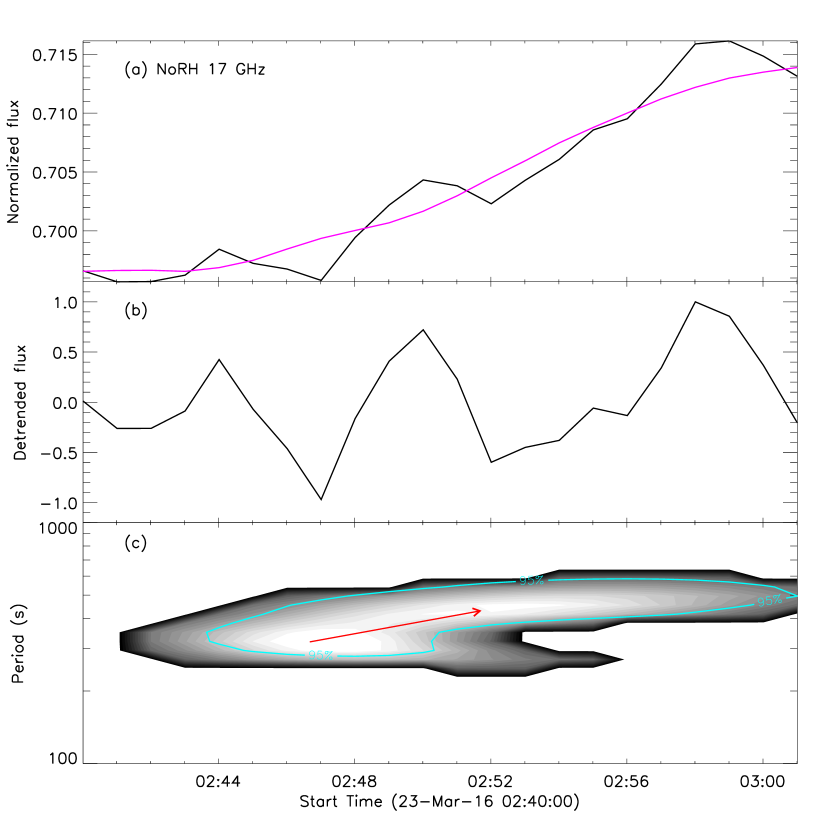
To examine the QPP in microwave emission, we then performed a wavelet analysis method (Torrence, & Compo, 1998) on the detrended light curve in NoRH 17 GHz. Figure 4 (a) shows the normalized microwave flux in NoRH 17 GHz from 02:40 UT to 03:01 UT, and the magenta line represents the trended light curve calculated by a 420-s running average (see, Yuan et al., 2011; Li et al., 2018). Then the detrended light curve can be derived by subtracting the trended light curve, as shown in panel (b). The wavelet power spectrum shows an obvious signature of QPP, and its period appears to increase from 300 s to 500 s, as indicated by the red arrow in panel (c). The growing periods detected in microwave flux are consistent with the growing periods in the diffuse coronal loop in AIA 171 Å. On the other hand, both the low-amplitude transverse oscillation in the EUV coronal loop and the small-scale QPP in microwave flux start at about 02:41 UT, which is later than the onset time of the hot loop and the sheared arch (see, Li et al., 2017b). Moreover, the hot loop and the sheared arch connect the diffuse coronal loop and microwave source (see, Figure 1 c). All these observational facts imply that the loop oscillation and the microwave QPP could be related to each other, and may be driven by a same process.
4 Conclusion and Discussion
Utilizing the observations measured by the SDO/AIA and the NoRH, we investigated a low-amplitude transverse oscillation in the EUV coronal loop before a GOES C1.1 flare on 2016 March 23. The main results are summarized as follows.
-
1.
A low-amplitude transverse oscillation with the growing period is discovered in the EUV coronal loop during the preflare phase. The oscillation period is estimated to 397 s with a growth rate of 0.045, and the oscillation amplitude is about 0.8 Mm, without significant damping.
-
2.
A small-scale QPP with growing periods is detected in the microwave flux during the same preflare phase. The quasi-periods are estimated to increase from 300 s to 500 s.
-
3.
The EUV diffuse coronal loop and microwave radiation source are connected through a hot loop seen in AIA images at wavelength of 94 Å, suggesting that the loop oscillation and the microwave QPP may be triggered by a same thermal process, i.e., kink oscillations. The growing periods might be explained by the modulation of LRC-circuit oscillating process in a current-carrying plasma loop.
It is interesting that a low-amplitude transverse oscillation without significant damping in the EUV coronal loop is observed before the onset time of a GOES C1.1 flare. The non-damping transverse oscillation of coronal loop can be clearly seen in AIA image sequences at the wavelength of 171 Å, see details in the movie of 171_94.mp4. However, it is hard to identify the signature of oscillation in the time-distance image due to its low amplitude such as 0.8 Mm, as shown in Figure 2 (a). Fortunately, Anfinogentov, & Nakariakov (2016) have developed a motion magnification technique to extract the low-amplitude transverse oscillations in image sequences, particularly for the SDO/AIA data cube. In this letter, we apply the motion magnification technique to AIA 171 Å image sequences, and find a pronounced signature of low-amplitude transverse oscillation in the EUV coronal loop (Figure 2 d), which agrees well with the temporal evolution in the movie of 171_94.mp4. The low-amplitude transverse oscillation is non-damping, but it only lasts for three pronounced peaks. Our observational result is different from previous observations of non-damping loop oscillations, which are often discovered in non-flaring active regions and can be oscillating for dozens of cycles (e.g., Tian et al., 2012; Anfinogentov et al., 2015; Yuan, & Van Doorsselaere, 2016). The difference might be attributed to the fact that the diffuse coronal loop is affected seriously by a C1.1 flare after 02:59 UT. Therefore, only the loop oscillation during the preflare phase is detected. Finally, we want to stress that the low-amplitude transverse oscillation is only observed in the wavelength of AIA 171 Å, and it is most like a kink oscillation in the coronal loop (e.g., Su et al., 2012; Nisticò et al., 2013; Anfinogentov et al., 2015; Li et al., 2018), but we could not rule out the other MHD modes here.
It is necessary to stress that a similar small-scale QPP is found in microwave emission, i.e., the growing periods from 300 s to 500 s during the preflare phase, and the QPP emission is very weak. Here, the microwave light curve is integrated over the active region (Figure 1 d), but not over the full solar disk. Since the microwave radiation before a GOES C1.1 flare is very weak, and the full-disk light curve show a strong background emission. On the other hand, the time derivatives in SXR channels recorded by GOES 18 Å and ESP 170 Å show a significant enhancement during 02:3003:01 UT, which closely matches the microwave light curve. Our result is similar to previous observations of the relationship between the SXR derivative light curves and the microwave fluxes in solar flares (e.g., Neupert, 1968; Ning, 2008). All these observational facts suggest a thermal process during the preflare phase. Although the microwave emission at NoRH 17 GHz might be the nonthermal gyrosynchrotron radiation, it also could arise from the thermal bremsstrahlung and gyroresonance (e.g., Warmuth et al., 2016). Therefore, the QPP in microwave channel may be triggered by the thermal heating process, such as the kink mode.
There are three significant peaks in the low-amplitude transverse oscillation of coronal loop in AIA 171 Å, and the similar three peaks can be discovered in the small-scale QPP of microwave emission recorded by NoRH 17 GHz. Moreover, they exhibit a well one-to-one corresponding relationship, as shown in Figure 2. Their oscillation periods appear a clear growth trend, as presented in Figures 3 and 4. Thus, there must be some connections between the loop oscillation and microwave QPP. Then, a hot loop is found to gradually appear in AIA image sequences at wavelength of 94 Å, and it connects the EUV diffuse coronal loop and microwave radiation source, as can be seen in the movie of 171_94.mp4. The hot loop is much lower than the diffuse coronal loop in AIA 171 Å. This is consistent with the hot channel in AIA 131 Å, which is also much lower than the cool compression front in AIA 171 Å (e.g., Zhang et al., 2012; Cheng et al., 2014). On the other hand, a highly sheared arch is detected during the preflare phase in AIA 171 Å, which is lower than the hot loop in AIA 94 Å, as shown in Figures 1. The observations suggest that a weak magnetic reconnection process occurs before the C1.1 flare, resulting into a slowly rising diffuse loop in AIA 171 Å (see, Li et al., 2017b). However, it is not necessary of nonthermal process to generate QPPs, particularly for the low-amplitude transverse oscillation with a period of several minutes (e.g., Tan et al., 2010). On the other hand, the solar emissions of SXR, EUV, and 17 GHz microwave radiation can be related to thermal processes. Therefore, the small-scale QPP in the EUV coronal loop and microwave flux could be related to the same thermal heating process in the oscillating source region during the preflare phase (Nakariakov, & Melnikov, 2009; Tan et al., 2010). Their oscillation periods might be modulated by a kink oscillation in the EUV coronal loop (Tian et al., 2012; Nisticò et al., 2013; Anfinogentov et al., 2015).
Finally, we want to stress that both the low-amplitude transverse oscillation in the EUV coronal loop and QPP at 17 GHz microwave emission exhibit slowly growth rate of periods. One possible mechanism for this QPP event with growing periods is the LRC-circuit model, which is related to the longitudinal current in the coronal loop (e.g., Zaitsev et al., 1998; Tan et al., 2010, 2016; Chen et al., 2019). In this model, the decrease of the current may lead to the growing period of the oscillation. The existence of the longitudinal current is a signature of non-potentialities in the source region, and the QPP with growing periods in the preflare phase may provide valuable information for understanding the triggering process of solar flares.
References
- Anfinogentov et al. (2015) Anfinogentov, S. A., Nakariakov, V. M., & Nisticò, G. 2015, A&A, 583, A136
- Anfinogentov, & Nakariakov (2016) Anfinogentov, S., & Nakariakov, V. M. 2016, Sol. Phys., 291, 3251
- Aschwanden et al. (1999) Aschwanden, M. J., Fletcher, L., Schrijver, C. J., et al. 1999, ApJ, 520, 880
- Brosius, & Daw (2015) Brosius, J. W., & Daw, A. N. 2015, ApJ, 810, 45
- Chen & Priest (2006) Chen, P. F., & Priest, E. R. 2006, Sol. Phys., 238, 313
- Chen et al. (2019) Chen, X., Yan, Y., Tan, B., et al. 2019, ApJ, 878, 78
- Cheng et al. (2014) Cheng, X., Ding, M. D., Zhang, J., et al. 2014, ApJ, 789, L35
- Duckenfield et al. (2018) Duckenfield, T., Anfinogentov, S. A., Pascoe, D. J., et al. 2018, ApJ, 854, L5
- Goddard et al. (2018) Goddard, C. R., Antolin, P., & Pascoe, D. J. 2018, ApJ, 863, 167
- Hayes et al. (2019) Hayes, L. A., Gallagher, P. T., Dennis, B. R., et al. 2019, ApJ, 875, 33
- Kliem et al. (2000) Kliem, B., Karlický, M., & Benz, A. O. 2000, A&A, 360, 715
- Kolotkov et al. (2018) Kolotkov, D. Y., Pugh, C. E., Broomhall, A.-M., et al. 2018, ApJ, 858, L3
- Lemen et al. (2012) Lemen, J. R., Title, A. M., Akin, D. J., et al. 2012, Sol. Phys., 275, 17
- Li et al. (2017a) Li, D., Ning, Z. J., Huang, Y., et al. 2017a, ApJ, 849, 113
- Li et al. (2018) Li, D., Yuan, D., Su, Y. N., et al. 2018, A&A, 617, A86
- Li et al. (2017b) Li, Y., Sun, X., Ding, M. D., et al. 2017b, ApJ, 835, 190
- Mariska & Muglach (2010) Mariska, J. T., & Muglach, K. 2010, ApJ, 713, 573
- Milligan et al. (2017) Milligan, R. O., Fleck, B., Ireland, J., et al. 2017, ApJ, 848, L8
- Nakajima et al. (1994) Nakajima, H., Nishio, M., Enome, S., et al. 1994, IEEE Proceedings, 82, 705
- Nakariakov et al. (1999) Nakariakov, V. M., Ofman, L., Deluca, E. E., et al. 1999, Science, 285, 862
- Nakariakov, & Verwichte (2005) Nakariakov, V. M., & Verwichte, E. 2005, Living Reviews in Solar Physics, 2, 3
- Nakariakov, & Melnikov (2009) Nakariakov, V. M., & Melnikov, V. F. 2009, Space Sci. Rev., 149, 119
- Nakariakov et al. (2018) Nakariakov, V. M., Anfinogentov, S., Storozhenko, A. A., et al. 2018, ApJ, 859, 154
- Nakariakov et al. (2019) Nakariakov, V. M., Kosak, M. K., Kolotkov, D. Y., et al. 2019, ApJ, 874, L1
- Neupert (1968) Neupert, W. M. 1968, ApJ, 153, L59
- Ning (2008) Ning, Z. 2008, Sol. Phys., 248, 99
- Nisticò et al. (2013) Nisticò, G., Nakariakov, V. M., & Verwichte, E. 2013, A&A, 552, A57
- Ofman, & Wang (2002) Ofman, L., & Wang, T. 2002, ApJ, 580, L85
- Parks, & Winckler (1969) Parks, G. K., & Winckler, J. R. 1969, ApJ, 155, L117
- Shen et al. (2019) Shen, Y., Chen, P. F., Liu, Y. D., et al. 2019, ApJ, 873, 22
- Su et al. (2012) Su, J. T., Shen, Y. D., Liu, Y., et al. 2012, ApJ, 755, 113
- Su et al. (2018) Su, W., Guo, Y., Erdélyi, R., et al. 2018, Scientific Reports, 8, 4471
- Tan et al. (2010) Tan, B., Zhang, Y., Tan, C., et al. 2010, ApJ, 723, 25
- Tan & Tan (2012) Tan, B., & Tan, C. 2012, ApJ, 749, 28
- Tan et al. (2016) Tan, B., Yu, Z., Huang, J., et al. 2016, ApJ, 833, 206
- Thurgood et al. (2014) Thurgood, J. O., Morton, R. J., & McLaughlin, J. A. 2014, ApJ, 790, L2
- Tian et al. (2012) Tian, H., McIntosh, S. W., Wang, T., et al. 2012, ApJ, 759, 144
- Tian et al. (2016) Tian, H., Young, P. R., Reeves, K. K., et al. 2016, ApJ, 823, L16
- Torrence, & Compo (1998) Torrence, C., & Compo, G. P. 1998, Bulletin of the American Meteorological Society, 79, 61
- Van Doorsselaere et al. (2016) Van Doorsselaere, T., Kupriyanova, E. G., & Yuan, D. 2016, Sol. Phys., 291, 3143
- Warmuth et al. (2016) Warmuth, A., Shibasaki, K., Iwai, K., et al. 2016, A&A, 593, A102
- Wang et al. (2012) Wang, T., Ofman, L., Davila, J. M., et al. 2012, ApJ, 751, L27
- Wang et al. (2015) Wang, T., Ofman, L., Sun, X., et al. 2015, ApJ, 811, L13
- Woods et al. (2012) Woods, T. N., Eparvier, F. G., Hock, R., et al. 2012, Sol. Phys., 275, 115
- Yuan et al. (2011) Yuan, D., Nakariakov, V. M., Chorley, N., et al. 2011, A&A, 533, A116
- Yuan, & Van Doorsselaere (2016) Yuan, D., & Van Doorsselaere, T. 2016, ApJS, 223, 24
- Zhang et al. (2012) Zhang, J., Cheng, X., & Ding, M.-D. 2012, Nature Communications, 3, 747
- Zhang et al. (2017) Zhang, Q. M., Li, T., Zheng, R. S., et al. 2017, ApJ, 842, 27
- Zaitsev et al. (1998) Zaitsev, V. V., Stepanov, A. V., Urpo, S., et al. 1998, A&A, 337, 887
- Zimovets, & Nakariakov (2015) Zimovets, I. V., & Nakariakov, V. M. 2015, A&A, 577, A4