Effect of cytosol viscosity on the flow behavior of red blood cell suspensions in microvessels
Abstract
The flow behavior of blood in microvessels is directly associated with tissue perfusion and oxygen delivery. Current efforts on modeling blood flow have primarily focused on the flow properties of blood with red blood cells (RBCs) having a viscosity ratio of unity between the cytosol and suspending medium, while under physiological conditions the cytosol viscosity is about five times larger than the plasma viscosity (i.e., ). The importance of for the behavior of single RBCs in fluid flow has already been demonstrated, while the effect of on blood flow has only been sparsely studied. We employ mesoscopic hydrodynamic simulations to perform a systematic investigation of flow properties of RBC suspensions with different cytosol viscosities for various flow conditions in cylindrical microchannels. Our main aim is to link macroscopic flow properties such as flow resistance to single cell deformation and dynamics as a function of . Starting from a dispersed cell configuration, we find that the flow convergence and the development of a RBC-free layer (RBC-FL) depend only weakly on , and require a convergence length in the range of , where is the channel diameter. The flow resistance for is nearly the same as that for , which is facilitated by a slightly larger RBC-FL thickness for . This effect is due to the suppression of membrane motion and dynamic shape deformations by a more viscous cytosol for , resulting in a more compact cellular core of the flow in comparison to . The weak effect of cytosol viscosity on the flow resistance and RBC-FL explains why cells can have a high concentration of hemoglobin for efficient oxygen delivery, without a pronounced increase in the flow resistance.
I Introduction
Blood is a multi-component suspension which consists of plasma () and cells (red blood cells , white blood cells and platelets ). Flow properties of blood are mainly governed by red blood cells (RBCs) Popel and Johnson (2005); Freund (2014); Fedosov et al. (2014a); Secomb (2017), which play an important role in many physiological processes. For instance, RBCs are responsible for oxygen delivery and mediate margination (or migration) of platelets Zhao and Shaqfeh (2011); Vahidkhah et al. (2014); Mehrabadi et al. (2016) and leukocytes Freund (2007); Fedosov et al. (2012); Fedosov and Gompper (2014) toward vessel walls, thus affecting the hemostatic process and immune response. Blood-flow properties are also crucial in many applications, such as the enrichment or separation of rare circulating tumor cells from blood Fachin et al. (2017); Lin et al. (2018) and the effectiveness of drug carriers for delivery to the targeted sites Lee et al. (2013); Müller et al. (2014); Cooley et al. (2018).
Suspensions of blood cells reveal complex flow properties Secomb (2017); Pries et al. (1990) and rheology Skalak et al. (1981); Lanotte et al. (2016). Two representative examples of the flow behavior of RBC suspension in microvessels or glass capillaries are the Fahraeus Fåhraeus (1929) and Fahraeus-Lindqvist Fåhraeus and Lindqvist (1931); Pries et al. (1992) effects. The former effect concerns RBC volumetric flux (or the so-called discharge hematocrit ), which appears to be larger than the tube (bulk) hematocrit in vessels with a diameter in the range of . The latter effect describes a minimum of blood-flow resistance in a tube with a diameter , such that the resistance to flow increases for both smaller and larger vessel diameters. The main mechanism governing these phenomena is the formation of a RBC depleted region next to the wall, called RBC-free layer (RBC-FL), as the suspension flows Cokelet and Goldsmith (1991); Goldsmith et al. (1989). The thickness of RBC-FL is directly associated with blood flow resistance Reinke et al. (1987); Sharan and Popel (2001); Fedosov et al. (2010a); Lei et al. (2013) and plays a crucial role in the adhesion of leukocytes, platelets, and drug-delivery carriers to vessel walls Vahidkhah et al. (2014); Cooley et al. (2018).
The thickness of RBC-FL is governed by a competition between the hydrodynamic lift force acting on RBCs in the direction away from the wall and cell-cell interactions which disperse them and drive them toward the wall Secomb (2017); Katanov et al. (2015); Geislinger and Franke (2014). Particle migration in the Stokes flow regime (i.e., no inertia) relies on breaking the time-reversal symmetry, which is achieved through RBC dynamics and/or deformations. For instance, a tumbling rigid spheroidal particle does not experience any migration on average in the presence of a wall Pozrikidis (2005), but a stable tank-treading motion of a spheroidally shaped membrane leads to the migration away from the wall Olla (1997a); Grandchamp et al. (2013). As shown by theoretical analysis Olla (1997a, b), experiments Grandchamp et al. (2013); Abkarian et al. (2002) and simulations Messlinger et al. (2009), the migration velocity is proportional to , where is a function of the ratio of internal and external fluid viscosities, is the local shear rate, is the characteristic particle size, is the distance away from the wall, and is an exponent whose value is often reported to be close to two. Time reversibility of RBC motion is generally broken by cell orientation and deformation in flow Geislinger and Franke (2014); Messlinger et al. (2009); Chen (2014).
The lift force is counterbalanced by RBC dispersion due to cell-cell hydrodynamic interactions in flow Secomb (2017); Katanov et al. (2015); Kumar and Graham (2012). It is intuitive that fluid flow can significantly enhance such interactions or collisions between particles, which are often referred to as shear-induced dispersion forces and depend on local shear rate, particle size, deformation, and dynamics Grandchamp et al. (2013); Katanov et al. (2015); Vollebregt et al. (2012). The response of RBCs to fluid stresses is known to be sensitive to the viscosity ratio between internal and external fluids Lanotte et al. (2016); Mauer et al. (2018); Sinha and Graham (2015); Yazdani and Bagchi (2013). For example, at low viscosity contrasts , RBCs tumble at low shear rates and tank-tread at high shear rates Fischer (2004); Skotheim and Secomb (2007); Abkarian et al. (2007), while for , the tank-treading motion is suppressed and replaced by dynamic multi-lobed shapes Lanotte et al. (2016); Mauer et al. (2018). These differences in RBC deformation and dynamics as a function of are expected to affect the lift force, cell-cell interactions in blood flow, and local structure of RBC suspensions, which influence blood-flow resistance.
The main focus of our investigation is the effect of on the behavior of RBC suspensions in microvessels and the dependence of RBC-FL thickness and flow resistance on the viscosity contrast. Even though recognized, the importance of for blood flow is not well studied so far. Katanov et al. Katanov et al. (2015) have investigated the formation of RBC-FL and flow convergence to steady state for , starting from an initially dispersed configuration of RBCs, and found that the full flow convergence requires a length of about ( is the tube diameter), which is nearly independent of flow rate, RBC hematocrit, and channel size for . A recent numerical investigation of blood flow in a tube with a diameter of de Haan et al. (2018) has predicted a comparable RBC-FL thickness and flow resistance for suspensions with and , where the differences become more pronounced at high flow rates. Another simulation study of blood flow in a slit Saadat et al. (2019) has suggested a domination of the lift force on RBCs over cell-cell interactions for , such that a slightly smaller RBC-FL was found for suspension in comparison to . To clarify the importance of for the behavior of RBC suspensions, we have performed a systematic investigation using mesoscopic hydrodynamic simulations, which include suspensions with as well as rigidified RBCs, several different flow rates, hematocrits, and tube diameters. In particular, we investigate the development of RBC-FL for the various conditions, and connect it to the flow resistance, deformation and dynamics of single RBCs. Our results show that the RBC-FL develops faster for in comparison with due to a larger lift force on RBCs with . The flow-convergence length becomes larger for elevated values, but remains within approximately . The RBC-FL thickness for is slightly larger than that for , resulting in a nearly negligible effect of on the flow resistance. This property is due to a smaller dispersion of cells for in comparison to , since a larger internal viscosity dampens shape changes and membrane dynamics of RBCs. Suspensions with stiffened RBCs, which approximate the case of , exhibit the smallest RBC-FL and the largest flow resistance. The robustness of flow resistance with respect to permits RBCs to contain a cytosol with a high concentration of hemoglobin, which maximizes oxygen delivery and does not strongly affect flow resistance.
The paper is organized as follows. Simulation methods, models, and setup are introduced in Section II. Section III presents simulation results, where the behavior of RBC suspensions with is investigated. The analysis of single cell characteristics is performed in Sections III.2 and III.3, in order to explain differences in RBC-FL for various . Finally, the dependence of RBC-FL thickness on several parameters, including flow rate, tube hematocrit and diameter, is investigated in Section III.4. Our main results are discussed and summarized in Section IV.
II Methods and models
Fluid flow is modeled by the smoothed dissipative particle dynamics (SDPD) method Español and Revenga (2003) with angular momentum conservation Müller et al. (2015), which is a mesoscopic particle-based hydrodynamics approach. The conservation of angular momentum is crucial for the proper representation of cellular motion when distinct fluid viscosities inside and outside the cell are employed Müller et al. (2015). RBCs are represented by a spring-network model Noguchi and Gompper (2005); Fedosov et al. (2010b, c), and coupled to fluid flow through dissipative forces. Below, we briefly review several model ingredients with an emphasis on the implementation of the viscosity contrast between internal and external fluids separated by the membrane. More details about the methods and models can be found in Refs. Müller et al. (2015); Fedosov et al. (2014b); Katanov et al. (2015).
II.1 RBC membrane model
The RBC membrane is represented by a spring-network model Noguchi and Gompper (2005); Fedosov et al. (2010b, c) with vertices distributed at a biconcave cell shape. Potential energy of the membrane,
| (1) |
consists of several contributions. corresponds to the spring’s energy, which mimics elasticity of the spectrin network attached to the back side of the lipid membrane. is the bending energy, representing bending resistance of the lipid bilayer. and impose area and volume conservation constraints, which mimic area incompressibility of the lipid bilayer and incompressibility of a cytosol, respectively. The biconcave shape of a RBC at rest is imposed by setting the reduced volume , where is the RBC volume and , with being the area of a RBC. The RBC membrane is characterized by the shear modulus and bending rigidity , which are implemented through in-plane elastic forces from the modeled springs and out-of-plane bending forces acting on each pair of adjacent triangles, respectively. The membrane parameters are set to mimic average properties of a healthy RBC with and . The effective size of a RBC is , the surface area is , and the total volume is . The stress-free shape of a RBC elastic network is assumed to be an oblate spheroid with a reduced volume of 0.96.
II.2 Fluid-membrane interactions
To model the viscosity ratio , internal and external fluids have to be separated by the membrane. An impenetrable membrane is implemented through bounce-back boundary conditions (BCs) for both internal and external fluid particles at every triangular face of the membrane. Thus, internal fluid particles are subject to bounced-back BCs from inside the cell, while external fluid particles are bounced back from the outer membrane surface. Different fluid viscosities are implemented through different friction coefficients of dissipative forces in the SDPD method. Dissipative interactions between internal and external fluids assume the average of the two friction coefficients.
The frictional (dissipative) coupling between fluid and membrane particles is implemented through a dissipative force Fedosov et al. (2010c),
| (2) |
similar to that in the dissipated particle dynamics method Hoogerbrugge and Koelman (1992); Español and Warren (1995), where is the friction coefficient, is an exponent of the weight function, is the cutoff radius, is the velocity difference, and . The value of is computed as Fedosov et al. (2010c),
| (3) |
where is the fluid viscosity, is the fluid density, and represents a half sphere of radius in the positive z direction. This estimation of the friction coefficient assumes a linear flow-velocity profile within a distance near the membrane surface, so that the local shear rate cancels out. The cutoff for fluid-membrane coupling is set to .
To prevent an overlap of two membranes, a short-ranged repulsive Weeks-Chandler-Anderson (WCA) potential is applied between pairs of membrane particles belonging to different cells within the cutoff distance . Note that the thickness of RBC-FL is slightly sensitive to the choice of , which depends on membrane resolution. For , the average spring length at rest is approximately and is set to to prevent overlap. Doubling the membrane resolution allows a slight decrease of , which may result in a slight change of the RBC-FL thickness. Nevertheless, is large enough to properly represent membrane deformation and nearly eliminate the effect of the cutoff distance on blood flow properties.
II.3 Simulation setup
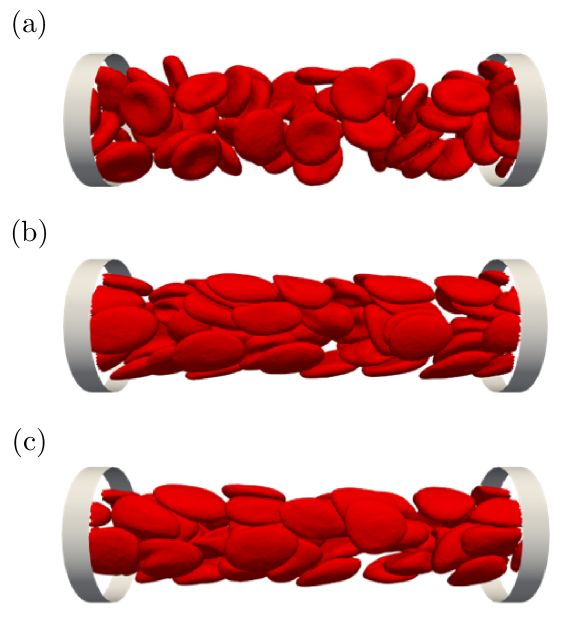
The computational domain is a periodic cylindrical tube with a diameter and a length (), which is long enough to avoid finite-size effects. Initially, RBCs are introduced into the computational domain with an ordered structure. Their number is determined by hematocrit (the volume fraction of RBCs in a tube), which is assumed to be in most simulations. Then, fluid particles are randomly placed with a uniform distribution into the computational domain. The number density of fluid particles is , the smoothing length for SDPD pair interactions is , resulting in about particles within the interaction range . The SDPD fluid particles inside the cells are set to represent the internal fluid with viscosity , while particles outside the cells correspond to the external fluid with viscosity . To relax the initially ordered structure of RBCs, the cellular suspension is mixed by applying a flow within the tube, which is driven by a force exerted on all fluid particles. When the cells are well mixed, the flow is stopped, and the RBCs are let to diffuse and fill up the whole tube, resulting in a dispersed RBC configuration illustrated in Fig. 1(a). After the dispersed cell configuration is reached, a constant force applied on all fluid particles in the x direction is turned on again to drive the fluid flow. Note that this driving force represents a uniform pressure gradient , where is the pressure drop over the length . The generated flow leads to RBC migration away from the wall and the formation of a denser cellular region near the tube center, as shown in Figs. 1(b) and 1(c) for two different values.
The flow strength is characterized by the dimensionless capillary number
| (4) |
which represents the ratio between fluid stresses and elastic membrane stresses. Here, is the average shear rate with the average velocity for a Newtonian fluid with viscosity driven by the same pressure gradient. Thus, the capillary number directly characterizes the applied driving force or the pressure gradient. Note that represents a characteristic relaxation time of a RBC, which is equal to approximately for and blood-plasma viscosity . Simulations are performed at low enough Reynolds numbers, such that the largest investigated flow rate corresponds to ( is the fluid density). Furthermore, the Mach number with the speed of sound is less than in all simulations, so that the fluid flow can be considered incompressible.
Solid wall BCs are modeled by a layer of immobile SDPD particles with a width . The structure and density of the wall layer are identical to those of equilibrated SDPD fluid in a periodic box. The pair forces between fluid and wall particles are the same as those for fluid-fluid interactions. Furthermore, an adaptive shear force is added to fluid particles within a near-wall layer of thickness to fully ensure no slip conditions Fedosov and Karniadakis (2009). To prevent wall penetration, both fluid and membrane particles are reflected back inside the tube domain.
III Results
III.1 Development of the flow and RBC-FL
To examine flow development for various viscosity contrasts , the viscosity of internal fluid is varied. This range of covers RBC physiological conditions as well as some diseased states. After the pressure gradient is applied, the flow develops and reaches a terminal velocity profile with a position-averaged velocity at long times. Note that the velocity of individual cells depends on their location within the tube and can fluctuate in time even after the average flow velocity has reached steady state. is inversely proportional to the flow resistance, and can be used to obtain the relative suspension viscosity , which compares the volumetric flow rate of RBC suspension with that of external fluid (without RBCs) for the same pressure gradient. Thus, quantifies an increase in the flow resistance due to the presence of RBCs. The dependence of on for is shown in Table 1. Interestingly, the relative viscosity increases only by about when is increased times. Furthermore, Table 1 also shows for a suspension of stiffened cells (SC), whose shear modulus is times larger than that of healthy RBCs. Stiffened RBCs do not exhibit significant deformation in fluid flow and represent a limit of very large viscosity contrast.
| Viscosity contrast () | 1 | 5 | 10 | 20 | SC |
|---|---|---|---|---|---|
| 1.27 | 1.30 | 1.33 | 1.37 | 1.70 | |
| 2.77 | 3.12 | 3.05 | 3.14 | 2.09 |
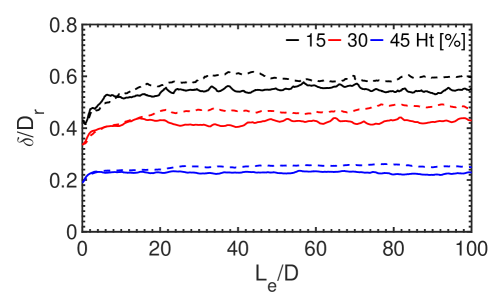
As the flow develops, RBCs migrate toward the tube center, resulting in the formation of RBC-FL near the wall whose thickness is directly associated with the flow resistance. To measure the thickness of RBC-FL, RBC suspension at a fixed time is projected onto the y-z plane Fedosov et al. (2010a), which is similar to taking a snapshot from experimental movie Kim et al. (2007). Then, distances between the tube wall and projected RBC-core edge are extracted at several positions along the tube. Averaging these distances yields an average thickness of the RBC-FL . To improve RBC-FL statistics, we also employ flow axisymmetry, such that the thickness is sampled for different angles by rotating a simulated configuration before the projection onto the y-z plane is performed. Furthermore, the RBC-FL data are accumulated over a certain time window, which is chosen long enough to avoid large deviations in RBC-FL thickness measurements and short enough to resolve the dynamics of RBC-FL development. This time window corresponds to about , within which RBCs move on average .
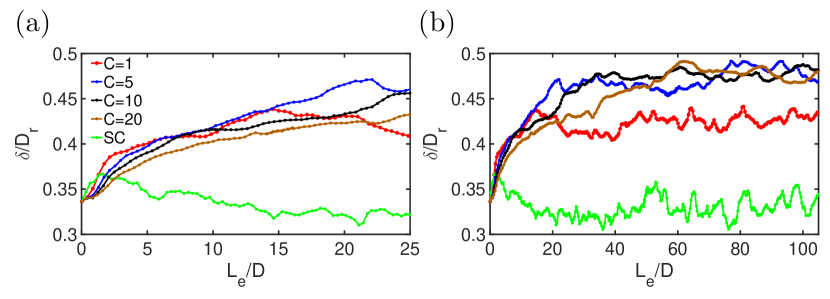
The RBC-FL thickness for the initial configuration without flow (Fig. 1(a)) is . This non-zero RBC-FL thickness is due to finite , the biconcave RBC geometry, which affects cell close-packing, and entropic repulsion from the wall that originates from the rotational diffusion of RBCs. Figure 2 shows the development of RBC-FL as a function of the average flow-convergence length . At short times ( ), increases faster for the suspension with than for those with , see Fig. 2(a). However, the RBC-FL thickness for suspension saturates at a smaller value than for with a difference of about , as shown in Fig. 2(b). As increases from to , the converged RBC-FL thickness shows a similar plateau value of . Converged or final RBC-FL thicknesses for different values are given in Table 1. For the SC suspension with stiffened RBCs, fluctuates within the range of , which is close to the RBC-FL thickness without flow. The differences in RBC-FL thicknesses for various values are due to cell deformation and dynamics in flow, which will be discussed later. The critical convergence length required for the development of RBC-FL is close to (i.e., here) for both and suspensions, which is consistent with the previous investigation for Katanov et al. (2015). Nevertheless, becomes longer with increasing , as is approximately for . The decrease of from its initial thickness for the SC suspension makes it difficult to define due to a weak migration strength in this case. The development and dependence of RBC-FL thickness on is determined by the migration and interactions between RBCs as cellular core forms.
III.2 Structure and mobility of the flowing RBC suspension
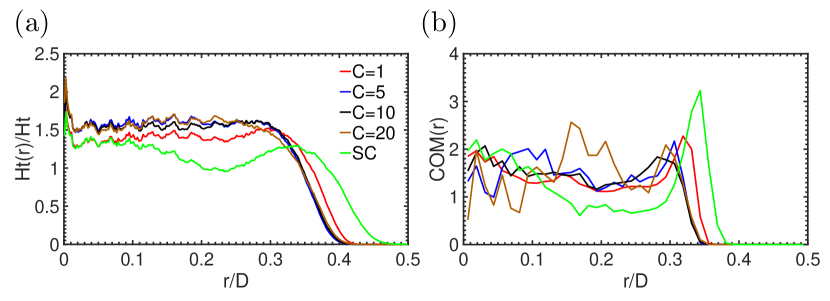
To better understand the dependence of final RBC-FL thickness on the viscosity contrast, it is instructive to take a look at the structural properties of RBC suspensions after the flow has fully developed. The distribution of RBCs within the tube can be characterized by local hematocrit obtained from simulations through spatial averaging of the density of fluid particles inside RBC membranes. Figure 3(a) shows the normalized local hematocrit within the tube for various viscosity contrasts. All distributions contain a depletion zone near the wall, whose thickness is directly associated with . For instance, the difference in can clearly be seen for , and SC suspensions. Inside the RBC-rich region, is nearly uniform with a small peak near the center, which is typical for small tube diameters Lei et al. (2013). For , the distributions are nearly independent of the viscosity contrast.
Radial cell density can also be characterized by the distribution of RBC centers of mass denoted as and shown in Fig. 3(b). distributions have a peak near the RBC-FL. As the tube center is approached, first decreases and then slightly increases for both and suspensions. As is increased, spatial inhomogeneity in distribution becomes stronger. This is related to the RBC dynamics in flow and a decrease in radial migration of RBCs with increasing , which will be discussed later. The SC suspension shows the strongest variations in , which is consistent with the distribution in Fig. 3(a).
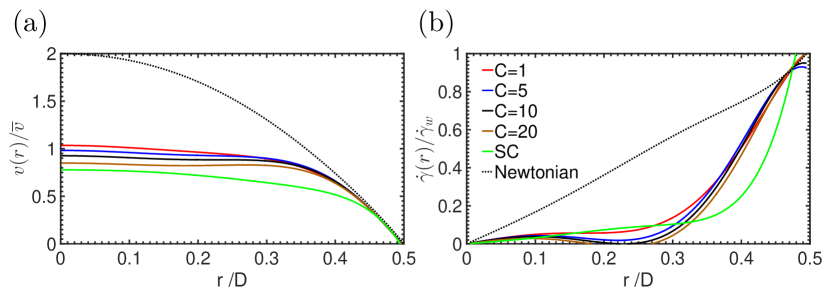
Figure 4(a) presents flow velocity profiles normalized by the average velocity for different RBC suspensions and blood plasma (i.e., for a Newtonian fluid). All velocity profiles for RBC suspensions are flattened at the tube center due to the presence of the cellular core. The velocity profiles do not exhibit large differences for various values and overlap with the Newtonian-fluid case only in the RBC-FL. An increase of results in slight flattening of near the tube center. Figure 4(b) shows radial profiles of local shear rates normalized by the wall shear rate , which are computed from the velocity profiles in Fig. 4(a). Inside the cellular core, for all RBC suspensions is close to zero (i.e., plug flow) and much less than that for the Newtonian case. Within the RBC-FL, quickly increases from nearly zero to the wall shear rate. The SC suspension exhibits a steeper increase in within the RBC-FL in comparison to soft-RBC suspensions.
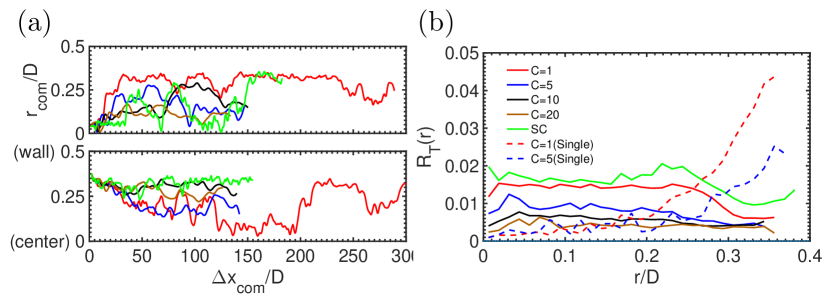
Even though fully developed velocity profiles are stable, RBCs within the cellular core are mobile, as can be seen from the trajectories of selected individual cells in Fig. 5(a). Thus, cells can migrate between different fluid layers laterally, even after the RBC-FL has fully developed (). To characterize the lateral mobility of RBCs, we define a dimensionless lateral mobility coefficient , where the absolute value of the cell velocity in radial direction, , is normalized by its translational velocity along the x direction, (here ). is shown in Fig. 5(b) and can be interpreted as a measure of cell-cell collisions. remains nearly constant within the cellular core and decreases slightly near the RBC-FL. Interestingly, or fluctuations in lateral cell motion become smaller as increases. Nevertheless, a large enough increase in should eventually lead to an increase in , as for the SC suspension, where values are slightly larger than those for . For comparison, we have also performed simulations of a single RBC migrating from the wall to the tube center for and (the dashed lines in Fig. 5(b)). For a single cell, lateral migration due to the hydrodynamic lift force near the wall is much faster than that in a suspension, because cell-cell collisions are not present. However, in the tube center, cell-cell interactions within RBC suspensions enhance lateral migration of cells in comparison to the case of a single RBC.
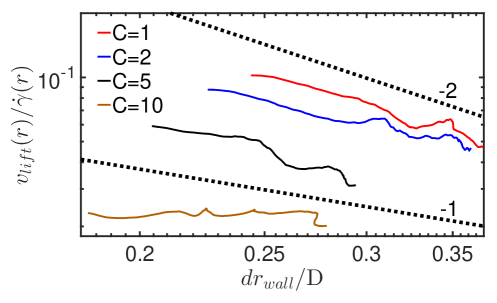
Note that of a single RBC for in Fig. 5(b) is larger than for , indicating a stronger lateral migration. Figure 6 presents the lift velocity of a single migrating RBC normalized by local shear rate for . Clearly, the RBC with migrates faster than that with . This result is consistent with previous simulation studies Messlinger et al. (2009); Narsimhan et al. (2013), where the lift velocity on single RBCs in pure shear flow has been found to decrease with increasing . The ratio is expected to be proportional to , where is the distance from the wall to the cell’s COM. We find that for , and for , in agreement with experimental measurements Grandchamp et al. (2013); Abkarian and Viallat (2005); Abkarian et al. (2002). For the RBC with , is nearly zero. Note that these simulations are performed in a tube with diameter (), representing a rather strong confinement with varying local shear rates. Furthermore, initial cell migration might be affected by the flow development, as we start from no-flow conditions.
The faster migration velocity of RBCs for in comparison with is due to differences in cell dynamics for different . At high enough shear rates (e.g., near the wall), RBCs generally exhibit a tank-treading-like motion with a preferred alignment in flow for , while a tumbling-like dynamics with multi-lobed shapes is found for Lanotte et al. (2016); Mauer et al. (2018). The tank-treading dynamics of RBC membrane near a wall leads to a larger lift force than for the tumbling dynamics Pozrikidis (2005); Olla (1997a). Note that the slower migration velocity of RBCs for in comparison to is consistent with a slower development of the RBC-FL for in Fig. 2(a).
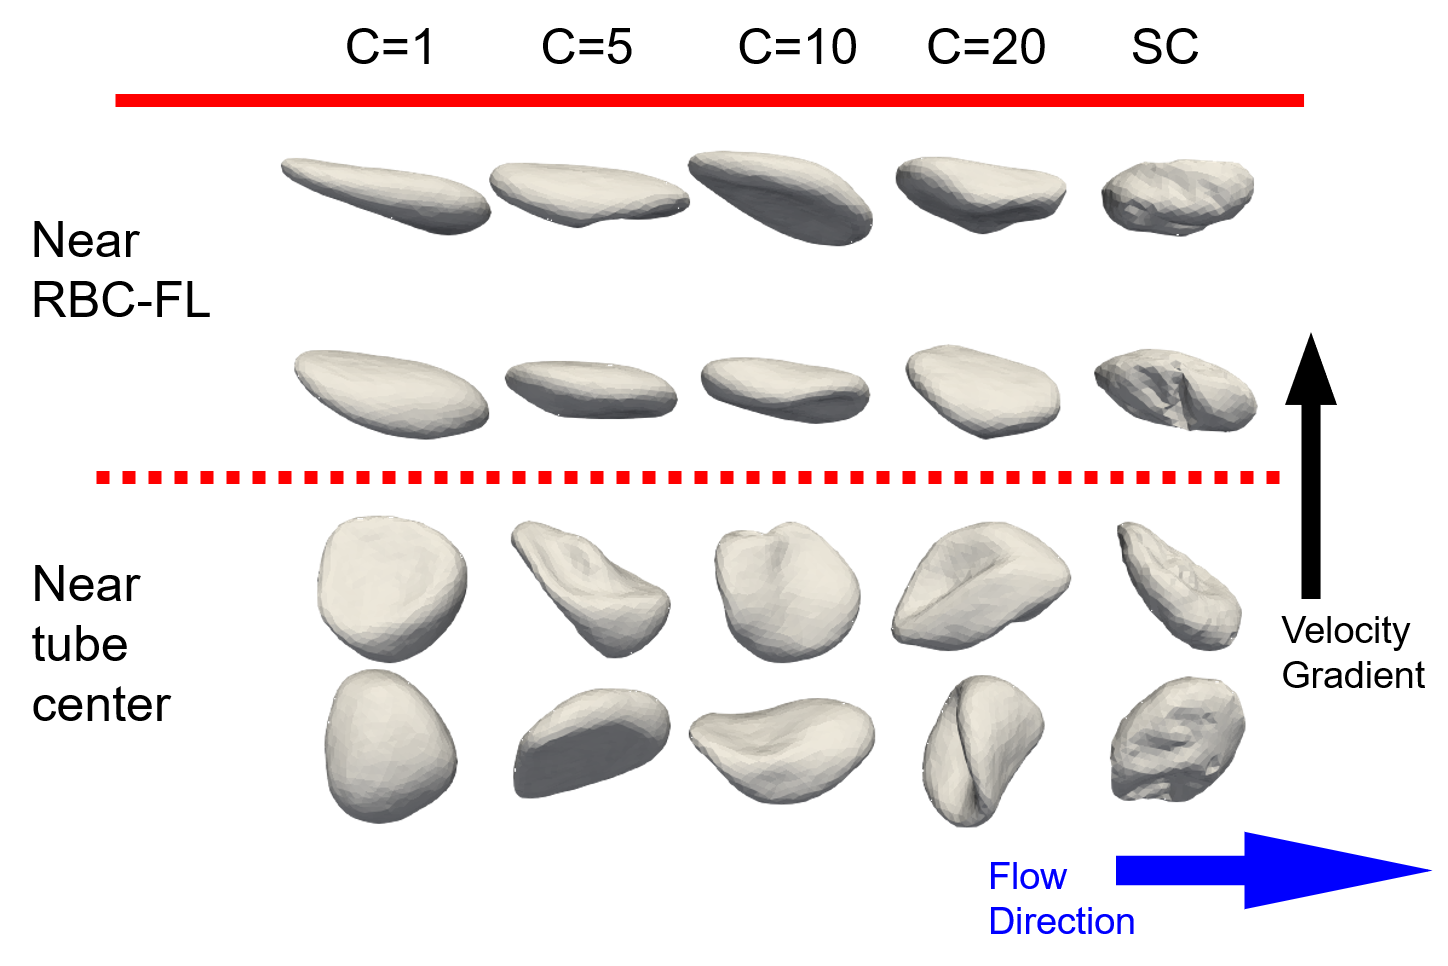
III.3 Shape and dynamics of single cells inside the RBC core
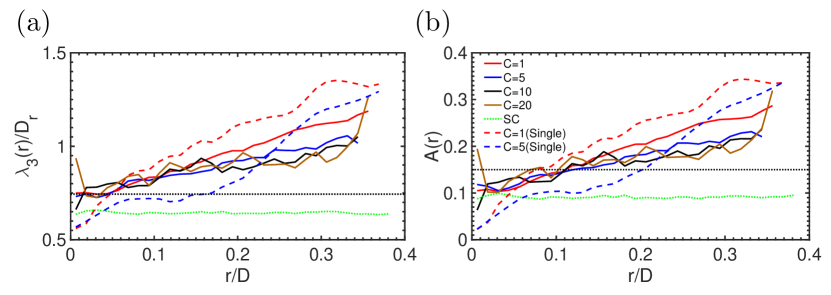
RBC dynamics inside the cellular core involves frequent changes in the shape, orientation, and membrane tank-treading motion, which often cannot be decoupled completely. Figure 7 shows several representative snapshots of RBCs near the RBC-FL and in the tube center. To better understand the behavior of single RBCs within the cellular core, we look at several cell characteristics. Shape changes of RBCs are quantified by the asphericity , where is the gyration radius squared and are the eigenvalues of the gyration tensor. For a biconcave RBC shape at rest, , while corresponds to a sphere and to a long thin rod. For example, the largest eigenvalue can be interpreted as the extension of a RBC in the flow direction ( for a RBC at rest).
Figure 8(a) shows that RBCs are significantly stretched in most locations within the cellular core region, except near the tube center. Close to the center, different shapes with are generally observed (Fig. 8(b)), whose representative snapshots are shown in Fig. 7. Both and in Fig. 8 increase nearly linearly from the tube center to the RBC-FL. At the edge of the cellular core, elongated slipper shapes prevail, as shown in Fig. 7. SC cells show a crumpled configuration, which is due to not only fluid-flow stresses, but also residual elastic stresses within the membrane, since the RBC stress-free shape corresponds to an oblate spheroid with a reduced volume of 0.96 and the SC cells have a high shear modulus. Therefore, stiffened cells even without flow show some degree of membrane roughness in comparison with the smooth surface of soft RBCs. Nevertheless, the overall rest shape of SC cells remains biconcave. The shape characteristics of SC cells in Fig. 8 are nearly independent of the radial position within the tube, indicating that cell deformation can nearly be neglected. As increases from to , decreases and its slope reduces as well, indicating that RBCs at are stretched less than those at . Suspensions with show similar shapes as those for . In comparison to RBCs in a suspension, single cells in tube flow have a larger (smaller) elongation than for ().
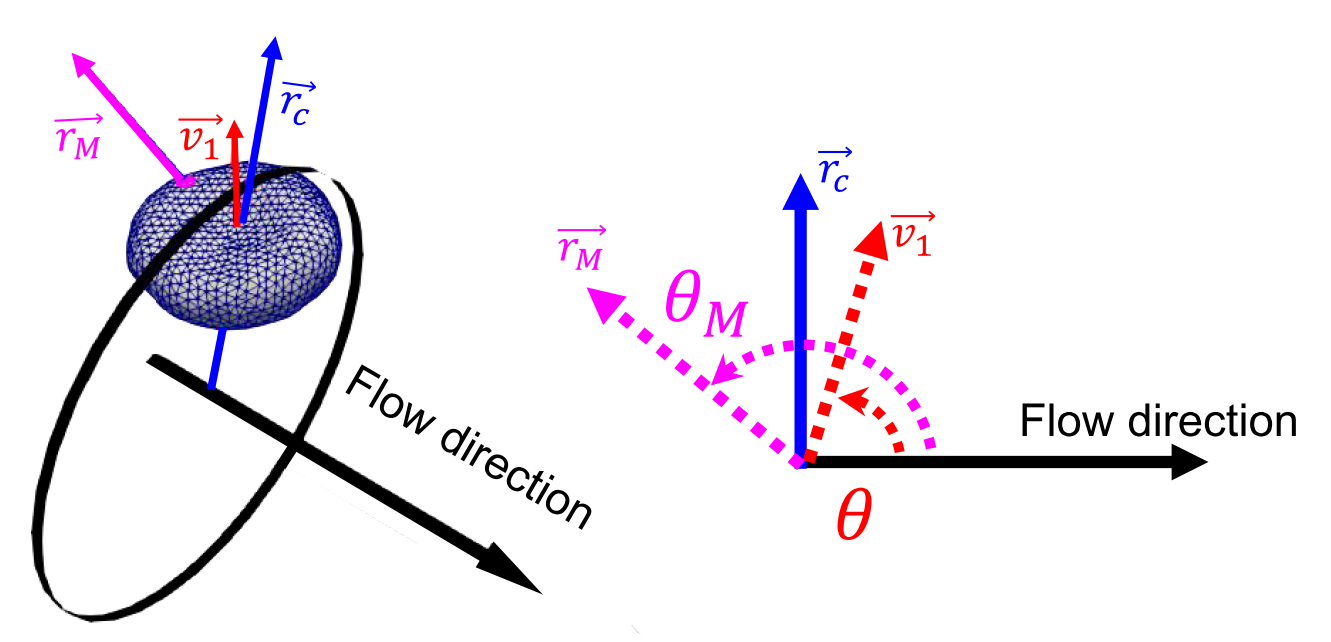
In addition to deformation in flow, cell orientation changes and membrane exhibits a tank-treading motion. To quantify RBC orientation with a varying shape, we include in the analysis only the shapes with an asphericity larger than that of a biconcave shape at rest (), where a well-defined axis from the eigenvector corresponding to can always be obtained. often does not lie within the flow-velocity gradient plane, due to cell-cell interactions and complex cell relaxation under fluid stresses. To simplify the quantification of cell dynamics, we define an inclination angle (marked in red in Fig. 9) as the angle between the vector and the flow direction within the flow-velocity gradient plane (i.e. within plane, where is the vector from the tube central axis to the cell’s center of mass). Figure 10(a) shows as a function of cell position in the flow direction for one selected cell from each suspension. may frequently exhibit discontinuous jumps of 180 degrees due to the symmetric disk-like rest shape, so that even small deformations can cause a reversal of the vector. Despite these jumps, RBC tumbling in the SC suspension can clearly be identified from the green trajectories in Fig. 10(a). Tumbling motion is infrequent for soft-RBC suspensions, where jumps between and are found instead and the departure of from these two values is generally within degrees. Rare tumbling of RBCs for suspension can be seen by the brown line in Fig. 10(a), but the tumbling period is extremely long (). Thus, cell-cell interactions in a crowded environment strongly hinder solid-like tumbling motion and RBCs are forced to relax fluid stresses via shape deformation instead.
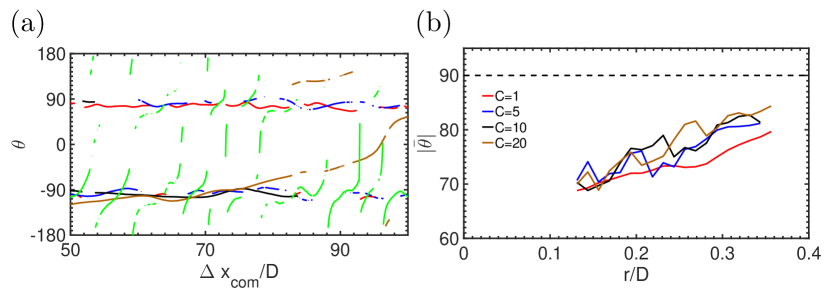
The average orientation angle of RBCs as a function of radial position can be tracked through the absolute value of , as shown in Fig. 10(b). Near the RBC-FL, the average angle approaches , so that RBCs are aligned along the flow direction. decreases toward the tube center, and near the center the orientation angle is often not well defined as RBCs attain shapes with . The average angle for is slightly larger than for , indicating that RBCs are more aligned with the flow for large values, which can also be seen in Fig. 7.
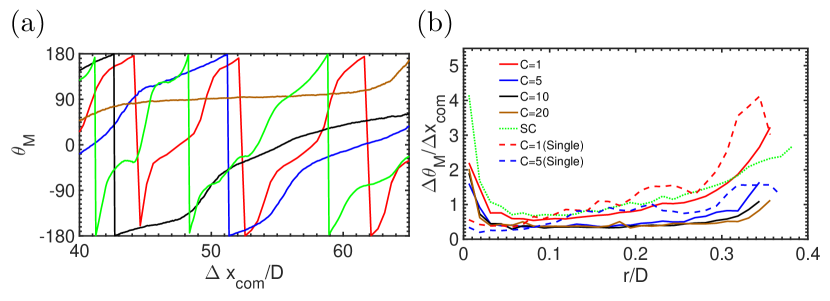
Strong dynamic changes in RBC shape significantly complicate cell orientation analysis and do not always allow decoupling between tumbling motion with shape rotation and tank-treading motion with membrane circulation. To analyze relative membrane motion, we monitor the material angle defined as the angle between the material vector and the flow direction, see Fig. 9. Note that we cannot fully distinguish between tank-treading and tumbling motion by using . Changes in for a selected RBC are shown in Fig. 11(a) for various viscosity contrasts. exhibits a nearly monotonic increase with increasing . For , a smooth dependence of is observed, indicating continuous tank-treading motion of the membrane. For , an increase in is slower than for , and membrane rotation shows short frequent pauses followed by periods of rapid increase.
Membrane motion can be quantified further by an average change in as RBCs flow, which is defined as the ratio between the change in and the corresponding change in calculated for a fixed time interval . Figure 11(b) presents , where the rotation tendency is most prominent near the RBC-FL and decreases toward the tube center. A slight enhancement of can be observed near the tube center. Large values suppress membrane rotation, since a large difference in is observed between and suspensions. The dependence of is similar for all suspensions. In comparison to a single cell dynamics in tube flow, the membrane rotation for cell suspensions is suppressed by the surrounding cells.
| 0.61 | 0.31 | 0.14 | 0.06 | |
|---|---|---|---|---|
| 1.27 | 1.33 | 1.46 | 1.79 | |
| 1.30 | 1.41 | 1.53 | 1.86 | |
| / -1 | 2.15% | 6.25% | 4.61% | 3.50% |
| 2.77 | 2.79 | 2.66 | 2.42 | |
| 3.12 | 2.90 | 2.72 | 2.50 |
III.4 Dependence of the RBC-FL thickness on other flow parameters
To study the dependence of RBC-FL thickness on other flow parameters, we compare suspensions with and for different flow conditions (), hematocrits , and tube diameters . Table 2 presents relative viscosity and final RBC-FL thickness for various , where increases as decreases. Furthermore, for suspension is only slightly larger than for suspension and the difference is most prominent at intermediate flow rates. The converged RBC-FL thickness decreases as the flow slows down. The suspension has a smaller RBC-FL thickness than the suspension with a difference of about at and about at .
| 15% | 30% | 45% | |
|---|---|---|---|
| 1.13 | 1.27 | 1.72 | |
| 1.16 | 1.30 | 1.87 | |
| / -1 | 2.59% | 2.15% | 9.09% |
| 1.45 | 2.77 | 3.65 | |
| 1.65 | 3.12 | 3.88 |
Table 3 shows that increases as increases. The difference in caused by is most prominent for dense suspensions. The development of RBC-FL for different values is shown in Fig. 12, where decreases for increasing , consistently with the increase of . is nearly the same for and suspensions. The difference between and for and remains similar for hematocrits , , and .
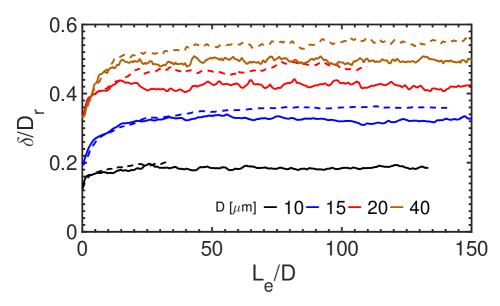
Simulations of flowing RBC suspensions at for different tube diameters with a constant show that decreases as decreases (see Table 4), which is consistent with experiments Fåhraeus and Lindqvist (1931). The difference in for the two values is most prominent for the large diameter . Consistently, increases as increases, as shown in Fig. 13. This trend may depend on , which affects dynamics of RBCs near the RBC-FL. The difference between and suspensions is similar for and , but nearly disappears for .
| [] | 40 | 20 | 15 | 10 |
|---|---|---|---|---|
| 1.39 | 1.27 | 1.25 | 1.12 | |
| 1.51 | 1.30 | 1.21 | 1.16 | |
| / -1 | 8.5% | 2.2% | -3.2% | 3.2% |
| 3.19 | 2.77 | 2.18 | 1.21 | |
| 3.53 | 3.12 | 2.34 | 1.20 |
IV Summary and discussion
The main focus of our study is the effect of the viscosity ratio on the behavior of RBC suspensions. Interestingly, has only a very weak effect on the resistance of converged flow, quantified by the relative viscosity . We have systematically analyzed the RBC-FL thickness, which is closely related to the flow resistance. When increases from to , the change in is within , while increases by about (or by approximately ). A further increase of from to leads to an increase of by about , while stays nearly unaffected. Thus, a larger viscosity of the RBC core for in comparison to is complemented by a larger RBC-FL thickness, such that the overall flow resistance remains nearly independent of .
The development of RBC-FL is governed by the two main mechanisms Katanov et al. (2015): (i) RBC migration away from the wall due to the hydrodynamic lift force and (ii) the dispersion of RBCs within the cellular core due to cell-cell interactions in flow. The migration of RBCs away from the wall can be attributed to their shape deformation and membrane dynamics. For instance, RBCs with migrate faster than those with , which is consistent with a slower development of the RBC-FL for in Fig. 2(a). This results from the fact that both shape deformation and membrane dynamics are suppressed as increases from to , since a larger internal viscosity dampens RBC shape changes and dynamics. The importance of cell deformability for migration and the formation of RBC-FL is further illustrated by the results for SC suspension. Stiffened RBCs exhibit tumbling dynamics, which leads to a weak lift force, small RBC-FL thickness, and a large flow resistance.
The dispersion of RBCs within the cellular core counterbalances the lift force and is governed by local shear rate, shape deformations, and membrane dynamics. Both shape deformations and membrane dynamics are attenuated for in comparison to . For example, the shape asphericity for is smaller than for , indicating that RBCs are less stretched. Furthermore, membrane dynamics for is slower than for , because membrane tank-treading is more pronounced for the low viscosity contrast. This leads to a weaker hydrodynamic repulsion between RBCs in the suspension, whose origin is similar to the lift force near a wall. To further confirm that the dispersion of RBCs is larger for than for , we have performed several simulations of the collision of two cells in tube flow. After subtracting the migration effect, we find that the collision of two RBCs leads to a larger change in lateral cell displacement for than for , indicating a stronger dispersion effect for . Even though cell collisions in dense suspensions involve more complex multicellular interactions, the lateral mobility coefficient in Fig. 5(b) is smaller for than for , which is consistent with the simulations of binary collisions. Therefore, the cellular core for remains more compactly packed than for , which is documented by a slightly thicker RBC-FL. The importance of RBC dynamics in flow is further emphasized by the behavior of stiffened RBCs. Hardened cells exhibit tumbling dynamics even in the cellular core, which results in their significant dispersion within the tube and a thin RBC-FL.
The dependence of the converged RBC-FL thickness on the flow rate is consistent with the discussion of cell deformation and dynamics above, such that a decrease in driving pressure gradient weakens cellular dynamics and the exerted lift force, resulting in a reduction of and an increase of flow resistance. Thus, the flow resistance is larger in the venular part of microvasculature, where blood-flow velocities are significantly smaller than those in the arteriolar part of the microvasculature. As expected, an increase in hematocrit leads to a decrease of due to increased cell crowding, accompanied also by a slightly attenuated RBC dynamics. Note that the difference in between and is more pronounced for than for smaller values. However, this difference can likely be neglected, because microvascular hematocrit values are generally smaller than . A decrease of tube diameter causes more pronounced cell-cell and cell-wall interactions, which result in a reduction of flow resistance, consistently with the Fahraeus-Lindqvist effect Fåhraeus and Lindqvist (1931); Pries et al. (1992). Note that the viscosity ratio has a more significant effect on flow resistance for large tube diameters ( ), where for can be larger by more than than for .
An interesting observation from our investigation is that the final RBC-FL thickness first increases with increasing and then decreases for stiffened RBCs (this can be approximated by ). As discussed above, the initial increase in for increasing is the main reason that the flow resistance is nearly unaffected by . In fact, this property of flowing blood allows the maximization of hemoglobin content in RBCs, and therefore oxygen delivery, without negative effects on the flow resistance. Furthermore, the effect of in this range on blood-flow convergence is rather weak, such that RBC-FL convergence is obtained after a distance of about . The flow-convergences distance can easily be compared with an average length of vessels ( ) within a branching network-like microvasculature Popel and Johnson (2005); Secomb (2017), e.g. for . This means that a converged flow within the microvasculature can only be expected in small vessels such as capillaries, while in microvessels with a diameter larger than about , blood flow would likely always correspond to a transient (non-converged) flow. Even though the dependence of on is nearly negligible, the structure and dynamics of RBC suspension are different for various values. These differences in flow behavior for different viscosity contrasts are likely to be important for the margination of particles (e.g., platelets, drug-delivery carriers) in blood flow as well as for partitioning of RBCs within a complex microvascular network. In particular, the slow flow convergence behind branching points implies that many flow properties, such as resistance, particle margination, and oxygen delivery, can be highly inhomogeneous in complex vessel networks, depending on vessel diameters, branching lengths, and distance from the previous branching point. These aspects of blood flow need still to be addressed in future research.
Acknowledgements
The authors gratefully acknowledge the computing time granted through JARA-HPC on the supercomputer JURECA Jülich Supercomputing Centre (2018) at Forschungszentrum Jülich.
References
- Popel and Johnson (2005) A. S. Popel and P. C. Johnson, “Microcirculation and hemorheology,” Annu. Rev. Fluid Mech. 37, 43–69 (2005).
- Freund (2014) J. B. Freund, “Numerical simulation of flowing blood cells,” Annu. Rev. Fluid Mech. 46, 67–95 (2014).
- Fedosov et al. (2014a) D. A. Fedosov, H. Noguchi, and G. Gompper, “Multiscale modeling of blood flow: from single cells to blood rheology,” Biomech. Model. Mechanobiol. 13, 239–258 (2014a).
- Secomb (2017) T. W. Secomb, “Blood flow in the microcirculation,” Annu. Rev. Fluid Mech. 49, 443–461 (2017).
- Zhao and Shaqfeh (2011) H. Zhao and E. S. G. Shaqfeh, “Shear-induced platelet margination in a microchannel,” Phys. Rev. E 83, 061924 (2011).
- Vahidkhah et al. (2014) K. Vahidkhah, S. L. Diamond, and P. Bagchi, “Platelet dynamics in three-dimensional simulation of whole blood,” Biophys. J. 106, 2529–2540 (2014).
- Mehrabadi et al. (2016) M. Mehrabadi, D. N. Ku, and C. K. Aidun, “Effects of shear rate, confinement, and particle parameters on margination in blood flow,” Phys. Rev. E 93, 023109 (2016).
- Freund (2007) J. B. Freund, “Leukocyte margination in a model microvessel,” Phys. Fluids 19, 023301 (2007).
- Fedosov et al. (2012) D. A. Fedosov, J. Fornleitner, and G. Gompper, “Margination of white blood cells in microcapillary flow,” Phys. Rev. Lett. 108, 028104 (2012).
- Fedosov and Gompper (2014) D. A. Fedosov and G. Gompper, “White blood cell margination in microcirculation,” Soft Matter 10, 2961–2970 (2014).
- Fachin et al. (2017) F. Fachin, P. Spuhler, J. M. Martel-Foley, J. F. Edd, T. A. Barber, J. Walsh, N. M. Karabacak, V. Pai, M. Yu, K. Smith, H. Hwang, J. Yang, S. Shah, R. Yarmush, L. V. Sequist, S. L. Stott, S. Maheswaran, D. A. Haber, R. Kapur, and M. Toner, “Monolithic chip for high-throughput blood cell depletion to sort rare circulating tumor cells,” Sci. Rep. 7, 10936 (2017).
- Lin et al. (2018) E. Lin, T. Cao, S. Nagrath, and M. R. King, “Circulating tumor cells: diagnostic and therapeutic applications,” Annu. Rev. Biomed. Eng. 20, 329–352 (2018).
- Lee et al. (2013) T.-R. Lee, M. Choi, A. M. Kopacz, S.-H. Yun, W. K. Liu, and P. Decuzzi, “On the near-wall accumulation of injectable particles in the microcirculation: smaller is not better,” Sci. Rep. 3, 2079 (2013).
- Müller et al. (2014) K. Müller, D. A. Fedosov, and G. Gompper, “Margination of micro- and nano-particles in blood flow and its effect on drug delivery,” Sci. Rep. 4, 4871 (2014).
- Cooley et al. (2018) M. Cooley, A. Sarode, M. Hoore, D. A. Fedosov, S. Mitragotri, and A. Sen Gupta, “Influence of particle size and shape on their margination and wall-adhesion: implications in drug delivery vehicle design across nano-to-micro scale,” Nanoscale 10, 15350–15364 (2018).
- Pries et al. (1990) A. R. Pries, T. W. Secomb, P. Gaehtgens, and J. F. Gross, “Blood flow in microvascular networks. Experiments and simulation,” Circ. Res. 67, 826–834 (1990).
- Skalak et al. (1981) R. Skalak, S. R. Keller, and T. W. Secomb, “Mechanics of blood flow,” J. Biomech. Eng. 103, 102–115 (1981).
- Lanotte et al. (2016) L. Lanotte, J. Mauer, S. Mendez, D. A. Fedosov, J.-M. Fromental, V. Claveria, F. Nicoud, G. Gompper, and M. Abkarian, “Red cells’ dynamic morphologies govern blood shear thinning under microcirculatory flow conditions,” Proc. Natl. Acad. Sci. USA 113, 13289–13294 (2016).
- Fåhraeus (1929) R. Fåhraeus, “The suspension stability of the blood,” Physiol. Rev. 9, 241–274 (1929).
- Fåhraeus and Lindqvist (1931) R. Fåhraeus and T. Lindqvist, “The viscosity of the blood in narrow capillary tubes,” Am. J. Phys. 96, 562–568 (1931).
- Pries et al. (1992) A. R. Pries, D. Neuhaus, and P. Gaehtgens, “Blood viscosity in tube flow: dependence on diameter and hematocrit,” Am. J. Physiol. 263, H1770–H1778 (1992).
- Cokelet and Goldsmith (1991) G. R. Cokelet and H. L. Goldsmith, “Decreased hydrodynamic resistance in the two-phase flow of blood through small vertical tubes at low flow rates,” Circ. Res. 68, 1–17 (1991).
- Goldsmith et al. (1989) H. L. Goldsmith, G. R. Cokelet, and P. Gaehtgens, “Robin Fahraeus: evolution of his concepts in cardiovascular physiology,” Am. J. Physiol. 257, H1005–H1015 (1989).
- Reinke et al. (1987) W. Reinke, P. Gaehtgens, and P. C. Johnson, “Blood viscosity in small tubes: effect of shear rate, aggregation, and sedimentation,” Am. J. Physiol. 253, H540–H547 (1987).
- Sharan and Popel (2001) M. Sharan and A. S. Popel, “A two-phase model for flow of blood in narrow tubes with increased effective viscosity near the wall,” Biorheology 38, 415–428 (2001).
- Fedosov et al. (2010a) D. A. Fedosov, B. Caswell, A. S. Popel, and G. E. Karniadakis, “Blood flow and cell-free layer in microvessels,” Microcirculation 17, 615–628 (2010a).
- Lei et al. (2013) H. Lei, D. A. Fedosov, B. Caswell, and G. E. Karniadakis, “Blood flow in small tubes: quantifying the transition to the non-continuum regime,” J. Fluid Mech. 722, 214–239 (2013).
- Katanov et al. (2015) D. Katanov, G. Gompper, and D. A. Fedosov, “Microvascular blood flow resistance: role of red blood cell migration and dispersion,” Microvasc. Res. 99, 57–66 (2015).
- Geislinger and Franke (2014) T. M. Geislinger and T. Franke, “Hydrodynamic lift of vesicles and red blood cells in flow — from fåhræus & lindqvist to microfluidic cell sorting,” Adv. Colloid Interface Sci. 208, 161–176 (2014).
- Pozrikidis (2005) C. Pozrikidis, “Orbiting motion of a freely suspended spheroid near a plane wall,” J. Fluid Mech. 541, 105–114 (2005).
- Olla (1997a) P. Olla, “The lift on a tank-treading ellipsoidal cell in a shear flow,” J. Phys. II (France) 7, 1533–1540 (1997a).
- Grandchamp et al. (2013) X. Grandchamp, G. Coupier, A. Srivastav, C. Minetti, and T. Podgorski, “Lift and down-gradient shear-induced diffusion in red blood cell suspensions,” Phys. Rev. Lett. 110, 108101 (2013).
- Olla (1997b) P. Olla, “The role of tank-treading motions in the transverse migration of a spheroidal vesicle in a shear flow,” J. Phys. A: Math. Gen. 30, 317–329 (1997b).
- Abkarian et al. (2002) M. Abkarian, C. Lartigue, and A. Viallat, “Tank treading and unbinding of deformable vesicles in shear flow: determination of the lift force,” Phys. Rev. Lett. 88, 068103 (2002).
- Messlinger et al. (2009) S. Messlinger, B. Schmidt, H. Noguchi, and G. Gompper, “Dynamical regimes and hydrodynamic lift of viscous vesicles under shear,” Phys. Rev. E 80, 011901 (2009).
- Chen (2014) Y.-L. Chen, “Inertia- and deformation-driven migration of a soft particle in confined shear and Poiseuille flow,” RSC Adv. 4, 17908–17916 (2014).
- Kumar and Graham (2012) A. Kumar and M. D. Graham, “Margination and segregation in confined flows of blood and other multicomponent suspensions,” Soft Matter 8, 10536–10548 (2012).
- Vollebregt et al. (2012) H. M. Vollebregt, R. G. M. van der Sman, and R. M. Boom, “Model for particle migration in bidisperse suspensions by use of effective temperature,” Faraday Discuss. 158, 89–103 (2012).
- Mauer et al. (2018) J. Mauer, S. Mendez, L. Lanotte, F. Nicoud, M. Abkarian, G. Gompper, and D. A. Fedosov, “Flow-induced transitions of red blood cell shapes under shear,” Phys. Rev. Lett. 121, 118103 (2018).
- Sinha and Graham (2015) K. Sinha and M. D. Graham, “Dynamics of a single red blood cell in simple shear flow,” Phys. Rev. E 92, 042710 (2015).
- Yazdani and Bagchi (2013) A. Yazdani and P. Bagchi, “Influence of membrane viscosity on capsule dynamics in shear flow,” J. Fluid Mech. 718, 569–595 (2013).
- Fischer (2004) T. M. Fischer, “Shape memory of human red blood cells,” Biophys. J. 86, 3304–3313 (2004).
- Skotheim and Secomb (2007) J. M. Skotheim and T. W. Secomb, “Red blood cells and other nonspherical capsules in shear flow: oscillatory dynamics and the tank-treading-to-tumbling transition,” Phys. Rev. Lett. 98, 078301 (2007).
- Abkarian et al. (2007) M. Abkarian, M. Faivre, and A. Viallat, “Swinging of red blood cells under shear flow,” Phys. Rev. Lett. 98, 188302 (2007).
- de Haan et al. (2018) M. de Haan, G. Zavodszky, V. Azizi, and A. G. Hoekstra, “Numerical investigation of the effects of red blood cell cytoplasmic viscosity contrasts on single cell and bulk transport behaviour,” Appl. Sci. 8, 1616 (2018).
- Saadat et al. (2019) A. Saadat, C. J. Guido, and E. S. G. Shaqfeh, “Effect of cytoplasmic viscosity on red blood cell migration in small arteriole-level confinements,” bioRxiv 10.1101/572933 (2019).
- Español and Revenga (2003) P. Español and M. Revenga, “Smoothed dissipative particle dynamics,” Phys. Rev. E 67, 026705 (2003).
- Müller et al. (2015) K. Müller, D. A. Fedosov, and G. Gompper, “Smoothed dissipative particle dynamics with angular momentum conservation,” J. Comp. Phys. 281, 301–315 (2015).
- Noguchi and Gompper (2005) H. Noguchi and G. Gompper, “Shape transitions of fluid vesicles and red blood cells in capillary flows,” Proc. Natl. Acad. Sci. USA 102, 14159–14164 (2005).
- Fedosov et al. (2010b) D. A. Fedosov, B. Caswell, and G. E. Karniadakis, “Systematic coarse-graining of spectrin-level red blood cell models,” Comput. Meth. Appl. Mech. Eng. 199, 1937–1948 (2010b).
- Fedosov et al. (2010c) D. A. Fedosov, B. Caswell, and G. E. Karniadakis, “A multiscale red blood cell model with accurate mechanics, rheology, and dynamics,” Biophys. J. 98, 2215–2225 (2010c).
- Fedosov et al. (2014b) D. A. Fedosov, M. Peltomäki, and G. Gompper, “Deformation and dynamics of red blood cells in flow through cylindrical microchannels,” Soft Matter 10, 4258–4267 (2014b).
- Hoogerbrugge and Koelman (1992) P. J. Hoogerbrugge and J. M. V. A. Koelman, “Simulating microscopic hydrodynamic phenomena with dissipative particle dynamics,” Europhys. Lett. 19, 155–160 (1992).
- Español and Warren (1995) P. Español and P. Warren, “Statistical mechanics of dissipative particle dynamics,” Europhys. Lett. 30, 191–196 (1995).
- Fedosov and Karniadakis (2009) D. A. Fedosov and G. E. Karniadakis, “Triple-decker: Interfacing atomistic-mesoscopic-continuum flow regimes,” J. Comp. Phys. 228, 1157–1171 (2009).
- Kim et al. (2007) S. Kim, R. L. Kong, A. S. Popel, M. Intaglietta, and P. C. Johnson, “Temporal and spatial variations of cell-free layer width in arterioles,” Am. J. Physiol. 293, H1526–H1535 (2007).
- Narsimhan et al. (2013) V. Narsimhan, H. Zhao, and E. S. G. Shaqfeh, “Coarse-grained theory to predict the concentration distribution of red blood cells in wall-bounded Couette flow at zero Reynolds number,” Phys. Fluids 25, 061901 (2013).
- Abkarian and Viallat (2005) M. Abkarian and A. Viallat, “Dynamics of vesicles in a wall-bounded shear flow,” Biophys. J. 89, 1055–1066 (2005).
- Jülich Supercomputing Centre (2018) Jülich Supercomputing Centre, “JURECA: Modular supercomputer at Jülich Supercomputing Centre,” J. Large-Scale Res. Facil. 4, A132 (2018).