Outflow from Outer-Arm Starburst in a Grazing Collision Between Galaxies
Abstract
Gemini NIFS K-band spectra and ALMA 12CO , HCO+, and 100 GHz continuum observations are used to study a bright starburst clump on an outer arm of the interacting galaxy NGC 2207. This clump emits 23% of the total 24 µm flux of the galaxy pair and has an optically-opaque dust cone extending out of its 170 pc core. The measured CO accounts for the dark cone extinction if almost all the gas and dust there is in front of the star clusters. An associated approaching CO outflow has km s-1, an estimated molecular mass , and rises to heights kpc. A receding CO outflow on the far side with km s-1 is less extensive. The observed star formation in the core over 10 Myr can supply the dark cone kinetic energy of roughly ergs via supernovae and stellar winds. Other signs of intense activity are variable radio continuum, suggesting an embedded supernova or other outburst, X-ray emission possibly from an X-ray binary or intermediate mass black hole, depending on the extinction, and Br and He I lines with 82 km s-1 linewidths and fluxes consistent with excitation by embedded O-type stars. According to previous models, the retrograde encounter suffered by NGC 2207 caused loss of angular momentum. This compressed its outer disk. We suggest that the resulting inward crashing stream hit a massive H I clump on the pre-existing spiral arm and triggered the observed starburst.
1 Introduction
The spiral galaxies IC 2163 (catalog ) and NGC 2207 (catalog ) are involved in a grazing encounter (Elmegreen et al., 1995a, b; Struck et al., 2005). A prominent starburst region called Feature i by Elmegreen et al. (2000) lies in an outer arm of NGC 2207 on its anti-companion side. Feature i is the most luminous 8 µm, 24 µm, 70 µm, H, and radio continuum source in NGC 2207/IC 2163 (Elmegreen et al., 2001, 2006; Kaufman et al., 2012) and accounts for 23% of the total 24 µm emission from the galaxy pair (Elmegreen et al., 2006, 2016). The star formation rate (SFR) of Feature i is 1.6 M (Smith et al., 2014; Elmegreen et al., 2016), which is enormous for a clump not in a galactic nucleus or a galaxy merger, or in the expanding ring of a collisional ring galaxy. The gas (H2 + H I) depletion time of Feature i, Myr (Elmegreen et al., 2016), lies in the range of starburst galaxies [see, for example, the Kennicutt-Schmidt diagram in Bigiel et al. (2008)].
Comparable in SFR to the brightest star-forming clump in the overlap part of the Antennae galaxies (Smith et al., 2014), Feature i has the seventh highest SFR among the set of 1700 star forming complexes in interacting galaxies or normal spirals measured by Smith et al. (2016) with a 1 kpc aperture. Because of its high SFR and location on an outer arm, Smith et al. (2014) include Feature i in their study of hinge clumps. Hinge clumps are regions of multiple converging flows, usually involving a tidal arm produced in a prograde encounter. In contrast, the encounter suffered by NGC 2207 was retrograde and somewhat out-of-plane (Elmegreen et al., 1995b; Struck et al., 2005). We shall consider how such an encounter may have led to the formation of Feature i.
The most striking property of Feature i is a large optically-opaque, conically-shaped dust cloud extending a projected ( pc) from the center of its core. This structure suggests that there is a large scale outflow of gas inclined with respect to the disk at Feature i and thus feedback from the starburst. We present new observations of Feature i in 12CO , HCO+, and millimeter-wave continuum (in the range 88 GHz to 106 GHz) from the Atacama Large Millimeter Array (ALMA) and K-band spectrometry from Gemini NIFS. We then combine these observations with previous radio to X-ray data in order to study the outflow and determine the energy source(s) in this intriguing, partly obscured star-forming region.
NGC 2207/IC 2163 contain massive ( ) H I clouds that do not coincide with the brighter star-forming knots in these galaxies (Elmegreen et al., 1993, 1995a). The massive H I clouds are located in the large areas of these galaxies that have high velocity dispersion (30 - 50 km s-1) in the H I gas. Similar massive H I clouds in regions with high H I velocity dispersion are found in other interacting galaxies in an early stage of post-encounter evolution, for example, Arp 82 (Kaufman et al., 1997), Arp 84 (Kaufman et al., 1999), and the NGC 5774/75 pair (Irwin, 1994). Presumably, the galaxy encounters increased the H I velocity dispersion and thus the gravitational Jeans mass of the largest clouds in these galaxies (Elmegreen et al., 1993; Wetzstein et al., 2007). Although Feature i does not presently correspond to a massive H I cloud, it is similar to the massive H I clouds in its mass of cold gas, (Elmegreen et al., 2016), overall size, kpc (Kaufman et al., 2012), and location in a region with high H I velocity dispersion. Feature i may illustrate what a massive H I cloud could become if an outburst of star formation were triggered in it.
From the NASA/IPAC Extragalactic Database (NED), we adopt a distance of Mpc for NGC 2207 with a Hubble constant = 73 km s-1 Mpc-1 and corrected for infall toward Virgo. Then = 170 pc. Our velocities are heliocentric and use the optical definition of the nonrelativistic Doppler shift.
Rupke et al. (2010) measure [O/H] = 8.874 in Feature i, so metallicity close to solar. We therefore adopt the standard value = H2 cm-2 (K km s for normal galaxies (Dame et al., 2001) to convert the CO emission to molecular mass. In Section 4 we comment on whether a reduced value of is appropriate for Feature i.
An overview of Feature i from previous observations is presented in Section 2, and a description of our new data in Section 3. Since star formation in parts of Feature i may be hidden by heavy obscuration, we investigate the level of extinction and the dust distribution in Section 4. The amount of extinction at the detected X-ray source in Feature i is relevant to whether this source could be an intermediate mass black hole. Section 5 identifies the two main CO components of Feature i. In Section 6, we focus on the star-forming core of Feature i and compare its properties in the broad-band optical, CO, HCO+, near-infrared emission lines, 100 GHz continuum and radio continuum. We discuss the internal kinematics of the cold gas, the gas velocity dispersion, possible outflows, and the three-dimensional orientation of the latter in Section 7. In Section 8 we hypothesize a possible origin for Feature i, and Section 9 summarizes our conclusions.
2 Overview and Previous Results
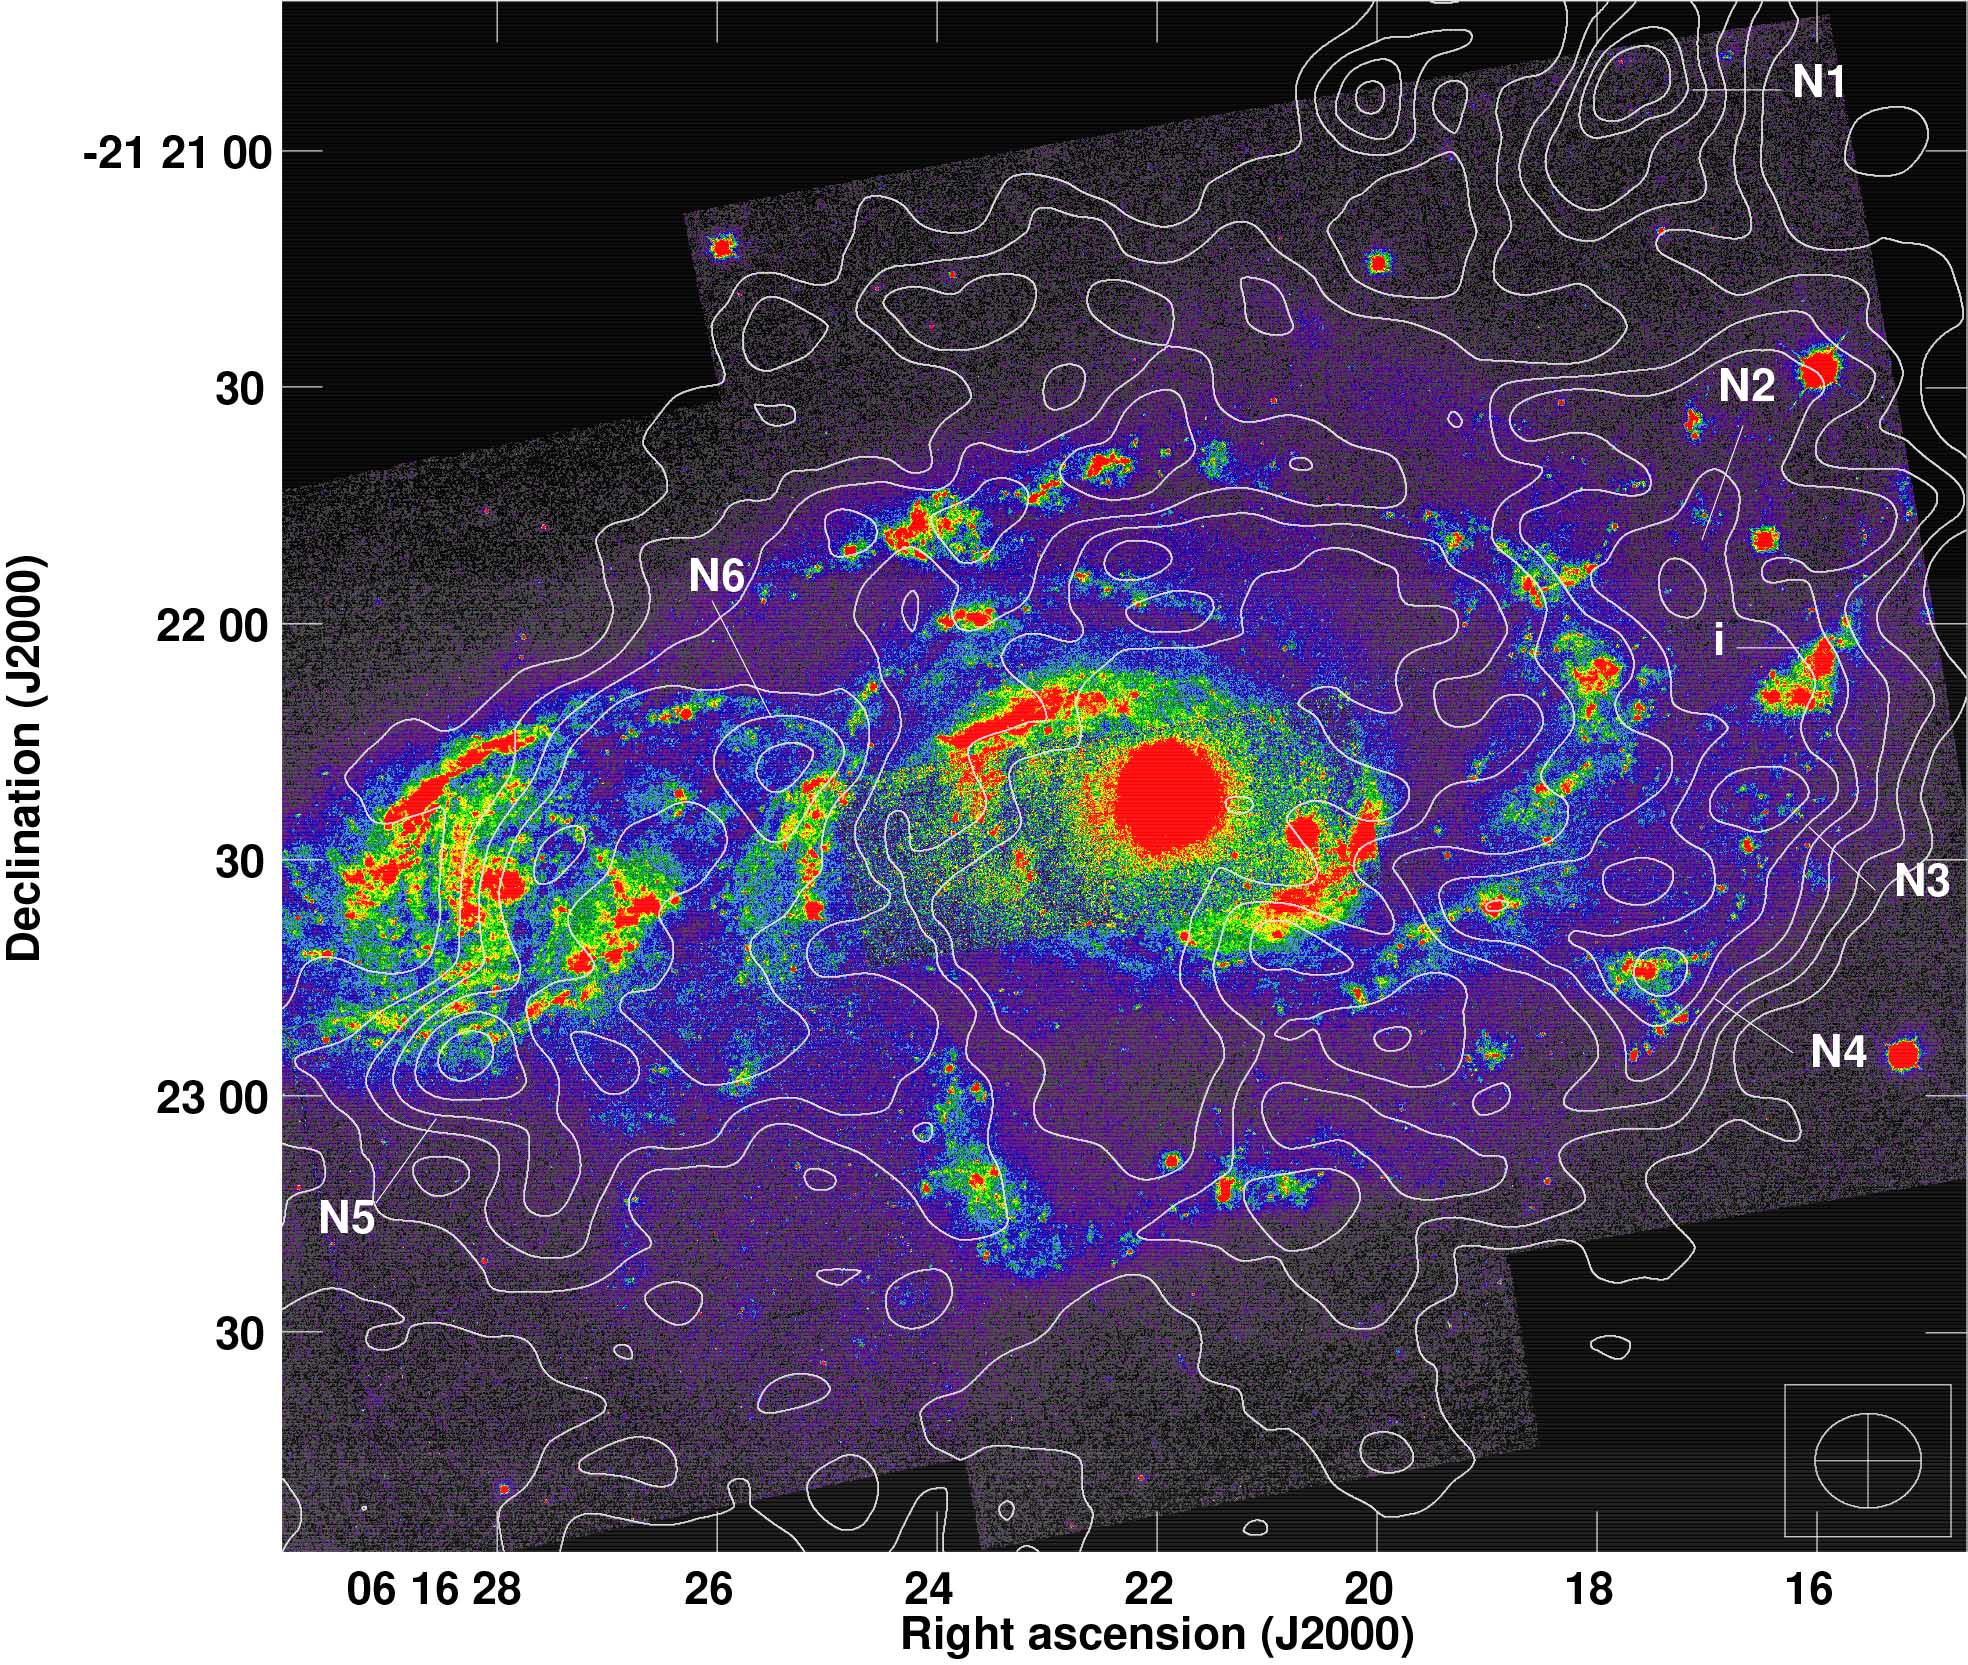
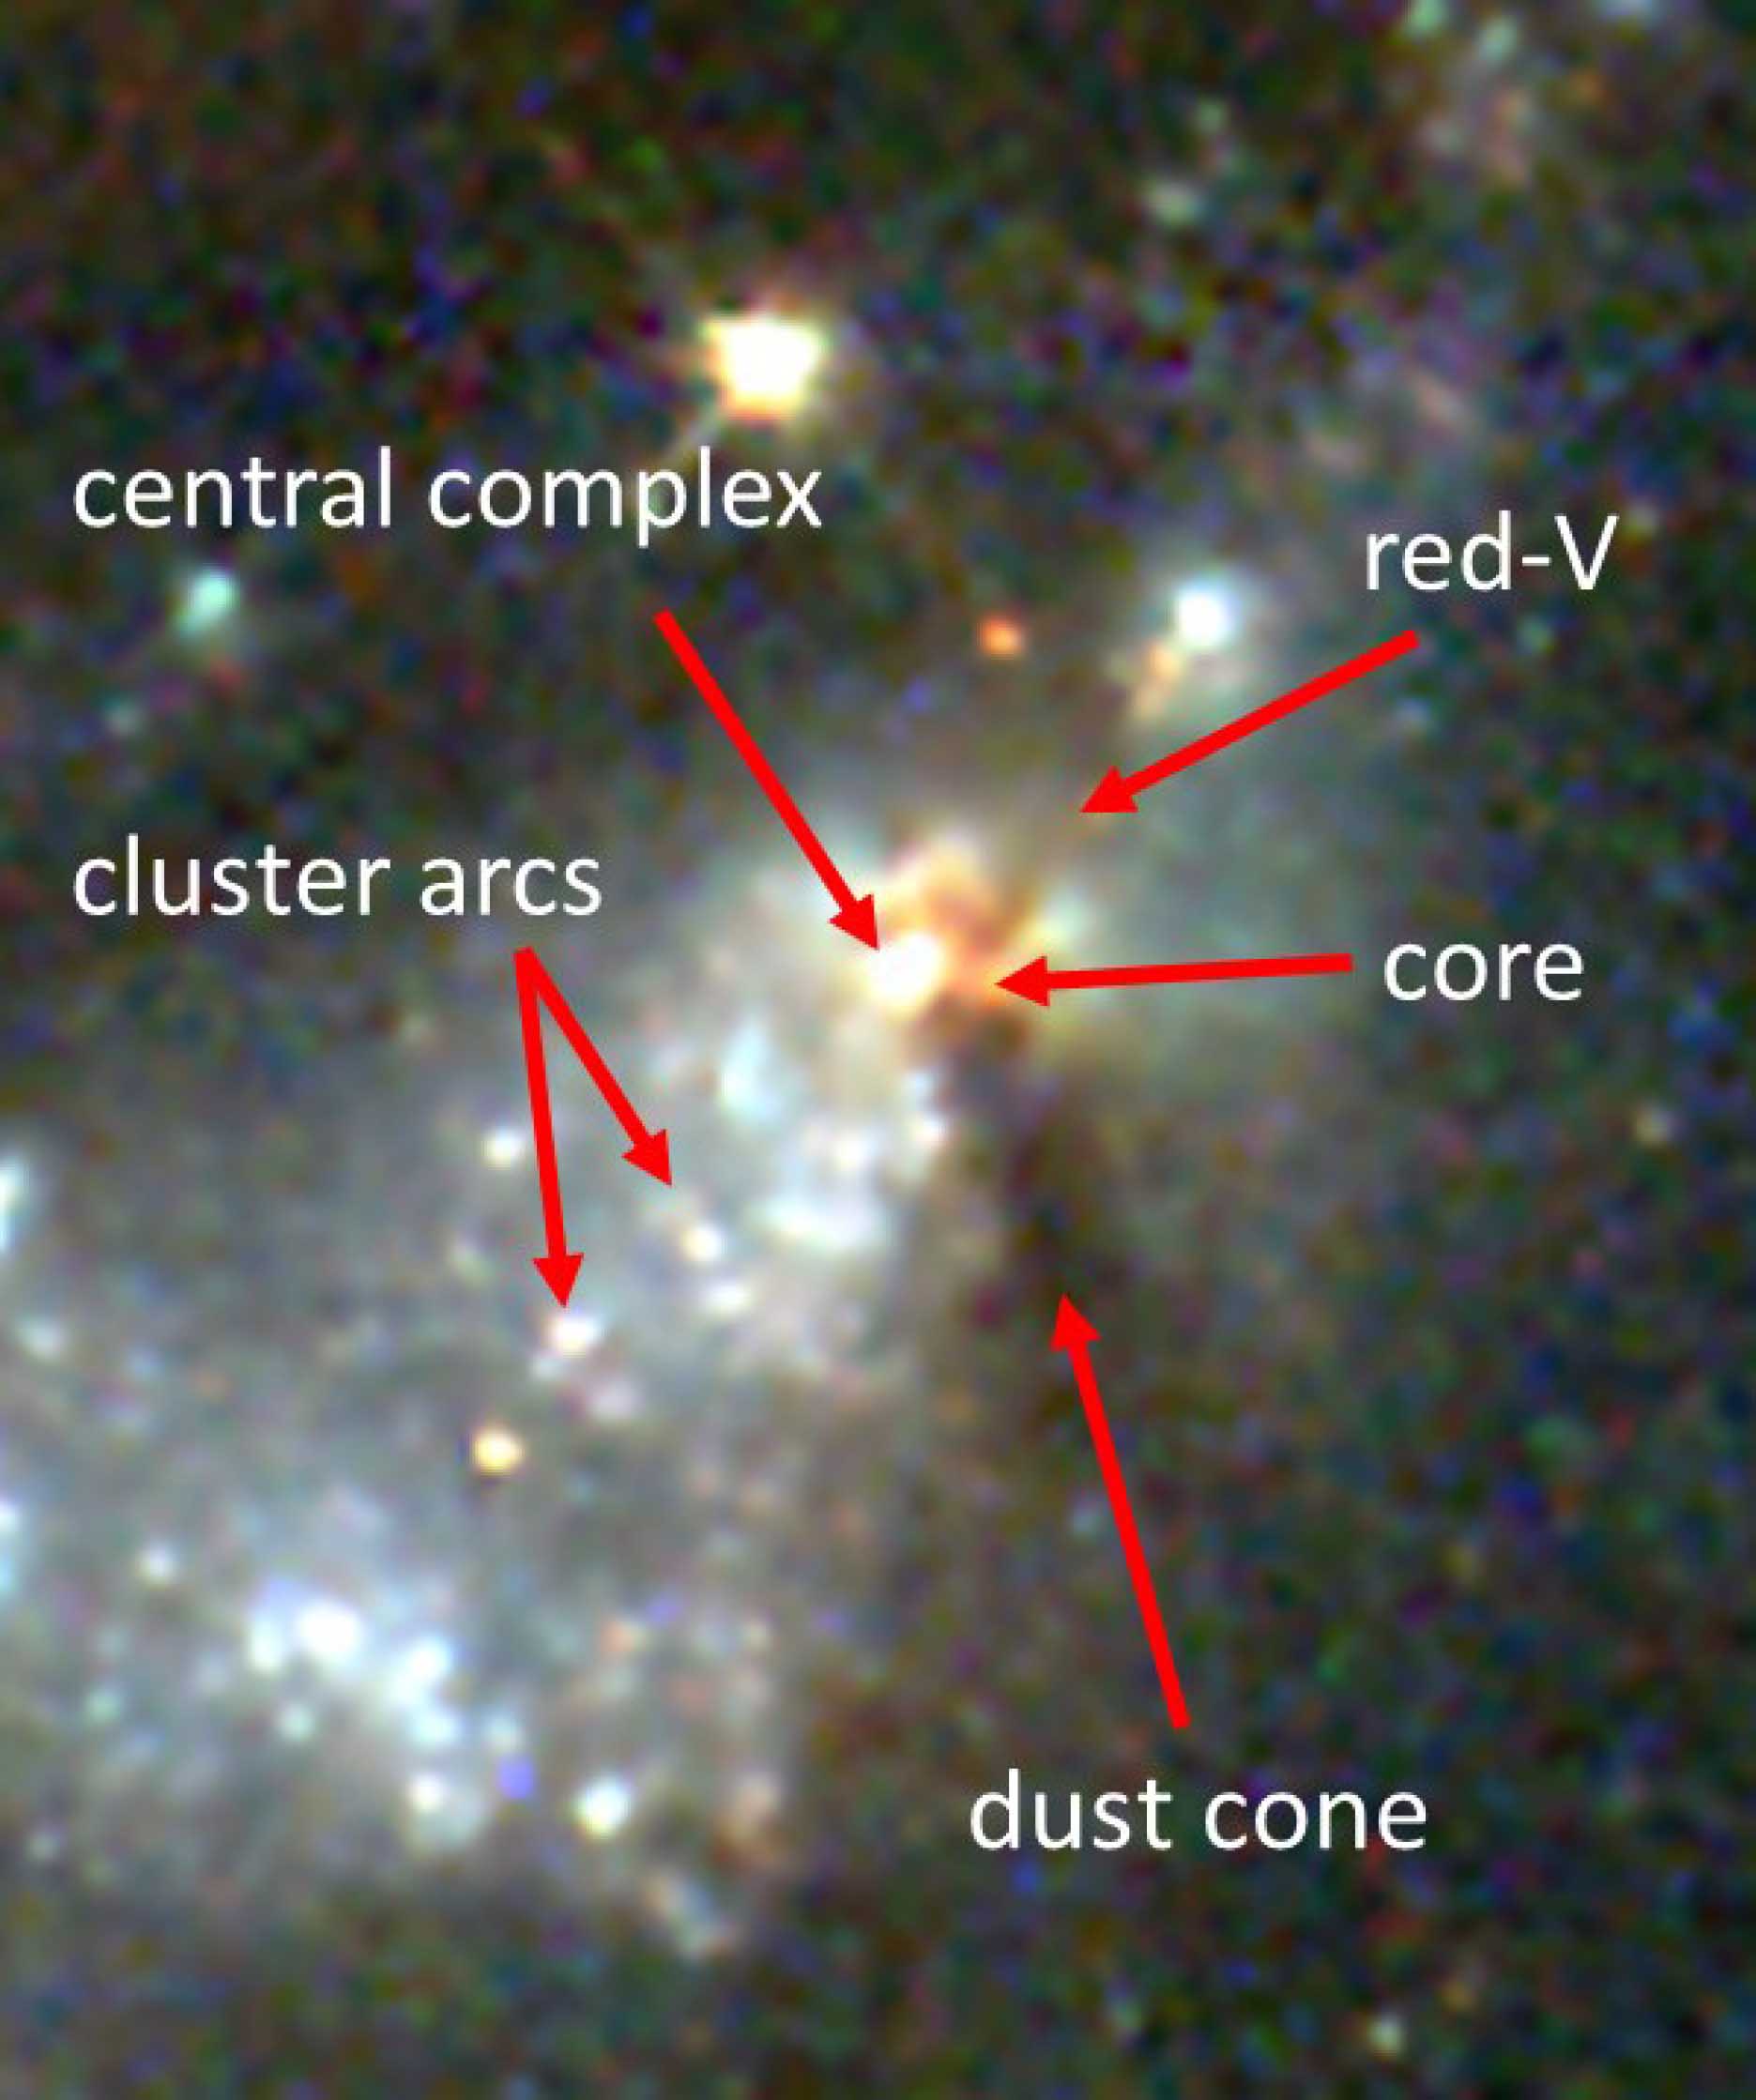
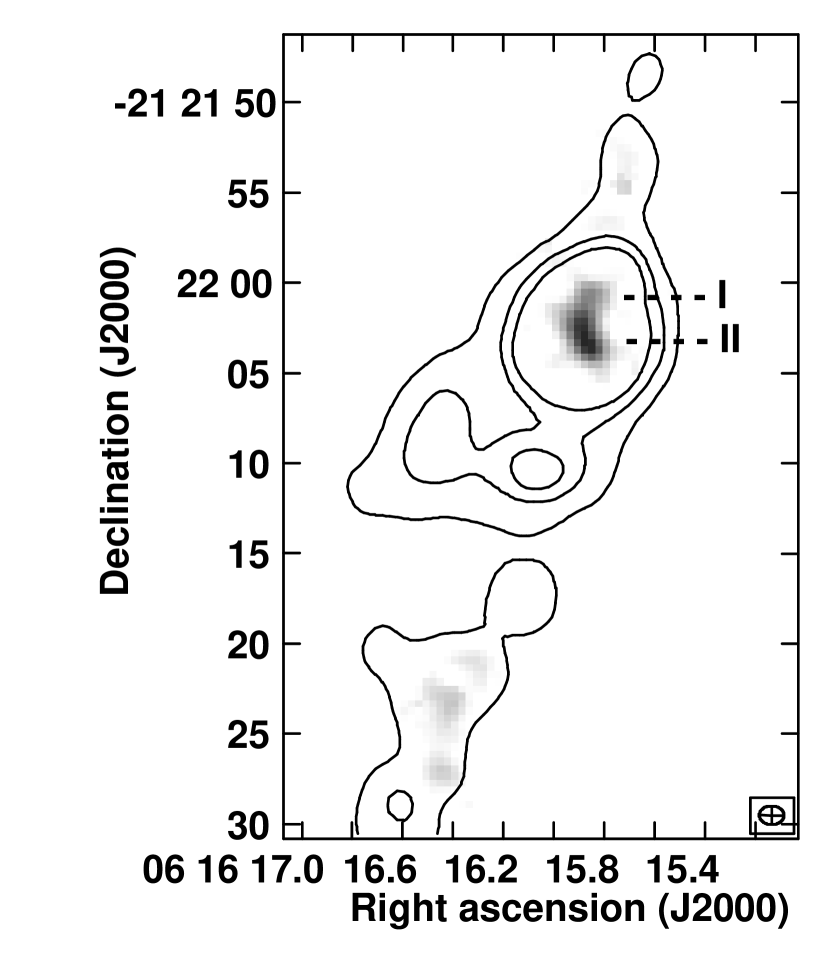
The location of Feature i in NGC 2207 (at a distance of 15 kpc from the NGC 2207 nucleus) and the locations of the six massive H I clouds (N1 - N6) are marked in Figure 1, which displays the HST B image overlaid with the H I column density contours of NGC 2207 (Elmegreen et al., 1995a, 2000). The H I velocity of Feature i is consistent with that of the surrounding H I in the NGC 2207 disk; thus it is likely that Feature i formed in the disk. Table 2.4 lists previous observations from radio to X-rays of Feature i, along with the values of the FWHM of the point spread function (PSF) and for the radio and mm-wave observations, the rms noise at the location of Feature i after correcting for primary-beam attenuation. Important components of Feature i are its core, the central star complex, the cluster arcs, the opaque dust cone, and the red V-shaped dust structure. These are marked in Figure 2. Their relevant properties are summarized below.
2.1 Radio Continuum and 8 µm: the Core and the Extended Emission
In the cm radio continuum images from NSF’s Karl G. Jansky Very Large Array (VLA) and in the Spitzer 8 µm image, Feature i consists of a bright core with FWHM (= 170 pc) embedded in a region of extended emission of dimension (= kpc); see Figure 12 in Kaufman et al. (2012). The location of maximum surface brightness in the radio continuum is at R.A., decl. (J2000) = 06 16 15.865, 22 02.77 (Vila et al., 1990) with an uncertainty of (10% of the HPBW). We shall use this as the point from which relative positions are quoted throughout this paper.
Scaled-array VLA observations show that both the core and the surrounding region are dominated by nonthermal emission at cm and cm. With a aperture Vila et al. (1990) measure flux densities (20 cm) = 10.3 mJy and (6 cm) = 3.4 mJy and a spectral index (where . For the core, their Gaussian fit gives (20 cm) = 3.4 mJy, (6 cm) = 1.4 mJy, and . A near doubling of the cm flux density of the Feature i core between 1986 and 2001 (Kaufman et al., 2012) is evidence of a possible radio supernova in the core.
2.2 Optical: Central Star Complex, Cluster Arcs, Opaque Dust Cone, and Red V-shaped Dust Structure
In the HST B image, the only star complex detected in the core of Feature i has a mass of , an age of 0.6 Myr (Elmegreen et al., 2017), and a size of (100 pc) with major axis at a position angle (PA) of . The center of this star complex is east, south of the radio peak; the uncertainties in position are in the absolute astrometry of the HST image and for the radio continuum peak. This central star complex is surrounded by concentric arcs of 13 smaller star complexes that lie within the radio and 8 µm region of extended emission (Elmegreen et al., 2000, 2017). These range in age from 0.6 Myr to 60 Myr with an average age of 7.9 Myr and an average mass of . There is no obvious pattern of cluster age with distance from the radio peak in the core.
The central star complex together with a reddish dusty region on its western edge is near the apex of the optically-opaque dust cone which extends to the southwest for a projected length of at PA = (Elmegreen et al., 2000), nearly perpendicular to the major axis of the central star complex. The cone has an opening angle of ; its darkest part is a column of width . The reddish region also contains the vertex of a V-shaped dust structure opening to the north. This vertex appears to coincide with the radio continuum peak and the Spitzer 8 µm emission peak. It may be the location of an embedded cluster old enough to host supernovae or some other source of nonthermal emission.
2.3 X-rays: Possible ULX in the Core
In four Chandra observations between 2010 and 2013, Mineo et al. (2014) detect Feature i as an elongated soft X-ray source and suggest that it may contain a non-variable Ultta-luminous X-ray Source (ULX) surrounded by hot diffuse gas. The possible ULX and the radio continuum peak coincide within the uncertainties.
2.4 Previous ALMA CO, H I, and SFR
The CO emission from Feature i has a C-shaped distribution and consists of two lobes that join in the core: one lobe along the opaque dust cone southwest of the central star complex and the other lobe along the extended 8 µm emission north-northwest of the core. The CO lobe along the dark dust cone has about the same length as the dark cone (Elmegreen et al., 2017), and thus the extinction of the dark cone is probably from dust associated with the cold molecular gas.
| Data Set | Date Observed | PSF (HPBW, BPA) | noise | ref. |
|---|---|---|---|---|
| (YYYY-mm-dd) | (mJy beam-1) | |||
| (1) | (2) | (3) | (4) | (5) |
| Spectral Line: | ||||
| VLA H I | 1990-10-11 | , | 0.73 | 1 |
| ALMA 12CO | 2014-04-03 | , | 4.4 | 2, 3 |
| Lowell H | 1999-10-06 | 4 | ||
| Continuum: | ||||
| VLA 1.49 GHz | 1986-03-18 | , | 0.19 | 5 |
| VLA 1.40 GHz | 1990-10-11 | , | 0.37 | 1 |
| VLA 4.86 GHz | 1986-08-16 | , | 0.07 | 5 |
| VLA 4.86 GHz | 2001-04-14 | , | 0.013 | 6 |
| Spitzer 24 µm | 2005-03-11 | 7,2 | ||
| Spitzer 8 µm | 2005-02-22 | 7 | ||
| HST UBVI | 1996-05-25 | 8,3 | ||
| XMM-Newton UVM2 | 2005-08-31 | 6 | ||
| Galex NUV | 9 | |||
| Chandra | 2010 – 2013 | 10 |
References. — (1) Elmegreen et al. 1995a; (2) Elmegreen et al. 2016; (3) Elmegreen et al. 2017; (4) Elmegreen et al. 2001; (5) Vila et al. 1990; (6) Kaufman et al. 2012; (7) Elmegreen et al. 2006; (8) Elmegreen et al. 2000; (9) Smith et al. 2014; (10) Mineo et al. 2014.
| Parameter | 12CO | HCN | HCN | HCO+ | HCO+ |
|---|---|---|---|---|---|
| Date Observed | 2015-05-15 | 2014-08-30 | 2015-06-07 | 2014-08-30 | 2015-06-07 |
| uv-coverage (k) | |||||
| Number of antennasaaOmitting antennas flagged for most or all of the run | 34 | 33 | 36 | 33 | 36 |
| Time on Source | 72 min | 36 min | 72 min | 36 min | 72 min |
| Flux Calibrator | Callisto | Ganymede | Mars | Ganymede | Mars |
| Central (GHz) | 114.195 | 87.830 | 87.823 | 88.390 | 88.382 |
Because of the resolution of the H I data, Elmegreen et al. (2016) use a (= 2.4 kpc) diameter aperture to measure the SFR, H I mass, and molecular mass of Feature i. They find the SFR = 1.6 M (from the combination of 24 µm and H luminosities), the H I mass (H I) = , and = (multiply these values of the atomic and molecular mass by a factor of 1.36 to include helium). In this aperture, the H I velocity dispersion is high (52 km s-1). The molecular gas consumption time in Feature i is only 50 Myr, and the total gas consumption time is 118 Myr. A somewhat smaller aperture, in diameter, captures essentially all the on-going star formation in Feature i (Smith et al., 2014), the extended radio and 8 µm emission, and the molecular mass (Elmegreen et al., 2017).
3 New Observations
3.1 CO, HCO+, HCN and Millimeter-wave Continuum
Table 2 contains some observing details about our new ALMA 12CO , HCN, and HCO+ observations of Feature i, Table 3 describes the resulting cubes and surface brightness (integrated intensity) maps of the spectral lines, and Table 4 lists the properties of the line-free continuum maps associated with these observations. The notation means the rms noise at Feature i after correction for primary beam attenuation.
The ALMA 12CO observations (rest =115.271202 GHz) on 2015 May 15 were obtained during ALMA Cycle 2. They consist of mosaic maps made with 34 pointings, spaced apart, to cover the emission from the galaxy pair, with phase center at R.A., decl. (J2000) = 06 16 22.809, -21 22 30.73. The bandwidth is 1.875 GHz. The brightest mm-wave continuum source in the galaxy pair is Feature i, and it is well below the noise in the CO spectral-line cube. The maximum recoverable scale is , which exceeds the size of Feature i.
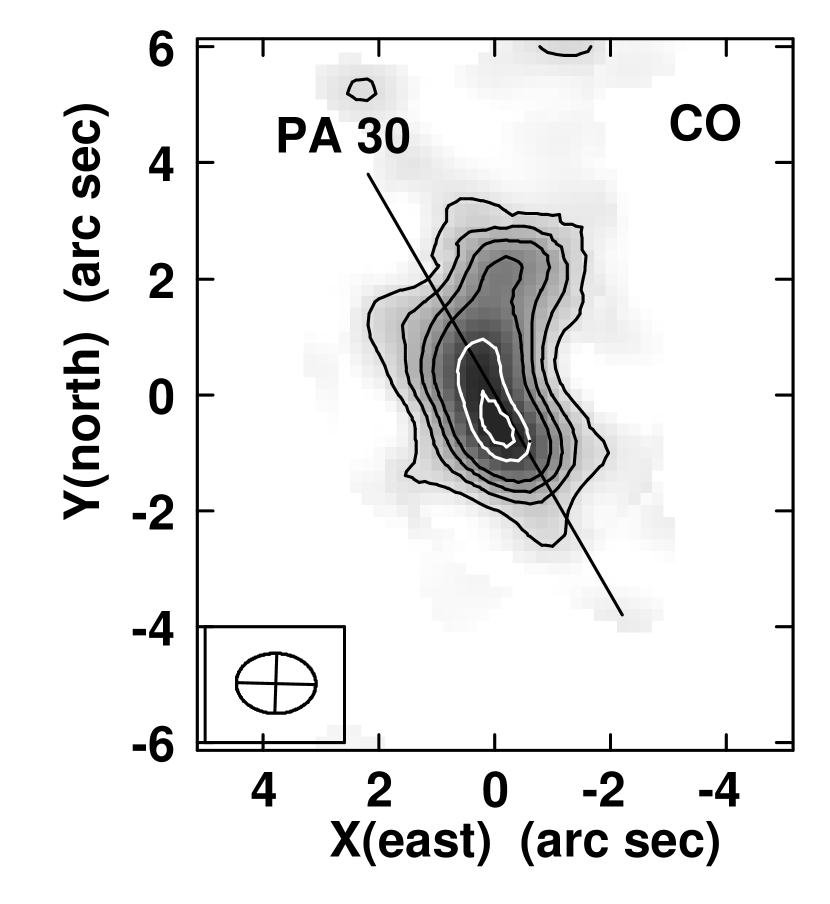
Using the pipeline with CASA 4.2.2 software, the ALMA Data Reduction Team did the calibration and flagging of the 12CO observations and made and cleaned a data cube of the CO Cycle 2 line emission. Inspecting this, we saw no problems. For subsequent analysis, we used the AIPS software package. To select areas of genuine emission in the CO data, we convolved the cube before correction for primary-beam attenuation to resolution, clipped it at 2.5 times its rms noise , and retained regions of emission only if they appear in at least 2 adjacent velocity channels. The result was applied as a blanking mask to the original cube, and after correcting for primary beam attenuation, we calculated the moment maps. Additionally, we blanked the intensity-weighted velocity field (first moment) and the velocity dispersion (second moment) images where the CO surface brightness is less than ( rms noise) (2 channel widths). Figure 3 displays the CO surface brightness (integrated intensity) map of Feature i from this cube.
| Parameter | CO | CO | HCN | HCO+ |
|---|---|---|---|---|
| Cycle 2 | Combined | |||
| Channel width | 10 km s-1 | 4.87 km s-1 | 8 km s-1 | 10 km s-1 |
| Weighting | Briggs R = 0.5 | Briggs R = 0.5 | Natural | Natural |
| PSF (HPBW) | ||||
| PSF (BPA) | ||||
| Pixel size | ||||
| aa gives the brightness temperature equivalent to a surface brightness of 1 Jy beam-1, and (in mJy beam-1) is the rms noise at Feature i after correcting for primary beam attenuation. (K/Jy beam-1) | 65.6 | 38.6 | 137 | 124 |
| At Feature i: | ||||
| per channelaa gives the brightness temperature equivalent to a surface brightness of 1 Jy beam-1, and (in mJy beam-1) is the rms noise at Feature i after correcting for primary beam attenuation. | 3.8 | 3.3 | 0.96 | 0.86 |
| peak bbPeak in channel maps | 12 | 17 | 3.7 | |
| Max. brightnessccMaximum surface brightness (Jy beam-1 km s-1) in integrated intensity image of Feature i | 1.45 | 2.44 | 0.062 | |
| equivalent to | ||||
| 1 Jy beam-1 km s-1 in CO | 189 pc-2 | 111 pc-2 | ||
| max. in Feature i | 281 pc-2 | 271 pc-2 |
| Parameter | 88 GHzaamade along with HCN and HCO+ observations on 2014-08-30 and 2015-06-07 | 100 GHzaamade along with HCN and HCO+ observations on 2014-08-30 and 2015-06-07 | 106.4 GHzbbmade along with CO Cycle 2 observations on 2015-05-15 |
|---|---|---|---|
| Bandwidth | 0.52 GHz | 3.9 GHz | 6 GHz |
| Weighting | Natural | Natural | Briggs R= 0.5 |
| PSF (HPBW) | |||
| PSF (BPA) | |||
| Pixel size | |||
| (K/Jy beam-1) | 125 | 134 | 54.3 |
| cc is the rms noise at Feature i after applying the correction factor for primary beam attenuation. (mJy beam-1) | 0.068 | 0.034 | 0.044 |
| Max. Surface BrightnessddUnits are mJy beam-1 | 1.33 | 0.79 | 1.04 |
We also combined our lower resolution ALMA Cycle 1 CO data (listed in Table 2.4) with our Cycle 2 CO data, then made and cleaned a data cube of the combined emission, and similarly masked it. The cube derived from the Cycle 2 data alone is called the CO Cycle 2 cube, and the one derived from the combined Cycle 1 plus Cycle 2 data is called the CO Combined cube. The CO Cycle 2 cube has the higher spatial resolution. The CO Combined cube has the higher velocity resolution and is more sensitive to extended emission. For the core and for where a clearer distinction between the core and the dark cone is needed, we use the CO Cycle 2 cube. For the velocity field in Section 7, we use the CO Combined Cube. Unless otherwise noted, our results are from the CO Cycle 2 cube, although for some applications, such as the extinction on a kpc scale (Section 4.1), both CO cubes yield the same values.
On 2014 Aug 30 and on 2015 June 7, we made ALMA observations of the spectral lines HCN (1–0) (rest = 88.631601 GHz) and HCO+ (1–0) (rest = 89.188526 GHz) and also observations of the 100 GHz continuum. On 2014 Aug. 30, the maximum recoverable scale is for observations in the range 100 - 88 GHz; on 2015 June 7, it is for these frequencies. Three fields in the galaxy pair were observed. The westernmost field has phase center RA, decl. (J2000) = 06 16 17.654, - 21 22 13.36 and includes Feature i near its western edge. Using the Pipeline-Cycle 2-R1-B and CASA 4.2.2 software, the ALMA Data Reduction Team did the calibration and flagging, combined the uv-data from the two dates, and made and cleaned the continuum image and data cubes of the line emission.
In addition to the 100 GHz continuum map, we made a continuum map at 88 GHz from the line-free channels in the HCO+ cube. In the HCO+ channel maps, the maximum S/N is only . To make a blanking mask for the HCO+ cube, we followed the same procedure as with the CO data except that we convolved the HCO+ cube to resolution rather than resolution and used clip level of 2 times its rms noise. In the HCO+ integrated intensity image at Feature i, a surface brightness of (2 (2 channel widths) = 0.0344 Jy beam-1 km s-1, and the maximum value of the surface brightness is 0.062 Jy beam-1 km s-1, displaced north, east of the radio continuum peak.
No HCN emission was detected in Feature i. This provides an upper limit on its HCN/CO ratio (see Section 6).

3.2 Near-IR K-band Spectra
On 2017 Feb 15, K-band spectra were taken of the core of Feature i with Gemini’s NIFS integral field spectrograph under photometric conditions. NIFS is an image slicer Integral Field Unit (IFU) with a field-of-view 3″ and a pixel scale of . Due to the size of Feature i and the lack of suitable guide stars in the field, we observed in natural seeing mode. The resulting spatial resolution is estimated to be or better. The precise R. A., decl. at field center is less well determined than if there were a guide star within the NIFS field.
Observations were done in a traditional ABBA pattern, to remove the sky contribution, repeated 9 times with 150 seconds exposures, where each exposiure is an average of two coadds. The “A” position was centered on Feature i and the “B” position on a piece of blank sky identified in previous imaging.
The science data were reduced in a standard manner within the pyraf environment using the Gemini nifs package. Darks were subtracted and clean running sky frames constructed from the “B” frames. Wavelength calibration was performed using an Argon/Xenon lamp; the uncertainty in this calibration is less than 0.2 pixels in wavelength, equivalent to 12 km s-1. Since the spatial extent of the Br emission determined by fitting a 2-D Gaussian is (= 190 pc) (FWHM), we used a 1.1″ diameter aperture for extracting the spectrum of Feature i from the combined data cube.
A telluric star was observed before (HIP 23671) and after (HIP 34949) the science sequence in order to be able to correct for the absorption features in the spectra due to the Earth’s atmosphere. These were further used to flux calibrate the spectrum of Feature i, with a 1.1 diameter aperture. Figure 4 presents the final corrected, calibrated, background-subtracted K-band spectrum of Feature i obtained with the diameter aperture. We identified redshifted Br, H2, He I, and He II lines in the spectrum and performed a Gaussian fit to each line to measure its central wavelength, line-width, and flux. The instrumental line-width estimated from the width of the arc lines is µm, equivalent to 22 km s-1 at Br. This was then subtracted in quadrature from the line-widths of the spectral lines detected in Feature i.
| Location | Indicator | aa to midplane unless otherwise noted | ref. |
|---|---|---|---|
| (mag) | |||
| aperturebbcentered on radio peak | H cm | 1 | |
| aperturebbcentered on radio peak | H cm | 2 | |
| aperturebbcentered on radio peak | / | 3.5 | 3, 2 |
| aperturebbcentered on radio peak | (H2) | 2 | |
| aperturebbcentered on radio peak | (H2) + (H I) | 2 | |
| central star complex | HST UBVI | 3.3 | 4 |
| 13 star complexesccmean of star complexes in cluster arcs outside of core | HST UBVI | 4 | |
| brightest H emissiondd diameter aperture centered on brightest H emission, which is east, south of radio peak and thus outside of the core. The H position uncertainty is . | H/H | 0.74 | 5 |
| aperture on corebbcentered on radio peak | (H2) | 7.5 | 2 |
| At radio peak | (H2) | 8.3 | 2 |
| dark cone outside coreee diameter aperture centered at distance from radio peak along PA = | (H2) | 4.7ff is front-to-back for dark cone outside core. | 2 |
References. — (1) Kaufman et al. 2012; (2) this paper; (3) Smith et al. 2014; (4) Elmegreen et al. 2017; (5) Rupke et al. 2010
4 Extinction in Feature i
Table 3.2 lists estimates of in various parts of Feature i. Except in the case of the “dark cone outside core,” these are values to the midplane under the assumption that the gas and dust are symmetrically distributed about the midplane. Some details, discussion, and the molecular column densities are given below.
4.1 Extinction on kpc Scale
For the extinction in a (1.2 kpc) diameter aperture, which contains most of the CO emission from Feature i, all three types of methods in Table 3.2 are consistent with = 3 - 3.5 mag to the midplane. From the H cm radio continuum ratio, the upper limit to is obtained by taking the radio continuum emission as entirely thermal (which it is not), and the lower limit assumes the thermal fraction of the 20 cm radio continuum emission is )%. From the / ratio, Smith et al. (2014) find equals 4 mag with a diameter aperture. Adjusting to the aperture gives 3.5 mag.
The mean line-of-sight column density (H2) of CO emission in the aperture is molecules cm-2 (= M⊙ pc-2). Our H I observations, which did not resolve Feature i, have a mean atomic column density (HI) = atoms cm-2 in the H I HPBW. As we do not know about the clumping of H I within the H I synthesized beam, we adopt this mean value for (HI) here. With the standard Galactic relation between neutral hydrogen column density and (Bohlin et al., 1978), the resulting from front to back is mag from the molecular hydrogen and 1.8 mag from H I, for a total front-to-back of 6.1 mag and thus mag to the midplane if the gas and dust are symmetrically distributed about the midplane.
4.2 Extinction in Core and in Dark Dust Cone
The gas column density gives a much higher value of the extinction in the core of Feature i than the value deduced from the UBVI magnitudes of the 0.6 Myr central star complex (see Table 3.2). With a diameter aperture (to approximate the synthesized beam area of the CO Cycle 2 data) centered on the radio continuum peak, the mean value of ) is molecules cm-2 (= M⊙ pc-2), equivalent to a front-to-back of 15 mag based on the molecular gas alone. It is dominated by the portion of the opaque dust cone in this aperture. Maximum CO surface brightness, located at the apex of the dark cone, is displaced south of the radio continuum peak (see Figure 3). The molecular column density ) is molecules cm-2 at the CO surface brightness maximum and molecules cm-2 at the radio peak. The latter is equivalent to a front-to-back Av of 16.5 mag based on the molecular gas alone plus a contribution (possibly 1.8 mag as in Section 4.1) from (H I). If the gas at the radio peak were distributed symmetrically about the midplane, then = 8.3 mag to the midplane from dust associated with the molecular gas there. Although starbursts tend to have lower values of by a factor of , with a large dispersion in the amount of reduction (Bolatto et al., 2013), the extinction required to account for the opaque dust cone implies that the value of on the dark cone (where the extinction is too high to be measured optically) is not appreciably reduced from the standard value.
Measuring ) farther out along the optically opaque dust cloud, specifically with a diameter aperture centered at distance from radio peak along PA = , gives ) = molecules cm-2 (= pc-2), equivalent to a front-to-back extinction of 4.7 mag from molecular gas alone. If this gas were symmetrically distributed about the midplane, then Av to the midplane would be 2.3 mag from molecular gas plus a contribution from H I. If we use the same value of (H I) as in Section 4.1, then to the midplane = (2.3 + 0.9) mag = 3.2 mag, not sufficient to explain the dark dust cone which is optically thick even in I-band. The implication is that almost all of the gas in this part of the dark dust cone must be on the near side (relative to us) of the NGC 2207 disk.
4.3 Comment about Extinction and X-rays from Feature i
The possible ULX detected with Chandra lies at, or close to, the radio continuum peak, and is slightly offset to the northwest of the 0.6 Myr central star complex. This star complex is too young to host a ULX. Neither Mineo et al. (2014) nor Smith et al. (2014) measure the X-ray extinction within the Feature i core. Assuming an of 4 mag to the midplane, Smith et al. (2014) deduce the value of and get a de-reddened erg s-1 for the 0.5 - 10 keV luminosity of the central source in Feature i. Their value of can be accommodated by a stellar mass black hole with geometric beaming (Madau, 1988) or inhomogeneous accretion (Ruszkowski & Begelman, 2003). Since the extinction at the potential ULX is probably much higher than Smith et al. (2014) assumed (see Table 3.2 regarding at the radio peak), the de-reddened value of may be considerably greater than this, and thus the possible ULX could be an intermediate mass black hole.
5 The Two Lobes of CO Emission
In Figure 5 the location of the spiral arm near Feature i is outlined by a few contours of 8 µm emission overlaid on CO in greyscale. CO lobe I, marked in this figure, lies along the major axis of the extended 8 µm emission of Feature i north-northwest of the core at PA = , and thus is molecular gas in the disk of NGC 2207. In the core, it joins CO lobe II, which coincides with the opaque dust cone at a PA of . As pointed out in Section 4.2, lobe II needs to be in front of the disk to account for the extinction of the dark cone.
According to encounter simulation models (Elmegreen et al., 1995b; Struck et al., 2005), the minor axis of the projection of the main disk of NGC 2207 into the sky plane is at PA = , with the near side (relative to us) in the northeast, and the central disk of NGC 2207 has an inclination = ( = for face-on). The opaque dust cone extends towards the southwest of the core at PA = , not far from the minor axis of this projection. Thus, unless the disk at Feature i is highly warped, gas flowing towards us from the center of the Feature i core in a direction quasi-perpendicular to the NGC 2207 disk would appear in projection to lie along the dark dust cone.
Figure 3 reveals that some of the CO emission with (CO) Jy beam-1 km s-1 extends northeast of the radio peak for along a PA not far from that of the dust cone on the opposite side. Compared to the opaque cone, this bright northeast CO emission region has less extinction (see Figure 2) and thus less gas and dust in front of the midplane. Section 7 presents kinematical evidence that the dark cone is from gas approaching us on the near side of the midplane and some of the bright northeast CO emission may be from gas receding from us on the far side.
6 Core of Feature i and Left Fork of Red V
6.1 Overview of CO, 100 GHz Continuum, HCO+, and HCN
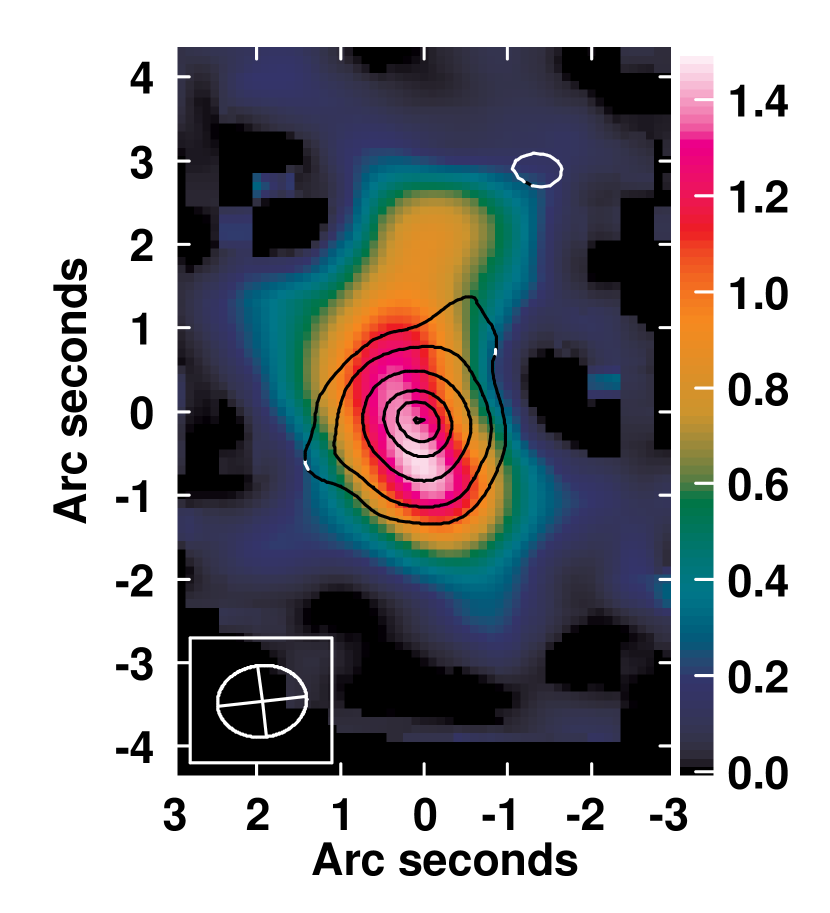
The resolution of the CO, 100 GHz continuum, and HCO+ images is about the same as the FWHM of the core (see Table 3 and Table 4 ). The bottom panel of Figure 3 displays contours of the 100 GHz continuum emission of Feature i overlaid on the CO surface brightness image. The 100 GHz continuum emission is not elongated along the dark dust cone. The locations of maximum surface brightness in the 100 GHz continuum, radio continuum, and Spitzer 8 µm emission coincide within the uncertainties.
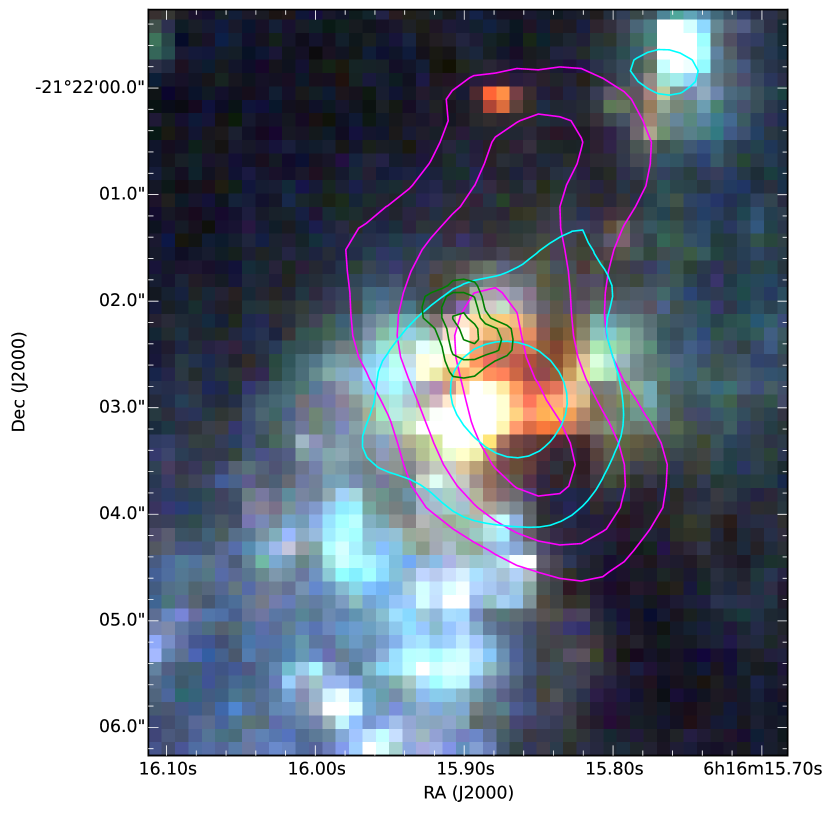
Figure 6, which overlays a few representative contours of HCO+, CO, and 100 GHz emission in different colors on the HST color composite image of Feature i, reveals that the HCO+ emission lies roughly along the left fork of the red V in the HST image and diametrically opposite the CO emission from the dark dust cone. In the HCO+ image, emission at the 0.035 Jy beam-1 km s-1 level extends along PA from a radial distance to relative to the location of radio continuum peak. The location and elongated shape of the HCO+ emission suggest that it may be produced by shock heating and excitation in a collimated wind from the energetic source at the radio peak (see the velocities in Section 7.1).
The critical density of HCO+ (1 - 0) is 100 times that of CO (1 - 0) (Juneau et al., 2009). Figure 6 (see Figure 3 for additional intermediate-level contours of CO and the 100 GHz continuum) indicates that the dense gas traced by HCO+ is more compactly distributed than the lower density molecular gas detected in CO or the 100 GHz continuum emission. The HCO+ image has a lower S/N than the CO or the 100 GHz continuum images. Also the CO distribution is somewhat smoother and more widespread than the HCO+ probably because the dense structures seen in HCO+ are only a small fraction compared to the CO-emitting gas; the HCO+ may trace a few small clumps inside of larger molecular clouds.
The goal of HCN observations was to search for even denser molecular gas. No HCN emission is detected in Feature i. In particular we do not detect HCN emission along the left fork of the red V where HCO+ is detected, even though both have about the same value of . As an HCN upper limit for the core, we take (HCN) = (2 (2 channel widths) = 4.2 K km s-1. For CO, we use the mean surface brightness (CO)= 78.7 K km s-1 in a -diameter aperture centered on the radio peak, as this approximates the CO synthesized beam area. This gives an upper limit to the surface brightness ratio (HCN)/mean (CO) of 0.05. Using the same aperture for HCO+, we obtain a mean = 3.4 K km s-1 and thus the ratio /(CO) = 0.044 in the Feature i core. Some of the measured CO emission of the core is from molecular gas ejected quasi-perpendicular to the stellar disk (see Section 7).
Feature i as a whole has a lower H2/H I ratio than almost all of the positions in the studies by Usero et al. (2015) and Bigiel et al. (2016) of HCN-to-CO and FIR-to-HCN ratios at various locations in other disk galaxies. These authors note that clumps with a low H2/H I ratio tend to have a lower HCN-to-CO ratio; the upper limit to HCN/CO in the Feature i core seems consistent with this trend. Comparable in SFR to the clump with the highest SFR in the overlap part of the Antennae galaxies, Feature i may be similar to it in terms of tracers of dense gas. For this Antenna clump (which contains SSC B1), Bigiel et al. (2015) measure a HCN-to-CO luminosity ratio of 0.027 (which is below our upper limit for the Feature i core), and, at the location of its HCN peak, an /(CO) ratio of 0.055 (25% higher than what we find in the Feature i core), and an /(HCN) ratio of 1.67.
In comparison, the M82 central starburst, because of its high /(HCN) ratio of 1.50 (Krips et al., 2008) and numerous SNe, is considered a late-stage starburst in which HCN is being depleted, either consumed in star formation or dissipated by turbulence or expelled via winds and feedback (Baan et al., 2008; Krips et al., 2008; Kepley et al., 2014). In less dense gas, HCO+ is more efficiently excited than HCN (Costagliola et al., 2011). Feature i may also be a late-stage starburst. For Feature i as a whole, Elmegreen et al. (2016) note that the molecular gas consumption time is 50 Myr.
| Line | b,cb,cfootnotemark: | b,db,dfootnotemark: | b,eb,efootnotemark: | ||
|---|---|---|---|---|---|
| (µm) | (µm) | (km s-1) | (km s-1) | ||
| Br | 2.16612 | 2.18625 | |||
| H2 1 - 0 S(2)ffThe centroid and of the H2 1 - 0 S(2) line may have been affected by the residuals from subtracting a neighboring night sky line. The He II line is partly contaminated by a night sky line. | 2.03376 | 2.05302 | |||
| H2 1 - 0 S(1) | 2.12183 | 2.14160 | |||
| H2 1 - 0 S(0) | 2.22329 | 2.24394 | |||
| H2 2 - 1 S(2) | 2.15421 | 2.17423 | |||
| H2 2 - 1 S(1 ) | 2.24772 | 2.26867 | |||
| He I | 2.05869 | 2.07807 | |||
| He IIffThe centroid and of the H2 1 - 0 S(2) line may have been affected by the residuals from subtracting a neighboring night sky line. The He II line is partly contaminated by a night sky line. | 2.03788 | 2.05654 | unresolved |
6.2 The Core in Near-Infrared Spectral Lines
The spatial resolution of the K-band observations is or better, so somewhat better than that of the radio and mm-wave images. The distributions of Br, He I, and K-band continuum emission have a FWHM of (= 190 pc), which exceeds the size of the 0.6 Myr central star complex. Table 6 lists the detected K-band emission lines and their properties measured with a diameter aperture. The H2 rest wavelengths are from the wavenumbers in Black & van Dishoeck (1987). A single Gaussian extrapolation to a diameter of would increase the values of the flux by a factor of 1.18, compared to those in this Table. Although there is slightly more extended emission, this should be a reasonable approximation to the total flux. The listed values of the velocity dispersion have been corrected for instrumental line-width. The Br and He I lines have = km s-1, and the H S(1) line has = km s-1. Thermal broadening at an electron temperature would produce a of only km s-1. Massive Oe stars and WN stars have line-widths that are an order of magnitude greater than the measured Br line-width of Feature i, but winds from such stars could help power turbulence and expansion of the ionized gas in the core. As a comparison, the SSC B1 in the Antennae overlap region has Br and H S(1) velocity dispersions of km s-1 and km s-1, respectively (Herrera & Boulanger, 2017) for a region with a Br FWHM size of 70 pc. Thus the Br velocity dispersion of the Feature i core is somewhat less than for SSC B1 in the Antennae but both have similar values of the H S(1) line-width.
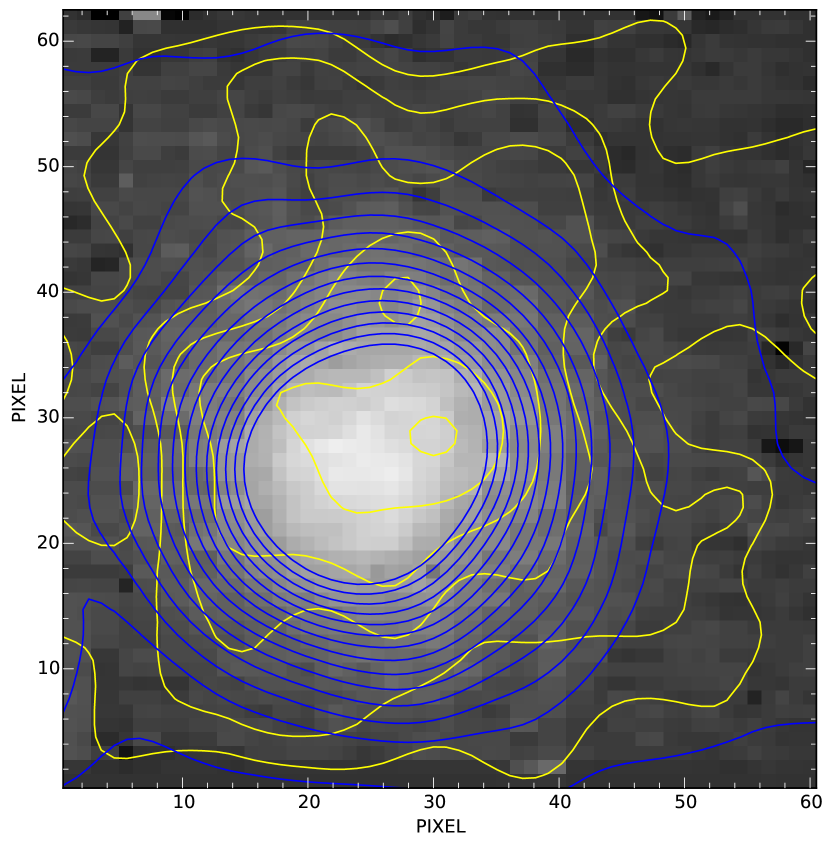
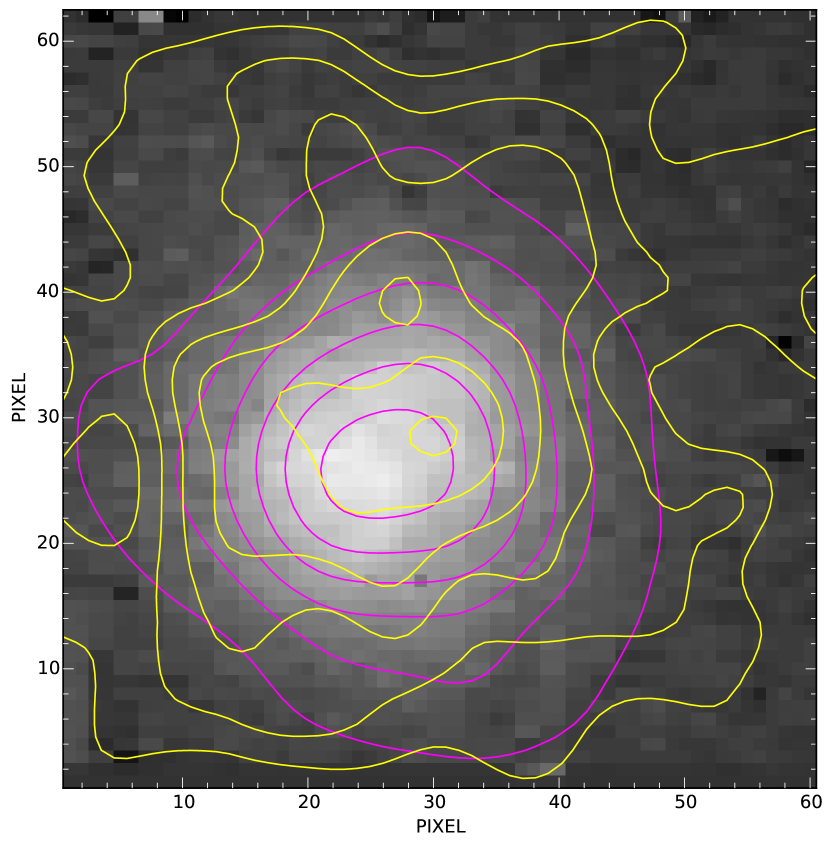
Figure 7 presents in greyscale the Br image rebinned to pixels with contours of Br, H S(1), and K-band continuum overlaid. The images have been smoothed with a 3 pixel smoothing kernel. From the Gaussian fits to the surface brightness distribution, the location of maximum surface brightness in H S(1) is displaced a minor amount, , northwest of the Br peak, but aside from this there is no strong difference between the spatial distributions of H S(1), Br emission, and K-band continuum.

We consider whether the ionized gas is bound to the central star complex. To estimate the escape velocity , we adopt from Mengel et al. (2002) the Virial relation
| (1) |
where is the projected half-light radius, the correction factor = 6 - 10 depends on the mass distribution, and is the cluster mass. For the central star complex we take as the geometric mean radius = 42 pc. The cluster mass is the sum of the stellar mass, , plus the mass of ionized gas within the star complex. In Section 6.3 below, we assume a Gaussian distribution of electron density in the Feature i core and find the total mass of ionized gas in the core . This is an upper limit to the mass of ionized gas within the star complex, so , and thus km s-1/ = 20 - 25 km s-1, which is somewhat less than the observed Br of 35 km s-1. We attribute the high velocity dispersion in the K-band spectral lines to a combination of high turbulence plus some expansion of the ionized gas. The shape of the Br line profiles provides no evidence of a one-sided outflow. Figure 8 displays the Br line profile, the Gaussian fit, and the residuals after subtracting the Gaussian fit at each position. The central panel is located at the Br peak, and the panels are spaced apart. This provides an upper limit of 22 km s-1 (the instrumental line-width) to a nonsymmetric outflow but does not rule out a spherical expansion of the ionized gas. Gaussian fits to the Br line profile at each position in the field show no systematic change in centroid wavelength or in line-width across the region, except that the line-widths may be slightly broader at the outskirts of the region where the S/N is worse.
We compare the measured value of the flux ) = erg s-1 cm-2, uncorrected for extinction, with that expected from ionized gas associated with the 0.6 Myr central star complex. Models by Sternberg et al. (2003) predict a Lyman continuum rate = s-1 for an instantaneous burst of star formation with cluster mass at age 0.6 Myr, i. e., the values of mass and age of the central complex that Elmegreen et al. (2017) find by adopting the same IMF (Salpeter with = 1 , = 120 ) as in Sternberg et al. (2003).
For the 35 Mpc distance of NGC 2207, the expressions in Condon (1992) give
| (2) |
where ) in erg s-1 cm-2 is extinction corrected, and no Lyman continuum photons are absorbed by dust or escape. With the above measured value of ), which is not corrected for extinction, = s-1 for = or s-1 for = 5000 K. Thus most of the observed Br flux may result from Lyman continuum photons emitted by the 0.6 Myr central star cluster. With equal 3.3 mag for this star complex, then = 0.112 would be 0.37 mag (a factor of 1.4 in flux). In the optical HST images, the central star complex is the only star complex in the core, but there may be other ionization sources hidden behind the dark cone.
| Data | deconvolved size | PSF | |
|---|---|---|---|
| (FWHM, PA) | (FWHM, BPA) | ||
| (mJy) | |||
| 1.49 GHza,ba,bfootnotemark: | 3.4 | , | |
| 4.86 GHza,ca,cfootnotemark: | 1.4 | , | |
| 4.86 GHzddvelocity dispersion corrected for instrumental line-width of 22 km s-1 at Br | , | , | |
| 88 GHz | , | , | |
| 100 GHz | , | , | |
| 106.4 GHz | , | , | |
| 8 µm | , |
Generic models by Black & van Dishoeck (1987) of the excitation of H2 lines [see also discussion by Rosenberg et al. (2013) and Doyon et al. (1994)] predict the flux ratios 2-1 S(1)/1-0 S(1) and 1-0 S(0)/1-0 S(1) should have values and , respectively, for excitation by UV radiation and and for excitation by collisions in shocks. For the H2 lines in the core of Feature i, the observed flux ratio of 2-1 S(1)/1-0 S(1) equals and the observed flux ratio of 1-0 S(0)/1-0 S(1) equals . These values indicate that excitation by UV radiation rather than by collisions in shocks is probably dominant in the core. The similarity between the spatial distributions of H S(1) and Br emission supports this interpretation.
The flux ratio of He I 2.06 µm to Br is an indicator of the effective temperature of the stars producing the ionization, although the ratio is also sensitive to the electron density , the dust content, and the geometry of the H II region (Doherty et al., 1995). In the Feature i core, this ratio has a value of 0.52, which is the maximum value in the model by Shields (1993) for = cm-3, and for that value of implies = K (Doherty et al., 1995). Although partly contaminated by a night sky line, the presence of the He II 2.04 µm line in the Feature i spectrum is indicative of high .
6.3 Radio and mm-wave Continuum
Table 7 lists the results of two-dimensional Gaussian fits to the continuum emission from the Feature i core at various frequencies. For the 4.86 GHz radio continuum observations in 2001 and the Spitzer 8 µm observations, both of which exhibit a bright core embedded extended emission, the Gaussian fits employ the sum of two Gaussians plus a flat baseline, and only the Gaussian characterizing the core is listed here. For the rest of the data sets, the fit consists of a single Gaussian plus a flat baseline. The core of Feature i is the brightest source in NGC 2207/IC 2163 in the 100 GHz continuum, radio continuum, and 8 µm emission, and all of the measurements in Table 7 get about the same value for its deconvolved FWHM, (170 pc 120 pc). In the 100 GHz continuum, the core has a major axis PA of , which differs considerably from the major axis PA of the 0.6 Myr central star complex in the HST images.
After convolving the 88 GHz, 100 GHz, and 106 GHz continuum images to the same synthesized beam, we compare their flux densities for the Feature i core and find an 88 GHz to 106 GHz spectral index . This rules out optically-thin heated dust which would have (Scoville et al., 2014) and free-free emission that is optically thick at 100 GHz (which would have ) as major source(s) of the emission at 100 GHz. We infer that at 100 GHz the main contributor to the flux density of the core is free-free emission that is optically-thin at 100 GHz plus a contribution from nonthermal emission.
We need to reconcile the radio continuum and 100 GHz continuum flux densities of the Feature i core with the Br flux. Based on the relations in Condon (1992) between optically-thin free-free flux density and ) for H II regions, we find that if = 5000 K the measured value of ) uncorrected for extinction corresponds to (100 GHz) = mJy. Allowing for some extinction at Br, this is the minimum to be consistent with ), and thus at least 67% of the 100 GHz flux density from the Feature i core needs to be optically-thin free-free emission. We rule out K as otherwise the total (100 GHz) of the core would be too small to account for the measured Br flux.
In Table 7 the 1986 radio continuum observations by Vila et al. (1990) are a VLA scaled-array pair. Since for the core they measured (4.86 GHz) = 1.4 mJy and a radio spectral index = (whereas optically-thin free-free emission would have = ), the issue is how to get (100 GHz) mJy. We propose two types of ad hoc solutions: either (a) short term variability of the nonthermal radio component with a decrease in the nonthermal component between March 1986 (when the 1.49 GHz emission was observed) and August 1986 (when the 4.86 GHz emission was observed), or (b) the presence of a component whose free-free emission is optically thick (and thus largely hidden) at 4.86 GHz but optically thin at 100 GHz. The actual explanation may be a combination of (a) and (b). In both cases, the nonthermal emission at 100 GHz may contain a contribution from nonthermal sources not detected at 4.86 GHz because of absorption.
Evidence for radio continuum variability of the core is the 1.26 mJy increase in its (4.86 GHz) between 1986 and 2001. Although this may have been a radio SN (Kaufman et al., 2012), it could have been some other type of energetic outburst. In Section 4.3, we argued that the possible ULX detected by Mineo et al. (2014) nearly coincident with the radio continuum peak could be an intermediate black hole because of the high extinction at that location. If so, it could serve as a source of short-term radio variability.
If variability of the nonthermal radio component in 1986 is the answer, we present the following example of how to satisfy (100 GHz) mJy. We assume that the free-free emission is optically-thin for GHz. If (4.86 GHz) were 1.24 mJy, then (1.49 GHz) would be 1.40 mJy, and (100 GHz) would be 0.92 mJy, close to the minimum free-free flux density necessary if 5000 K. Then with an adopted spectral index = for the nonthermal component, this would require the value of (1.49 GHz) to have decreased from the observed 3.4 mJy in March 1986 to 1.9 mJy in August 1986 and the value of (4.86 GHz) to have decreased from 2.1 mJy in March 1986 to the observed 1.4 mJy in August 1986. Approximately the same changes in (1.49 GHz) and (4.86 GHz) between March and August would suffice to give (100 GHz) = 0.92 mJy if were , or we could allow to vary between the two dates.
Alternatively, if the nonthermal radio flux densities did not vary between March 1986 and August 1986, we propose that some part of (100 GHz) arises from a component that is optically thick at 4.86 GHz but optically thin at 100 GHz. We extrapolate the flux densities from 4.86 GHz to 100 GHz by assuming the measured (100 GHz) of the core has the following components:
| (3) |
where is nonthermal emission, is emission that is optically-thin free-free at 4.86 GHz and at 100 GHz, and is from an hypothesized group of ultra-dense H II regions (UD HII regions) that are optically-thick at 4.86 GHz but optically-thin at 100 GHz, with turnover frequency (at which =1). Kobulnicky & Johnson (1999) use the term UD HII region for the massive analog of an ultra-compact H II region. The UD HII regions in Feature i would be analogous to the four UD HII regions in Henize 2-10 studied by Johnson & Kobulnicky (2003).
Table 8 provides examples yielding (100 GHz) = 1 mJy for two different choices of (4.86 GHz), 0.7 mJy and 0.3 mJy [50% and 21%, respectively, of the observed (4.86 GHz) in 1986] and two different choices of , 10 GHz and 20 GHz. For free-free emission, the optical depth [where the factor is from Mezger & Henderson (1967)] and . This gives the values of (4.86 GHz), (4.86 GHz), and the emission measure of the dense component listed in Table 8. Subtracting the diffuse and dense components of the free-free emission from the total flux densities measured in 1986 produces the values of (4.86 GHz) and . For the set of examples in Table 8, the nonthermal emission detected at 4.86 GHz in 1986 contributes, at most, 4.6% of the measured (100 GHz).
| Property | Values | |||
|---|---|---|---|---|
| (4.86 GHz) (mJy) | 0.70 | 0.70 | 0.30 | 0.30 |
| (GHz) | 10 | 20 | 10 | 20 |
| (100 GHz) (mJy) | 0.52 | 0.52 | 0.22 | 0.22 |
| (100 GHz) (mJy) | 0.48 | 0.48 | 0.78 | 0.78 |
| (4.86 GHz) | 4.64 | 20.5 | 4.64 | 20.5 |
| (4.86 GHz) (mJy) | 0.16 | 0.04 | 0.26 | 0.06 |
| ( pc cm-6) | ||||
| (4.86 GHz)aaVLA scaled-array pair observations in 1986 by Vila et al. (1990) (mJy) | 0.54 | 0.66 | 0.84 | 1.04 |
If the (4.86 GHz) were from a single spherical UD HII region with uniform electron density , then for the Table 8 examples, the UD HII region would have a radius of 5.3 pc - 2.0 pc and a proton column density of cm-2. Unless the dust-to-gas ratio is low within the UD HII region, the large values of imply the UD HII would have appreciable extinction in K-band. The free-free optical depth depends differently on density than the visual extinction does. Hence a group of UD HII regions that are flattened along line-of-sight with a nonuniform electron density and with the same values of and (4.86 GHz) as in Table 8 would have a lower K-band extinction than the single uniform sphere example.
To calculate the total mass of ionized gas in the core, we take (100 GHz) mJy for the core, assume a Gaussian distribution of electron density, and apply Equation A.14 of Mezger & Henderson (1967). The result is an H II mass of for the core.
We offer the following comment about warm dust emission at 100 GHz. Yang & Phillips (2007) obtain a median dust temperature = K for 18 nearby LIRGs, and Wild et al. (1992) get = 45 K for the bulk of the ISM in the M82 starburst. Suppose warm dust contributes 7% (i.e., 0.1 mJy) of the measured (100 GHz) of the Feature i core with = 45 K for the bulk of the ISM. Scaling Equation (12) of Scoville et al. (2014) to =45 K then gives a core ISM mass of . For the core, the CO flux density implies a molecular mass after including helium of with a -diameter aperture (twice the geometric mean of the CO HPBW), and part of this molecular mass resides in the dark cone, so not in the disk. Therefore an upper limit to the sum of the molecular plus H II mass of the core is . Either the contribution of warm dust emission to (100 GHz) is less than 0.1 mJy or the H I mass of the core is at least comparable to its H II mass.

7 The Dark Dust Cone and Internal Kinematics of Feature I in Cold Gas
7.1 Measured Velocities
We consider whether there is kinematical evidence for the suggestion in Section 5 that the CO emission along the opaque dust cone is from gas outflowing perpendicular to the disk at Feature i. To get this gas in front of the midplane (relative to us), it needs to have a velocity component in our direction, and thus the CO emission from the dark cone should be blueshifted relative to the rest of Feature i.
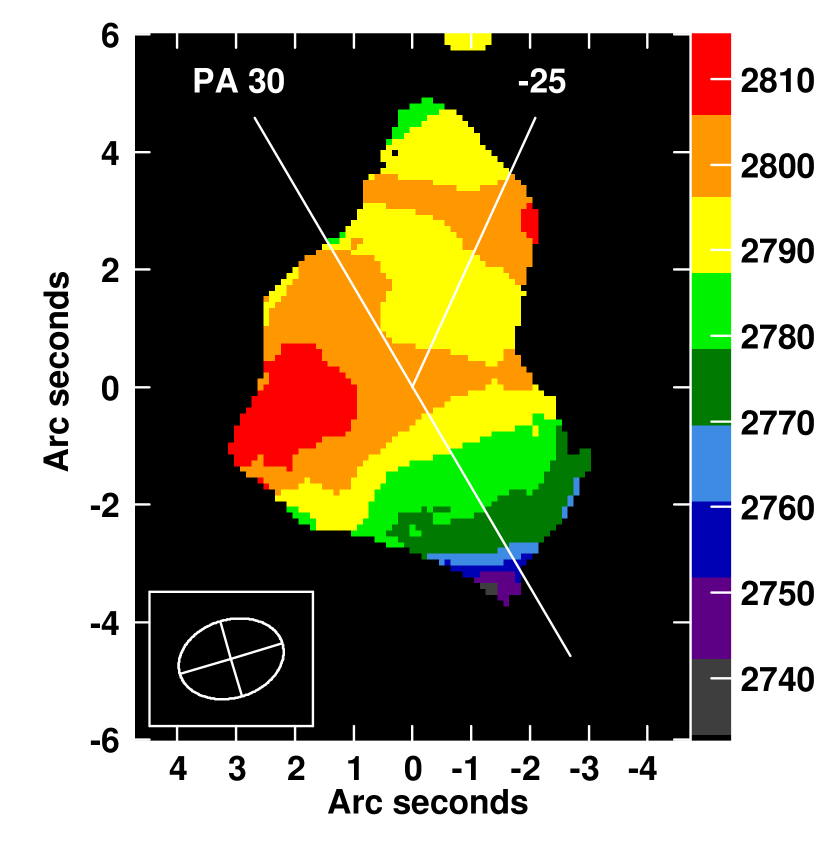
Figure 9 displays the intensity-weighted velocity field (first moment image) from the CO Combined data. The channel width is 4.87 km s-1; this implies a velocity uncertainty of km s-1. Because Feature i is a two-lobed source in CO, the velocity field is complex. Figure 9 reveals that the velocity along the dark cone is blueshifted relative to the rest of Feature i. Using a -diameter aperture (to approximate the synthesized beam area) centered along the dark cone (PA = ) at a distance of from the radio peak, we find the mean value of is blueshifted by 18 km s-1 relative to its value at the radio peak.


Figure 10 displays 12CO spectra of the core from the unmasked CO Cycle 2 data. The central panel is located at the radio continuum peak, the panels are spaced apart, and each individual line-profile is an average over a box. Some of these line profiles, exhibit an asymmetry or hint of more than one component. Thus some of the velocity dispersion in the cold molecular gas may result from outflows or a blending of components rather than turbulence. From a Gaussian fit to the CO line profile at the radio peak, the FWHM line-width corrected for the velocity resolution is km s-1 [i.e., km s-1]. [With the unmasked CO Combined data, the Gaussian fit gives a slightly greater value of km s-1 for the corrected FWHM line-width.] In the velocity dispersion (second moment) image, the velocity dispersion at the radio peak is 15 km s-1 and in the box displayed in this figure, the average = km s-1. Recall from Section 6.2 that Br and the warm molecular gas traced by the infrared H S(1) lines have greater line-widths than this with = 35 km s-1 and 27 km s-1, respectively, and that the spatial distribution of ionized and warm molecular gas is quite different from that of the cold molecular gas.
Figure 11 displays position-velocity diagrams: the top panel is from the CO Cycle 2 data and the bottom panel from the CO Combined data. Both are centered on the radio peak and oriented along the dark cone at PA = . On the abscissa, negative values of the plane-of-sky displacement are on the dark cone; positive values of are on the opposite side of the radio peak. The CO Combined cube in the bottom panel reveals that the CO emission along the dark cone is present to = , consistent with the length of the visually opaque cone.
Because of its higher spatial resolution, the top panel of Figure 11 provides important detailed information, and the rest of our discussion here is based on it. Its two brightest emission knots are (CO) = 46 mJy beam-1 at = and (CO) = 45 mJy beam-1 at = . Each of these two molecular clumps bounding the ionized region in the core has a velocity of 2784 km s-1, which we adopt as the disk velocity.
Most of the emission along the dark cone (negative values of ) is blueshifted relative to this disk velocity. There are two outflow components to the CO emission from Feature i: (1) an approaching outflow component (labelled A in Figure 11) along the dark cone, and (2) a receding outflow component (labelled B) on the opposite side of the radio peak. Relative to the disk velocity, Component A is blueshifted by 11 km s-1 at the 8 contour level and by 16 km s-1 at the 6 contour level. For = 0 to , its ouflow velocity appears roughly constant. Component B is redshifted by 20 km s-1 at the 8 level and by 25 km s-1 at the 6 level relative to the disk velocity. Its outflow velocity decreases with distance from the center for =0 to . Since, compared to the Component A, Component B does not extend as far and has a greater magnitude outflow velocity, we infer it is from more recent outburst than A. The difference in outflow velocities on the two sides of the radio peak explains why the intensity-weighted velocity at the radio peak is somewhat greater than the disk velocity based on the position-velocity diagram.
There is other evidence of outflowing cold molecular gas on the far side of the Feature i core. The detected HCO+ emission lies roughly along the left fork of the red V, i. e., on the opposite side of the radio peak from the dark dust cone. Restricting to positions where ) exceeds (2 channel widths), we find that along the left fork of the red V from = to , the HCO+ velocity field has a redshift of 8 to 16 km s-1 relative to the CO disk velocity of 2784 km s-1, and thus HCO+ is also participating in a redshifted outflow on the northeastern side of the radio peak.
The southwestern lobe of CO emission (CO lobe II in Figure 5) coincides with and has about the same length as the visually opaque dust cone. Attributing the blueshifted CO gas (Component A) along the dark cone to an outflow on the near side of the core is the only way to get enough cold molecular gas in front of the disk (relative to us) to explain the high of the opaque cone. For the redshifted gas (Component B) an outflow on the far side of the core is not the only possible interpretation as there could be noncircular motions in the disk (e.g., due to the spiral arm), but its location diametrically opposite the dark cone (see Figure 6) suggests that it is also an outflow.
Our H I data have too low a spatial resolution () for measuring outflows from the Feature i core. Instead we compare H I velocities (Elmegreen et al., 1995a) and CO velocities (from the 2014 observations) averaged over a -diameter aperture centered on the Feature i core: the mean velocity rms scatter is km s-1 in H I and km s-1 in CO. Feature i is located in the large area of NGC 2207 that has very broad and asymmetric H I line profiles. Averaged over the -diameter aperture centered on Feature i, , the velocity dispersion corrected for the velocity gradient across the HPBW, is km s-1 in H I and km s-1 in CO.
7.2 Source of Outflows
We consider what powered the outflow of cold molecular gas to create the optically-opaque dust cone extending from the center of the core. On the assumption that supernovae and stellar winds from O and WR stars integrated over their lifetimes supply the necessary mechanical energy, we estimate the SFR in the core required to produce the observed line-of-sight outflow velocities of the swept-up mass in the dark cone. The 0.6 Myr central star complex produces ionization and contributes to expansion of the H II region but is too young to provide most of the mechanical energy of the outflow or to account for the observed variable radio emission or the length of the dark cone. Since it is too young to have hosted a supernova, it is not a source of the cosmic ray electrons necessary for the observed nonthermal radio emission. The 0.6 Myr star complex is the only star complex in the core detected in B-band, but older star complexes (up to 60 Myr) are found elsewhere in Feature i. We conjecture that in the core there were previous generations of star formation whose optical emission is now hidden behind the high extinction near the radio continuum peak.
We assume the dark cone is perpendicular to the Feature i disk and adopt the following notation: is the inclination of the disk at Feature i, = is the perpendicular height of the dark cone above this disk, is the observed line-of-sight component of the outflow velocity, and = is the component of the outflow velocity perpendicular to this disk. For the calculations below of the required mechanical energy, we adopt as representative values = -13 km s-1 on the dark cone and +23 km s-1 on the opposite side of the radio peak.
7.3 Required Mechanical Energy and SFR
Simulations by Ceverino et al. (2012) of clumps with masses in disk galaxies find that because angular momentum is approximately conserved during the clump’s contraction, the spin vector of such a massive clump is generally aligned with the angular momentum vector of the disk in the clump’s neighborhood. Since the total mass in gas of Feature i lies in this range, their results should apply to Feature i. If we neglect a possible warp of the NGC 2207 disk at Feature i and take = of central disk of NGC 2207 = , then = km s-1 on the dark cone and 28 km s-1 on the opposite side. These are low velocity outflows, but the outflow velocities would have decreased as the molecular gas traveled away from the sources because of (a) the local potential well of the Feature i core, and (b) mass loading as the outflowing gas entrains surrounding gas; of bulk motion , where is the swept-up mass.
To estimate the mass of the outflowing molecular gas in the dark cone, we restrict our measurement to emission with velocities 2774 km s-1 in the CO Cycle 2 cube and sum the emission in the quadrant southwest of the radio peak. After correcting for helium, this gives = . Of this mass, 36% lies on the dark cone at from the radio peak, 25% at , and only 4% at . With = and = 16 km s-1, the estimated kinetic energy of bulk motion = ergs for the dark cone. For the redshifted outflow on the far side of the core, the value of is higher by a factor 3, but it is less extensive and its mass is unknown. On the assumption that of the redshifted outflowing gas on the far side is comparable to that of the dark cone, the cumulative effect of supernovae and stellar winds in the core needs to produce a total of roughly ergs to power both outflows. Since according to Castor et al. (1975) the amount of mechanical energy injected into the ISM by stellar winds from a single high mass star integrated over its lifetime is comparable to that from a core-collapse supernova, we attribute half of this to supernovae.
We consider whether the SFR in the core of Feature i can achieve the required value of . Only about 0.1% of the energy of a supernova remains as of bulk motions by the time the material has reached a few tens of pc from the explosion (Martizzi et al., 2015); see also Iffrig & Hennebelle (2017). Therefore to get a of roughly ergs in this kind of wind from SNe requires at least supernovae. Since it is hard to gather energy over more than 5 - 10 Myr because of the lifetimes of the progenitor stars of core-collapse supernovae and the crossing times, we need to have at least SNe occur in a time interval less than 10 Myr, if both the blueshifted and the redshifted outflows originated within the same 10 Myr period. A standard IMF gives about one supernova for every 100 of stars formed, so we would need a SFR yr-1 over 10 Myr to account for both outflows (or 0.1 yr-1 to account for just the dark cone). Using a diameter aperture, Smith et al. (2014) find the SFR of Feature i is 1.7 yr-1 from the H and 24 µm luminosities (sensitive to the SFR over the past 10 Myr) and 1.5 yr-1 from 24 µm and NUV (sensitive to the SFR over a longer timescale). The distributions of mm-wave continuum, radio continuum, and 8 µm emission imply that a significant fraction of this SFR occurs in the core, e. g., the core contributes 40% of the 8 µm flux. Thus it should be possible to satisfy the energy constraints with star formation at the current rate over 10 Myr.
We have not ruled out the possibility that nonthermal sources other than supernovae may also contribute to the mechanical energy.
For the CO outflow associated with the dark cone, CO emission is detected to a perpendicular height kpc above the disk, and the molecular mass at pc is . For this outflow at = is 590 pc, and the time required for the molecular gas to travel from = to = with a constant speed of 16 km s-1 would be 18 Myr.
In the encounter model by Elmegreen et al. (1995b) which reproduces the observed S-shape of the isovelocity contours in NGC 2207, the tidal force exerted by IC 2163 causes a warp of the outer disk of NGC 2207 with the northwestern part of NGC 2207 bent more towards us. If at Feature i the disk is warped with of the NGC 2207 central disk, then and the required would be greater than in the unwarped disk case. If, averaged over 10 Myr, the SFR in the core powering just the dark cone outflow were 0.2 yr-1 instead of 0.1 yr-1 used above, then with the same arguments as above, would be 23 km s-1 on the dark cone. With = 13 km s-1, this gives = , and, assuming the warp has the same tilt axis as the central disk of NGC 2207, a galaxy warp at Feature i of = . Then for the dark cone, at = would be 400 pc, and the time required for the molecular gas to travel from = to = with a constant speed of 23 km s-1 would decrease to 9 Myr.
8 Possible Origin of Feature i
Since Feature i is an unusually active region, the question is how did it originate. The models by Struck et al. (2005) for the encounter between NGC 2207 and IC 2163 did not produce the spiral arms of NGC 2207. As discussed in some detail in that paper, this is because the encounter is retrograde with respect to NGC 2207, and thus the cumulative tidal forces on NGC 2207 are relatively weak. These models find that pre-existing spiral arms in NGC 2207 are not destroyed by the interaction, but there are two strong effects that can impact the arms.
In the primary model of Struck et al. (2005), IC 2163 approaches NGC 2207 on the western side and swings around the outer edge of the NGC 2207 disk to its present position on the eastern side. As pointed out by Struck et al. (2005), a significant amount of mass is pulled off IC 2163 and captured onto the disk of NGC 2207. However, most of this mass transfer occurs in a short time interval about halfway through the encounter and falls onto a different part of the disk than where Feature i is subsequently located. By the time the future Feature i passes closest to the transfer stream, the amount of mass transferred is much smaller, so it seems unlikely to trigger the most active region in the disk.
Struck et al. (2005) did not mention a second effect, which arises from the fact that IC 2163 pulls the nearest parts of the NGC 2207 disk backwards, against the orbital flow. The loss of angular momentum compresses the disk. Elmegreen et al. (1995a) find that, aside from the spiral arms, the radial brightness profile in B and R on the western side of NGC 2207 is relatively flat for radial distances to , corresponding to the 8 kpc-wide H I ring, and drops off steeply beyond (i. e., a little beyond Feature i). This unusually flat radial profile with a sharp cutoff is evidence for the compression of the disk resulting from loss of angular momentum. The compression and associated velocity gradients can produce or enhance clumpiness. In NGC 2207 five of the six very massive H I clouds, each with H I mass in excess of , lie on the western or eastern portions of the H I ring/partial ring (see Figure 1). Although these massive H I clumps are likely to result, in part, from the bead instability of rings, the radial gradient in the angular momentum loss may have played a role in increasing their mass, either directly or by increasing the H I velocity dispersion and thus the gravitational Jeans mass. Feature i lies on the spiral arm somewhat beyond the massive H I clouds N2 and N3 (see Figure 1). We speculate that at the location where Feature i subsequently developed, there was a large H I clump on the pre-existing spiral arm, and the radial gradient in angular momentum loss created an inward crashing gas stream from the outer disk that hit the spiral arm at this clump as the disk of NGC 2207 rotated clockwise. The two intersecting flows enhanced the mass and density of the clump and triggered the starburst that became Feature i.
9 Conclusions
New ALMA 12CO , HCO+, and 100 GHz continuum observations and Gemini NIFS K-band spectra are presented and combined with previous HST optical, radio continuum, Spitzer, and H I data to study Feature i, a starburst clump on an outer arm of the interacting galaxy NGC 2207. Feature i has one of the highest star formation rates among the set of 1700 star forming complexes in interacting galaxies or normal spirals measured by Smith et al. (2016). In its grazing collision with IC 2163, NGC 2207 suffered a retrograde encounter, which caused loss of angular momentum and compression of its outer disk. The double compression from the inward flowing gas intersecting with an H I clump on the pre-existing spiral arm may have produced Feature i.
One of the two CO emission lobes in Feature i coincides with an optically-opaque dust cone extending a plane-of-sky distance pc from the center of its 170 pc core. Our H I data have too low a spatial resolution for identifying this structure in H I. The CO column density can account for the dark cone extinction beyond the core only if almost all the gas and dust along the cone is on the near side (relative to us) of the NGC 2207 disk. In CO we find two outflows of cold molecular gas, which we assume is streaming perpendicular to the galaxy disk: a) along the dark cone an approaching outflow (consistent with the extinction argument) with velocity perpendicular to the disk km s-1 and an estimated molecular mass , and b) on the opposite side, a receding outflow (also detected in HCO+) at km s-1, but less extensive and of unknown mass. For the dark cone, the kinetic energy of bulk motion, ergs, can be supplied by supernovae and the stellar winds of high mass stars in the core if star formation at the observed rate is integrated over 10 Myr. If the NGC 2207 disk is not warped at Feature i, then the outflow along the dark cone is detected in CO to a height of kpc above the disk.
The core contains a star complex with an age of 0.6 Myr. The measured Br flux of the core is consistent with that expected from this complex without requiring a top-heavy or otherwise unusual IMF. The Br and ro-vibrational H2 lines have FWHM linewidths of 82 km s-1 and 64 km s-1, respectively, probably a combination of high turbulence plus some expansion of the ionized gas. The symmetry of the Br line profile provides an upper limit of 22 km s-1(the instrumental line-width) to any (asymmetric) outflow of ionized gas.
In 2001, the cm radio continuum flux density of the core was nearly double that in 1986, indicative of either a radio SN or some other type of energetic outburst. The possible ULX detected by Mineo et al. (2014) is nearly coincident with the radio continuum peak. Because of the very high extinction at that location, the measured X-ray flux of the ULX could be consistent with an intermediate mass black hole. Short-term radio variability associated with an intermediate mass black hole would make it easier to reconcile the measured Br flux with the cm radio continuum flux density measured in 1986.
Our new observations combined with our own multispectral data set and data from the literature reveal Feature i to be a heavily obscured region of intense activity on an outer spiral arm. Given the mass of cold gas in Feature i, its precusor may have been analogous to the massive ( - ) H I clouds found in regions of high H I velocity dispersion in NGC 2207/IC 2163 and other galaxies undergoing close encounters (Kaufman et al., 1999). Some of the usual sites of highly luminous extra-nuclear star-forming clumps in large galaxies are (a) the overlap regions in galaxy mergers, e.g., the Antennae (Gilbert & Graham, 2007), (b) the hinge clumps produced by the multiple converging flows near the base of a tidal tail in prograde encounters, e.g., Arp 240 (Smith et al., 2014), and (c) the expanding ring of a collisional ring galaxy, e.g., the Cartwheel galaxy (Higdon, 1995). Feature i illustrates that galaxies suffering close retrograde encounters in which loss of angular momentum by the outer disk causes disk contraction can also trigger the formation of a highly luminous star-forming clump under suitable conditions, e.g., if the gradient in angular momentum loss by the outer disk creates an inward crashing stream that collides with a massive H I cloud as it is being compressed by a spiral density wave.
References
- Baan et al. (2008) Baan, W.A., Henkel, C., Loenen, A.F., Baudry, A., & Wiklind, T. 2008, A&A, 477, 747
- Bigiel et al. (2008) Bigiel, F., Leroy, A.K., Walter, F., et al. 2008, AJ, 136, 2846
- Bigiel et al. (2015) Bigiel, F., Leroy, A.K., Blitz, L., et al. 2015, ApJ, 815, 103
- Bigiel et al. (2016) Bigiel, F., Leroy, A.K., Jimenez-Donaire, M.J., et al. 2016, ApJ, 822, L26
- Black & van Dishoeck (1987) Black, J.H. & van Dishoeck, E.F. 1987, ApJ, 322, 412
- Bohlin et al. (1978) Bohlin, R., Savage, B., & Drake, J. 1978, ApJ, 224, 132
- Bolatto et al. (2013) Bolatto, A.D., Wolfire, M., & Leroy, A.K. 2013, ARA&A, 51, 207
- Castor et al. (1975) Castor, J., McCray, R., & Weaver, R. 1975, ApJ, 200, L107
- Ceverino et al. (2012) Ceverino, D., Dekel, A., Mandelker, N., et al. 2012, MNRAS, 420, 3490
- Condon (1992) Condon, J.J. 1992, ARA&A, 30, 575
- Costagliola et al. (2011) Costagliola, F., Aalto, S., Rodriguez, M.I., et al. 2011, A&A, 528, 30
- Dame et al. (2001) Dame, T.M., Hartmann, Dap., & Thaddeus, P. 2001, ApJ, 647, 792
- Doherty et al. (1995) Doherty, R.M., Puxley, P..J., Lumsden, S.L., et al., 1995, MNRAS, 277, 577
- Doyon et al. (1994) Doyon, R., Wright, G.S., & Joseph, R.D. 1994, ApJ, 421, 115
- Elmegreen et al. (1993) Elmegreen, B.G., Kaufman, M., & Thomasson, M. 1993, ApJ, 412, 93
- Elmegreen et al. (1995b) Elmegreen, B.G., Sundin, M., Kaufman, M., Brinks, E., & Elmegreen, D.M. 1995b, ApJ, 453, 139
- Elmegreen et al. (2000) Elmegreen, B.G., Kaufman, M., Struck, C., et al. 2000, AJ, 120, 630.
- Elmegreen et al. (2016) Elmegreen, B.G., Kaufman, M., Bournaud, F., et al., 2016, ApJ, 423, 26
- Elmegreen et al. (1995a) Elmegreen, D.M., Kaufman, M., Brinks, E., Elmegreen, B.G., & Sundin, M. 1995a, ApJ, 453, 100
- Elmegreen et al. (2001) Elmegreen, D.M., Kaufman, M., Elmegreen, B.G., et al. 2001, AJ, 121, 182
- Elmegreen et al. (2006) Elmegreen, D.M., Elmegreen, B.G., Kaufman, M., et al. 2006, ApJ, 642, 158
- Elmegreen et al. (2017) Elmegreen, D.M., Elmegreen, B.G., Kaufman, M. et al. 2017, ApJ, 841, 43
- Gilbert & Graham (2007) Gilbert, A.M. & Grapham, J.R. 2007, ApJ, 668, 168
- Herrera & Boulanger (2017) Herrera, C.N. & Boulanger, F. 2017, A&A, 600, A139
- Higdon (1995) Higdon, J.L. 1995, ApJ, 455, 524
- Iffrig & Hennebelle (2017) Iffrig, O. & Hennebelle, P. 2017, A&A, 604, A70
- Irwin (1994) Irwin, J.A. 1994, ApJ, 429, 618
- Johnson & Kobulnicky (2003) Johnson, K.E. & Kobulnicky, H.A. 2003, ApJ, 597, 923
- Juneau et al. (2009) Juneau, S., Narayanan, D.T., Shirley, Y.L., et al. 2009, ApJ, 707, 1217
- Kaufman et al. (1997) Kaufman, M., Brinks, E., Elmegreen, D.M. et al. 1997, AJ, 114, 2323
- Kaufman et al. (1999) Kaufman, M., Brinks, E., Elmegreen, B.G., et al. 1999, AJ, 118, 1577
- Kaufman et al. (2012) Kaufman, M., Grupe, D., Elmegreen, B.G., et al. 2012, AJ, 144, 156
- Kepley et al. (2014) Kepley, A., Leroy, A., Frayer, D., et al. 2014, ApJ, 780, L13
- Kobulnicky & Johnson (1999) Kobulnicky, H.A. & Johnson, K.E. 1999, ApJ, 527, 154
- Krips et al. (2008) Krips, M., Neri, R., Garcia-Burillo, S., et al. 2008, ApJ, 677, 262
- Madau (1988) Madau, P. 1988, ApJ, 327, 116
- Martizzi et al. (2015) Martizzi, D., Faucher-Giguere, C-A., & Quataest, E. 2015, MNRAS, 450, 504
- Mengel et al. (2002) Mengel, S., Lehnert, M.D., Thatte, N. et al. 2002, A&A, 383, 137
- Mezger & Henderson (1967) Mezger, P.G. & Henderson, A.P. 1967, ApJ, 147, 471
- Mineo et al. (2014) Mineo, S., Rappaport, S., Levine, A. et al. 2014, ApJ, 797, 91
- Rosenberg et al. (2013) Rosenberg, M.J.F., van der Werf, P.P. & Israel, F.P. 2013, A&A, 550, A12
- Rupke et al. (2010) Rupke, D., Kewley, L., & Chien, L.-H. 2010, ApJ, 723, 1255
- Ruszkowski & Begelman (2003) Ruszkowski, M. & Begelman, M.C. 2003, ApJ, 586, 384
- Scoville et al. (2014) Scoville, N., Aussel, H., Sheth, K. et al. 2014, ApJ, 783, 84
- Shields (1993) Shields, J.C. 1993, ApJ, 419, 181
- Smith et al. (2014) Smith, B.J., Soria, R., Struck, C., et al. 2014, AJ, 147, 60
- Smith et al. (2016) Smith, B.J., Zaragoza-Cardiel, J., Struck, C., et al. 2016, AJ, 151, 63
- Sternberg et al. (2003) Sternberg, A., Hoffmann, T.L., & Pauldrach, W.A. 2003, ApJ, 599, 1333
- Struck et al. (2005) Struck, C., Kaufman, M., Brinks, E. et al. 2005, MNRAS, 364, 69
- Usero et al. (2015) Usero, A., Leroy, A.K, Walter, F., et al. 2015, AJ, 150, 115
- Vila et al. (1990) Vila, M.B., Pedlar, A., Davies, R.D., Hummel, E., & Axon, D.J. 1990, MNRAS, 242, 379
- Wetzstein et al. (2007) Wetzstein, M., Naab, T., & Burkert, A. 2007, MNRAS, 375, 805
- Wild et al. (1992) Wild, W., Harris, A.I., Eckart, A., et al. 1992, A&A, 265, 447
- Yang & Phillips (2007) Yang, M. & Phillips, T. 2007, ApJ, 662, 284