Anisotropy of the Upper Critical Field in the Heavy-Fermion Superconductor UTe2 under Pressure
Abstract
We studied the anisotropy of the superconducting upper critical field in the heavy-fermion superconductor UTe2 under hydrostatic pressure by magnetoresistivity measurements. In agreement with previous experiments we confirm that superconductivity disappears near a critical pressure GPa, and a magnetically ordered state appears. The unusual at low temperatures for suggests that the multiple superconducting phases which appear under pressure have quite different . For a field applied along the hard magnetization axis is glued to the metamagnetic transition which is suppressed near . The suppression of with pressure follows the decrease of temperature , at the maximum in the susceptibility along . The strong reinforcement of at ambient pressure for above 16 T is rapidly suppressed under pressure due to the increase of and the decrease of . The change in the hierarchy of the anisotropy of on approaching points out that the axis becomes the hard magnetization axis.
In many strongly correlated electron systems unconventional superconductivity (SC) appears close to a quantum phase transition where a long range ordered phase is suppressed by tuning a control parameter of the system such as pressure, doping, or charge carrier number.[1, 2] It is believed that the enhancement of the magnetic and electronic fluctuations are the glue for the superconducting pairing. This has been most impressively shown for ferromagnetic superconductors such as URhGe and UCoGe, where the pairing strength itself can be tuned by the magnetic field [3, 4, 5]. A magnetic field applied along the easy magnetization axis of these orthorhombic systems lowers the superconducting pairing, while a magnetic field applied along the hard magnetization axis enhances the superconducting pairing strength as the field drives the system to a collapse of the ferromagnetism. This enhancement of the pairing strength for results in the reentrance of SC in the field range of 9 T - 12 T in URhGe [6] and an enhancement of SC in UCoGe.[7] The strong internal exchange field in these ferromagnetic superconductors and the extremely high ratio of the upper critical field compared to the superconducting transition temperature imposes a non-unitary spin triplet state with equal spin pairing (ESP) which is a superconducting state very rarely realized in bulk materials.
Recently the superconducting state below K of the paramagnetic heavy fermion compound UTe2 has also been proposed to be a spin triplet superconductor.[8, 9] Evidence for this is obtained from the very large and strongly anisotropic , which is 6 T for the field applied along the easy magnetization axis , 11 T for the -axis but is extremely field-enhanced up to 35 T for field along the hard magnetization -axis (exceeding by far the Pauli limitation for a singlet superconductor). Above 35 T, where a metamagnetic transition with a huge jump of the magnetization occurs,[10, 11] SC is abruptly suppressed. An additional singularity of UTe2 is that under pressure multiple superconducting phases occur.[12] is initially linearly suppressed with pressure, but for GPa two specific heat anomalies are observed and the upper superconducting anomaly increases up to 3 K while the lower continues decreasing in temperature. In that experiment SC is suppressed near 1.7 GPa and a new magnetically ordered phase appears. The increase of by a factor of 2 compared to the the ambient pressure value and the collapse of the superconducting regime near 1.7 GPa has been confirmed by resistivity experiments.[12, 13, 14]
In the present work we concentrate on the anisotropy of under pressure. First we present the pressure dependence of the susceptibility. We show that (i) for is unusally enhanced at low temperature, (ii) for the superconducting phase is suppressed at a metamagnetic transition, which decreases in field by increasing pressure, and (iii) the upper critical field for crosses that for for GPa. This could be related to a change in the magneto-cristalline anisotropy and we speculate that the axis becomes the hardest magnetization axis at high pressure.
Single crystals of UTe2 have been grown by the chemical vapor transport method as described previously, in Grenoble and in Oarai.[9, 15] High pressure susceptibility measurements have been performed in a Quantum design MPMS using a specially designed Cu-Be piston cylinder cell. For the resistivity experiments under pressure in Grenoble, a several millimeter long needle-like single crystal has been cut in three pieces and mounted in a piston cylinder cell. So field could be applied on different parts of the same crystal along the , , and axes. The current was injected along the field direction for while for the other directions the current is perpendicular to the field. The measurements have been performed in a Quantum design PPMS (maximal field 9 T) and a dilution refrigerator ( T). In parallel, high pressure experiments have been performed in Oarai using an Oxford top-loading dilution refrigerator ( T). Results from experiments in Grenoble and Oarai are very similar, except that the samples used in Oarai have a slightly higher under pressure. In addition we performed, at selected pressures, measurements up to 30 T in the high field laboratory in Sendai using 3He and 4He cryostats.
In Fig. 1(a) we show the magnetic susceptibility as for a field of 1 T applied along the axis as a function of temperature for different pressures up to 0.9 GPa. At zero pressure, the susceptibility has a maximum at K, slightly lower than outside the pressure cell. At zero pressure is linked to the metamagnetic transition at T. [10, 16] It shows that the same energy scale is responsible for the formation of a correlated electronic regime in zero magnetic field and pushes the system under magnetic field to a metamagnetic transition[17]. In UTe2 a huge jump of the magnetization is observed at at , while the susceptibility is almost unchanged below and above . The maximum of the susceptibility decreases under pressure, and at 0.9 GPa we find 20 K. The absolute value of at low temperature is inversely proportional to and increases under pressure [see Fig. 1(b)]. We have also added the pressure dependence of the metamagnetic transition field detected by magnetoresistivity. Importantly it follows the pressure dependence of . A rough extrapolation yields near 1.5 GPa, i.e. near the pressure where SC is replaced by a magnetically ordered state at .[12, 13, 14]

Figure 2 displays as a function of temperature along the , and axes of UTe2. or have been determined from temperature sweeps at constant field, or field sweeps at constant temperature using the criterion (see Supplemental Material for raw data)[18]. The inset in Fig. 2(a) shows the pressure-temperature phase diagram. We find good agreement with the previous reports.[12, 13] No complete superconducting transition has been found at 1.48 GPa. Thus, compared to Ref.\citenBraithwaite2019, the critical pressure up to which SC can be observed is slightly lower. We also do not observe the initial decrease of ,[12] as our first pressure is already 0.3 GPa.

for is shown in Fig. 2(a). The ambient pressure data are on a different sample. At zero temperature T. At the same field a Lifshitz transition of the Fermi surface is observed [20]. Increasing the pressure, increases with a maximum at GPa. Most spectacularly we find a strong enhancement of below 0.6 K at 0.5 GPa and below 0.75 K at 0.86 GPa marked by a kink in . In some organic superconductors or iron-pnictides a FFLO state is observed at high field [21, 22, 23]. Here this is certainly not the case, as a FFLO state induces at most a positive curvature of , not such a kink, leading to a maximum increase of of around for the pure paramagnetic limit of three dimensional superconductors, not as observed here.It is most likely due to multiple superconducting phases with different order parameters, as in the phase diagrams of UPt3, or Th-doped UBe13 [24, 25, 26].Thermodynamic measurements are required to reveal the possible appearance of extra superconducting phases below the superconducting boundary detected here [27].
The strong curvature of under pressure at 0.5 GPa and 0.86 GPa points to the presence of a strong Pauli paramagnetic effect. Even at , determined specific heat measurements points to a paramagnetic limitation.[28] At 1.4 GPa has clearly a reentrant behavior at low field. Increasing the magnetic field, increases from 1.93 K at to 2.1 K at T. It shows that close to the critical pressure, field is enhancing (or restoring) SC in this direction. At lower temperature, we do not see any enhancement of SC at 1.4 GPa in difference to the lower pressures.
In Fig. 2(b) we show for . The known remarkable feature at is the enhancement of SC from 17 T up to 35 T [19]. In the Grenoble experiment, the maximum field has been 13 T, such that we could not follow the field enhancement. However, we clearly see the change of behavior of as a function of pressure near the maximum of at GPa. While at 0.86GPa and 1.07 GPa is almost linear up to the highest field, we observe, for GPa, a marked downward curvature of near . This strong curvature of observed on approaching , suggests either a strong Pauli paramagnetic limit, or a strong field dependence of the pairing. As we will see below another underlying effect is the suppression of the metamagnetic transition. Moreover, at 1.32 GPa, we can detect a clear hysteresis of 0.5 T between field sweep up and field sweep down, for temperatures below 1.2 K (roughly 0.5 ) [closed and open circles in Fig. 2(b) and Supplemental Material], indicating a first order nature of the superconducting transition.
In Fig. 2(c) we plot for for different pressures. Strikingly, we see upward curvatures very close to for all pressures. It is most pronounced at 0.5 GPa. Such an initial upward curvature may occur in resistivity experiments due to filamentary SC or to multiband effects, with dominant pairing for light carriers. Similarly, in Ref. \citenBraithwaite2019 or in UCoGe[29] such behaviour is reported from resistivity measurements. On the contrary, determined by ac calorimetry for has a linear temperature dependence at [12]. Here, we observe that for fields above 2 T, varies linearly with temperature and the slope is strongly enhanced with pressure. In the inset of Fig. 2(c) we compare for the axis and axis at 1.21 GPa. While for the axis has the usual downward curvature near , it has an upward curvature for the axis and is linear only above 5 T. Neglecting the initial curvature, the slope for is about T/K at 1.21 GPa, comparable to that determined from ac calorimetry close to the critical pressure[12]. This indicates an extreme re-inforcement of SC along the axis close to [30].
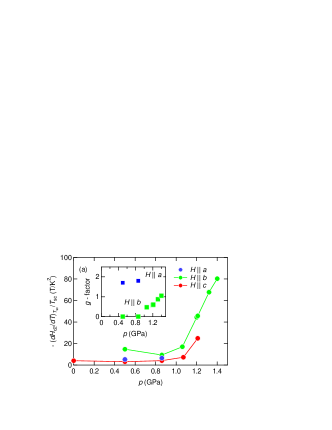

Closer insights on the superconducting properties can be obtained by analysing in more details close to . In order to extract as precisely as possible the initial slope even, when there is a strong positive curvature, we made a (weak-coupling) fit of the data taking into account both the orbital and a possible Pauli limitation [see Fig. S9 in Supplemental Material]. In Fig. 3(a) we plot this determination of the initial slope normalised by as a function of pressure for the three crystal directions. In a normal superconductor, i.e. when the pairing strength does not change significantly with the applied field, it is a good measure of the average Fermi velocity in directions perpendicular to the applied field, as . So, it is roughly proportional to the square of the corresponding effective mass . In Fig. 3(a) we plot as function of pressure. While up to 1 GPa the is almost constant, it increases strongly above 1 GPa. For the axis we find an increase by a factor 9 between 1 GPa and 1.4 GPa. From Ref. \citenBraithwaite2019 we know that increases for the axis until SC is suppressed. Our data here are in good agreement with those determined by ac-calorimetry, and the increase up to for is by a factor 6. For we plot the data only up to 0.86 GPa, but at 1.4 GPa the initial slope has already changed sign. Thus, is strongly reinforced on approaching for all three directions.
Of course, the initial slope is not a direct measure of the effective mass due to the possible field enhancement of the strong-coupling parameter [4, 8, 19]. On the other hand, such a large increase of for certainly gives the right trend for the pressure increase of . The pressure dependence of compares qualitatively with the pressure dependence of the coefficient of the term of the resistivity. At low pressure the resistivity follows well a Fermi-liquid temperature dependence, and with increasing pressure the coefficient increases from cm/K2 to 17.5 cm/K2 at 0.86 GPa by a factor 5 at zero field, see Fig. 3(b). We have also plotted the coefficient for a field of 13 T which shows that for the and axes it is already enhanced, while for the axis is almost constant. However, above 1 GPa the resisitivity is almost linear in the normal state above the superconducting transition indicating the closeness to some quantum critical point (see also Supplemental Material).
In the inset of Fig. 3(a) we have plotted the electronic factor determined from fitting also the curvature of , which is related to the Pauli limitation [31]. Of course, these values are only indicative, because neither strong coupling effects nor a field dependence of the pairing have been taken into account. However, it is clear that for and above 1 GPa for , the Pauli limitation of is not negligible. The fact that paramagnetic limitation appears along two perpendicular directions at least puts strong constraints on the possible superconducting order parameters: for example, it is not possible to have a simple real -vector fixed in a given direction as it would lead to a paramagnetic limitation only along this direction (and ESP states in the perpendicular directions). It could be that we have a complex -vector (non-unitary state)[Metz2019, 28] with no component along the axis, or an order parameter (like in the phase of superfluid 3He), with a paramagnetic limitation present along the three directions.
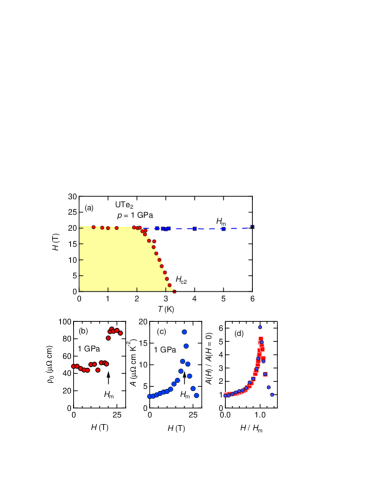
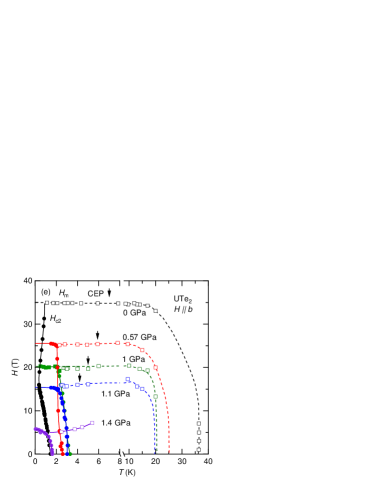
Finally, in Fig. 4(a) we show the phase diagram for at 1 GPa. We clearly see that SC is suppressed continuously with field, but is suddenly cut off when is of the same order as the metamagnetic transition field . At 1 GPa we find T, in very good agreement with the maximum in the temperature dependence of the susceptibility ( K) [see Fig. 1(b)]. The first order nature of the transition at is clearly manifested in the jump of the residual resistivity at shown in Fig. 4(b) from about cm to 90 cm. The jump cm is three times smaller than at . However, there are also strong magnetic fluctuations developing at connected to a huge increase of the coefficient. As shown in Fig. 4(c) the relative field dependence of at 1 GPa scales perfectly with the at [see Fig. 4(d)]. The disappearance of SC right above is in contrast to the rather symmetric field dependence of . In Fig. 4(e) we have summarized the phase diagrams for for different pressures. We want to stress that the reinforcement of observed at zero pressure above 16 T occurs near 8 T at GPa and has completely disappeared at 1 GPa. If it is due to a change in the superconducting order parameter,[32] only the high field phase will survive close to .[14] The signature of the metamagnetic transition gradually fades out between 1 GPa and 1.4 GPa, where only a kink in the resistivity is observed, that could be a signature of . This explains why no clear cut off of SC at appears close to .
Metamagnetism in heavy fermion compounds leads generally to a drastic change of the nature of the magnetic correlations with a reconstruction of the Fermi surface. For example in ferromagnetic superconductors this is well established in URhGe for field applied along the axis[33]. Similar phenomena have been detected on crossing the antiferromagnetic to paramagnetic transition of CeRh2Si2 [34] or in UPd2Al3 [35]. A highly studied case is the CeRu2Si2 series (see e.g.[1, 36]); again, for pure CeRu2Si2, the sharp crossover at from a nearly antiferromagnetic phase to a polarized paramagnetic phase, is associated with a drop of antiferromagnetic correlations above and a drastic Fermi surface reconstruction. A simple ”rule of thumb” is that ferromagnetic or antiferromagnetic correlations drop above and mainly only local fluctuations survive.
Thus in UTe2 if pairing is indeed due to the FM intersite correlations, it should be strongly suppressed above : it is clear for that it is strongly suppressed. Furthermore even at above GPa, it is still not known whether UTe2 shows ferromagnetic or antiferromagnetic order (there is no clear indication for ferromagnetism in the transport measurements) The anisotropy of close to is reversed compared to that at , and we find for the , , and axes, respectively. As the anisotropy of the in most heavy fermion superconductors (UPt3 might be the only exception) follows that of the susceptibility, it is likely that the axis becomes the hard axis near the critical pressure.
Our study of under pressure for the field along the , , and axes reveals unique features of the superconducting phase of UTe2, which clearly demands further thermodynamic experiments. Magnetic field and pressure induced changes of the ferromagnetic interactions as well as possible drastic Fermi surface reconstructions at are important ingredients. The duality between the local and itinerant character of the 5 electrons is important to understand the change in the magnetocrystalline energy leading to a suppression of the metamagnetic field under pressure. SC also evolves strongly in UTe2. For we have shown that is unusually enhanced at low temperatures suggesting multiple superconducting phases.[27] The upper critical field for the axis is determined by the mutual balance of the increase of and the decrease of which cuts off SC at the metamagnetic critical field . Close to the collapse of SC near 1.5 GPa is highest along the axis.
We thank K. Machida, Y. Yanase, V. P. Mineev and Z. Zhitomirsky for fruitful discussions.
We acknowledge the financial support of the Cross-Disciplinary Program on Instrumentation and Detection of CEA, the French Alternative Energies and Atomic Energy Commission, KAKENHI (JP15H05882, JP15H05884, JP15K21732, JP16H04006, JP15H05745, JP19H00646, JP19K03736) and GIMRT (19H0416, 19H0414).
During finishing the present draft, quite similar results for to those described here have been put on arXiv (see Ref. \citenLin2020).
References
- [1] J. Flouquet: in Progress in Low Temperature Physics, ed. W. P. Halperin (Elsevier, Amsterdam, 2006), p. 139.
- [2] H. V. Löhneysen, A. Rosch, M. Vojta, and P. Wölfle: Reviews of Modern Physics 79 (2007) 1015.
- [3] A. Miyake, D. Aoki, and J. Flouquet: J. Phys. Soc. Jpn. 77 (2008) 094709.
- [4] B. Wu, G. Bastien, M. Taupin, C. Paulsen, L. Howald, D. Aoki, and J.-P. Brison: Nat. Commun. 8 (2017) 14480.
- [5] D. Aoki, K. Ishida, and J. Flouquet: J. Phys. Soc. Jpn. 88 (2019) 022001.
- [6] F. Lévy, I. Sheikin, B. Grenier, and A. D. Huxley: Science 309 (2005) 1343.
- [7] D. Aoki, T. D. Matsuda, V. Taufour, E. Hassinger, G. Knebel, and J. Flouquet: J. Phys. Soc. Jpn. 78 (2009) 113709.
- [8] S. Ran, C. Eckberg, Q.-P. Ding, Y. Furukawa, T. Metz, S. R. Saha, I.-L. Liu, M. Zic, H. Kim, J. Paglione, and N. P. Butch: Science 365 (2019) 684.
- [9] D. Aoki, A. Nakamura, F. Honda, D. Li, Y. Homma, Y. Shimizu, Y. J. Sato, G. Knebel, J.-P. Brison, A. Pourret, D. Braithwaite, G. Lapertot, Q. Niu, M. Vališka, H. Harima, and J. Flouquet: J. Phys. Soc. Jpn. 88 (2019) 043702.
- [10] A. Miyake, Y. Shimizu, Y. J. Sato, D. Li, A. Nakamura, Y. Homma, F. Honda, J. Flouquet, M. Tokunaga, and D. Aoki: J. Phys. Soc. Jpn. 88 (2019) 063706.
- [11] S. Ran, I.-L. Liu, Y. S. Eo, D. J. Campbell, P. M. Neves, W. T. Fuhrman, S. R. Saha, C. Eckberg, H. Kim, D. Graf, F. Balakirev, J. Singleton, J. Paglione, and N. P. Butch: Nat. Phys. 15 (2019) 1250.
- [12] D. Braithwaite, M. Vališka, G. Knebel, G. Lapertot, J.-P. Brison, A. Pourret, M. E. Zhitomirsky, J. Flouquet, F. Honda, and D. Aoki: Communications Physics 2 (2019) 147.
- [13] S. Ran, H. Kim, I.-L. Liu, S. Saha, I. Hayes, T. Metz, Y. S. Eo, J. Paglione, and N. P. Butch: ArXiv: 1909.06932 (2019) 1.
- [14] W.-C. L. Lin, D. J. Campbell, S. Ran, I.-L. Liu, K. Hyunsoo, A. H. N. Nevidomskyy, D. Graf, N. P. Butch, and J. Paglione: arXiv: (2020) 2002.12885v1.
- [15] D. Aoki, A. Nakamura, F. Honda, D. Li, Y. Homma, Y. Shimizu, Y. J. Sato, G. Knebel, J.-p. Brison, A. Pourret, D. Braithwaite, G. Lapertot, Q. Niu, M. Valiska, H. Harima, and J. Flouquet: arXiv: (2020) 2003.04055.
- [16] W. Knafo, M. Vališka, D. Braithwaite, G. Lapertot, G. Knebel, A. Pourret, J.-P. Brison, J. Flouquet, and D. Aoki: J. Phys. Soc. Jpn. 88 (2019) 063705.
- [17] D. Aoki, W. Knafo, and S. I.: C. R. Physique 14 (2013) 53.
- [18] (Supplemental material) Supplemental material shows temperature and field dependence of the resistivity at different pressure used to draw the phase diagrams shown in the main article. We further show the analysis of the upper critical field from which we determined the initial slope and the Pauli paramagnetic limitation. .
- [19] G. Knebel, W. Knafo, A. Pourret, Q. Niu, M. Vališka, D. Braithwaite, G. Lapertot, M. Nardone, A. Zitouni, S. Mishra, I. Sheikin, G. Seyfarth, J.-P. Brison, D. Aoki, and J. Flouquet: J. Phys. Soc. Jpn. 88 (2019) 063707.
- [20] Q. Niu, G. Knebel, D. Braithwaite, D. Aoki, G. Lapertot, G. Seyfarth, J.-P. Brison, J. Flouquet, and A. Pourret: Phys. Rev. Lett. 124 (2020) 086601.
- [21] J. Wosnitza: J. Low Temp. Phys. 197 (2019) 250.
- [22] C.-W. Cho, J. H. Yang, N. F. Q. Yuan, J. Shen, T. Wolf, and R. Lortz: Phys. Rev. Lett. 119 (2017) 217002.
- [23] S. Kasahara, Y. Sato, S. Licciardello, M. Čulo, S. Arsenijević, T. Ottenbros, T. Tominaga, J. Böker, I. Eremin, T. Shibauchi, J. Wosnitza, N. E. Hussey, and Y. Matsuda: Phys. Rev. Lett. 124 (2020) 107001.
- [24] K. Hasselbach, L. Taillefer, and J. Flouquet: Phys. Rev. Lett. 63 (1989) 93.
- [25] R. A. Fisher, S. Kim, B. F. Woodfield, N. E. Phillips, L. Taillefer, K. Hasselbach, J. Flouquet, A. L. Giorgi, and J. L. Smith: Phys. Rev. Lett. 62 (1989) 1411.
- [26] Y. Shimizu, S. Kittaka, S. Nakamura, T. Sakakibara, D. Aoki, Y. Homma, A. Nakamura, and K. Machida: Phys. Rev. B 96 (2017) 100505.
- [27] D. Aoki and et al.: to be published .
- [28] S. Kittaka, Y. Shimizu, T. Sakakibara, A. Nakamura, D. Li, Y. Homma, F. Honda, D. Aoki, and K. Machida: arXiv: 2002.06385 2 (2020) 1.
- [29] B. Wu, D. Aoki, and J.-P. Brison: Phys. Rev. B 98 (2018) 024517.
- [30] Re-entrant superconductivity has been reported in Ref.[13] close to the critical pressure. Unfortunately the field direction is not given in the manuscript. .
- [31] A. M. Clogston: Phys. Rev. Lett. 9 (1962) 266.
- [32] J. Ishizuka, S. Sumita, A. Daido, and Y. Yanase: Phys. Rev. Lett. 123 (2019) 217001.
- [33] A. Gourgout, A. Pourret, G. Knebel, D. Aoki, G. Seyfarth, and J. Flouquet: Phys. Rev. Lett. 117 (2016) 046401.
- [34] A. Palacio Morales, A. Pourret, G. Seyfarth, M.-T. Suzuki, D. Braithwaite, G. Knebel, D. Aoki, and J. Flouquet: Physical Review B 91 (2015) 245129.
- [35] A. Gourgout: Dr. Thesis, Université Grenoble Alpes (2016).
- [36] H. Aoki, N. Kimura, and T. Terashima: J. Phys. Soc. Jpn. 83 (2014).
Supplemental Material
In this Supplemental Material we show additional data to those shown in the main article, further data will be made available on special demands.
1 Resistivity under high pressure
Figure S5 shows the temperature dependence of the resistivity of UT2 at zero field for different pressures. Up to a pressure of 1.32 GPa zero resisitivty is observed below the superconducting transition temperature . For higher pressures the resistivity at lowest temperature is finite, i.e. no complete superconducting transition is observed. indicates the onset of the superconducting transition. At 1.48 GP the transition is not complete and extremely broad. This indicates that the slope of is very steep. In addition, already at 1.32 GPa we observe a kink in the resistivity above the onset of the superconducting transition. This is even more pronounced at 1.48 GPa and may be linked to the magnetically ordered state which is observed for higher pressures. This may indicate that the transition from the a superconducting ground state to the magnetically ordered state is first order. We want to emphesize that at 2.13 GPa, the magnetic transition is not at all like expected for a simple ferromagnetic or antiferromagnetic transition and deserves detailed investigatios in future. The shape of the resistivity curves is different than those published in Ref. \citenRan2019b, mainly due to the different direction of the current, which is along the axis in the present experiment.

2 Resistivity at GPa
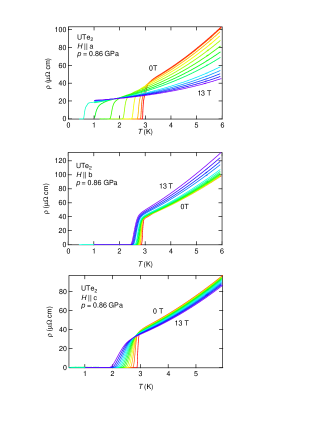
Figure S6 shows the magnetoresistance as a function of field applied along the axis of the orthorhombic UTe2 at GPa for field along the axis. The upper critical field has been defined by the criterion. In Fig. S7 we show the temperature dependence of the resistivity for the three crystallographic directions for fields between 0 T and 13 T, the current is always injected along the axis. We checked carefully that there is no dependence on the criterion used to determine on the overall shape of the upper critical field for as shown in Fig. S8. Most remarkably is the strong enhancement of below 700 mK for . These strong increase has also been verified on different samples grown in Oarai and an increase due to some inhomogeneities in the samples can be excluded.
In Fig. S9 we show the analysis of the temperature dependence of the resisitivity for GPa for fields up to 13 T. We want to stress that the magnetoresistiance in the normal state only for axis is positiv, while for the and axis it is negativ. The temperature dependence of the resisitivity has been fitted by a power law, in the temperature range between K. The field dependence of the exponent and the coefficient of the temperature dependent term is shown in Fig. S9. We find that for the resistivity exponent . It is also possible to force the temeprature dependence to a dependence, however, the fit is significantly less good over this temperature range. In Fig. S9 we show the field dependence of the coefficient obtained from the power law. As expected from the magnetoresistance in the normal state, is increasing for field along the direction, while it is decreasing for the and direction. We also see, that for field along the axis shows some anomaly around 7 T, which may be connected to the Lifshitz transition observed at zero pressure near 6 T. [20]


3 Resistivity at GPa
In Fig. S10 we show the temperature dependence of the resistivity at GPa for (upper panel) and (lower panel) for different fields up to 9 T. The magnetoresistance in the normal state is positive for field along the , and negative for field along the axis. The temperature dependence is almost linear. Fitting with a power law gives an exponent for both directions in the normal state. It is obvious that the magnetic field suppresses stronger for field applied along the axis. The onset of superconductivity is almost field independent in the case of , in excellent agreement with the results from ac calorimetry from Ref. \citenBraithwaite2019.

4 Hysteresis of magnetoresistivity at 1.32 GPa
Near to the critical pressure we observed clear hysteresis in the magnetoresistance as shown in the Fig. S11 for different temperatures. At low temperature the hysteresis is almost 0.5 T. It vanishes near 1.2 K which corresponds to .

5 phase diagram at 1 GPa
Here we show magnetoresistivity data for GPa. These data have been used to drav the phase diagram shown in Fig. 4(a) of the main text. The shown data are exemplary for the phase diagrams shown in Fig. 4(e) of the main text.
In Fig. S12(a) we show the magnetoresistivity for different temperatures between 0.5 K and 6 K measured in the high field facility in Sendai. At 0.5 K the resistivity is zero up to T. The superconducting transition at 0.5 K is rather broad and only at 25 T the normal state is reached. However, increasing hte temperature the transition get’s sharper while the field of zero resistance does not vary up to almost 2 K. For higher temperatures the field of zero resistance decreases, as shown in Fig. S12(b) in the phase diagram. From the magnetoresistivity in the normal state we can identify the metamagnetic trnsition field by the almost steplike increase of the resistivity. As shown for K, above the critical end point the step-like increase disappears and a rather broad maximum defined the cross-over temperature which is connected to the temperature of the maximum of the susceptibility, which is here at 1 GPa near 20 K.
The important observation is that the metamagnetic transition cuts off the superconductivity defined by the zero resistivity criterium which is nearest to the bulk transition. In Fig. in Fig. S12(b) we have plotted the superconducting boundary by both, the zero resistivity and the midpoint of the transition. Clearly, bulk superconductivity seems cut of by the metamagnetic transition.

6 Analyse of the upper critical field
In Fig. 3 of the main paper we present the pressure dependence of the initial slope normalised by as a function of pressure. In a normal superconductor this allows an estimation of the average Fermi velocity and this of the effective mass of the electrons forming Cooper pairs.In order to get a rather good estimation of the slope, we fitted near taking into account the Pauli limitation and the orbital limitation. It is the orbital limitation which determines the inital slope while the estimation of the Pauli limitation allows for the description of the curvature of near . Strong coupling effects are neglected. In Fig. S13 we show the upper critical field for various pressures and the fit of the upper critical field from which we determined the slope and also the factor shown in Fig. 3(a) of the main article. From this fitting it is obvious that for pressures below 1 GPa for field along the axis, no Pauli limitation is necessary to reproduce the data. However, for higher pressures, a strong curvature occurs. Clearly we see that for the Pauli limit can not be neglected. Of course we know that this only a very rough estimation of the behavior and a microscopic model taking into account the correct order parameter, the possible field dependence of the superconducting pairing and the interplay with the underlying metamagnetic transition has to be taken into account.
