Chromatin and cytoskeletal tethering determine nuclear morphology in progerin expressing cells
Abstract
The nuclear morphology of eukaryotic cells is determined by the interplay between the lamina forming the nuclear skeleton, the chromatin inside the nucleus and the coupling with the cytoskeleton. Nuclear alterations are often associated with pathological conditions as in the Hutchinson-Gilford progeria syndrome (HGPS) where a mutation in the lamin A gene yields an altered form of the protein, named progerin, and an aberrant nuclear shape. Here, we introduce an inducible cellular model of HGPS in HeLa cells where increased progerin expression leads to alterations in the coupling of the lamin shell with cytoskeletal/chromatin tethers as well as with Polycomb-group (PcG) proteins. Furthermore, our experiments show that progerin expression leads to enhanced nuclear shape fluctuations in response to cytoskeletal activity. To interpret the experimental results, we introduce a computational model of the cell nucleus that includes explicitly chromatin fibers, the nuclear shell and the coupling with the cytoskeleton. The model allows us to investigate how the geometrical organization of chromatin-lamin tether affects nuclear morphology and shape fluctuations. In sum, our findings highlight the crucial role played by lamin-chromatin and lamin-cytoskeletal alterations in determining nuclear shape morphology and in affecting cellular functions and gene regulation.
Article
Hutchinson-Gilford progeria syndrome (HGPS) is a rare disease characterized by accelerated aging due to a mutation of the lamin A gene, leading to an aberrant protein — named progerin — and to the formation of nuclear blebs. We combine experiments on a cellular model reproducing HGPS cells and numerical simulations of nuclear mechanics to study the biological and biophysical effects of progerin expression on nuclear morphology and functioning. Our results show that progerin induces key changes in the mechanical tethering between cytoskeleton, lamins and chromatin producing nuclear shape alterations and affecting gene regulation.
Introduction
The cell nucleus is of crucial importance in eukaryotic cells since it harbors and preserves the genetic information encoded into chromatin fibers. The protective role of the nucleus is ensured by its structural and mechanical features, mainly due to a rigid nuclear shell composed by a dense network of filaments assembled from lamin proteins. The relative concentration of the different types of lamins (e. g. lamin A, B and C) composing the nuclear skeleton can have an important effect on the elastic and visco-elastic response of the nucleus (1, 2), affecting gene expression and cell fate too (3). There is increasing awareness that the mechanical properties of the nucleus are not only determined by the properties of the nuclear skeleton, but crucially depend on the tethering between chromatin and lamins (4) and on the coupling between lamins and cytoskeleton (5, 6). In particular, lamin A is involved in a complex molecular interface between the inner membrane of the nuclear envelope and chromatin fibers (7) and the integrity of this interface is crucial for correct chromatin functioning during cell cycle and apoptosis. Lamin mutations can thus lead to severe morphological and mechanical nuclear alterations, often associated with severe pathological conditions (8). For instance, the Hutchinson-Gilford progeria syndrome (HGPS) is a rare autosomal-dominant disease characterized by accelerated aging due to a de novo mutation in LMNA gene, leading to an aberrant form of the protein, known as progerin (9). Cells from HGPS patients typically display altered nuclear shapes with bleb-like protrusions.
While the genetic origin of HGPS has been clarified (9), the precise mechanism leading to the changes in nuclear morphology is still unknown. In addition to blebs, nuclei from HGPS patients also display gross reorganization of the lamin architecture into distinct domains (10) and mechanical stiffness alterations (10, 11). Recent experiments using micropipette aspiration show that nuclei expressing exogenous progerin are also stiffer with respect to control cells (12), resembling the HGPS phenotype(10). These works also found that inside the nucleus chromatin is softer and displays reduced mobility when progerin is expressed (12). Interestingly, progerin expression is found to reduce the extent of mechanical force propagation to the nuclear interior from the cytoskeleton (12).
The mechanical coupling between cytoskeleton, nuclear envelope and chromatin fibers is mediated by a set of key proteins acting as connectors between the different elements. In particular, Sun proteins, located in the inner nuclear membrane, are known to interact with lamins in the nucleoplasm, while nesprin (KASH) recruits cytoskeletal components to the outer nuclear membrane. Sun proteins also interact with the protein emerin (13) which is located in the inner nuclear membrane and it is directly linked to lamin A (14). Emerin is known to act as a chromatin tether and its mutation may cause Emery-Dreifuss Muscular Dystrophy (EDMD). It is interesting to note that EDMD may also display mutations in nesprin-1 and -2 (15) and SUN1 (16), leading to a softer nucleus and looser association with lamin A (17). Another key protein for nuclear mechanics is fascin, a F-actin-binding protein (18) which plays a role in the stabilization of filopodia (19) and in the molecular adhesion dynamics of migrating cells (20). A recent paper shows that fascin can bind directly to nesprin-2 at the nuclear envelope and this interaction is independent of the role of fascin within filopodia at the cell periphery (21). Moreover, it has been shown that the disruption of this interaction induces important changes in nuclear shape and deformation (21). In particular, uncoupling the S39-phospho-fascin/nesprin-2 complex leads to a reduction of nuclear deformation and affects in a significant way many functional properties, such as cell invasion (21).
Several computational models have been used to investigate nuclear mechanics, treating the nuclear skeleton either as a discretized continuous elastic shell (22, 23) or as a polymer network (24, 25). Numerical simulations of a finite element model for the nuclear skeleton reveal that blebs are formed under the assumption that the shell is characterized by domains with different relative concentrations of lamin A and B (23). According to this model, blebs would form in correspondence of domains that are rich in lamin A which would make them prone to expansion (23). The model provides a good description of the morphology of the nuclei of lamin B silenced cells, but application to HGPS cells is not straightforward. Lamin domains have been observed in HGPS nuclei thanks to polarized light microscopy showing regions with distinct orientations in the lamin network (10). Different lamin domains in HGPS nuclei thus mostly differ due to their orientation rather than because of their relative lamin content, contrary to the model hypothesis (23). The model did not consider the coupling between lamins and chromatin that is known to be important for nuclear morphology and mechanics (4, 26, 27)
In this paper, we investigated experimentally and computationally the role of chromatin and cytoskeletal tethering in affecting nuclear morphology and function in progerin-expressing cells. To tackle this question, we introduced an in vitro cellular model where progerin expression was induced at controlled and realistic levels in HeLa cells, thanks to the Tet-On technology. Our model was useful to overcome the limitations posed by the use of human fibroblasts obtained from HGPS patients that are only able to grow in vitro for few passages. We used our cellular model to investigate how the induction of progerin expression affect key proteins involved in the coupling of the nuclear shell with the cytoskeleton and with chromatin fibers. We then studied how alterations of these couplings impacted on critical nuclear functions and could possibly lead to changes in gene regulation.
To interpret the experimental results, we constructed a mechanical model of the cell nucleus that included the coupling between nuclear lamina, chromatin fibers and cytoskeleton. To model chromatin fibers, we followed previous polymer models (28, 29) that have been successfully used to study chromatin organization in the nucleus (30, 31). Chromatin fibers were tethered to a lamin shell, modeled by a triangulated surface endowed with stretching and bending rigidity, that is also elastically tethered to an external set of oscillating points modeling, contractions of the cytoskeleton. The computational model allowed us to test in silico the effect of tether organization and strength on nuclear morphology and explain the presence of enhanced cytoskeleton-induced nuclear fluctuations that we observed experimentally when progerin expression was induced. All together our findings highlight the important role played by chromatin and nuclear tethering in determining nuclear morphology and fluctuations with important implications for HGPS.
Materials and Methods
Human Fibroblasts culture growth conditions
Human fibroblasts from HGPS patient (HGSDNF167) and the healthy mother of this patient (HGMDF090) are obtained from the Progeria Foundation Cell and Tissue Bank. The HGPS patient was a male of 8 years old with the classical mutation (heterozygous LMNA Exon 11 c1824 (p.Gly608Gly)). The cells were maintained according to the protocol reported by The Progeria Foundation: 15% FBS, DMEM with 1% antibiotics and 1% L-glutamine. The cells were detached by trypsin 0.25% EDTA and are maintained in culture for no more than five passages.
Plasmids and Subcloning
50-lamin A plasmid was obtained by Addgene (pEGFP-D50 lamin A, cod.17653). Plasmid expressing pTRE3G-mCherry vector was obtained by Clontech (cod. 631165). E. coli One Shot TOP10 bacteria (Invitrogen, C404006) were used for transformation with pEGFP-50 lamin A and pTRE3G-mCherry vector. Competent cells were expanded and selected in Luria Broth medium (Invitrogen, 12795-027) containing Kanamicin for pEGFP 50-lamin A (Sigma Aldrich, K13747) and 100 g/mL Ampicillin (Sigma Aldrich, A5354 ) for pTRE3G-mCherry vector for 18h at C. AfeI/BamHI fragment containing the coding reading sequence of 50 lamin A was excised by pEGFP-50 lamin A plasmid (AfeI cod.R0652S, New England Biolabs) and subcloned into pTRE3G-mCherry vector linearised with EcorV (cod. R1095S, New England Biolabs) and BamHI (cod. R0136S, New England Biolabs) restriction enzymes according to the manufacturer’s instructions. DNA fragments and vectors were routinely analysed by electrophoresis on 1% agarose gel in 1X TAE (Euroclone GellyPhor EMR010100). To recover DNA digested fragments and linearised vectors after electrophoresis and proceed with subcloning Low Melting was used (Euroclone Gellyphor cod. EMR911100). Promega T4 DNA ligase (cod. M1801, Promega) was used to allow ligation step in according to manufacturer’s protocols. DNA fragments and vectors were routinely analysed by electrophoresis on 1% agarose gel (Euroclone GellyPhor cod.EMR010100), in 1X TAE while Low Melting agarose gel (Euroclone Gellyphor cod.EMR911100) was used for the recovery of DNA fragments after electrophoresis. To purify DNA fragments from agarose gels QIAquick Gel Extraction Kit was used according to the manufacturer’s instructions. To recover DNA digested fragments and linearised vectors after electrophoresis and proceed with subcloning, Promega T4 DNA ligase (cod. M1801, Promega) was used to allow ligation step in according to manufacturer’s protocols. Promega PureYield Plasmid Miniprep and Midiprep (cod.A1330 and A2492, Promega) were used to purify plasmidic DNA. The Product of this subcloning strategy was sequenced (Eurofins Genomics Service) using using IRES and SV40 primers (IRES2_F: TGTGGAAAGAGTCAAATGGCT, SV40_R : GGAACTGATGAATGGGAGCAG) to confirm that 50-lamin A was cloned in-frame with the start codon at the IRES2/MCS junction (see Table S1).
Progerin inducible Tet-On HeLa cells
HeLa 3G cells (Clontech cod. 631183 ) were cultured in DMEM (Euroclone cod. ECB7501L) supplemented with 10% v/v Tet-free FBS (Euroclone, cod.ECS01821) 1% Penincillin/Streptomycin and 1% L-Glutamine at C and 5% in humidified incubator immediately upon thawing without selective resistance. To create a double stable inducible HeLa 3G cell line expressing 50 lamin A, HeLa 3G cells were transfected with 5g of pTRE3G-mCherry-50-lamin A using Xfect reagent (Clontech,cod. 631317) and 250 ng of puromycin linear selection marker (Clontech cod.631626) according to the manufacturer’s instructions in order to generate a double-stable cell line expressing both Tet-On 3G transactivator and higher levels of progerin in response to Doxycycline. After two weeks of drugs selection, 24 resistant colonies were picked up and screened for inducibility, with increasing doses of Doxycycline ( 0-1-5-10 and 20 ng/ml) measuring mCherry and 50 Lamin A by immunofluorescence and western blot. Two clones of the 24 screened were selected and used for further experiments. 48h post-transfection, the cells were splitted into 4 x 10 cm dishes and 0.5 g/ml of Puromycin (Life Technologies cod. A11138-03 ) and 200g/ml G418 (cod. A1720, Sigma) was added to select the positive clones. Drug-resistant colonies appeared 2 weeks after selection. Single clones were isolated using cloning cylinder (Sigma Catalog cod.C1059). When they reached confluence, the cells were split in 6-well plate for testing the expression of 50 lamin A and for further maintenance. In order to express 50-lamin A in dose dependent manner, the cells were induced with Doxycycline (Clontech cod.631311) at the concentration indicated in the figures and analysed 48h after the induction. HeLa 3G cells expressing 50-lamin A were rountinely maintained in culture in DMEM (Euroclone cod. ECB7501L) supplemented with 10% v/v Tet-free FBS (Euroclone cod.ECS01821), 200/ml G418 and 0.25g/ml Puromycin, 1% Penincillin/Streptomycin and 1% L-Glutamine at C and 5% .
50 lamin A and WT lamin A transient transfection
Plasmid containing the human lamin A-C-18 (Addgene, cod. 55068) or progerin (pEGFP-50 lamin A, Addgene, cod.17653) were purchased by Addgene. E. coli One Shot TOP10 bacteria (Invitrogen, cod.C404006) were transformed with plasmids, expanded and selected in Luria Broth medium (Invitrogen, cod. 12795-027) containing 50 g/mL Kanamicin. PureYield Plasmid Miniprep and Midiprep (Promega, cod.A1330 and A2492) were used to purify plasmidic DNA according to the manufacturer’s instructions.
HeLa cells were maintained in DMEM (Euroclone, cod. ECM0060L) medium with 10% fetal bovine serum ( Euroclone, ECS0180L), 100 U/ml penicillin, 100 mg/ml streptomycin sulphate (Euroclone,cod. ECB3001D) and 2mM L-Glutamine ( Euroclone, cod. ECB3000D-20) at 37∘C in an atmosphere of 5% CO2 and 95% humidity. Cells seeded at an 70% confluent onto 6-well plates were transiently transfected with pEGFP 50lamin A (Addgene, cod.17653) or mEmerald-WT-lamin A (Addgene, cod.54139) using Xfect transfection reagent (Clontech, cod 631317). After 48 h from transfection cells were used for cytoskeleton pharmacological perturbation experiment.
Pharmacological perturbation of the cytosckeleton
To study the role of cytoskeleton in this context, actin and myosin organization were perturbed by exposing pEGFP-50lamin A or mEmerald-WT-lamin A overexpressing cells to Blebbistatin, a myosin inhibitor, or to a cell-permeable inhibitor of formin-mediated actin nucleation and formin-mediated elongation of actin filaments, SMIFH2 (5). Subconfluent Hela cells expressing WT or 50 lamin A were exposed to 25M Blebbistatin (Sigma-Aldrich, B0560) for 30 min or to 20M SMIFH2 (Sigma-Aldrich, S4826) for 1 hour at 37∘C and 5% in humidified incubator. Five minutes prior the end of the treatment, Hoechst (1:1000, Life technology, H3570) was added to the cell medium to counterstain nuclei. Immediately after the end of each treatment, medium containing drugs was replaced with fresh medium and cells were time-lapse imaged (1 shoot every 15 minutes) for 1h using a Leica TCS NT confocal microscope (63X) with a z-stack of 0.5 m.
Immunofluorescence
Subconfluent cells grown on glass coverslips were fixed with 3.7% parafolmaldhehyde in PBS for 10min or with ice cold 100% methanol for 5min at -20∘C, permeabilized with 0.5% Triton X-100 in PBS for 5min at RT and incubated with 10% goat serum in PBS for 1hr. The cells were stained with anti-lamin A (1:100 ab8980, Abcam) or anti-PanLamin (1: 50, ab20740, Abcam ) or anti-progerin (1:20 , ab66587, Abcam) or HP1 (1:250, ab109028, Abcam) overnight at C. Thus, after a brief washing with PBS, the cells are incubated with the secondary antibody (1:250, anti-rabbit, ab150077, Abcam or anti-mouse, ab150113, Abcam) for 1 h. The nuclei are counterstained with DAPI and the slides mounted with Pro-long anti fade reagent (cod P36931, Life technologies). The images are acquired with a Leica TCS NT confocal microscope. Immunofluorescence intensity was estimated using customized ImageJ macro evaluating single pixel fluorescence after subtracting the background noise. The average fluorescence was calculated on pixels that passed the background filtering. In all the analyzed frames, nuclei close to the edge of the image or superimposed were manually discarded.
Proximity Ligation Assay
Subconfluent cells were fixed on slides with ice cold 100% methanol for 5 min at at -20∘C and then incubated with Duolink Blocking Solution for 60 minutes at 37∘C in a humidity chamber. Slides were then incubated in a humidity chamber overnight at 4∘C with lamin A (1:100 cod.ab8980, Abcam), PanLamin (1:50, ab20740, Abcam) antibody with SUZ12 (1:800, mAb 3737, Cell Signaling) or BMI1 (1:600, mAb6964, Cell Signaling) or SUN1 (1:200, ab103021, Abcam) or emerin (1:200 ab40688, Abcam). After washing, samples were incubated in a pre-heated humidity chamber for 1 hour at 37∘C with anti-rabbit PLUS and anti-mouse MINUS PLA probes diluted 1:5. PLA probes generates a fluorescent signal when bound to two different primary antibodies, raised in different species, that recognized two antigens in close proximity (less than 40nm). All the antibodies were diluted in Duolink Antibody Diluent. Ligation and amplification steps were performed according to manufacturer’s instructions. Slides were mounted with Duolink In Situ Mounting Medium with DAPI (DUO82040, Sigma-Aldrich). The images were acquired with a Leika TCS NT confocal microscope.
Proximity ligation assay analysis
Immunofluorescence images were analyzed using existing and customized plugins of the bioimage informatics platform Icy (v.1.9.4 and 1.9.5 (32)) and custom python scripts. Reconstruction of progerin Tet-On HeLa nuclear envelope was performed on all the Z-stacks with Icy HK-Means and ActiveContour plugin using DAPI signal and the resulting 3D meshes were exported as VTK files. A wide range of parameters was explored in order to ensure that our result were not affected by the specific parameters chosen for reconstruction. Duolink spot recognition was performed separately on each nucleus with a semi-automatic protocol involving HK-means thresholding (ICY Thresholder plugin). The minimum size of each accepted spot was set to 70 px. Center of mass was used to determine the relative position of the spot respect to the nuclear envelope, and spots inside reconstructed nuclear mesh were taken into account. In all the analyzed frames nuclei close to the borders or superimposed were manually discarded.
Immunoprecipitation assay
Subconfluent cells were gently detached from the culture plates using a cell lifter in cold PBS, collected in a 1.5 ml eppendorf and centrifuged at 3.5 x g for 5 min at 4∘C. The pellet was resuspended in lysis buffer (2 mM EGTA ,0.5 mM EDTA, 0.5 mM PMSF, 1X TRITONX100, 1X Protease Cocktail Sigma Aldrich P8340) and incubated on ice for 30 min with periodic mix by vortex. The lysate was centrifuged at 14xg for 10 min at 4∘C, the supernatant transferred to a fresh tube and proteins concentration was measured by DC Protein Assay Kit (BioRad). 500 g of total proteins was incubated with anti-fascin antibody (1:100, ab126772, AbCam) overnight at 4∘C under stirring. 50% beads slurry of Protein A-Agarose (P9269, Sigma Aldrich) was added to the lysate and reincubated with gentle rocking for 2 hours at 4∘C before centrifugation (14 x g for 10 min at 4∘C). After three washes with 500l of lysis buffer the sample was resuspended in 30l 2X Laemmli sample buffer(2% SDS, 20% glycerol, and 125 mM Tris-HCl, pH 6.8). Samples were then heated to 90∘C for 5 minutes, and 15 l per sample was loaded on 10%SDS-PAGE for Western blot. 50 g of the whole lysate for each sample were loaded on the same gel.
Western blot
Subconfluent cells were lysed by boiling in a modified Laemmli sample buffer (2% SDS, 20% glycerol, and 125 mM Tris-HCl, pH6.8). The protein concentration was measured by DC Protein Assay Kit (BioRad). Equal amount of proteins were loaded on 10% (or for IP assay) SDS-PAGE gel and transferred to a PVDF membrane (Trans-Blot Turbo Mini PVDF, BioRad). After blocking with 5% BSA/0.1 % Tween20 in PBS for 1h at RT,the sheet was incubated with primary antibody overnight at 4∘C. The following antibodies and dilution were used in various experiments: anti-nesprin 2 (1:1000, cod. MABC86, Merck Millipore), anti-SUN1 (1:1000,Abcam ab103021), anti-emerin (1:200 Abcam ab40688), anti S39-phospho-fascin antibody (1:10000, ab90648, AbCam), anti-fascin (1:10000, AbCam, ab126772), anti-SUZ12 (1:1000, cod. 3737, Cell Signaling), anti- Ezh2 (1:1000, cod. 5246 , Cell Signaling), anti- Ring1A (1:1000, cod. 13069, Cell Signaling), anti-RING1B (1:1000, cod. 5694, Cell Signaling), anti- BMI1 (1:1000, cod. 6964, Cell Signaling), anti-vinculin (1:10000, cod. V9264, Sigma), anti-GAPDH(1:5000, cod. G9545, Sigma) or anti-tubulin (1:5000, cod. T8328, Sigma) antibodies incubated for 1h at RT were used as housekeeping reference.
Wound healing assay
For the migration assay, a wound is introduced in the central area of the confluent cell sheet by using a pipette tip and the migration followed by time-lapse imaging. The measurements of the velocity field were done using PIVlab app for Matlab (33). The method is based on the comparison of the intensity fields of two consequent photographs of cells. The difference in the intensity is converted into velocity field measured in px/frames and then converted to m/h (34). The front position is quantified according to Ref. (34)
2D analysis of nuclear morphology
Nuclear segmentation
The transformation of fluorescence images into binary masks is done using a custom script in Matlab. Using a two-peak histogram of pixel intensity a threshold is defined for each image to cut away the background with uneven illumination. After applying this treshold, “imbinarize” function is used with adaptive thresholding. Holes in the image are filled with “imfill” function. Little remaining noise is removed with “bwareaopen” function. The functions are a part of Matlab Image Processing Toolbox. We process 96 fluoresence images automatically, and then manually check for segmentation errors. Usually cells that are undergoing division or cells in regions of lower fluorescence intensity are not well-segmented by our algorithm. After discarding segmentation errors by hand, we are left with binary masks of 297 No Doxy nuclei, 330 Doxy nuclei, 87 healthy nuclei, and 87 HGPS nuclei.
Computation of local curvature
The curvature of a point in a planar curve is mathematically defined as
| (1) |
and corresponds to the inverse of the radius of a circle tangent to the point. To estimate the curvature of nuclei along each point of their perimeter we first fit fourth-order splines to the border of the binary masks using “UnivariateSpline” function from SciPy python library (35) then evaluate expression (1) using the obtained differentiable curves.
Blebbiness index
Negative curvature in 2-dimensional images is a signal of abnormal nuclear morphology, being associated with blebs and invaginations. Curvature changes along the perimeter of a nucleus, making it difficult to compare curvature estimates among large number of nuclei. To simplify the curvature values of nuclei along their perimeters into a single number for each nucleus, we define the blebbiness index as the weighted fraction of negative curvature,
| (2) |
where is the perimeter of the nucleus and is the region of the perimeter with negative curvature . The denominator is simply the length of the perimeter, and the numerator is the integral of the absolute value of the curvature along regions of negative curvature. In this way, regions of large negative curvature contribute more to the total than regions of negative but small curvature, making in turn the index robust to variability in the estimation of .
Automated bleb counting
Automated bleb counting is a difficult problem. While the biological definition of bleb is well-stalished, a translation into quantitative terms admits different formulations. Here we estimate the number of blebs by counting the number of regions of negative local curvature along the nuclei perimeter. To avoid spurious results due to values of , we define the number of blebs as the number of regions where the curvature is below a threshold . Notice that we have a total of nuclei, making manual quantification unfeasible in this case.
3D analysis of nuclear morphology
Mesh Reconstruction of the nuclear shell
The Hela nucleus mesh reconstruction was performed using the bioimage informatics platform Icy (32). Starting from the images with the nuclei and over-expressed lamin skeletons, we applied the Icy HK-Means plug-in to obtain three dimensional (3D) nuclear regions of interest (ROIs) for each temporal acquisition. This segmentation method uses, in fact, a K-Means classification to detect clustered objects corresponding, in our case, to the nucleus structures. The final 3D meshes of the outer nuclear membrane have been obtained thanks to the Icy Active Contours plug-in (36). The parameters used for the reconstruction are the default ones except for the values of contour smoothness, contour sampling and region sensitivity. For these three parameters we used, respectively, the values in the ranges 0.028-0.032, 1.9-2.1 and 2-3.
Local displacements
The total volume change between two meshes , of a given cell at different time-points is a global measure that gives only summarized information on morphological changes . While can reveal key information in some situations, most local morphological changes like [XX, YY and ZZ (blebs etc)] can take place at fixed volume, remaining blind to . To circumvent this issue and detect local morphological changes, we develop the concept of local displacements , which can be interpreted as the distance each face of should move to turn into .
Alternatively, one can think of local displacements as a decomposition of the total volume change,
| (3) |
where denote the surface areas of the faces of .
Computation of local displacements
We estimate local displacement of a triangular face of mesh with respect to mesh by averaging the projection of the displacement vectors onto the face normal . The average is taken over the vertices that form face . Displacement vectors are defined as , where is the optimal matching between and . The optimal matching is found by minimizing the sum of distances between pairs of matched vertices, , over all possible one-to-one matchings between the vertices of and
In summary, the local displacements of a mesh with respect to a mesh are computed as follows:
-
1.
Find the matching that minimizes the total distance:
(4) where is a one-to-one correspondence between the vertices of and those of . If , we resort to subsampling the mesh with the largest number of vertices. We solve Eq. 4 using the Hungarian algorithm (37) as implemented by the scipy.optimize.linear_sum_assignment function from the SciPy library (38)
-
2.
Compute the displacement vectors of each vertex:
-
3.
Compute the normal vectors to all faces
-
4.
Compute the projections of on
-
5.
The local displacement is the average of over the vertices that form face :
(5)
Local displacement fluctuations
The quantity reported in Figure 4 is the standard deviation of the local displacements of each cell.
| (6) |
large values of are associated with heterogenous morphological, while low values of are obtained when the changes are homogeneous over the nucleus surface. In particular, volume changes due to a uniform shrinking/expansion would entail a value of .
Statistical significance tests
The -values reported in Figure 1 and panels b) and e) of Figure SX are obtained via a Kolmogorov-Smirnov test comparing the distribution of the relevant magnitud among the two groups (Doxy vs No Doxy or Healthy vs HGPS). The computation is implemented via “ks_2samp” function from SciPy library (35). The p-values reported in panels c) and f) of Figure SX are instead computed using a T-test for independent samples with unequal sample sizes and unequal variances, implemented throught the “ttest_ind”function from SciPy library (35). We use the Kolmogorov-Smirnov test to assess the statistical significance of differences in local displacements when comparing treated versus untreated cells. In Figure 4 -values below 0.05 are marked with ∗, and -values below 0.01 are marked with ∗∗. For each time-step, we correct -values for multiple testing using the Holm-Sidak method as implemented in the “statsmodel.stats.multites” python library. We also used t-test when indicated.
Computational modeling
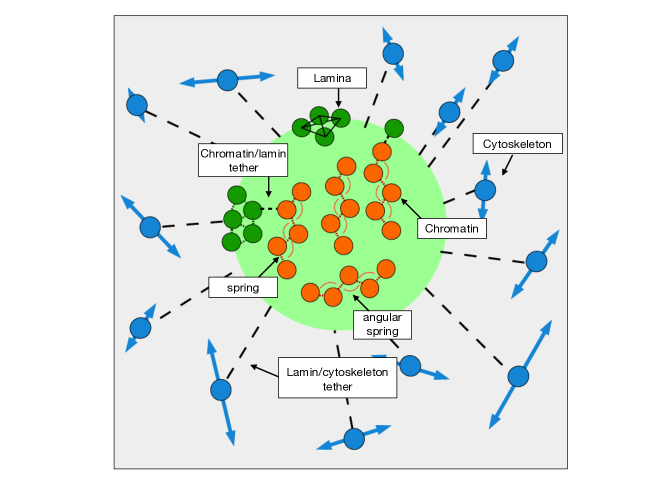
We consider a discretized model for the cell nucleus composed by a flexible coarse-grained shell representing nuclear envelope and lamina, coupled to a set of coarse-grained polymers representing chromatin and also to a set of randomly distributed points representing cytoskeletal elements. At this level of coarse-graining, the intention is to capture the mechanical properties of the essential nuclear components without resorting to detailed modeling of their structure. A sketch of the model is reported in Fig. S1 and the list of parameters is summarized in Table S2.
Chromatin:
Chromatin is modeled in analogy with previous coarse-grained simulation studies (26, 27, 39, 40). We consider a set of 46 polymers, with 128 monomers each. Monomers are coupled by harmonic springs with spring constant N/m(26, 27), and a harmonic angular coupling with equilibrium angle 130 degrees and spring constant Jrad-2. To avoid that chromatin overlaps, monomers also interact with a truncated Lennard-Jones interaction with pJ, m and a cutoff of m, which provide an effective short-range repulsion. Chromatin polymers are initialized as non-overlapping random walks, each centered on a random site within the spherical nucleus. This initial condition ensures the presence of chromatin segregation into separated territories, as suggested by experiments (41). The initial chromatin configuration is first relaxed using an NVE integrator with particle step size limited to 1 nm, per time step of s, for time steps. The system is then brought to thermal equilibrium using an NVE integrator with Langevin thermostat with target temperature K and damping s-1, with a time step of s, for steps, before the nuclear envelope and cytoskeleton are added to the simulation.
Nuclear envelope:
The nuclear envelope is modeled as a triangulated sphere, using 10242 nodes in the triangulation, and each node is treated as a particle in a molecular dynamics simulation. The energy cost of stretching the shell is implemented by coupling each node of the triangulation by linear springs to its neighbors with spring constant N m-1 (22) for all bonds. Bending the shell also has an energy cost, which is implemented by coupling each triangular plaquette of the sphere to its neighbors using a harmonic coupling in the angle between two plaquettes, with equilibrium angle 180 degrees. We use a spring constant for this coupling of J rad-2 inside the domains and J rad-2 on the domain walls. This is larger than the literature value of J rad-2 (22), but we find this is necessary to prevent crumpling of the shell. The nuclear envelope is initialized as a sphere of radius m. To prevent chromatin polymers from passing through the shell, the chromatin and shell particles interact with a truncated Lennard-Jones interaction with pJ, m and a cutoff radius of m. When the nuclear envelope is created, monomers in the relaxed chromatin configuration that are within distance m of the nuclear envelope are able to couple to the nuclear envelope with probability that we can fine tune to obtain a given lamin/chromatin link density , defined as the average number of links per node of the triangulated shell.
Lamin domains:
A key feature of our model is the presence of spatial domains in the lamina, which are bounded by “domain walls” that are easier to bend than the domains. The existence of spatial domains was demonstrated experimentally in (10) and we hypothesize that the domain walls are more bendable than the domains themselves. The nodes are assigned to domains by generating a domain pattern on the surface of the sphere by placing 10 domain centers uniformly at random and then generating the domain walls using Voronoi tessellation. When the nuclear envelope is created, monomers in the relaxed chromatin configuration that are within distance m of the nuclear envelope are able to couple to the nuclear envelope only if the envelope particle is on a domain wall. In all cases, coupling is implemented via harmonic springs with stiffness N/m.
Coupling to the cytoskeleton:
The nuclear envelope is also coupled to a set of 100 randomly placed points representing elements of the cytoskeleton. The coupling is implemented via linear springs that connect a randomly-selected points on the lamina, with spring constant , that we vary in the range N m-1. To simulate cytoskeletal activity, each cytoskeletal element follows an oscillatory motion with frequencies randomly distributed in the range s-1 and amplitudes also randomly distributed in the range m.
Simulation details:
The system is first relaxed using and NVE integrator with particle step size limited to 1 nm, per time step of s, for time steps. The system is then brought to thermal equilibrium using an NVE integrator with Langevin thermostat with target temperature K and damping constant s-1, with a time step of s, for steps. All simulations are implemented in LAMMPS (42).
Results and discussion
Progerin induction in HeLa cells modifies nuclear morphology and chromatin organization
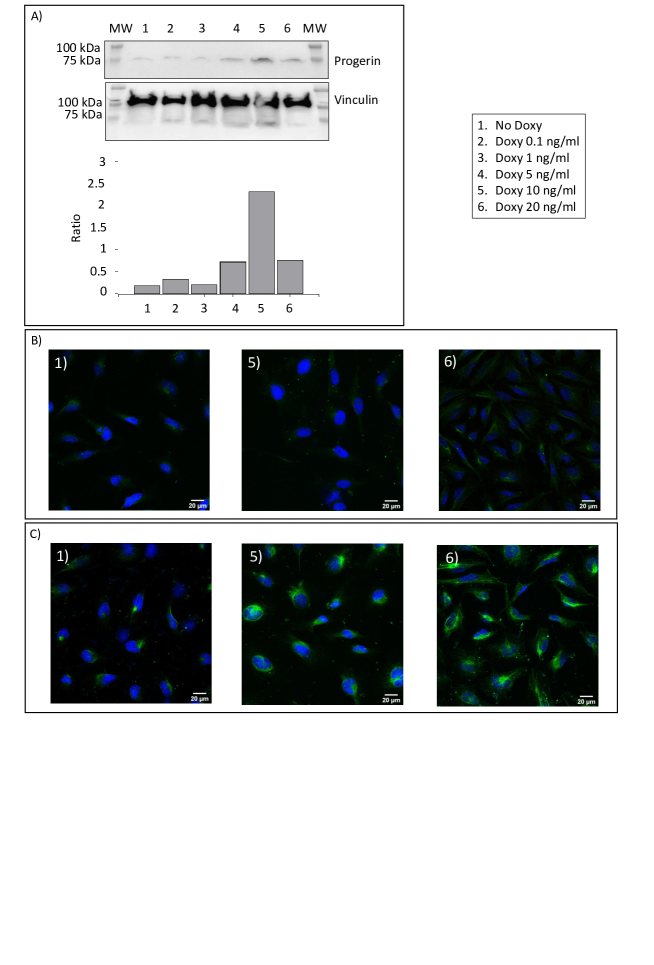
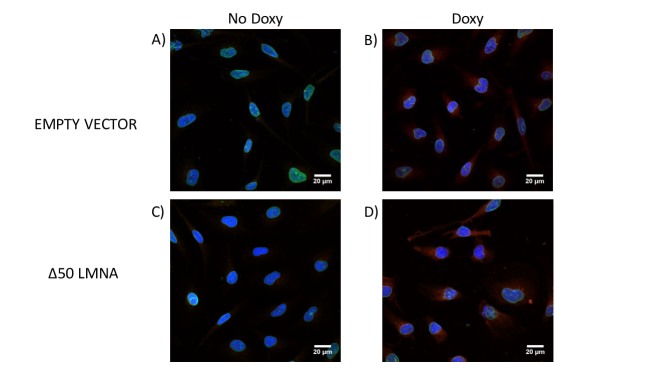
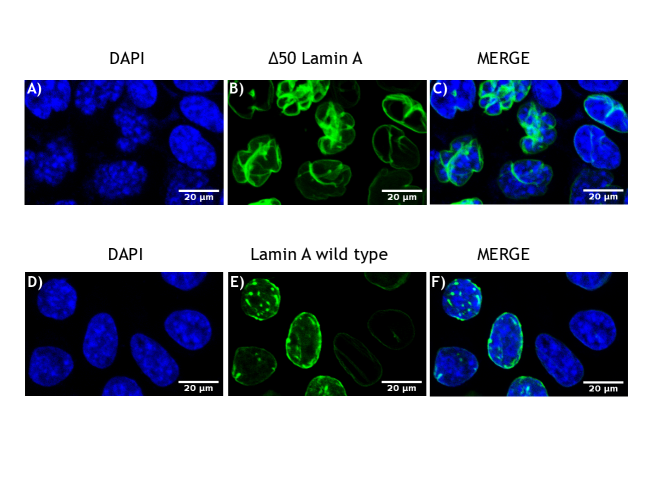
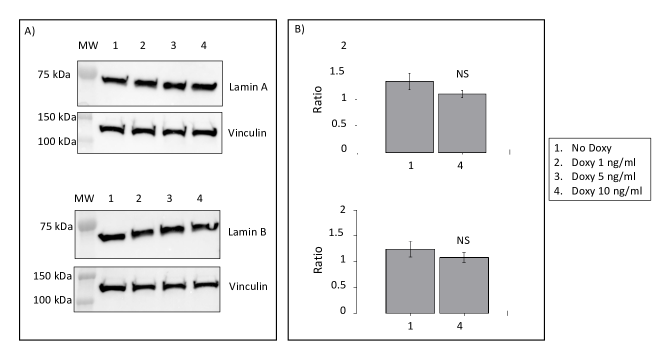
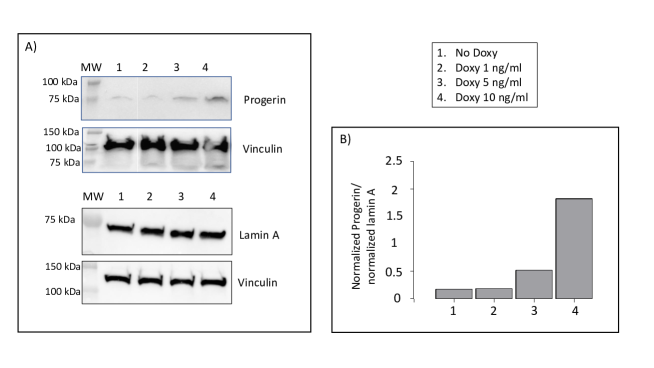
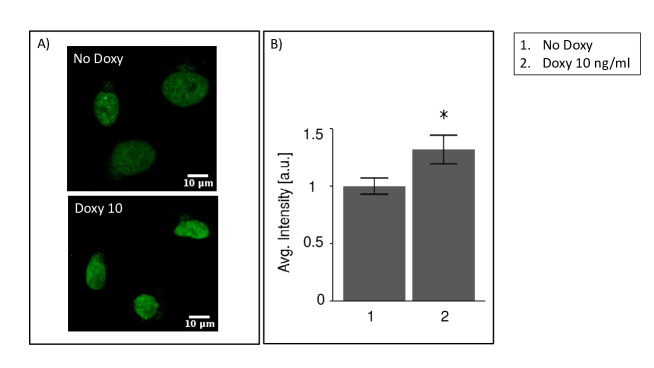
The Tet-On system is based on reverse tetracyclin activation. Here we used the Tet-On 3G system which is 100 fold more sensitive and 7 fold more active than the original Tet-On (see Material and Methods section for technical information). In our cellular model, the level of expression of progerin is induced by doxycycline (Doxy). As shown in Fig. S2, 10ng/ml Doxy is the minimal concentration that is able to induce progerin expression. To check the specificity of the induction of progerin after the treatment with Doxy, we used two internal controls according to the manufacturer’s instructions: we compared the cells treated with Doxy with respect to cells not exposed to Doxy (No Doxy). The second control was to investigate the level of expression of progerin in cells transfected with an empty vector, untreated or after treatment with Doxy (Fig. S2C). In all these control experiments, we did not observe any progerin induction. For completeness in Fig. S3, we show the mCherry expression and panlamin for the same conditions as in Fig. S2 and in Fig. S4 an example of HeLa cells expressing mEmerald and WT lamin A or pEGFP-50 lamin A 48h after transfection. We also quantified by western blot the level of expression of lamin A and B under the induction of progerin, without finding any significant changes due to the presence of progerin (Fig. S5).
It was reported in the literature that in cells from HGPS patients, the ratio between the amount of progerin and lamin A proteins is between 0.5 and 2 (43, 44, 10). This variability is possibly due to the specificity of each patient. Here, we quantified the ratio between progerin and lamin A proteins in HeLa Tet-On progerin expressing cell and found a value around 1.5-2, as shown in Fig. S6.
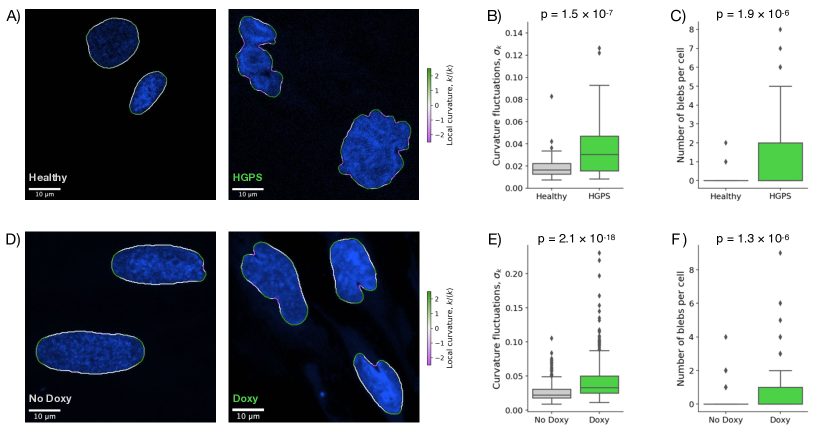
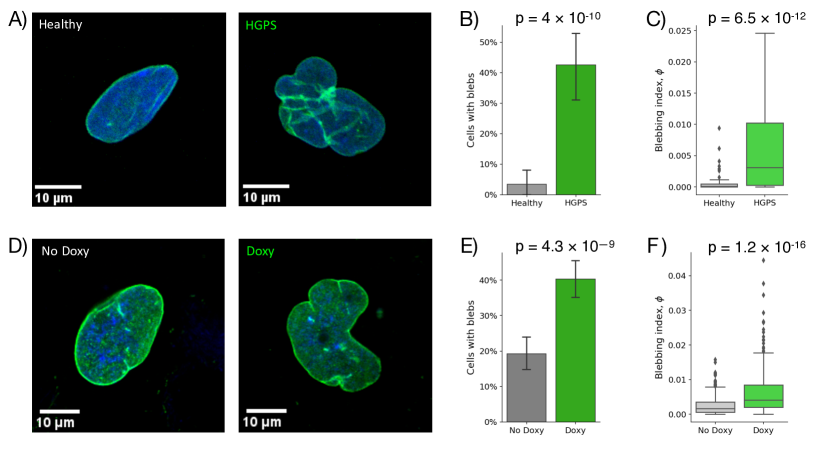
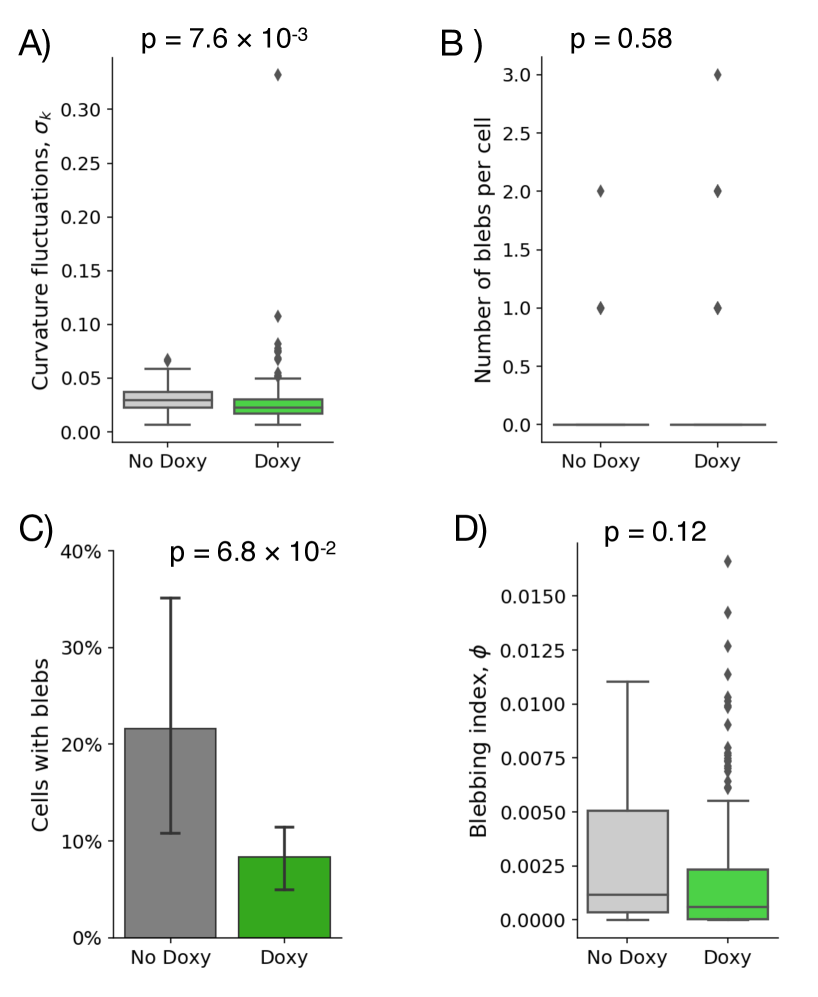
To confirm that our cellular model faithfully represents the morphology of HGPS nuclei, we compared the number of blebs and the curvature fluctuations observed in HeLa Tet-On progerin expressing cells (Doxy) with those observed in control cells (no Doxy) and performed a similar analysis for fibroblasts obtained from a HGPS patient (HGPS) and his healthy mother (Healthy) (Fig. 1). Using the same samples, we also measured a blebbing index, defined as the average curvature restricted to the region of negative curvature (see Materials and Methods section for more details) and the number of cells with blebs (see Fig. S7). All these different quantitative measurements confirmed that nuclei in both HeLa Tet-On progerin expressing cells and HGPS cells display highly significant alterations with respect to their controls, confirming the capability of our model to faithfully recapitulate the main features of the nuclei from HGPS patients. As a further control, we report in Fig. S8 morphological measurements in cells transfected with an empty vector. In this case, treatment with Doxy does not induce any morphological alteration.
Finally, it is known that HGPS patients show important differences in higher order chromatin organization such as specific changes in chromatin-modifying enzymes (i.e. heterochromatin protein 1, HP1) (45, 46). Consistently, we found an increased expression of HP1 in HeLa Tet-On progerin expressing cells (Fig. S9).
Progerin induction affects the coupling between the cytoskeleton and the nuclear shell
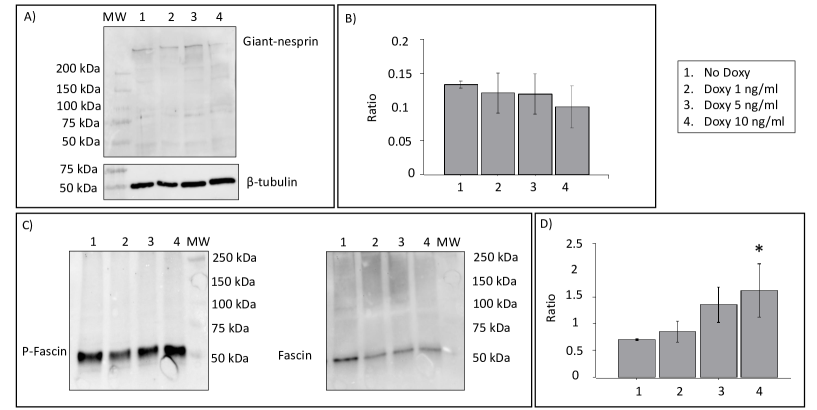
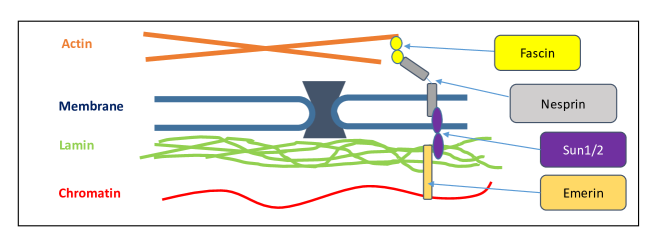
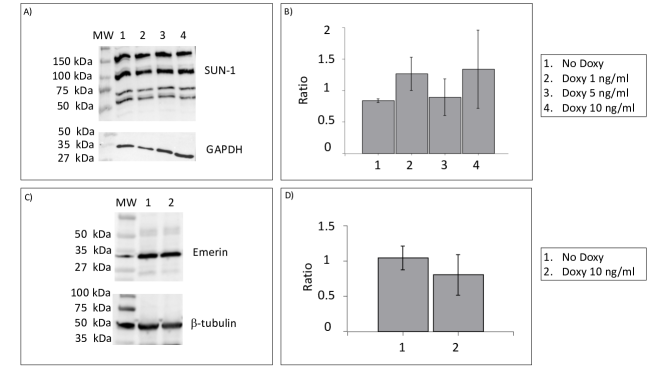
Since the interaction between fascin and giant nesprin or nesprin-2 requires the phosphorylation of fascin at serine 39 (S39), we investigated the possible impairment of fascin/nesprin-2 complex in HeLa Tet-On progerin expressing cells. As shown in Fig. S10, nesprin-2 associates with the outer nuclear membrane exposing their N-term domain towards the cytoplasm where it binds cytoskeletal actin through fascin and their C-term domain towards the perinuclear space where it binds to SUN1/2 and emerin. According to Ref. (21), fascin can interact properly with nesprin-2 only when it is phosphorylated (S39). First, we checked the level of expression of giant nesprin in HeLa Tet-On progerin expressing cells with respect to cells not induced by Doxy. As shown in Fig. 2, the induction of progerin did not change the level of expression of nesprin-2. On the other hand, we observed an increase in the expression level of S39-fascin as progerin level of expression increases (Fig. 2). Hence, our observation suggests that the expression of progerin enhances the coupling between the cytoskeleton and the nuclear shell (Fig. 2 and Fig. S10).
Progerin induction affects chromatin-lamin tethers
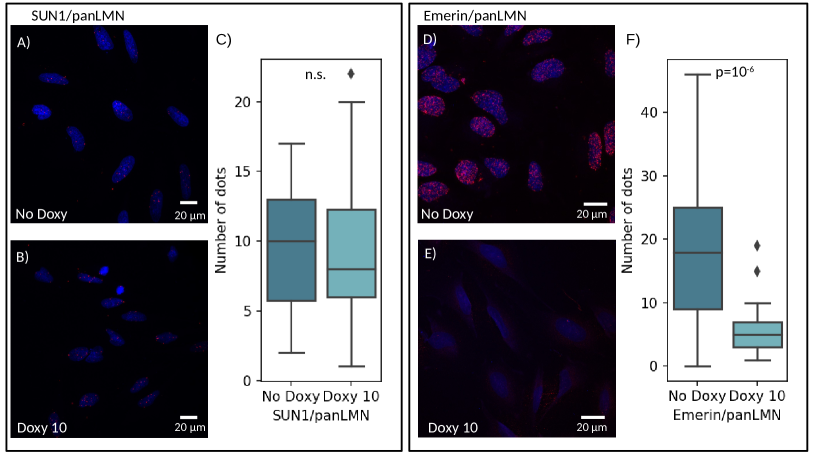
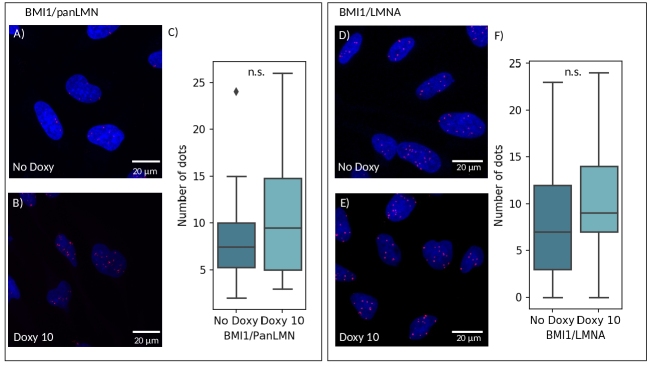
To study the role of progerin induction in the tethering between lamins and chromatin, we investigated the presence and the interaction between SUN1 or emerin with all lamins using the PanLamin antibody in HeLa Tet-On progerin expressing cells. Fig. S11, shows that neither SUN1 nor emerin level of expression changes significantly in dependence on the expression of progerin. We then investigated the dependence on progerin expression of the interaction between lamins and SUN1 or emerin using the proximity ligation assay. In Fig. 3, we show a typical experiment and its quantification by counting the number of the spots, each representing an interaction between SUN1 or emerin and lamins, as detected with the PanLamin antibody. Fig. 3 shows a significant reduction in the coupling between emerin and lamins upon progerin induction. In contrast, the coupling between SUN1 and lamins is unaffected by progerin induction Fig. 3.
Progerin induction slows down collective cell migration
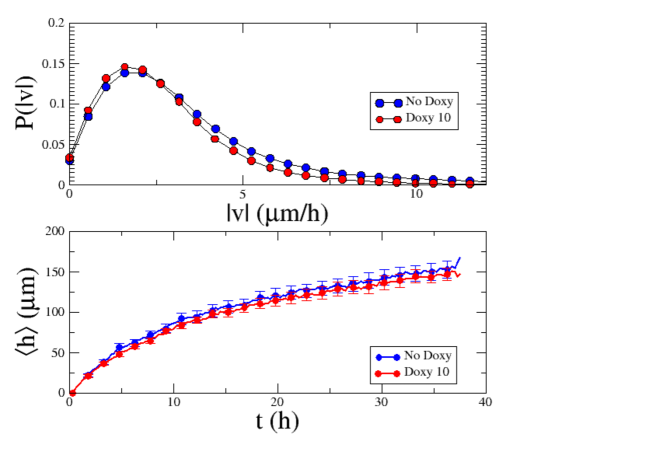
To assess the effect of progerin induction on functional properties of the cell, we performed wound healing assays. As shown in Fig. S12A, the velocity distributions appears altered by progerin induction leading to a slower collective migration. While the effect is small it is statistically significant according to the Kolmogorov-Smirnov test. Accordingly, the front position of progerin induced cells advances more slowly than in control cells (see Fig. S12B).
Nuclear surface fluctuations driven by cytoskeletal activity are affected by progerin
Forces generated by the cytoskeleton can affect chromatin through the links with the nuclear envelope and the lamina, as illustrated in Fig. S10. To quantify the effect of cytoskeletal activity on the nuclear envelope when progerin is expressed, we studied time-dependent shape fluctuations in HeLa cells transiently transfected with GFP—50 lamin A and mEMERALD-lamin A WT. To this end, we exposed the cells to agents that are able to stabilize actin (jasplakinolide), depolymerize actin (cytochalasin D), affects myosin activity (blebbistatin) or inhibit the nucleation of actin polymerization (SMIFH2) and then we wash out the drug and starts to acquire images at confocal microscope (5). We thus reconstructed the 3D mesh of nuclear surfaces according to Materials and Methods section and from each time-series of nuclear meshes, we computed the local displacement fields , indicating how much each node of the mesh has been displaced from the beginning (See Fig. 4A). Finally, to quantify the fluctuations of the mesh in each instance, we computed the standard deviation of as a function of time. As shown in Fig. 4B, progerin overexpression leads to significantly larger time-dependent fluctuations in the nuclear envelope. Notice that larger fluctuations is not trivially related to the presence of blebs. Fluctuations here are defined relative to a reference frame, so that a blebbed surface not changing in time would yield no fluctuations. Moreover, the treatments with blebbistatin (Fig. 4CD) and SMIFH2 (Fig. 4IJ) and with less extend to jasplakinolide (Fig. 4GH), showed significant differences in the presence of progerin. The general conclusion is that hindering cytoskeletal activity affects progerin expressing cells reducing their nuclear surface fluctuations.
Progerin affects the interaction between lamins and polycomb proteins
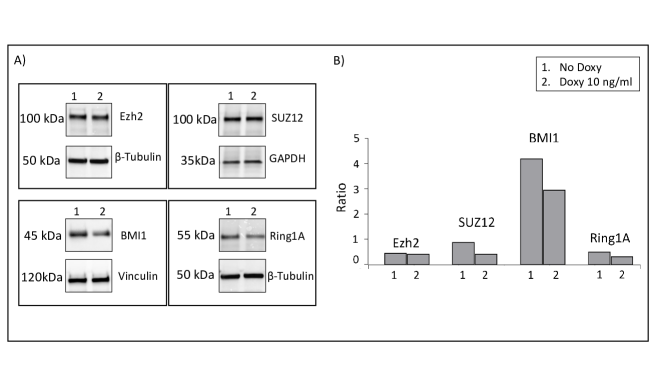
Polycomb Group (PcG) proteins play an important role in chromatin remodeling during development. High-throughput data combined with microscopy analysis revealed a specific organization of their targets in chromatin loops (47, 48) that is altered in lamin A null cells (48). To investigate the interactions between PcG proteins and lamins, we carried out proximity ligation assay. According to this technique, a fluorescent signal is detectable when two proteins are in close proximity (less than 40nm). First, we checked which PcG were expressed in Tet-On Hela cells without the Doxy treatment and after the induction of progerin. As shown in Fig. S13, we detected the presence of EZH2, SUZ12, Ring1A and BMI1. In contrast, Ring1B was not expressed in a detectable way. We carried out Proximity ligation assay for the two PcGs belonging to the two PcG machineries: BMI1 (PcG1) and SUZ12 (PcG2) which are involved in chromatin remodeling through two distinct mechanisms (49) with all the lamins using the PanLamin antibody or with lamin A. As shown in Fig. 5, the interaction between SUZ12 and lamin A is significantly changed by the induction of progerin, while no effect is revealed for BMI1 (Fig. S14).
Computational model indicates the relevance of tethering on lamin domains walls for nuclear bleb formation
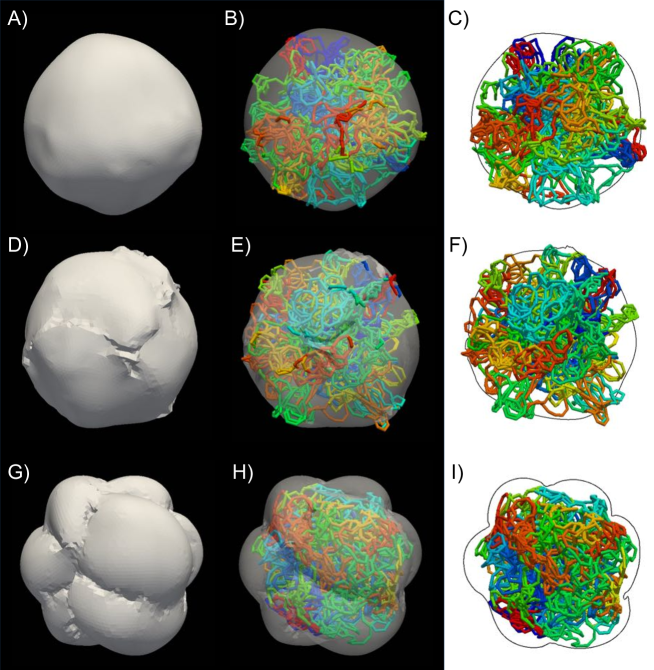
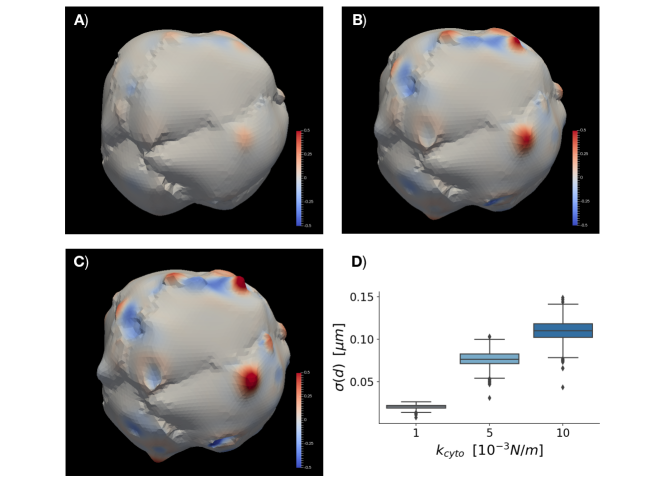
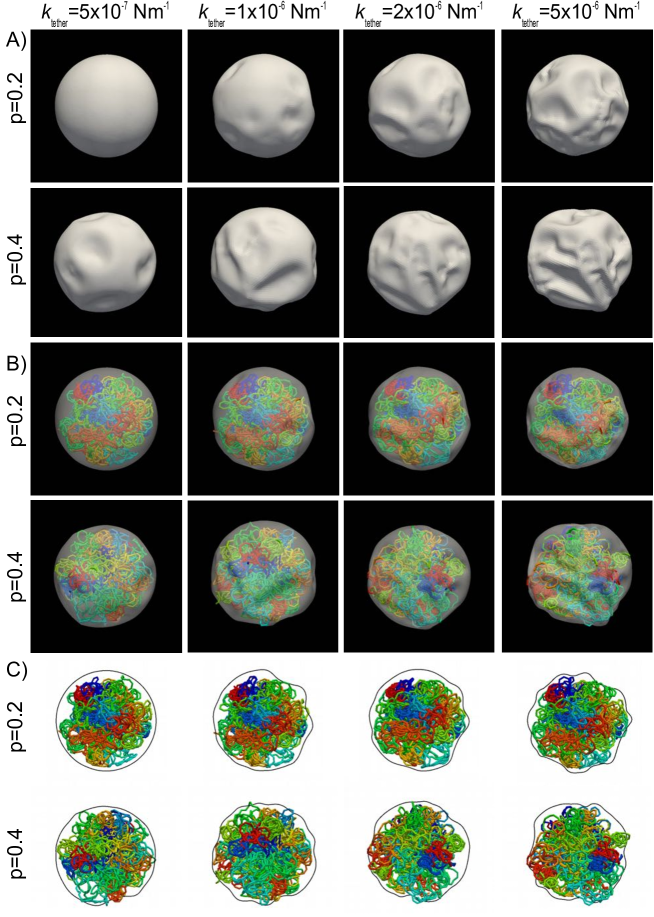
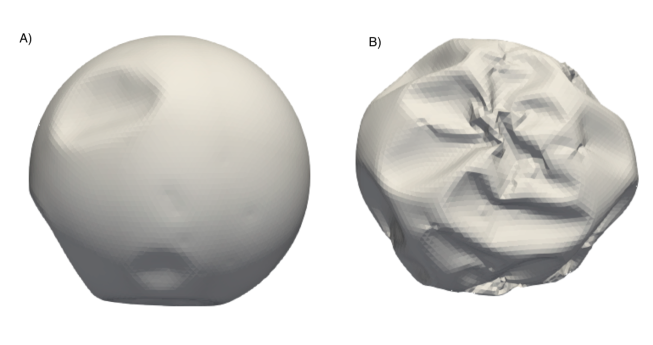
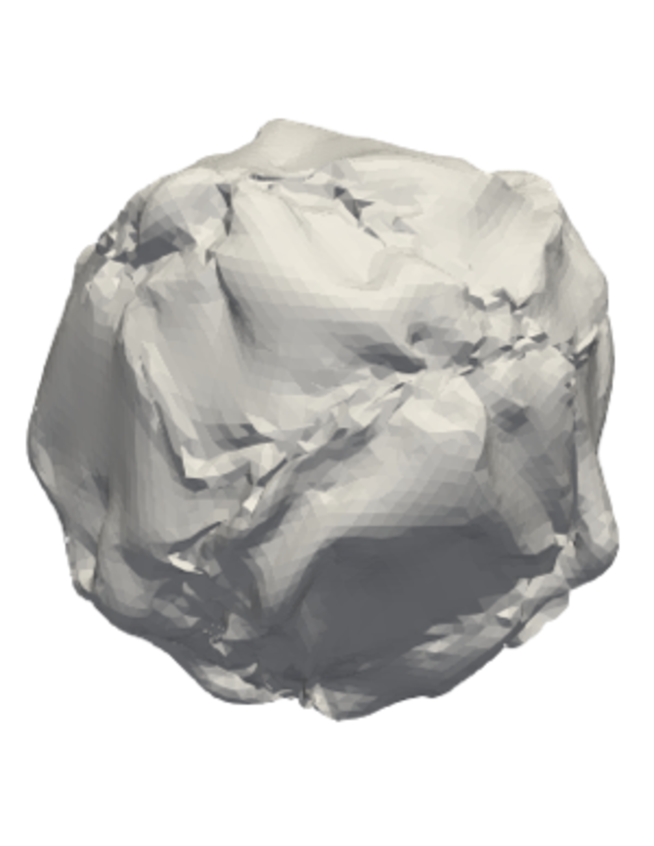
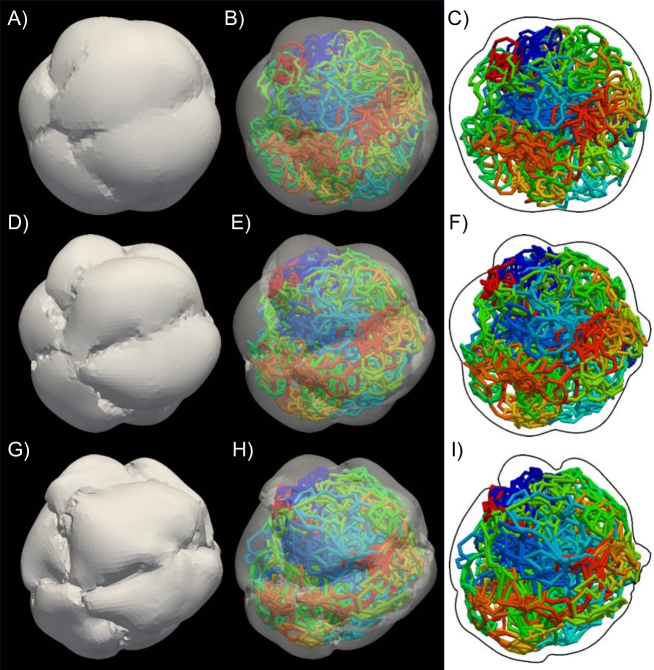
To further investigate the role of chromatin/lamin tethering for nuclear morphological alteration, we performed numerical simulations according to the protocol discussed in the modeling section. We first considered the case in which chromatin tethers were distributed uniformly on the nuclear envelope. As shown in Fig. 6A-C, while surface deformations are present, no distinct blebs are observed. We then varied two key parameters: the density of tethers and their stiffness . As illustrated in Fig. S15, increasing the tether stiffness and their density leads to nuclear alterations. Yet, these morphological alterations are in the form of creases and crumples, that look qualitatively very different from blebs observed experimentally.
Previous experimental results indicate that in HGPS nuclei lamin is organized into domains characterized by distinct orientations as revealed by polarized light microscopy (10). In WT nuclei, lamin filaments have no preferred orientation while in HGPS nuclei, lamin filaments are ordered within distinct domains. To take this observation into account, we introduced lamin domains in the model by defining domain boundaries with low bending stiffness, so that the nuclear shell is folding more easily along those regions. Even in this case, blebs were not observed (Fig. 6D-E) and we recorded only minor alterations with respect to a similar configuration without domain boundaries (Fig. 6A-C).
We then investigated the effect of lamin domains on the coupling between lamins and chromatin. Modifications of the coupling is suggested by the experiments reported in Fig. 3D-F showing that a net reduction of the interactions between lamin and emerin, a chromatin tethering factor. To incorporate this observation into the model, we notice that lamins are disordered in WT nuclei, while they are ordered within domains in HGPS nuclei. Hence, we it is reasonable to assume that chromatin/lamin coupling occurs at the domain wall boundaries where lamin organization is less ordered. Indeed, when chromatin tethers were attached exclusively at the lamin domain boundaries, we were able to recover nuclear shapes with blebs similar to those encountered in experiments (Fig. 6F-H).
To confirm that tethering to lamin domain is essential to account for blebs, we considered alternative non-uniform distribution of the chromatin-lamin tethers. For instance in Fig. S16A, we report simulations results obtained placing all the tether in a single octant of the envelope. No blebs were found, but only localized depressions. When tether are instead placed along a single line, the sphere was found to crumple in a way that is very different from the experimental images (Fig. S16B). The model also allowed us to describe the role of the elasticity of the nuclear envelope. In particular, we find that when the bending stiffness is reduced the smooth blebs observed in Fig. 6G give way to the crumpled surface shown in Fig. S17. Finally, we studied the effect of the stiffness of the chromatin tether on the bleb morphology and found that reducing the stiffness blebs were less pronounced (Fig. S18). In sum, our computational results show that the local organization of the chromatin-lamin tethers is the key factor controlling bleb formation. In particular, lamin domain wall boundaries are pulled inside the nucleus by chromatin tethers, creating the folds required for bleb formation.
Computational model confirms the role of cytoskeleton in nuclear shape fluctuations
As discussed in the previous section, the computational models is able to reproduce the morphological alterations of HGPS nuclei by considering the combined effects of lamin domains and chromatin-lamin tethers. We thus decided to use the model to better understand why nuclear shape fluctuations are enhanced when progerin is overexpressed (see Fig. 4B). We reported in Fig. 2D that progerin induction leads to increased fascin phosphorilation, leading to more stable couplings between cytoskeleton and lamins. We thus incorporated this information into the model by varying the strength of the coupling between cytoskeleton and the nuclear shell.
We simulated cytoskeletal contractions by a set of randomly placed oscillating points attached to the nuclear lamina by springs of stiffness , as described in the model section. Increased fascin phosphorilation was represented by an increasing value of . We then studied the fluctuations of the nuclear shape induced by cytoskeletal activities (for an illustration of the fluctuations see Fig. 7A and Video S1). To quantify nuclear fluctuations, we computed the standard deviation of the radial projection of the local displacement fields as a function of , in close analogy with the 3D morphological analysis summarized in Fig. 4. The results reported in Fig. 7B show that stronger cytoskeletal coupling leads to enhanced fluctuations in good agreement with the results reported in Fig. 4B indicating that progerin overexpression is associated with larger nuclear fluctuations.
Conclusion
In this paper, we introduced an inducible cellular model for progerin, the mutated form of lamin A responsible for HGPS. Through this cellular model, we analyzed how progerin affects nuclear tethering with chromatin and the cytoskeleton. Our results show that progerin expression leads to enhanced tethering between the cytoskeleton and the nuclear shell, through the phosphorilation of S39-fascin, and at the same time to a reduced interaction between lamins and emerin, a known chromatin tether. These changes are reflected in alterations of the mechanical response of the nucleus. In particular, cytoskeletal-induced surface fluctuations of the nuclear shell are increased upon progerin expression.
It has been shown that the coupling between the cytoskeleton and the nuclear shell can affect gene regulation (50) by polycomb-mediated chromatin remodeling (51). Hence, we studied the interaction between lamins and polycomb proteins upon progerin inductions. Our findings show that progerin induction reduces the interactions between lamins and the polycomb protein SUZ12, suggesting progerin expression might impact on PRCs-mediated gene expression regulation.
Finally, we proposed a computational model for nuclear mechanics in which we simulate the conditions leading to nuclear morphological alterations, focusing in particular on the blebs observed in HGPS. Our results show that the presence of lamin domains is essential to recapitulate in silico the observed morphology. A crucial role in bleb formation is played by chromatin-lamin tethers: the presence of homogeneously distributed tethers suppresses blebs or leads to wrinkling of the surface. Blebs are only observed when tethering is concentrated at the boundaries of lamin domains.
Our results are not obtained directly from HGPS cells but from an induced cellular model of progerin in HeLa cells that, however, recapitulates the main features of nuclear morphology and chromatin organization of HGPS cells, as shown for instance by the expression of HP1. Our cellular model overcomes many practical experimental limitations posed by the study of HGPS cells that are able to grow in vitro only for a few passages.
All in all, our study highlights that progerin induction affects in crucial ways the tethering between cytoskeleton, lamins and epigenetic regulation of chromatin status. Simulations suggests that the strength and geometrical organization of these tethers appear to control the morphological alteration observed in the nuclei of HGPS cells. Our observations could be relevant for HGPS where therapeutic strategies should aim at restoring the cytoskeleton-lamin-chromatin coupling integrity.
Author Contributions
MCL performed experiments. MRF, FFC, GC, OC, SZ analyzed data. ZB, SZ designed the computational model. ZB, SB performed numerical simulations. CAMLP designed and coordinated the study. SZ and CAMLP wrote the paper.
Acknowledgments
The research was supported by funding from the Center for Complexity and Biosystems of the University of Milan. We thank C. Giampietro and F. Mutti for useful discussions and assistance at the beginning of the project. S. Z. thanks the Alexander von Humboldt foundation for the Humboldt Research Award for support and Ludwig-Maximilian University and Friedrich-Alexander-Universität Erlangen-Nürnberg for hospitality.
References
- Lammerding et al. (2004) Lammerding, J., P. C. Schulze, T. Takahashi, S. Kozlov, T. Sullivan, R. D. Kamm, C. L. Stewart, and R. T. Lee, 2004. Lamin A/C deficiency causes defective nuclear mechanics and mechanotransduction. The Journal of clinical investigation 113:370–378.
- Lammerding et al. (2006) Lammerding, J., L. G. Fong, J. Y. Ji, K. Reue, C. L. Stewart, S. G. Young, and R. T. Lee, 2006. Lamins A and C but not lamin B1 regulate nuclear mechanics. Journal of Biological Chemistry 281:25768–25780.
- Swift et al. (2013) Swift, J., I. L. Ivanovska, A. Buxboim, T. Harada, P. C. D. P. Dingal, J. Pinter, J. D. Pajerowski, K. R. Spinler, J.-W. Shin, M. Tewari, F. Rehfeldt, D. W. Speicher, and D. E. Discher, 2013. Nuclear lamin-A scales with tissue stiffness and enhances matrix-directed differentiation. Science 341:1240104.
- Schreiner et al. (2015) Schreiner, S. M., P. K. Koo, Y. Zhao, S. G. J. Mochrie, and M. C. King, 2015. The tethering of chromatin to the nuclear envelope supports nuclear mechanics. Nat Commun 6:7159.
- Makhija et al. (2016) Makhija, E., D. S. Jokhun, and G. V. Shivashankar, 2016. Nuclear deformability and telomere dynamics are regulated by cell geometric constraints. Proc Natl Acad Sci U S A 113:E32–40.
- Chu et al. (2017) Chu, F.-Y., S. C. Haley, and A. Zidovska, 2017. On the origin of shape fluctuations of the cell nucleus. Proc Natl Acad Sci U S A 114:10338–10343.
- Goldman et al. (2004) Goldman, R. D., D. K. Shumaker, M. R. Erdos, M. Eriksson, A. E. Goldman, L. B. Gordon, Y. Gruenbaum, S. Khuon, M. Mendez, R. Varga, and F. S. Collins, 2004. Accumulation of mutant lamin A causes progressive changes in nuclear architecture in Hutchinson-Gilford progeria syndrome. Proc Natl Acad Sci U S A 101:8963–8.
- Zwerger et al. (2011) Zwerger, M., C. Y. Ho, and J. Lammerding, 2011. Nuclear mechanics in disease. Annu Rev Biomed Eng 13:397–428.
- Eriksson et al. (2003) Eriksson, M., W. T. Brown, L. B. Gordon, M. W. Glynn, J. Singer, L. Scott, M. R. Erdos, C. M. Robbins, T. Y. Moses, P. Berglund, et al., 2003. Recurrent de novo point mutations in lamin A cause Hutchinson–Gilford progeria syndrome. Nature 423:293–298.
- Dahl et al. (2006) Dahl, K. N., P. Scaffidi, M. F. Islam, A. G. Yodh, K. L. Wilson, and T. Misteli, 2006. Distinct structural and mechanical properties of the nuclear lamina in Hutchinson-Gilford progeria syndrome. Proc Natl Acad Sci U S A 103:10271–10276.
- Verstraeten et al. (2008) Verstraeten, V. L. R. M., J. Y. Ji, K. S. Cummings, R. T. Lee, and J. Lammerding, 2008. Increased mechanosensitivity and nuclear stiffness in Hutchinson-Gilford progeria cells: effects of farnesyltransferase inhibitors. Aging Cell 7:383–93.
- Booth et al. (2015) Booth, E. A., S. T. Spagnol, T. A. Alcoser, and K. N. Dahl, 2015. Nuclear stiffening and chromatin softening with progerin expression leads to an attenuated nuclear response to force. Soft Matter 11:6412–8.
- Berk et al. (2013) Berk, J. M., K. E. Tifft, and K. L. Wilson, 2013. The nuclear envelope LEM-domain protein emerin. Nucleus 4:298–314.
- Clements et al. (2000) Clements, L., S. Manilal, D. R. Love, and G. E. Morris, 2000. Direct interaction between emerin and lamin A. Biochem Biophys Res Commun 267:709–14.
- Zhang et al. (2007) Zhang, Q., C. Bethmann, N. F. Worth, J. D. Davies, C. Wasner, A. Feuer, C. D. Ragnauth, Q. Yi, J. A. Mellad, D. T. Warren, M. A. Wheeler, J. A. Ellis, J. N. Skepper, M. Vorgerd, B. Schlotter-Weigel, P. L. Weissberg, R. G. Roberts, M. Wehnert, and C. M. Shanahan, 2007. Nesprin-1 and -2 are involved in the pathogenesis of Emery Dreifuss muscular dystrophy and are critical for nuclear envelope integrity. Hum Mol Genet 16:2816–33.
- Li et al. (2014) Li, P., P. Meinke, L. T. T. Huong, M. Wehnert, and A. A. Noegel, 2014. Contribution of SUN1 mutations to the pathomechanism in muscular dystrophies. Hum Mutat 35:452–61.
- Markiewicz et al. (2002) Markiewicz, E., R. Venables, Mauricio-Alvarez-Reyes, R. Quinlan, M. Dorobek, I. Hausmanowa-Petrucewicz, and C. Hutchison, 2002. Increased solubility of lamins and redistribution of lamin C in X-linked Emery-Dreifuss muscular dystrophy fibroblasts. J Struct Biol 140:241–53.
- Vignjevic et al. (2006) Vignjevic, D., S.-i. Kojima, Y. Aratyn, O. Danciu, T. Svitkina, and G. G. Borisy, 2006. Role of fascin in filopodial protrusion. J Cell Biol 174:863–75.
- Jayo et al. (2012) Jayo, A., M. Parsons, and J. C. Adams, 2012. A novel Rho-dependent pathway that drives interaction of fascin-1 with p-Lin-11/Isl-1/Mec-3 kinase (LIMK) 1/2 to promote fascin-1/actin binding and filopodia stability. BMC Biol 10:72.
- Elkhatib et al. (2014) Elkhatib, N., M. B. Neu, C. Zensen, K. M. Schmoller, D. Louvard, A. R. Bausch, T. Betz, and D. M. Vignjevic, 2014. Fascin plays a role in stress fiber organization and focal adhesion disassembly. Curr Biol 24:1492–9.
- Jayo et al. (2016) Jayo, A., M. Malboubi, S. Antoku, W. Chang, E. Ortiz-Zapater, C. Groen, K. Pfisterer, T. Tootle, G. Charras, G. G. Gundersen, and M. Parsons, 2016. Fascin Regulates Nuclear Movement and Deformation in Migrating Cells. Dev Cell 38:371–83.
- Vaziri and Mofrad (2007) Vaziri, A., and M. R. K. Mofrad, 2007. Mechanics and deformation of the nucleus in micropipette aspiration experiment. J Biomech 40:2053–62.
- Funkhouser et al. (2013) Funkhouser, C. M., R. Sknepnek, T. Shimi, A. E. Goldman, R. D. Goldman, and M. Olvera de la Cruz, 2013. Mechanical model of blebbing in nuclear lamin meshworks. Proc Natl Acad Sci U S A 110:3248–53.
- Wren et al. (2012) Wren, N. S., Z. Zhong, R. S. Schwartz, and K. N. Dahl, 2012. Modeling nuclear blebs in a nucleoskeleton of independent filament networks. Cell Mol Bioeng 5:73–81.
- Banigan et al. (2017) Banigan, E. J., A. D. Stephens, and J. F. Marko, 2017. Mechanics and Buckling of Biopolymeric Shells and Cell Nuclei. Biophys J 113:1654–1663.
- Stephens et al. (2017) Stephens, A. D., E. J. Banigan, S. A. Adam, R. D. Goldman, and J. F. Marko, 2017. Chromatin and lamin A determine two different mechanical response regimes of the cell nucleus. Mol Biol Cell 28:1984–1996.
- Stephens et al. (2018) Stephens, A. D., E. J. Banigan, and J. F. Marko, 2018. Separate roles for chromatin and lamins in nuclear mechanics. Nucleus 9:119–124.
- Marko (2008) Marko, J. F., 2008. Micromechanical studies of mitotic chromosomes. Chromosome Res 16:469–97.
- Marti-Renom and Mirny (2011) Marti-Renom, M. A., and L. A. Mirny, 2011. Bridging the resolution gap in structural modeling of 3D genome organization. PLoS Comput Biol 7:e1002125.
- Dekker et al. (2013) Dekker, J., M. A. Marti-Renom, and L. A. Mirny, 2013. Exploring the three-dimensional organization of genomes: interpreting chromatin interaction data. Nat Rev Genet 14:390–403.
- Gibcus et al. (2018) Gibcus, J. H., K. Samejima, A. Goloborodko, I. Samejima, N. Naumova, J. Nuebler, M. T. Kanemaki, L. Xie, J. R. Paulson, W. C. Earnshaw, L. A. Mirny, and J. Dekker, 2018. A pathway for mitotic chromosome formation. Science 359.
- de Chaumont et al. (2012) de Chaumont, F., S. Dallongeville, N. Chenouard, N. Hervé, S. Pop, T. Provoost, V. Meas-Yedid, P. Pankajakshan, T. Lecomte, Y. Le Montagner, T. Lagache, A. Dufour, and J.-C. Olivo-Marin, 2012. Icy: an open bioimage informatics platform for extended reproducible research. Nat. Methods 9:690–696.
- Thielicke and Stamhuis (2014) Thielicke, W., and E. Stamhuis, 2014. PIVlab – Towards User-friendly, Affordable and Accurate Digital Particle Image Velocimetry in MATLAB. Journal of Open Research Software 2.
- Chepizhko et al. (2016) Chepizhko, O., C. Giampietro, E. Mastrapasqua, M. Nourazar, M. Ascagni, M. Sugni, U. Fascio, L. Leggio, C. Malinverno, G. Scita, S. Santucci, M. J. Alava, S. Zapperi, and C. A. M. La Porta, 2016. Bursts of activity in collective cell migration. Proc Natl Acad Sci U S A 113:11408–11413.
- Jones et al. (2001a) Jones, E., T. Oliphant, P. Peterson, et al., 2001. SciPy: Open source scientific tools for Python. http://www.scipy.org/, http://www.scipy.org/.
- Dufour et al. (2011) Dufour, A., R. Thibeaux, E. Labruyère, N. Guillén, and J.-C. Olivo-Marin, 2011. 3-D active meshes: fast discrete deformable models for cell tracking in 3-D time-lapse microscopy. IEEE Trans. Image Process. 20:1925–1937.
- Kuhn (2005) Kuhn, H. W., 2005. The Hungarian method for the assignment problem. Nav. Res. Logist. 52:7–21.
- Jones et al. (2001b) Jones, E., T. Oliphant, and P. Peterson, 2001. SciPy: Open source scientific tools for Python.
- Naumova et al. (2013) Naumova, N., M. Imakaev, G. Fudenberg, Y. Zhan, B. R. Lajoie, L. A. Mirny, and J. Dekker, 2013. Organization of the mitotic chromosome. Science 342:948–53.
- Ozer et al. (2015) Ozer, G., A. Luque, and T. Schlick, 2015. The chromatin fiber: multiscale problems and approaches. Curr Opin Struct Biol 31:124–39.
- Meaburn and Misteli (2007) Meaburn, K. J., and T. Misteli, 2007. Chromosome territories. Nature 445:379–381.
- Plimpton (1995) Plimpton, S., 1995. Fast parallel algorithms for short-range molecular dynamics. Journal of computational physics 117:1–19.
- Reunert et al. (2012) Reunert, J., R. Wentzell, M. Walter, S. Jakubiczka, M. Zenker, T. Brune, S. Rust, and T. Marquardt, 2012. Neonatal progeria: Increased ratio of progerin to lamin A leads to progeria of the newborn. European Journal of Human Genetics 20:933–937. https://www.scopus.com/inward/record.uri?eid=2-s2.0-84865273590&doi=10.1038%2fejhg.2012.36&partnerID=40&md5=cc85f9a5df5e63cf17c9450916c63467.
- Vidak et al. (2015) Vidak, S., N. Kubben, T. Dechat, and R. Foisner, 2015. Proliferation of progeria cells is enhanced by lamina-associated polypeptide 2 (LAP2) through expression of extracellular matrix proteins. Genes and Development 29:2022–2036. https://www.scopus.com/inward/record.uri?eid=2-s2.0-84943572682&doi=10.1101%2fgad.263939.115&partnerID=40&md5=eee93f035d60598e0a027f8e8cadce98.
- Scaffidi and Misteli (2008) Scaffidi, P., and T. Misteli, 2008. Lamin A-dependent misregulation of adult stem cells associated with accelerated ageing. Nat Cell Biol 10:452–9.
- Gabriel et al. (2015) Gabriel, D., D. Roedl, L. B. Gordon, and K. Djabali, 2015. Sulforaphane enhances progerin clearance in Hutchinson-Gilford progeria fibroblasts. Aging Cell 14:78–91.
- Cmarko et al. (2003) Cmarko, D., P. J. Verschure, A. P. Otte, R. van Driel, and S. Fakan, 2003. Polycomb group gene silencing proteins are concentrated in the perichromatin compartment of the mammalian nucleus. J Cell Sci 116:335–43.
- Bantignies and Cavalli (2011) Bantignies, F., and G. Cavalli, 2011. Polycomb group proteins: repression in 3D. Trends Genet 27:454–64.
- Chittock et al. (2017) Chittock, E. C., S. Latwiel, T. C. R. Miller, and C. W. Müller, 2017. Molecular architecture of polycomb repressive complexes. Biochem Soc Trans 45:193–205.
- Swift and Discher (2014) Swift, J., and D. E. Discher, 2014. The nuclear lamina is mechano-responsive to ECM elasticity in mature tissue. J Cell Sci 127:3005–15.
- Le et al. (2016) Le, H. Q., S. Ghatak, C.-Y. C. Yeung, F. Tellkamp, C. Günschmann, C. Dieterich, A. Yeroslaviz, B. Habermann, A. Pombo, C. M. Niessen, and S. A. Wickström, 2016. Mechanical regulation of transcription controls Polycomb-mediated gene silencing during lineage commitment. Nat Cell Biol 18:864–75.
- Notredame et al. (2000) Notredame, C., D. G. Higgins, and J. Heringa, 2000. T-Coffee: A novel method for fast and accurate multiple sequence alignment. J Mol Biol 302:205–17.


Supplementary Material
An online supplement to this article can be found by visiting BJ Online at http://www.biophysj.org.
.
••
![[Uncaptioned image]](/html/2003.08232/assets/x26.png)
| Biological element | Number of beads | Organization |
|---|---|---|
| Nuclear lamina | 10242 | initialized as a sphere of radius 6 m |
| Chromatin | 5888 | 46 polymers with 128 monomers each |
| Cytoskeleton | 100 | randomly distributed around the nuclear lamina |
| Bond link | [10-3N/m] | [10-6m] | |
| lamina beads | 5.0 | 0.15 - 0.25 | |
| monomers of chromatin filament | 1.0 | 0.6 | |
| lamina - chromatin ( with density ) | 0.1 | 0.1 | |
| lamina - cytoskeleton () | 1,5,10 | 0.8 - 12 | |
| Improper | [10-15J rad-2] | [deg] | |
| lamina beads | 1.0 | 180 | |
| lamina beads - domain walls | 0.01 | 180 | |
| Harmonic angle | [10-15J rad-2] | [deg] | |
| monomers of chromatin filament | 0.2 | 130 | |
| LJ interaction | [10-15J] | [10-6m] | [10-6m] |
| chromatin - chromatin | 1.0 | 0.12 | 0.2 |
| lamina - chromatin | 1.0 | 0.6 | 0.6 |
Supplementary video caption
Video S1. A simulation of the nuclear fluctuations induced by cytoskeletal contractions. Local expansion is marked in red and contraction in blue.