Local AGN Survey (LASr): I. Galaxy sample, infrared colour selection and predictions for AGN within 100 Mpc
Abstract
In order to answer some of the major open questions in the fields of supermassive black hole (SMBH) and galaxy evolution, a complete census of SMBH growth, i.e., active galactic nuclei (AGN), is required. Thanks to deep all-sky surveys, such as those by the Wide-field Infrared Survey Explorer (WISE) and the Spectrum-Roentgen-Gamma (SRG) missions, this task is now becoming feasible in the nearby Universe. Here, we present a new survey, the Local AGN Survey (LASr), with the goal of identifying AGN unbiased against obscuration and determining the intrinsic Compton-thick (CT) fraction. First, we construct the most complete all-sky sample of galaxies within 100 Mpc from astronomical databases ( completeness for ), four times deeper than the current local galaxy reference, the Two Micron All-Sky Survey Redshift Survey (2MRS), which turns out to miss of known luminous AGN. These 49k galaxies serve as parent sample for LASr, called LASr-GPS. It contains 4.3k already known AGN, of these are estimated to have erg s-1, i.e., are low-luminosity AGN. As a first method for identifying Seyfert-like AGN, we use WISE-based infrared colours, finding 221 galaxies at erg s-1 to host an AGN at reliability, This includes 61 new AGN candidates and implies and optical type 2 fraction of 50 to . We quantify the efficiency of this technique and estimate the total number of AGN with erg s-1 in the volume to be ( 10-5 Mpc-3). X-ray brightness estimates indicate the CT fraction to be 40–55% to explain the Swift non-detections of the infrared selected objects. One third of the AGN within 100 Mpc remain to be identified and we discuss the prospects for the eROSITA all-sky survey.
keywords:
galaxies: active – galaxies: Seyfert – infrared: galaxies – X-rays: galaxies1 Introduction
Today it is commonly accepted that all massive galaxies host a supermassive black hole (SMBH) at their centres. Furthermore, there is increasing evidence that the SMBHs somehow co-evolve with their host galaxies as, for example, indicated by empirical scaling relations between the SMBH mass and galaxy properties, such as the stellar velocity dispersion or stellar mass of the spheroidal component (e.g., Kormendy & Ho 2013; Shankar et al. 2016). The existence of such relations is somewhat surprising given the many orders of magnitude difference in size between the black hole sphere of influence and the bulk of the galaxy. This raises the questions of how the feeding of the SMBH exactly works (e.g., Alexander & Hickox 2012), and if there is significant feedback from the SMBH onto the host galaxies. The latter process is postulated by current cosmological simulations to suppress star formation and explain the galaxy population as observed today in the nearby Universe (e.g., Granato et al. 2004; Shankar et al. 2006; Lapi et al. 2006).
The last decades of research have significantly increased our understanding of SMBH growth (see Netzer 2015 for a recent review). We know that SMBHs grow through several phases over cosmic time, during which large amounts of matter are accreted. During its journey towards the event horizon, the material forms an accretion disk which, due to the release of gravitational energy, emits large amounts of radiation, mostly in the ultraviolet (UV) which then is partly reprocessed by surrounding material and secondary processes. As a result, the galaxy nuclei appear as bright compact sources, often outshining the rest of the galaxy. They are called active galactic nuclei (AGN). AGN are bright emitters across most of the electromagnetic range and, thus, detectable throughout the entire visible Universe which allows us to directly trace SMBH growth over cosmic history. In addition, AGN can produce strong outflows which are prime candidates for the feedback onto the host galaxy postulated above. However, to robustly answer which processes are dominating the SMBH growth and the feedback, we require a complete census of the AGN phenomenon. For example, precise knowledge of the AGN number counts in the local Universe would provide tight constraints on the duty cycle of AGN, radiative efficiencies and the luminosity and accretion rate distributions (e.g., Martini & Weinberg 2001; Goulding et al. 2010; Shankar et al. 2009; Shankar et al. 2019). Such a census is very challenging to carry out. First of all, the accretion rates of SMBHs span a wide range from essentially zero up to values in excess of the Eddington limit. Therefore, AGN span a huge range in luminosities from the nearly quiescent Galactic Centre, Sgr A∗, to the most powerful quasars roughly twelve orders of magnitude more luminous. Faint AGN are difficult to detect, in particular if they do not outshine their host galaxy at some wavelengths. Moreover, the majority of SMBH growth seems to be highly obscured from our lines of sight (e.g., Fabian 1999; Ueda et al. 2014; Buchner et al. 2015; Ricci et al. 2015). So what is the best, i.e., most efficient and least biased, way to find all the AGN? Our best chance to achieve this is certainly in the nearby Universe, where the sensitivity and angular resolution of our instruments can be used to their largest effect for finding and characterising even highly obscured AGN. This is the ultimate goal of the new survey presented here, the Local AGN Survey (LASr). Its design is motivated by the following insights.
1.1 Selecting AGN in the X-ray regime
So far, one of the most successful ways to identify AGN has proven to be in the hard X-ray regime ( keV). Here, most AGN are luminous owing to UV photons from the accretion disk being Compton-up-scattered to higher energies by hot electrons. These electrons are most likely part of a coronal region surrounding the innermost accretion disk. As a result, AGN are easily more luminous in X-ray than any other non-transient astronomical objects. Another advantage is that X-ray emission are less affected by extinction than longer wavelength emission. Both reasons together make AGN selection at these energies very reliable. Specifically, the ongoing all-sky scan at 14-195 keV with the Burst Alert Telescope (BAT; Barthelmy et al. 2005) on the Swift satellite (Gehrels et al., 2004) provided us with the so far least biased local AGN samples (Markwardt et al., 2005; Tueller et al., 2008; Baumgartner et al., 2013). Prominent examples are the Luminous Local AGN with Matches Analogues sample (LLAMA; Davies et al. 2015; see Riffel et al. 2018 for the Northern analogue) and the BAT AGN Spectroscopic Survey (BASS) samples, e.g., after 70 month scanning time (hereafter B70 AGN sample; Koss et al. 2017; Ricci et al. 2017).
However, even the BAT AGN samples are restricted in two ways. First, the sensitivity of this selection method is relatively low because of the low photon counts. This caveat results in relatively high flux limits, so that even relatively powerful AGN remain undetected by BAT. Second and more importantly, even at such high energies, Compton-thick (CT) obscuration () extinguishes the intrinsic flux by factors of ten and larger, resulting in a detection bias against CT obscured AGN. This last point is a severe problem because the intrinsic fraction of CT-obscured AGN is probably around (e.g., Ricci et al. 2015; Lansbury et al. 2017; Georgantopoulos & Akylas 2019, Boorman et al., in prep.), and possibly even up (Ananna et al. 2019; but see Gandhi et al. 2007). Both caveats will be somewhat mitigated in the future with deeper Swift/BAT maps although only slowly as the mission has already reached more than eight years of total integration time. The newest X-ray satellite, the Russian-German “Spectrum-Roentgen-Gamma” (SRG) mission could allow for advance in this matter. It hosts two telescopes which will perform a four-year all-sky survey at complementary X-ray energies, namely the extended ROentgen Survey with an Imaging Telescope Array (eROSITA; Predehl et al. 2010; Merloni et al. 2012) operating at 0.2-10 keV and the Astronomical Roentgen Telescope - X-ray Concentrator (ART-XC; Pavlinsky et al. 2011, 2018) operating at 4-30 keV. In terms of detecting AGN with their X-ray emission described by a typical power-law, these surveys are expected to be approximately ten times deeper than the current Swift/BAT survey. Thus, these surveys are our best chance to probe the local AGN population at sufficient depth, in particular to detect (or place stringent constraints on) many of the still missing CT AGN.
1.2 Selecting AGN in the mid-infrared regime
Complementary to X-ray selection of AGN is selection in the mid-infrared (MIR). About half of the primary emission from the accretion disk is absorbed by dust, surrounding the AGN probably on parsec scales in a more or less coherent structure (see Almeida & Ricci 2017 and Hönig 2019 for recent reviews). As a result, this dust is heated to temperatures of several hundred Kelvins and radiates thermally with the emission peaking in the MIR ( to ). Owing to the more extended and probably clumpy structure of the dust, obscuration becomes a secondary effect at this wavelength regime and usually does not exceed a factor of a few, even in the worst cases (Stalevski et al., 2016). This makes MIR emission a formidable tracer of the primary power of the AGN and allows a highly complete selection. The recent all-sky survey of the Wide-field Infrared Survey Explorer (WISE; Wright et al. 2010) allowed for the most progress here in the last years, thanks to its high sensitivity and spectral coverage. However, AGN selection in the MIR has some major caveats as well, namely, severe contamination by emission of stellar origin. At shorter wavelengths, , this includes radiation of old stars, while at longer wavelengths, , dust heated by young stars in star forming regions can dominate the total MIR emission of galaxy. Moreover, AGN and intense star formation events often occur together in time and space, e.g., triggered through galaxy interaction and mergers. Therefore, any AGN selection in the MIR is prone to host contamination. Finally, both X-ray and MIR selection are biased against low luminosity and low accretion rate objects, in particular if the SMBH accretes radiatively inefficiently (e.g., Ho 2009). Such systems can be much more efficiently selected at radio wavelengths (e.g., Best et al. 2005; Padovani 2016; Tadhunter 2016; Baldi et al. 2018).
1.3 The new local AGN survey
The discussion above shows that no single selection technique can lead by itself to a complete, unbiased AGN sample (see Hickox & Alexander 2018 for a comprehensive review on AGN selection). Instead a combination of techniques is required. This is the approach of LASr. Specifically, we want to combine the advantages of the high completeness achievable in the MIR and the high level of reliability in the X-rays to identify all efficiently accreting SMBHs. Applied to the all-sky surveys of WISE , eROSITA and ART-XC, combined with our nearly complete knowledge of the local galaxy population, LASr should allow us to significantly improve our understanding of the local AGN population and construct the most complete AGN census yet in the nearby Universe with particular focus on the highly obscured objects.
LASr will be performed throughout a series of papers, combining different AGN identification techniques to construct a highly complete AGN sample as final result. In this first paper, we start LASr by selecting the survey volume, assembling the parent sample of galaxies, and employing the first AGN identification technique. Specifically, we create a list of all known galaxies within the volume (Sect. 2) called the LASr galaxy parent sample (LASr-GPS). It will serve as a base sample for the application of different AGN identification techniques. In this paper, we focus on the MIR and use the WISE catalogs to first characterise LASr-GPS in terms of completeness and bulge MIR properties (Sect. 3) before starting the AGN census (Sect. 4). This first includes the characterisation of the already known AGN in the volume, followed by the application of the first AGN identification technique, namely by WISE colours. This is the most easily-available technique, allowing us to find most of the more luminous AGN in the sample, i.e., those that are more luminous than their host galaxy in at least one WISE band. Usually, this is the case for AGN with bolometric luminosities (e.g., Alexander et al. 2005) and corresponds to AGN classified as “Seyferts” based on their optical emission line ratios. Such AGN probe significant SMBH growth, which seem to be the most relevant for our main science questions, i.e., cases that contribute significantly to the total mass budget of the SMBH and/or cases where sufficient energy is released to have an impact on the host galaxy. The big advantage of MIR colour selection is that it is little affected by obscuration bias, allowing us to identify highly obscured AGN with particular focus on new CT candidates. We discuss the newly found AGN and CT AGN candidates in Sect. 4.4 and Sect. 4.5, respectively, including the prospects to detect them in X-rays. Throughout this work, we will use the so far least biased AGN sample, the B70 AGN sample, in order to characterise the selection steps of LASr AGN. Specifically, the characterisation of the MIR colour-based AGN identification technique employed here allows us to estimate the total number counts of AGN in our volume (Sect. 4.6). This paper is then concluded by a comparison of these numbers to luminosity functions from the literature (Sect. 4.7).
In future papers, we will employ additional MIR-based AGN identification techniques, e.g., variability and SED decomposition, as well as present follow-up observations of AGN candidates. The highly complementary X-ray-based AGN identification can then be provided by the eROSITA and ART-XC all-sky surveys once available.
2 Creation of the galaxy parent sample
In this section, we first describe the motivation for the selection of the volume for LASr. Next, we require a galaxy parent sample highly complete in terms of galaxies sufficiently massive to host an AGN, which can then be used to select AGN from. We will see that current local galaxy samples do not fulfill this criterion so that we have to assemble our own galaxy parent sample. Finally, we describe the assembly of the galaxy properties relevant for this work, namely the coordinates, redshifts, and distances, allowing us to find the MIR counterparts of the galactic nuclei and compute their luminosities.
2.1 Selection of the volume
We wish to construct a highly complete census of SMBH growth in the local Universe. The choice of volume to be used for this purpose is motivated by several factors.
-
•
In order to obtain a census that is representative for the whole AGN population, the volume needs to be representative of the larger scale, low redshift Universe. It is estimated that cosmological isotropy is reached for length scales of Mpc with km s-1Mpc-1 and the Hubble constant (Sarkar et al., 2019).
-
•
The volume should also be large enough to sample rarer AGN sub-populations in sufficient numbers to yield statistically robust conclusions on their relevance. Here particular emphasis should be on the high luminosity AGN regime because these may dominate the integrated black hole growth and AGN feedback (e.g., Aird et al. 2010; Fabian 2012). However, high-luminosity AGN have a low space density. For example, current estimates of the AGN luminosity function in X-rays, e.g., Aird et al. (2015), let us expect a space density of Mpc-3 for AGN with an intrinsic X-ray luminosity of , e.g., objects within a sphere of Mpc radius.
-
•
On the other hand, the volume should be small enough so that the depth of the all-sky surveys, used to identify and characterise the AGN, is sufficient to probe the lower parts of the AGN luminosity range. This is particularly important in the X-rays where extinction is large for obscured AGN. For example, the final all-sky maps of eROSITA and ART-XC are expected to have depths of and at 2-10 keV, respectively (Merloni et al., 2012; Pavlinsky et al., 2018), which corresponds to a distance of Mpc for an observed X-ray luminosity of . However, CT AGN are suppressed by easily a factor of 10 to at these wavelengths.
-
•
The MIR is much less affected by extinction, but sensitivity is the key restricting factor. I.e., the WISE all-sky maps have an average depth capable of detecting an AGN with a 12 luminosity up to a distance of 220 Mpc with in band 3 (W3 mag; WISE documentation111http://wise2.ipac.caltech.edu/docs/release/allsky/).
-
•
Another factor to take into account is that the completeness of our parent sample of galaxies directly restricts the completeness of our AGN search. According to a recent estimate, our all-sky redshift completeness is only for galaxies with a redshift (Kulkarni et al., 2018), and the completeness is quickly dropping towards higher redshifts.
-
•
Finally, once identified, we need to follow-up and characterise all the AGN in the volume. We are especially interested in spatially resolving the in and outflows on sub-kiloparsec scales for as many objects as possible, which puts a feasibility-based upper limit on the volume. For example, at an object distance of Mpc, one kiloparsec corresponds to one arcsec on sky, which is close to the effective resolution limit of most telescopes.
The above factors advocate to implement LASr as an all-sky survey with a spherical volume given by a radius between Mpc and Mpc. While, we plan to later use the larger value, 250 Mpc, we start LASr first with the lower value, 100 Mpc, to verify our approach. Using the cosmological parameters of Collaboration et al. (2016), an object distance of 100 Mpc corresponds to a redshift of .
2.2 On the 2MRS galaxy sample
The current, commonly used reference sample for the local galaxy population is based on the the Two Micron All Sky Survey (2MASS; Skrutskie et al. 2006), namely the 2MASS Redshift Survey (2MRS; Huchra et al. 2012). It contains 45k galaxies which were selected from the 2MASS Extended Source Catalog (XSC) and the 2MASS Large Galaxy Atlas (LGA; Jarrett et al. 2003) according to the following criteria, a) detected in the -band with mag; b) low foreground extinction with mag; and c) sufficiently far from the Milky Way plane with for and otherwise with and being the Galactic longitude and latitude, respectively. For of the objects, redshifts were collected from the literature or dedicated follow-up observations by Huchra et al. (2012), so that the final galaxy sample with redshifts comprises 43.5k galaxies. Out of those, 15k galaxies are within 100 Mpc distance from us, to which we refer to simply as the “2MRS sample” in the following.
So far, it has been assumed that the 2MRS sample contains all major galaxies, at least outside of the Galactic plane. However, of the host galaxies of the 191 B70 AGN within Mpc are not part of the 2MRS. This fraction increases to for Mpc. Since we aim at a final completeness of for AGN-hosting galaxies, we have to complement the 2MRS sample (next section). The necessity of this extension of the 2MRS is further discussed in Sect. 3.1.
2.3 The LASr-GPS
In order to build our parent sample of galaxies for LASr, hereafter LASr-GPS, we combine the 2MRS with galaxies from the major public astronomical databases. Namely, the LASr-GPS is created by querying the December 2018 release of the NASA/IPAC Extragalactic Database (NED222http://ned.ipac.caltech.edu/), the May 2018 release of the Centre de Données astronomiques de Strasbourg (CDS) Set of Identifications, Measurements and Bibliography for Astronomical Data (SIMBAD333http://simbad.u-strasbg.fr/simbad/; Wenger et al. 2000), and the most recent, i.e., 15th, data release of the Sloan Digital Sky Survey (SDSS444https://www.sdss.org; Blanton et al. 2017; Aguado et al. 2019) for all objects within the redshift limit.
A multi-stage cleaning process is necessary with iterations before and after merging of these different subsets to remove duplications, spurious redshifts and other contaminants in order to obtain a clean galaxy sample. The full assembly process is illustrated in Fig. 1.
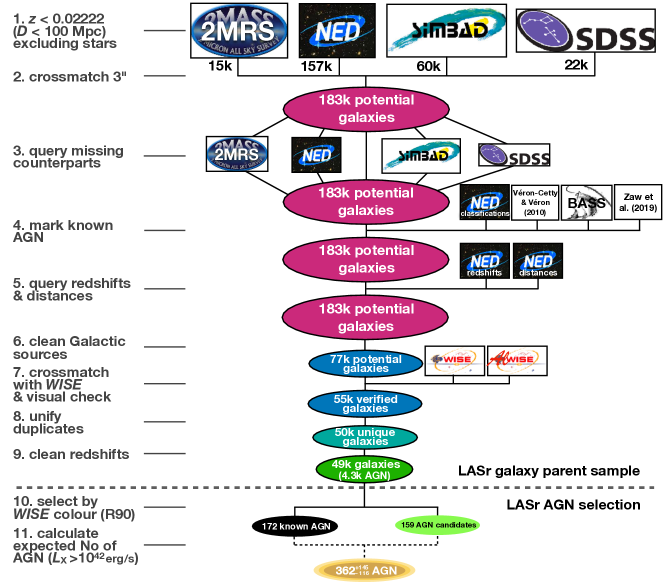
Its order is partly dictated by practical aspects in the selection process.
In short, we first exclude all objects classified as stars if they have a redshift as well as objects with unreliable or photometric redshifts (step 1 in Fig. 1), yielding 157k, 60k, and 22k from NED, SIMBAD and SDSS respectively. We crossmatch these subsets in step 2, unifying all matches within a cone of 3 arcsec radius555 The radius is chosen to be well below the angular resolution of WISE and prevent incorrect matches. . Not for all objects a counterpart is found in every subset. However, many of these objects actually have entries in NED, SIMBAD or SDSS but either without assigned redshift or are classified as stars in that database. Thus, they were not selected in step 1. In order to gather as much information as possible about each object, we therefore query for all still missing counterparts in the corresponding databases (step 3). These steps yield 183k potential galaxies.
Next, we identify all known AGN within these potential galaxies by crossmatching with all major literature samples of AGN (step 4; see Sect. 2.4 for details)666 This is done at this early stage to ensure we are not losing any relevant objects in the following steps. . In the next steps, 5 and 6, we first add the NED compiled redshifts and redshift-independent distances (NED-D; Steer et al. 2017) and then use the added information from all the crossmatching to perform another cleaning of Galactic objects. This is necessary because many objects are unclassified (or even erroneously classified as galaxies) in some of the databases but then identified as Galactic objects in others. Most of these contaminants result from previous SDSS data releases included in NED and SIMBAD. Those contaminants we can now eliminate by using the most recent and improved classifications of SDSS DR15. Specifically, we exclude all objects which have either (i) at least one classification as Galactic object but none as galaxy in NED, SIMBAD and SDSS (63k cases); (ii) at least two classifications as Galactic objects (4.8k cases); (iii) at least one classification as Galactic object and a redshift (20k cases); or (iv) no classification as galaxy and a redshift (18k cases). This redshift threshold is determined from SDSS DR15 with the probability of being a genuine galaxy being for all redshifts lower than that. We make sure to keep all 2MRS galaxies during this step and check all doubtful cases individually to make sure that we do not erroneously exclude any genuine galaxy. As a result of this cleaning, the sample is further reduced to 77k potential galaxies. Then, we perform crossmatching with WISE (step 7; see Sect. 2.7). During this step, we also check all objects visually and identify another 22k contaminants. These are either entries from NED and SIMBAD where no optical counterpart is identifiable in the vicinity of the given coordinates, or cases where the coordinates point to a part of another galaxy in the sample. The reason for the latter can be inaccurate coordinates in NED and SIMBAD or multiple fibers placed on different parts of larger galaxies in SDSS. This step is also used to correct coordinates of galaxies that are offset from its nucleus, or geometric centre (if the nucleus is unidentifiable). The final two steps (8 and 9) clean the remaining duplicates, e.g., objects sharing the same WISE counterpart, as well as objects with erroneous redshifts (see Sect. 2.6).
The final galaxy sample contains 49k visually verified galaxies and includes all but 3 of the 15k 2MRS galaxies in the volume777 The excluded are: NGC 6822 aka 2MASX J19445619-1447512 is a very nearby dwarf galaxy which is over-resolved in WISE and 2MASS and thus can not be included. 2MASX J18324515-4131253 is actually part of ESO 336-3. which is also in 2MRS, and, thus, it is excluded. 2MFGC 02101 is most likely a foreground star in the outskirts of NGC 1035 which is also in the 2MRS. . Therefore, the LASr-GPS can indeed be seen as an extension of the 2MRS, and all the following steps performed with the LASr-GPS apply in equal measure to the 2MRS, unless mentioned otherwise. The galaxies are listed in Table 1 which is available in its entirety online. The LASr-GPS forms the parent sample for searching local AGN.
2.4 Identification of known AGN
In our quest for a highly complete AGN sample, we benefit from the large amount of literature that already identified many of the AGN in our volume. NED and SIMBAD have collected a lot of these classifications which we obtained together with the object queries. In addition, for NED, we query the website of each individual object to extract the homogenized activity class as well as the basic description ("classifications") that also often contains information about any AGN in the system. This results in 2617 AGN classifications from NED and 4398 from SIMBAD. SDSS also provides AGN identifications based on an automatic assignment from the template fitting to the optical spectra, resulting in 271 automatic AGN classifications among the SDSS galaxies.
We complement these classifications with the two largest independent AGN collections, namely Véron-Cetty & Véron (2010) and Zaw et al. (2019). The former authors have collected 169k AGN from the literature of which 1135 are in our volume, while the latter have analysed all available optical spectra of the 2MRS galaxies, resulting in 8.5k AGN identifications of which 3078 are in our volume. Finally, we add the new AGN identifications of the 191 B70 AGN within our volume.
In total, this leads to 4309 known AGN among the 49k galaxies of the LASr-GPS, of which 3887 are also in the 2MRS sample. Most of these have been identified using optical spectroscopic classifications. We adopt optical AGN type classifications whenever they are available in the databases. In addition, for the narrow-line AGN from Zaw et al. (2019), we perform the Seyfert, LINER (low-ionization nuclear emission-line region) and H II nucleus classification based on the emission line fluxes published in that work and the AGN diagnostics of Kewley et al. (2006). This way, we could retrieve optical type classifications for (4101 of 4309) of the known AGN including 2409 Seyfert , 2053 LINER and 1777 H II classifications888 The remaining 208 objects are simply classified as ”AGN” in the databases without any optical type given. . Here, we allow for multiple classifications of the same object999 There are 402 objects classified both as Seyfert and LINER, 993 as Seyfert and H II and 846 as LINER and H II. which is the case for of the AGN and to a large part the likely result of varying spectroscopic aperture, data quality and classification methods used. In addition, some of the AGN identifications might be unreliable, in particular if the object has not been optically classified as Seyfert (1900 objects). Most of the latter are optically classified as LINERs which is a controversial class with respect to its AGN nature because also stellar phenomena can produce similar emission line ratios (e.g., Stasińska et al. 2008; Cid Fernandes et al. 2010; Cid Fernandes et al. 2011; Yan & Blanton 2012; Belfiore et al. 2016; Hsieh et al. 2017). These caveats have to be taken into account when using this compilation of classifications, and, in this work, we use them only for indicative purposes. The same applies to the more detailed Seyfert obscuration type classifications, where we find 1012 objects classified as type 1 (Sy 1.x) and 1545 as type 2 (Sy 2) with (219) of the objects having both classifications or intermediate type (Sy 1.8 or Sy 1.9). If we exclude all objects with multiple optical classifications, 490 type 1 and 475 type 2 AGN remain.
2.5 Identification of known starbursts
Not only AGN can produce significant MIR emission but also intense star formation does. Therefore, starbursts are the main source of contamination for AGN selection in the MIR (e.g., Hainline et al. 2016). In order to understand the effects of starbursts on the MIR appearance of galaxies, we also collect galaxies explicitly classified as starbursts in either of the databases, resulting in 4006 starbursts, mostly from SDSS (3762 objects). Similar to the known AGN, the starburst sample is probably highly incomplete, but it shall serve us to understand the locus of starburst galaxies in the different parameter distributions in comparison to the AGN. The corresponding objects are marked as well in Table 1.
2.6 Determination of redshifts & distances
The most fundamental quantity that we require for each galaxy is its distance from us, not only to decide whether the galaxy is within our volume but also to determine its luminosity. For most galaxies, the distance is estimated from the redshift for which we generally prefer the value provided by SDSS DR15, or NED if the former is not available. We consider a redshift robust if we either have a robust value in SDSS DR15 (their redshift confidence flag = 0), or we have at least two independent redshift measurements from all databases combined (including the redshift compilations in NED). Otherwise, we consider the redshift somewhat uncertain and use a redshift confidence flag in Table 1 to mark these cases with a value of 1 ( of the LASr-GPS), meaning that these values are not verified but there is no suspicion of a problem either. In addition, there are several cases where the different redshift measurements are discrepant (standard deviation of measurements ; of all galaxies). In most of these cases, only one of the redshift measurements for the affected object is offset from the rest, often by a factor of two or more. In particular for the very nearby galaxies, we can thus often guess the “right” redshift from the visual size of the galaxy. For objects with discrepant redshifts, where we can not make a clear decision based on all available information, we assign a value of 2 to the redshift confidence flag ( of the LASr-GPS), meaning that those redshifts are controversial and can not be trusted. Therefore, we have robust redshifts for of the galaxies.
With the redshifts, we compute the luminosity distance, , for all galaxies. However, in the nearby Universe can be inaccurate owing to the speed of the Hubble flow here being comparable to the peculiar motion of the galaxies. Fortunately, a major effort of NED led to a large collection of 320k redshift-independent distance estimates for 182k galaxies dubbed NED-D (Steer et al., 2017).
Of our 49k galaxies, NED-D values are available for 10.6k galaxies. NED-D contains multiple measurements of very different methods for many galaxies, leading to a very heterogeneous data set. Unfortunately, it is not feasible here to perform a selection or weighting of different methods for each galaxy. Instead, we simply compute the median of the different measurements. Before adopting the NED-D values, we first compare them to our values in Fig. 2.
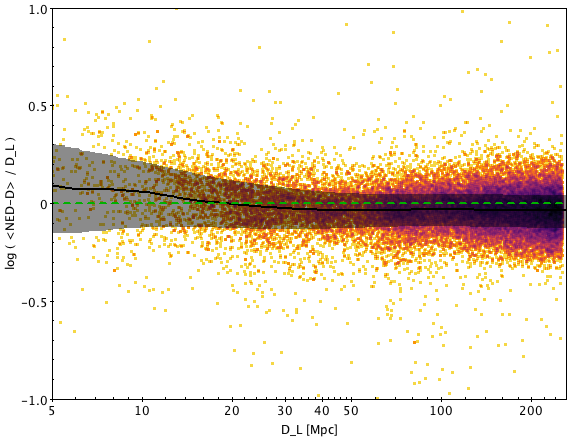
As expected, we see that the deviation between NED-D and increases for small distances, while for larger distances the median ratio between the two converges to a constant value close to 1. This happens roughly at Mpc. Here, also the width of the scatter converges to 0.16 dex (factor 1.44), indicating that above this value the scatter between the individual redshift-independent methods dominates over deviations from the Hubble Flow. This motivates us to adopt the median NED-D value for the object distance if Mpc (4.6k galaxies; ). Otherwise we use . The resulting final redshifts and distances used are listed in Table 1.
2.7 Identification of WISE counterparts
For the planned identification of AGN, we require the MIR properties of all the galaxies. Therefore, we crossmatch our galaxy samples with the all-sky pointsource catalogues of WISE, specifically, the AllWISE catalogue (Cutri & et al. 2013), and then visually verify the counterpart most likely corresponding to the nucleus of the galaxy. In of the cases, this is the AllWISE source that is closest to the galaxy coordinates. The median angular separation is 0.6 arcsec and the 90th percentile is 2.7 arcsec. The large majority of the remaining are caused by inaccurate galaxy coordinates in the databases, which we clean manually. Furthermore, for many small, late-type or disturbed galaxies, no nucleus can be robustly identified. This is the case for of the LASr-GPS and of the 2MRS sample. We mark these galaxies with a corresponding warning flag in Table 1. In these cases, we choose either the source closest to the approximate apparent geometric centre, or we take the brightest MIR emission knot overlapping with the optical counterpart (whichever seems more applicable). Fortunately, these cases are predominantly small galaxies, which are the least relevant for our AGN search. Furthermore, in of the galaxies, the AllWISE catalogue failed to capture the nucleus for unknown reasons. For those, we fall back to the original data release catalogue (Cutri & et al. 2012), which delivered a better counterpart in all cases. This strategy allows us to allocate a WISE counterpart to almost every object that is not rejected in any of the sample cleaning steps and iterations so that our final WISE coverage is .
However, we found that in 1.4% of the galaxies, a nearby brighter source actually dominates the WISE emission. In those cases, the MIR emission of the latter is taken as upper limit for the fainter object.
Finally there are five cases101010 2MASX J09181316+5452324, AM 1333-254, IC 1623, IC 2554, VV 662 where the angular separation of two galactic nuclei was too small to be picked up as individual sources in the WISE catalogues. They are treated as one object, i.e., late-stage galaxy merger, in the following.
2.8 Computation of MIR colours and luminosities
After having identified the most likely WISE counterparts, we can now estimate the MIR emission of the galactic nuclei. The majority () of the galaxies are resolved in WISE, and, thus, their total MIR emission is not well captured in either of the WISE catalogues (see, e.g., Cluver et al. 2014). However, since here we are mostly interested in the nuclear MIR emission we use the profile-fitting magnitudes in AllWISE, which roughly capture, and certainly not underestimate, the nuclear emission. This was verified for nearby AGN by, e.g., Ichikawa et al. (2017) through comparison with high angular resolution MIR data. One might argue that the profile-fitting photometry is even superior for other purposes because it excludes most of the extended non-nuclear emission.
We calculate the observed central and luminosities, and , for each galaxy using the best estimate distance determined in Sect. 2.6 and the assigned WISE band 1 and 3 magnitudes, W1 () and W3 (), after first converting magnitudes to flux densities following the WISE documentation111111http://wise2.ipac.caltech.edu/docs/release/allsky/expsup/sec4_4h.html. Owing to the low redshifts of our sources, no corrections are required.
3 Characterisation of the parent sample of galaxies
Before we study the AGN in our volume, we first compare the 2MRS and LASr-GPS and then address the completeness of the latter to better understand which limitations this might put on our subsequent AGN selection.
3.1 Comparison of galaxy samples
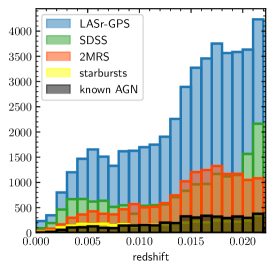
First, we examine the spatial distribution of the galaxy parent samples in different projections, namely the all-sky map (Fig. 3), the 2D projection onto the Galactic plane (Fig. 4) and the redshift distribution (Fig. 5).
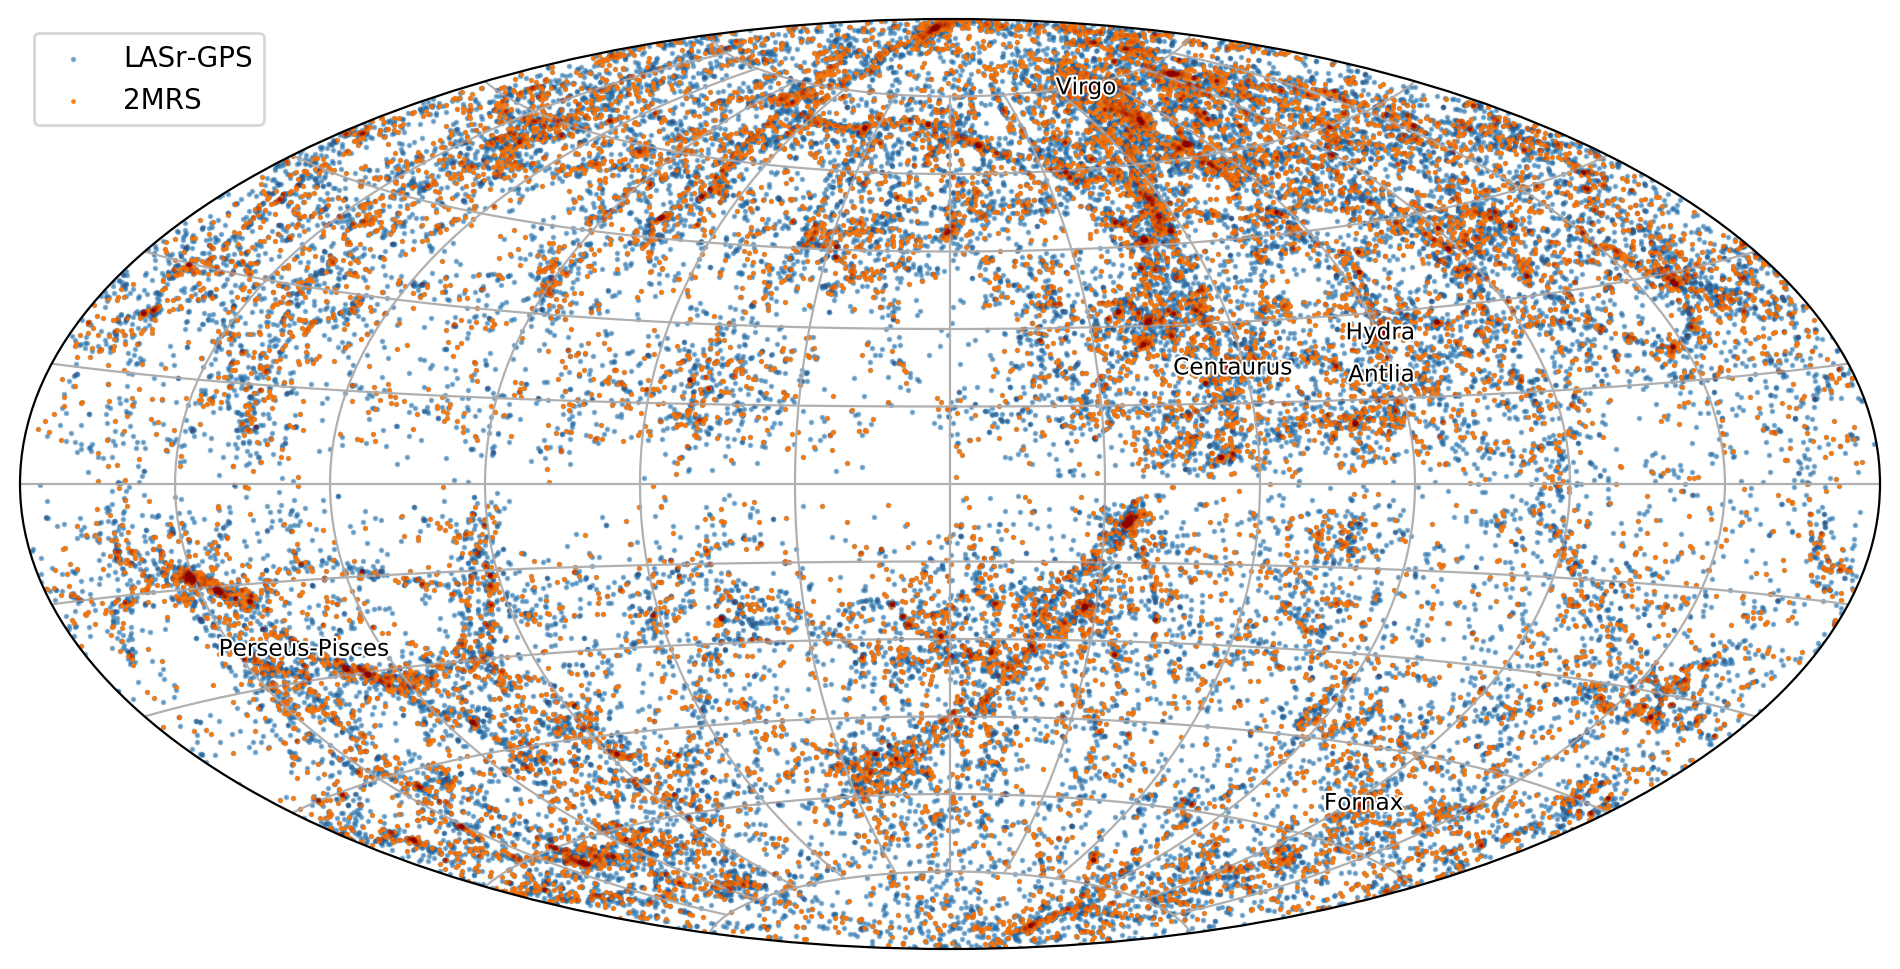
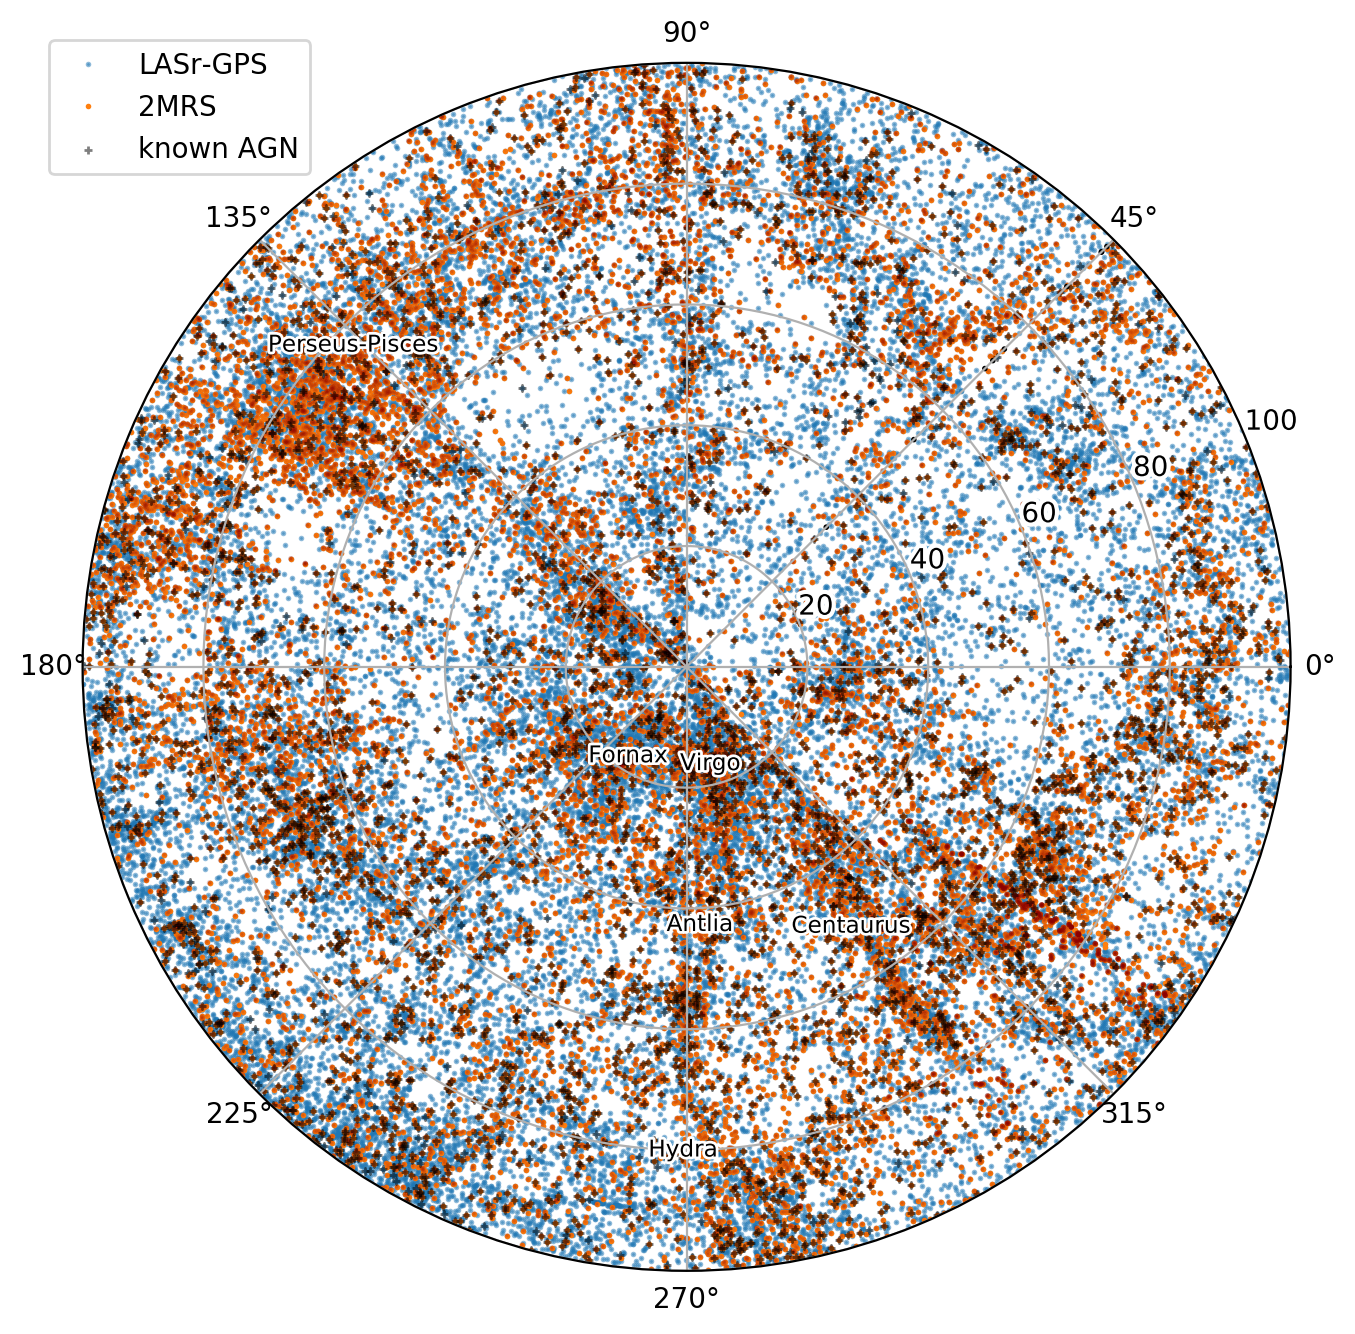
Most of the additional galaxies in the LASr-GPS compared to the 2MRS are in the Northern hemisphere (DEC), which is mostly owing to SDSS. This is visible also in Galactic coordinates (Fig. 3), where the core area of SDSS is in the Galactic North (). In addition, both the LASr-GPS and 2MRS are clearly missing galaxies behind the Milky Way plane (we come back to that in Sect. 3.2). Otherwise, the distribution of the 2MRS galaxies in particular follows the cosmological filaments and galaxy clusters contained in our volume (Fig. 3). This is also visible in the Galactic plane projection (Fig. 4), although to a lesser degree probably owing to the collapse of the latitude dimension and the proper motions of the galaxies. The latter can affect the redshift-based luminosity distances and, this way, artificially spread the filaments and clusters in radial direction (e.g., Centaurus, labelled in the figure). Both sky projections indicate that our galaxy samples probe more or less well the cosmological structure of matter within the volume.
The redshift distribution (Fig. 5, left) illustrates that the number of galaxies in the LASr-GPS steeply rises with increasing distance up to the border of the volume. In addition, there is a dip in the redshift distribution around (Mpc) which is probably caused by the small scale anisotropy of the nearby Universe, namely voids to the Galactic East, North and West visible in Fig. 4.
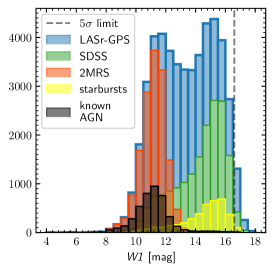
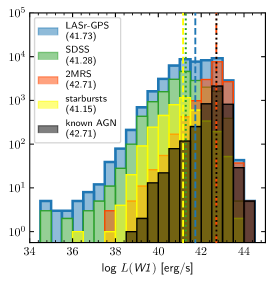
The redshift distribution of the 2MRS sample, on the other hand, levels off at and even decreases towards higher redshifts (Fig. 5, left). This indicates that already at 100 Mpc, the 2MRS starts missing galaxies owing to its -band brightness cut. The comparable shallowness of 2MRS with respect to the LASr-GPS is also visible in the WISE central W1 magnitude and luminosity distributions (Fig. 5, middle and right), as well as in the W1 luminosity over redshift distribution (Fig. 6).
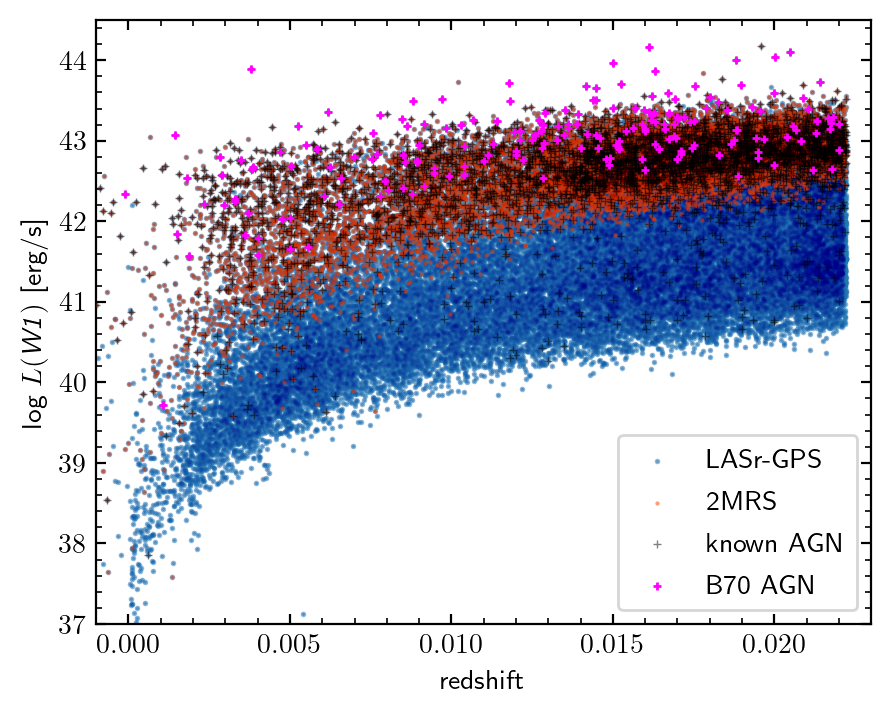
The latter plot shows that the LASr-GPS probes the galaxy population down to central luminosities of erg/s at a distance of 100 Mpc, while the 2MRS has a depth of erg/s. The median central W1 luminosity compared to the LASr-GPS and SDSS are also significantly higher for the 2MRS (by 1 dex and 1.4 dex, respectively). Similar trends apply as well to the other WISE bands, just at higher magnitudes and lower luminosities (thus not shown here).
Interestingly, there are, however, also a significant number of galaxies well within the 2MRS brightness range but missing from 2MRS, as can be seen best in Fig. 5, middle and right. Are all these galaxies situated in the Galactic plane?
To investigate this further, we examine how the galaxy number ratio of 2MRS over LASr-GPS evolves with luminosity in Fig. 7.
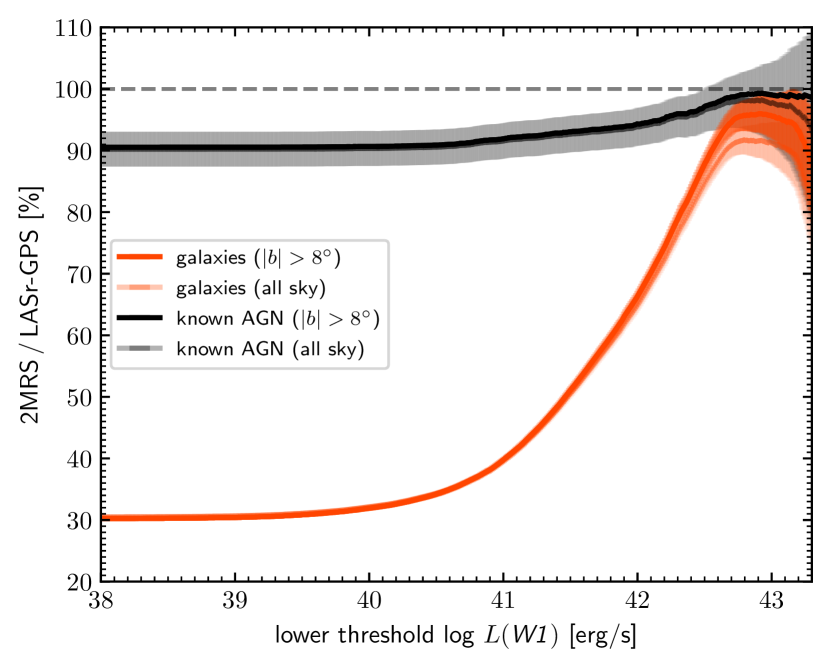
In the low luminosity regime, the galaxy ratio is , while for , it starts to rise, surpassing at and finally reaching the maximum value of at . The latter numbers are for excluding the Galactic plane as defined for the 2MRS sample selection (). If, we compare the 2MRS to LASr-GPS ratio over the whole sky, the maximum 2MRS fraction drops to , reached at the same . We can also look at the ratio of known AGN in 2MRS over LASr-GPS (also shown in Fig. 7). Here, the minimum fraction is relatively high at already for low luminosity thresholds, i.e., of known AGN host galaxies are in the 2MRS. However, the ratio reaches its maximum of only at .
In conclusion, even outside the Galactic plane, the completeness of the 2MRS sample peaks only at , which is well within the AGN regime, e.g., the B70 AGN host galaxies have a median of . This explains why the 2MRS is missing a significant fraction of B70 host galaxies and thus probably of the whole local AGN population, which justifies our extension to the LASr-GPS to maximise completeness.
3.2 Completeness of LASr-GPS
In the previous section, we have shown that the LASr-GPS provides a higher completeness in terms of potentially AGN hosting galaxies compared to the 2MRS sample. However, how complete and deep is the LASr-GPS in absolute terms?
Optimally, one would want to express this depth in the physical galaxy property of total stellar mass. However, here we simply use the unresolved WISE emission which is missing significant stellar light depending on the galaxy size and distance. Furthermore, the mass-to-light ratio is not constant but depends on many galaxy parameters like galaxy type, metallicity and star formation rate and history (e.g., Wen et al. 2013 and discussion therein). Therefore, we refrain here from attempting stellar mass estimates but rather express the sample depth simply in the central W1 luminosity. For most galaxies, this quantity is probably dominated by the stellar bulge.
In Fig. 6, we already constrained the maximum depth of the LASr-GPS to be at a distance of 100 Mpc. The actual achieved completeness above this luminosity is dictated by the redshift completeness in our case. Owing to the heterogeneous nature of the public databases, their completeness is difficult to assess, and this can only be done empirically. For example, Kulkarni et al. (2018) used a comparison of detected supernova events in galaxies with and without redshifts in NED to estimate the redshift completeness of the latter database to be within a redshift of . This value provides a lower limit for our LASr-GPS, combining NED with other sources and being at lower redshift where completeness should be higher. It particular, we will try to derive more accurate estimates here based on comparisons with two highly complete galaxy surveys, one large-area survey (being representative of the volume), and one small-area survey (being very deep and highly complete).
3.2.1 Comparison with SDSS
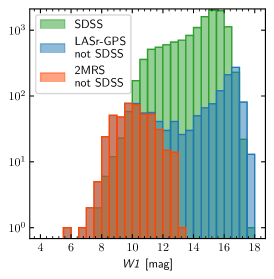
The most powerful constraint for our redshift completeness is coming from the comparison to SDSS as reference for the highest available redshift completeness at reasonable depth and representative sky coverage. For simplicity, we here define the SDSS spectoscopic core area with simple cuts of DEC , 8:40 h () RA 16:00 h (). This area comprises of the sky and contains 12.7k galaxies selected by LASr-GPS with SDSS spectroscopy in DR15 and a redshift placing them within our volume. The average redshift completeness of SDSS is but decreasing towards brighter galaxies for technical reasons (Montero-Dorta & Prada, 2009; Reid et al., 2016). Indeed, we find that there are an additional 1503 galaxies of the LASr-GPS within this area but without SDSS redshifts, implying that the SDSS completeness is at most . As expected, these missing galaxies are bimodially distributed at the extremes of the galaxy brightness distribution (Fig. 8), whereas the bright peak is almost completely made up by 2MRS galaxies that are not in SDSS.
To mitigate the incompleteness of SDSS, we complement it with all galaxies from the 2MRS and LASr-GPS within the SDSS core area and assume that the result is complete within this area down to mag. Further assuming that the SDSS core area define above is representative of the whole sky, we can use the above galaxy sample to estimate the galaxy W1 luminosity distribution for the whole sky within our volume. In Fig. 9, we examine how the fraction of expected galaxies that are in the LASr-GPS above a lower W1 luminosity limit, i.e., the completeness, depends on that lower luminosity threshold.
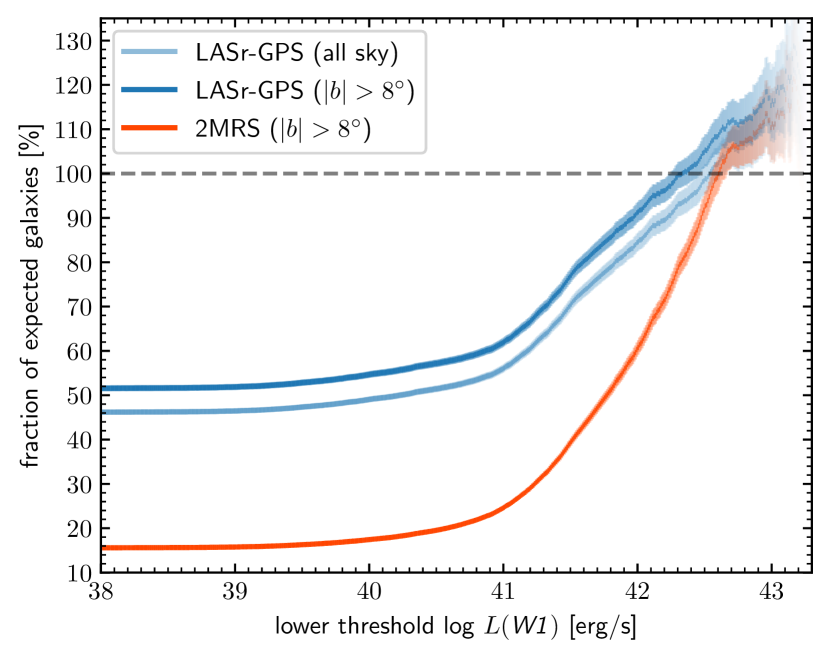
For , the completeness is approximately constant between and , if we cut out the Milky Way plane (), and otherwise. For higher , the completeness outside the Milky Way plane rises and reaches () at ().
Maybe surprising, the observed to expected fraction continues rising above at higher luminosities. We interpret this behaviour as the result of a possible under-density of such luminous galaxies in the SDSS spectroscopic core area, which could lead to such an effect given the decreasing number statistics at high luminosities and the relatively small fraction of the sky contained in that area. This would also explain why the observed to expected fraction for the whole sky as well reaches despite the obvious under-sampling in the Milky Way plane. Alternatively, this could imply that for galaxies with , the under-sampled area does not contain a significant number of such luminous galaxies ( of the sky for ). Finally, the 2MRS sample reaches completeness at only , excluding the Milky Way plane (also shown in Fig. 9).
3.2.2 Comparison with GAMA
To further assess the completeness of the LASr-GPS, we also compare to a smaller area survey than SDSS with higher depth and completeness like the Galaxy And Mass Assembly survey (GAMA; Liske et al. 2015). In particular, we use the two deep fields G12 and G15 from the latest release DR3121212http://www.gama-survey.org/dr3/ (Baldry et al., 2018). The two fields combined cover a sky area of deg2 with a redshift completeness of for mag (Liske et al., 2015). Combined, they contain almost 100k galaxies, of which 811 are within Mpc. The release versions of NED and SIMBAD used here do not include the GAMA DR3, allowing us to use them to test the completeness of LASr-GPS in an independent way. For this, we cross-match the GAMA galaxies with the AllWISE catalogue, following the same method as throughout this work. This yields counterparts for 720 of the 811 GAMA galaxies (). Out of those, 68 have . Based on the SDSS-based result we would expect at least of them to be in the LASr-GPS. Indeed, 64 out of 68 , i.e., 94, are also in the LASr-GPS, verifying our high completeness above this lower luminosity threshold.
3.2.3 Galactic plane shadow
The above results indicate that the LASr-GPS has a relatively high completeness for at least moderately luminous galaxies (). However, this statement excludes one big source of incompleteness of course, the shadow of the Milky Way, which through a combination of densely clustered foreground emission sources, and high values of extinction makes it very difficult to identify and characterize galaxies that have sky coordinates close to the Galactic plane. To quantify this effect, we look at the absolute Galactic latitude distribution of galaxies (Fig. 10).
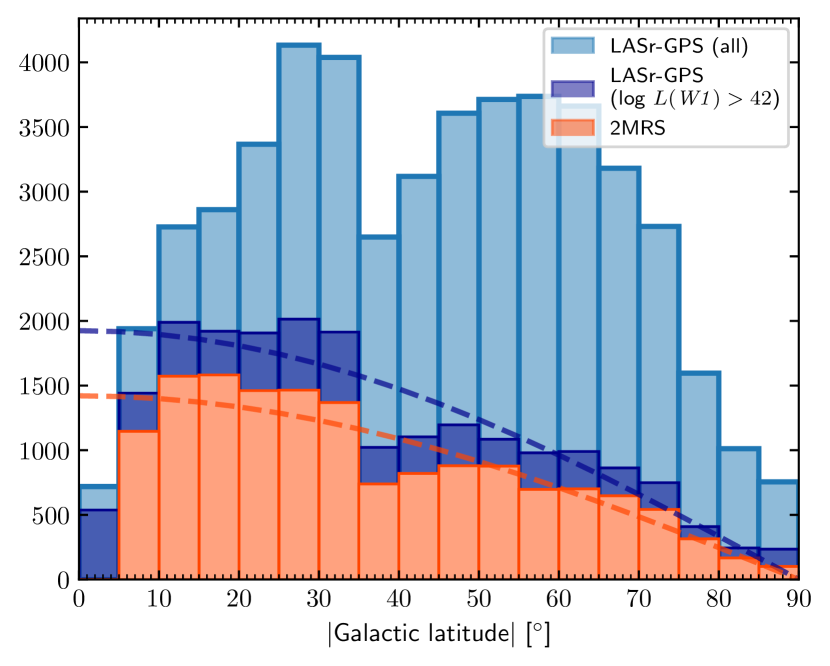
If the galaxies were distributed fully randomly in the sky, then the latitude distribution should describe a cosine, which is approximately the case, at least for the 2MRS and the LASr-GPS, if restricted to galaxies with . At low latitudes (), the observed distributions fall short of the expectations owing to the Galactic plane shadow. In addition, the latitude distributions of all galaxy samples show a valley, i.e., an under-density between , caused by the voids in the local volume as already seen in the previous sky position and redshift distributions.
In order to quantify the Galactic plane shadowing, we fit a cosine functions to the bins with (shown as dashed lines in Fig. 10), and find the deficiency is , whereas the uncertainty is estimated from using different binnings for the latitude distributions. As expected, the 2MRS has a slightly higher missing fraction, owing to its latitude cut (). The Milky Way foreground will always be a problem for the study of galaxies behind it. Therefore, is is probably easier to simply exclude this area from the volume when constructing samples for the AGN census in order to maximise completeness.
3.2.4 Concluding remarks on completeness
In the previous subsections, we addressed the completeness of the LASr-GPS empirically including the effect of the shadowing by the Galactic plane, leading to an all-sky completeness of for and for ). Outside the Galactic plane, we reach a completeness of at least for central luminosities of and approximately for . These luminosities approximately correspond to stellar masses of and , respectively, using the simple relation provided by Wen et al. (2013). But again one has to keep in mind that these values are missing significant amounts of stellar light for most galaxies including only their bulges.
We plan to further increase the redshift completeness of the LASr-GPS in future work. However, the above values mean that LASr can already now probe quite deep into the SMBH accretion regime, probing all galaxies where significant growth is occurring. By going to smaller volumes, we could decrease lower luminosity limits further. Although, at low luminosities, usually the stellar light by far dominates the total galaxy emission over the AGN, making it very difficult to isolate the AGN from its host. We will address this as well in future follow-up works where we will try to use more sensitive (but complex) AGN identification techniques. Here, we will utilize the simple but effective WISE colour selection as a first probe of the AGN activity within the volume.
4 Starting the AGN census
With the depth and completeness of the LASr-GPS characterised, we can now move on to identify and characterise the AGN population within our volume. We start with a brief summary of the already known AGN and then move on to the first AGN identificationn technique for LASr, namely WISE MIR colour selection. We estimate the efficiency of this technique and discuss possible limitations before applying it to the LASr-GPS to find new AGN candidates, in particular highly obscured and CT objects. Next, we discuss possible host contamination and provide prospects for detecting these new AGN with the current X-ray all-sky surveys. We conclude this section with an estimate of the total number AGN above a given luminosity limit within the volume, constraints on the CT fraction, and a comparison to luminosity functions from the literature.
4.1 Luminosity estimates for the known AGN
We know already from the collection of AGN identifications from the literature that there are at least 4.3k AGN within the volume (Sect. 2.4). The redshift and brightness distributions of their host galaxies are shown in Fig. 5 and Fig. 6. In order to further characterise the AGN population, we can use the W3 luminosities, tracing the continuum of the AGN, dominated by warm (K) AGN heated dust. Compared to the shorter bands, W3 has the advantage of not being affected by stellar light. The W3 luminosity distribution of known AGN is shown in Fig. 11, top panel.
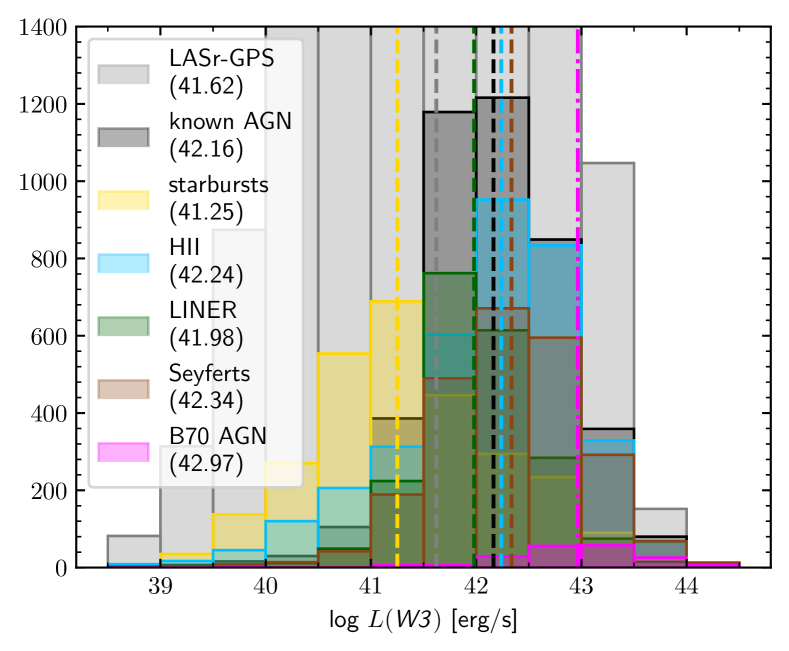
Bottom: Estimated distribution after decontamination of as described in Sect. 4.1.
As expected, the majority of known AGN seem to be relatively low-luminosity, e.g., compared to the B70 AGN. However, we know that star formation can also significantly contribute to W3 , in particular in large aperture measurements as used here131313 The relatively high luminosities of the H II nuclei confirms this statement. This does not apply to the systems classified as starbursts because many of them are compact dwarfs and, thus, do not reach such high luminosities. .
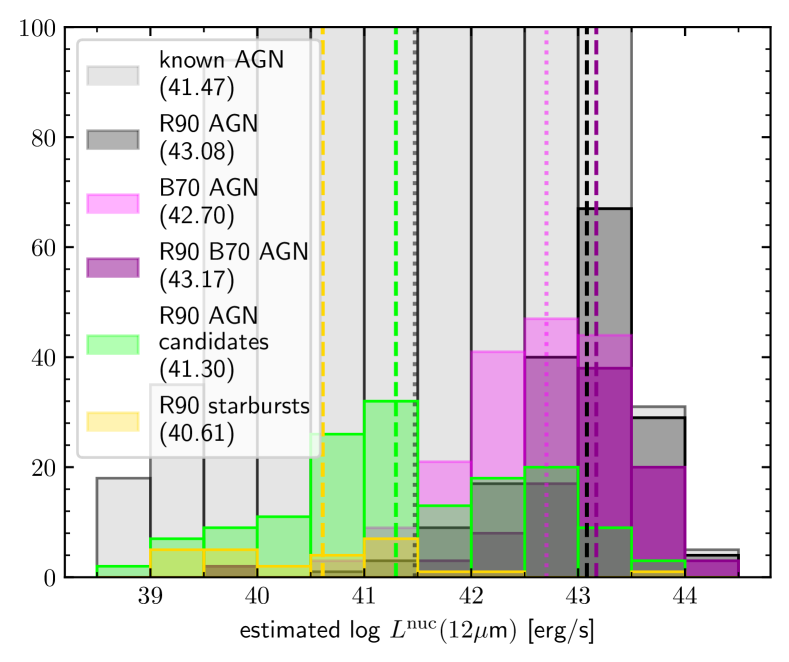
Decoupling AGN and star formation emission in W3 is a serious issue and requires detailed SED modelling, beyond the scope of this work. However, we can attempt at least a rough decontamination of the W3 luminosities by computing statistical correction factors from the comparison of W3 to high angular resolution measurements at the same wavelength. In particular, Asmus et al. (2014) presented a catalog of 253 nearby AGN with ground-based subarcsecond MIR photometry and estimated accurate estimates of the AGN luminosity, . We crossmatch our AGN sample with this catalog, finding 146 objects in common. In Fig. 12 we show the ratios of to the W3 profile-fitting luminosity, .
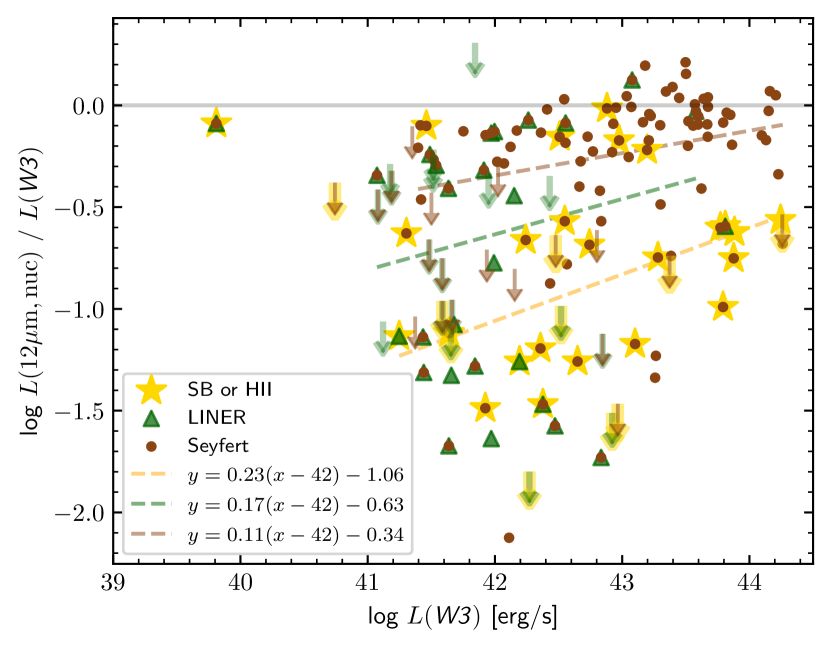
While we already know from, e.g., Asmus et al. (2014) that the nuclear to large aperture ratio is a strong function of the AGN luminosity, the same ratio shows only a weak increasing trend with increasing with a large scatter of dex (Kendall’s , null hypothesis probability ). On the other hand, we see that the ratio depends somewhat on the optical classification of the object with Seyferts having the highest and starbursts the lowest ratios. Therefore, we determine a to correction based on optical classification. Owing to the differing classifications in the literature, some of the objects are classified at the same time as Seyferts, LINERs, H II and/or starbursts (Sect. 2.4 and Sect. 2.5). Therefore, we test different groupings and find a distinction in the following three subgroups leading to the best corrections: a) pure Seyferts (no other classification), b) Seyferts also classified as LINERs141414 These probably correspond to objects situated in the Seyfert and LINER overlapping region in the BPT diagrams, i.e., Seyfert-LINER transition objects. (but not as H II or starburst classification), and c) non-Seyferts (no classification as Seyfert). Corresponding ordinary least-square linear regression in logarithmic space with treating as the independent variable leads to the following corrections:
The last case provides the general correction if no optical classification is available. The -of-the-population scatter around these best fit lines is 0.22 dex, 0.57 dex, 0.23 dex and 0.43 dex, respectively. As said, this scatter is considerable and the above corrections should not be used for individual objects but only in a statistical sense.
Applying the above corrections to estimate for all known AGN, we obtain the following distribution shown in the bottom panel of Fig. 11. The estimated distribution for all known AGN is on average 0.7 dex lower than the one of with a median of . Only (781) of the known AGN have , i.e., are at least moderately luminous. For Seyferts, this number increases to (716 of 2385), while it is for the B70 AGN (130 of 190). Again, these numbers should just provide a rough guidance for the luminosity ranges to be expected for the AGN in the volume. More accurate numbers will become available in the future based on SED decomposition and MIR follow-up observations.
4.2 MIR colours of AGN, galaxies and starbursts
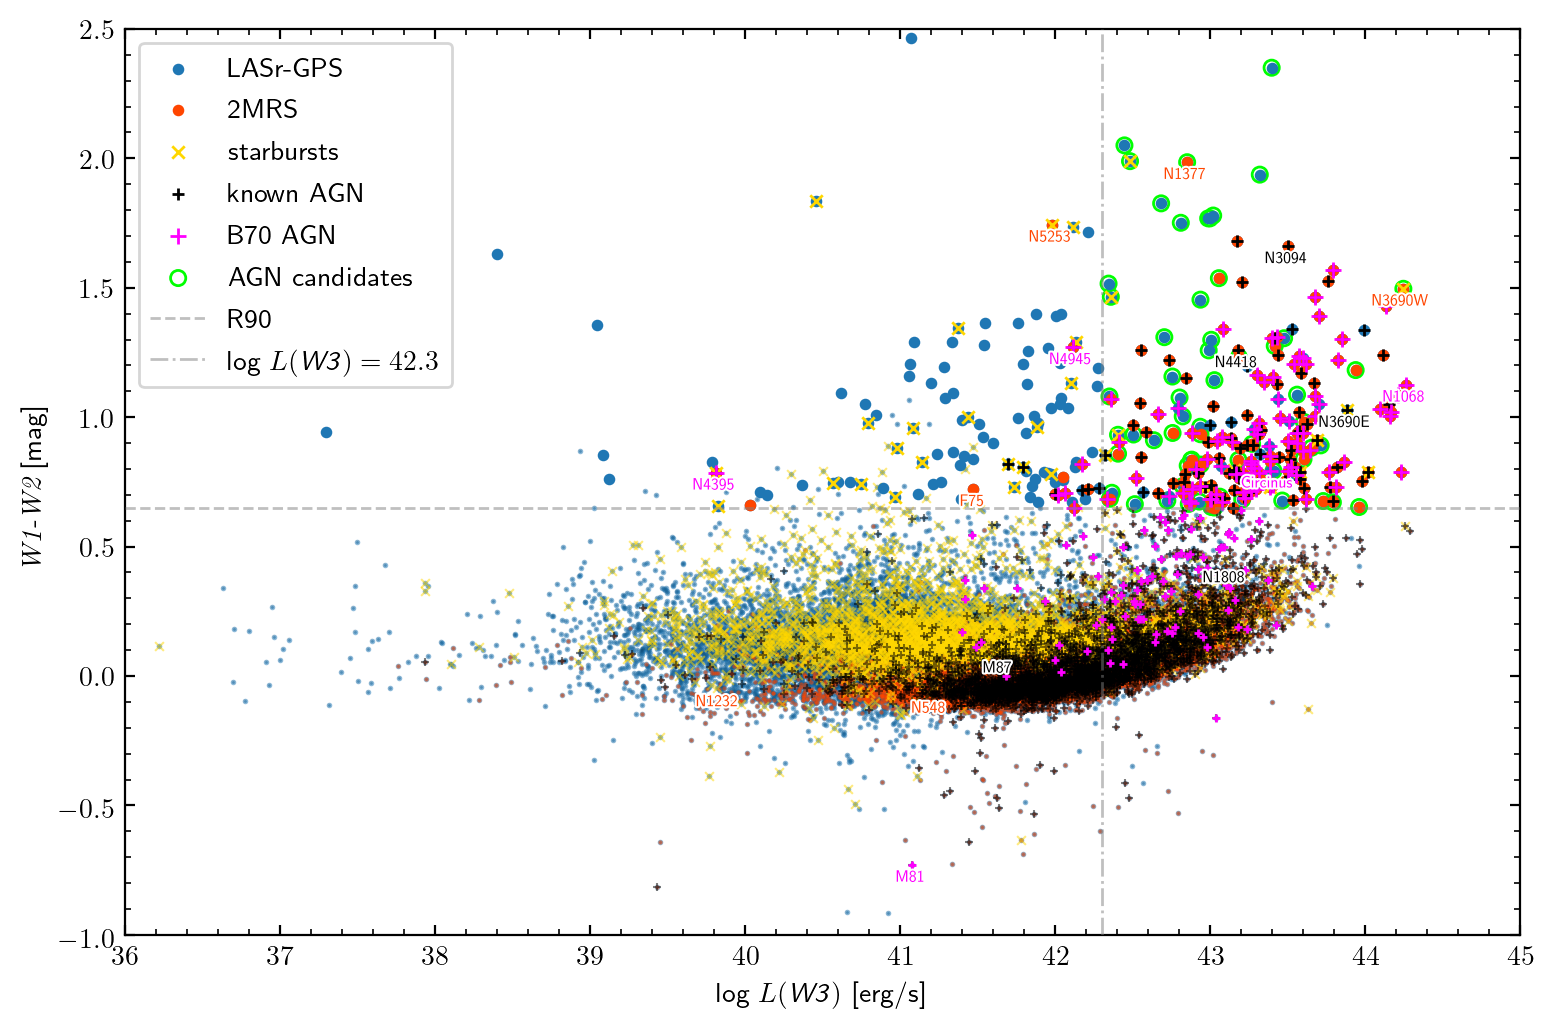
Let us now examine the MIR colour distribution of the known AGN in the context of normal and starburst galaxies. The MIR colour distribution in the W1-W2 over W2-W3 plane is shown in Fig. 13 for all galaxies that are detected in the three WISE bands ( of the LASr-GPS and of the 2MRS samples), while the distributions of the individual colours are shown in Fig. 14.
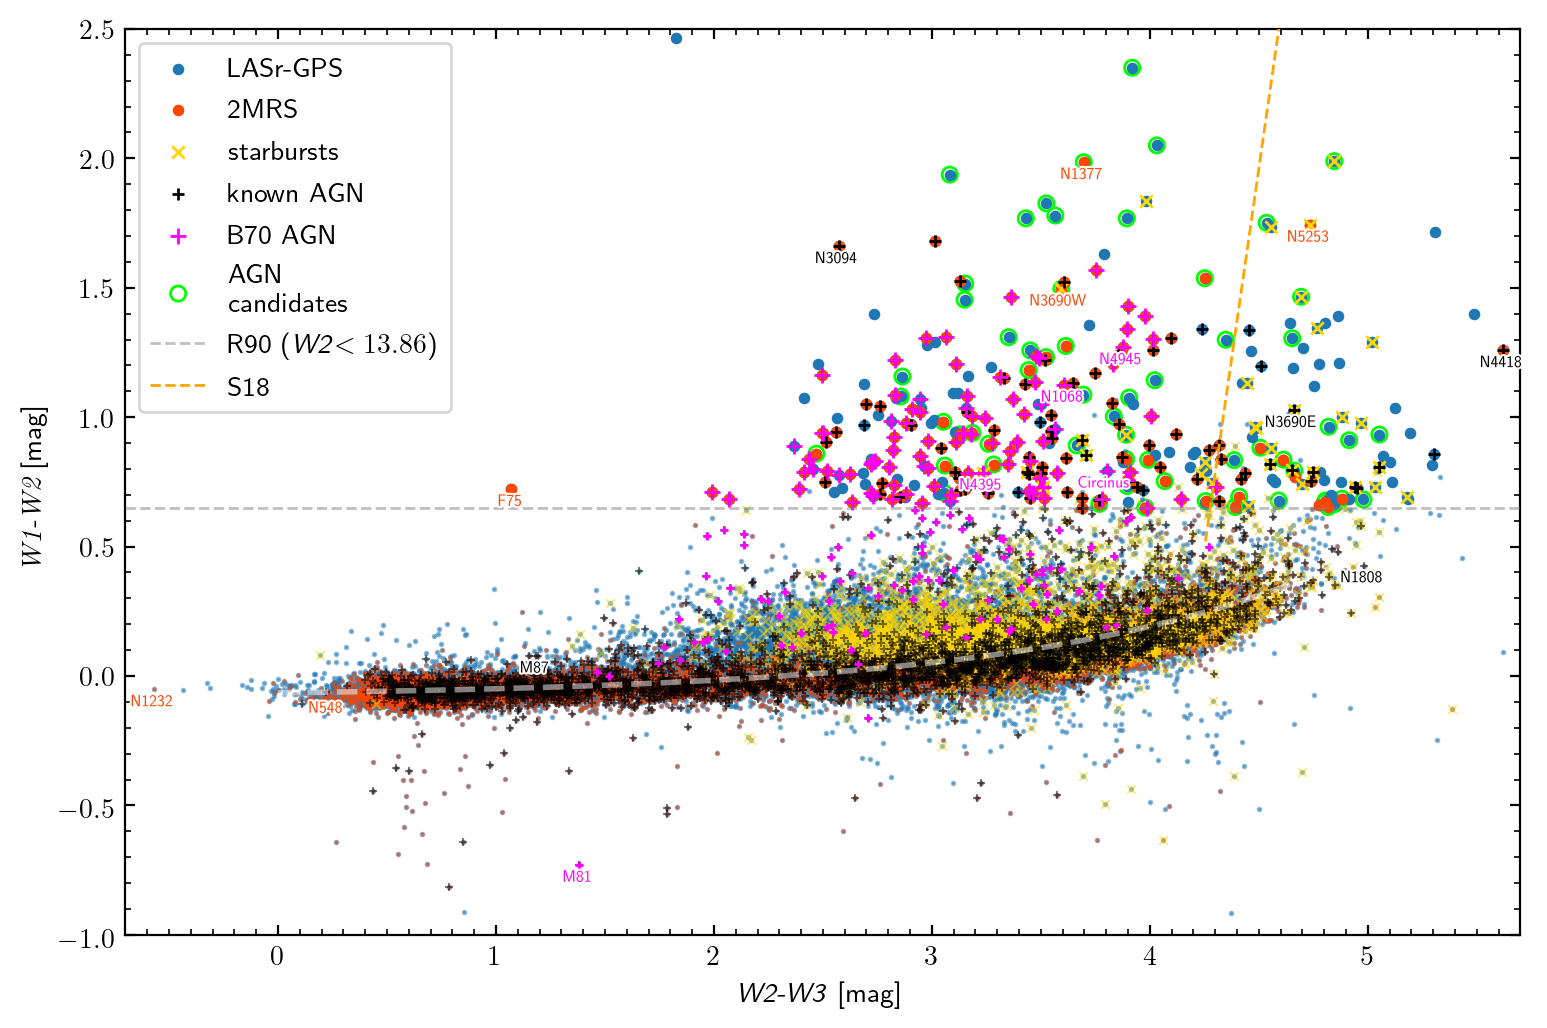
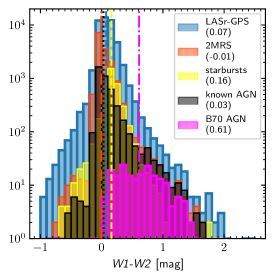
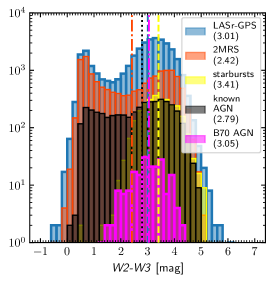
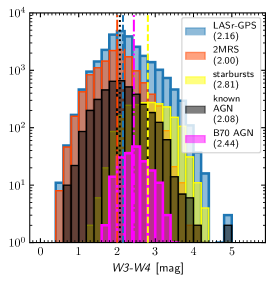
The large majority of galaxies, and in particular the 2MRS galaxies, form a relatively narrow star formation main sequence from blue to red W2-W3 colours at almost constant W1-W2 colour (as already previously found in the literature, e.g., Jarrett et al. 2019). This sequence is caused by star formation which leads to an increasing amount of warm dust emission and, thus, redder W2-W3 colours with increasing star formation intensity relative to the direct stellar emission of the galaxy. For example, the bluest W2-W3 objects are mostly passive, early-type galaxies like, e.g., NGC 548 at mag and mag. On the red side, the sequence is bending up to redder W1-W2 colours of mag at its approximate reddest end of mag. One of the most extreme objects here is the starbursting NGC 1808 ( mag; mag). In addition, the galaxy distribution of the LASr-GPS extends to redder W1-W2 colours ( mag at intermediate W2-W3 colours () filling up roughly the expected locus area of the spiral galaxies in Fig. 12 of Wright et al. (2010). Most of the galaxies are dwarfs according to their W1 luminosity and optical appearance. The reason for the redder W1-W2 colours is again star formation which can dominate W2 if strong enough with respect to the stellar light of the host. This W1-W2 reddening effect of star formation is the main source of contamination in AGN selections that are based on this colour, and will have to be taken into account (further discussed in Sect. 4.4.1).
Most of the galaxies known to host an AGN follow the WISE colour distributions of the 2MRS, i.e., rather massive galaxies. Only in W2-W3 colour, they are slightly redder on median (2.66 mag vs. 2.42 mag), i.e., they either prefer star-forming hosts, or contribute themselves the most to this colour. Galaxies with hosting a luminous AGN, comparable MIR brightness at least in W2, have a redder W1-W2 colour. They leave the main sequence and move upward in the colour–colour plane of Fig. 13 with increasing AGN luminosity. This trend motivates the colour selection based on W1-W2 as discussed in the following.
4.3 Identification of AGN by MIR colour
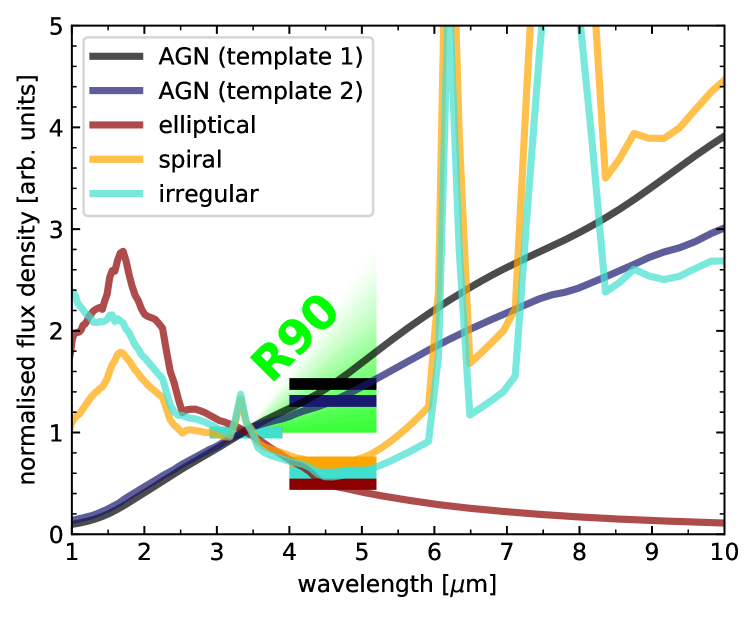
We now proceed to the MIR colour-based identification of AGN and quantify how its efficiency depends on the AGN luminosity. Since the advent of the WISE mission, many MIR colour selection methods have been put forward to find AGN (e.g., Stern et al. 2012; Mateos et al. 2012; Assef et al. 2013). At the core, they are similar, building on the fact that the AGN-heated, warm dust emits significantly redder W1-W2 colours than the light of the old stellar population in the host galaxy. In addition, the W1-W2 is little affected by extinction, in particular at low redshifts (e.g., Stern et al. 2012), making W1-W2 based AGN selection a formidable tool to select highly obscured and even CT AGN. Here, we will use the most recent and refined selection criterion introduced in Assef et al. (2018), namely one that was designed to have reliability in selecting AGN (hereafter R90):
The R90 criterion is illustrated in Fig. 15 for typical galaxy and AGN SEDs from Assef et al. (2010).
This criterion works best for W2 detections with a signal-to-noise greater than 5 (otherwise biases can occur; see Assef et al. 2018 for details151515 Normally, it is recommended to also remove objects for which the contamination and confusion flag in the AllWISE catalogue is set (cc_flags). However, here, to be inclusive, we keep such galaxies and examine them individually where necessary. ). All the 2MRS galaxies and of the LASr-GPS are above this limit ( for ).
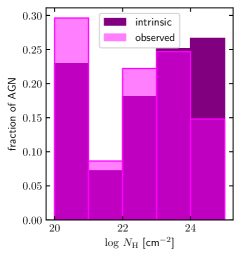
The R90 criterion for mag is shown as grey dashed line in Fig. 13. Out of the 4.3k known AGN in the volume, 172 fulfil the R90 criterion as visualized in that figure with larger symbols161616 Interestingly, only of the corresponding galaxies are in the 2MRS, once more confirming the incompleteness of 2MRS in terms of AGN. . For (167) of the 172 R90 AGN, optical type classifications are available, (162) of which have a classification as Seyfert, while (15) are classified as LINERs and (29) as H II, i.e., (34) have multiple classifications in the literature. The type 2 to type 1 ratio for the R90 AGN is 0.52 (similar as for the whole population of known AGN; Sect. 2.4) with a significant population with intermediate (Sy 1.8 or Sy 1.9) or both type 1 and 2 classifications (). Depending on their treatment, the type 2 fraction among the known AGN171717 The intrinsic type 2 fraction is probably higher because we expect the majority of AGN candidates to be obscured, i.e., type 2 (Sect. 4.4). is between 38 and . The R90 AGN including their optical classifications are listed in Table LABEL:tab_R90AGN.
As said, we expect the R90 criterion to preferentially select luminous AGN. This effect is clearly visibile in Fig. 16, where galaxies hosting known AGN, and in particular those from the B70 AGN sample, exhibit a trend of redder W1-W2 colour for increasing W3 luminosity.
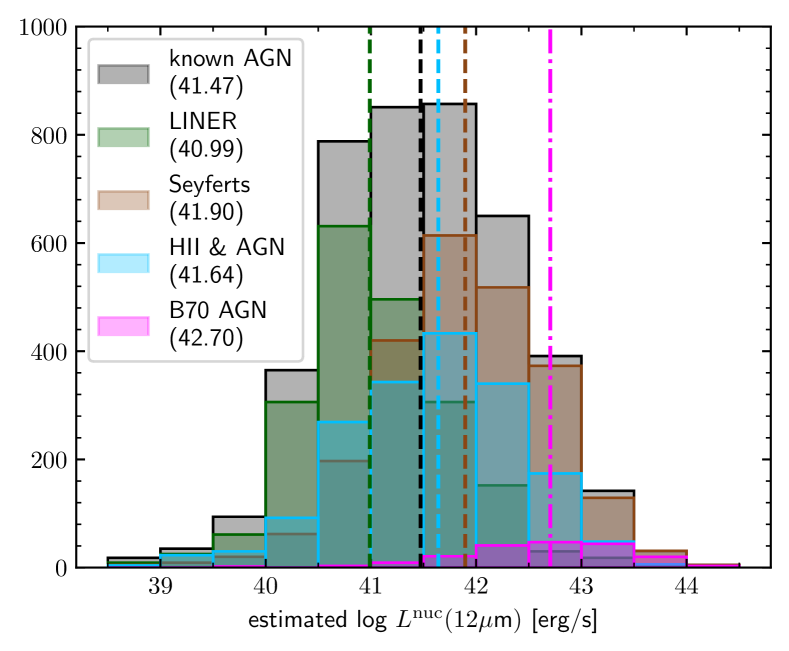
The and estimated distributions of R90 selected objects are shown in Fig. 17.
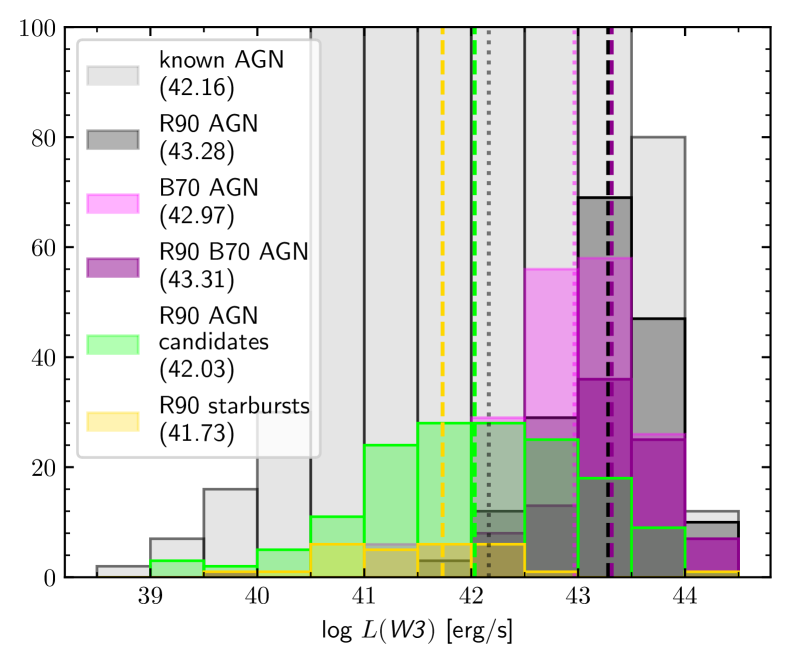
Bottom: Corresponding estimated distribution after decontamination of following Sect. 4.1.
While the median of known AGN is , the corresponding median luminosity for R90 selected AGN is more than 1 dex higher, i.e., . For B70 AGN the trend is similar albeit smaller, i.e., 0.3 dex. If instead of the observed , we use the estimated AGN luminosity, , the trend becomes even clearer, and the gap in luminosities larger (1.6 dex for all known AGN and 0.5 dex for the B70 AGN.
To quantify the fraction of AGN selected by the R90 criterion we look at its luminosity dependence in Fig. 18 for different subsamples of known AGN.
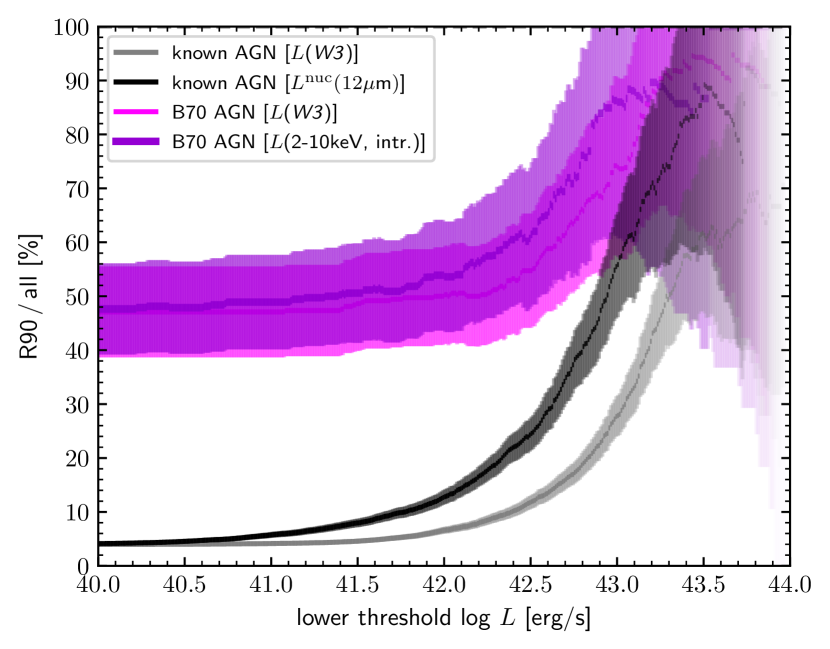
Independent of the AGN subsample and selected luminosity as AGN power tracer, for the fraction of AGN selected by the R90 criterion is relatively low and constant, while for higher luminosities is rapidly increases. For using W3 as AGN power tracer, the fraction of AGN selected by R90 levels off at a relatively low for (grey line in Fig. 18). Most of the remaining of AGN not selected by R90 despite high W3 luminosity are situated in heavily star forming galaxies that dominate the MIR over the AGN. These are classified as HII in the optical indicating that the corresponding AGN are intrinsically much less luminous than values suggest. Indeed, if we use the decontaminate estimates from Sect. 4.1, the R90-selected fraction increases more rapidly, reaching at and peaking at (black line in Fig. 18). The completeness of the R90 selection even further increases if one only looks at the X-ray luminous B70 AGN (magenta line in Fig. 18). For this particular sample, we have the advantage of a better tracer of the AGN power than the W3 luminosity, namely the intrinsic 2-10 keV X-ray luminosity (taken from Ricci et al. 2017). This allows us to assess the “true” efficiency of the R90 criterion (dark violet line in Fig. 18). Namely, R90 selects of the AGN with , while for , are selected181818 The relatively large uncertainties results from the small number statistics of the B70 within the volume at such high luminosities. . Using our estimated gives similar results to which confirms the validity of our decontamination of the former in Sect. 4.1. In addition, the comparison between the R90 fractions depending on and for the B70 sample verifies that the -based fractions are to be regarded as lower limit on the true efficiency of the R90 selection.
4.4 New AGN candidates
Not all the galaxies selected by the R90 criterion are already known to host AGN. There are 159 such galaxies, and thus new AGN candidates based on their W1-W2 colour. We double-check all galaxies individually to make sure that they are genuine galaxies with valid WISE measurements and robust redshifts (as far as we can assess from the information at hand). The resulting list of new AGN candidates and their properties can be found in Table LABEL:tab_R90candi. Only 31 () of the hosts of the new AGN candidates are in the 2MRS sample, indicating that they are relatively faint or compact galaxies. Indeed, the median of the candidate systems is only , so much lower than the median of the verified AGN systems that fulfil the R90 criterion (; see Fig. 17, top). If we apply our W3 decontamination (Sect. 4.1), the resulting distribution fractures into two peaks, one peaking at and the other at ( Fig. 17, bottom). This is caused by 51 of the AGN candidates having H II or starburst classifications and thus higher corrections to their . It indicates that a significant fraction of objects with low luminosities might be contaminants, i.e., not AGN but star-formation dominated systems.
4.4.1 On contamination by starbursts
The R90 criterion was designed for selecting distant, luminous and point-like AGN. Its reliability in selecting AGN might not hold for local, extended galaxies. We saw in Fig. 13 that the large majority of star-forming galaxies lie on the red W2-W3 tail of the main sequence but significantly below typical AGN W1-W2 colours . However, it was argued by Hainline et al. (2016) that strong star formation, in particular in dwarf galaxies, can also lead to red, AGN-like W1-W2 colours. These systems would then have as well very red W2-W3 colours ( mag) which would motivate to add a W2-W3 colour cut to improve the reliability of a W1-W2 -based AGN selection. Satyapal et al. (2018) further investigated this with theoretical colour tracks of extreme starburst systems and determined a theoretical W2-W3 colour criterion (hereafter S18):
to separate AGN and starbursts. This criterion is plotted in Fig. 13 as orange dot-dashed line and marked for individual known R90 AGN and R90 AGN candidates in Table LABEL:tab_R90AGN and Table LABEL:tab_R90candi, respectively. Of the 159 R90 AGN candidates, 100 () fulfil the S18 criterion and, thus, are expected to not be starburst dominated. Among the R90 AGN candidates not fulfilling S18, there are indeed some of those compact star-forming galaxies that Hainline et al. (2016) identified as “AGN imposters” (e.g., II Zw 40, Mrk 193, SBS 0335-052, and UGC 5189). In total, 28 () of the AGN candidates are classified as starbursts or blue compact dwarfs in our literature collection. However, only 14 () of them would be excluded by the S18 criterion.
Among the known AGN, (154 of 172) fulfil the S18 criterion191919 One object, Mrk 3 aka UGC 3426 has no valid W3 measurement and thus S18 can not be computed. . For the B70 AGN, fulfilment is even (89 of 91). Of the 17 R90 AGN not fulfilling S18, nine show signs of strong star formation in the literature and are in fact controversial concerning the existence of luminous AGN in these galaxies202020 These are Arp 220, CGCG 032-017, Mrk 93, NGC 253, NGC 3256, NGC 3690E, NGC 7130, NGC 7552, and TOLOLO 1220+051. . On the other hand, two of the remaining galaxies, NGC 4418 (aka NGC 4355) and 2MASX J04282604-0433496, show no signs of strong star formation, judging from their Spitzer/IRS spectra (Asmus et al., 2014). Instead, NGC 4418 hosts a highly obscured nucleus with the obscuration probably causing the red W2-W3 colour (see e.g., Roche et al. 2015). In fact, both objects are among the reddest in terms of W2-W3 colour () of all galaxies in the LASr-GPS. While, the nature of the dominating MIR emitter in NGC 4418 is still somewhat controversial (e.g., Sakamoto et al. 2013; Varenius et al. 2014), the case of object makes clear that also heavy obscuration can lead to very red W2-W3 colours212121 See also the similarly mysterious Arp 220; e.g., Martín et al. 2016; Paggi et al. 2017; Sakamoto et al. 2017; Yoast-Hull et al. 2017). . Thus, the application of the S18 criterion might exclude the most obscured AGN, which are the ones we are hunting for!
In addition, for a complete, unbiased sample of AGN, one wants to include even star-formation dominated galaxies, as long as the intrinsic luminosity of the AGN is above the selected lower threshold222222 Finding such objects is difficult with WISE colour selection alone but might require high angular resolution data over a wide wavelength range, something we plan for the future with dedicated follow-up of these red objects. . We conclude from this discussion that applying a W2-W3-based criterion like the S18 in addition to the R90 criterion indeed increases pureness of AGN selection. However, a significant fraction of starbursts still remains while many AGN that are either heavily obscured or live in hosts with dominating star formation are excluded.
Instead, we notice that in the W3 luminosity distribution in Fig. 17 that most of the starbursts have relatively low luminosities. For example, (25 of 28) of the starbursts and BCDs selected by R90 have . This suggests that a lower luminosity cut could be more successful at removing contaminating non-AGN galaxies with dominating starbursts. Using as threshold, leaves 61 of the R90 AGN candidates which according to the above number should be genuine AGN with probability. They are marked with green circles in Fig. 13 and Fig. 16.
4.4.2 Prospects for detection in X-rays
There is a close correlation between the observed MIR and intrinsic X-ray luminosities for local AGN (e.g. Lutz et al. 2004; Gandhi et al. 2009), allowing us to estimate the intrinsic X-ray AGN luminosities of our new AGN candidates and infer the chances to detect them with the X-ray all-sky missions, Swift/BAT, SRG/ART-XC/eROSITA. In the following, we detail our Monte Carlo simulation per source to estimate the detection rates for the 61 R90 AGN candidates with (corresponding to intrinsic X-ray luminosities above the nominal sensitivity of eROSITA after eight passes; (Merloni et al., 2012)).
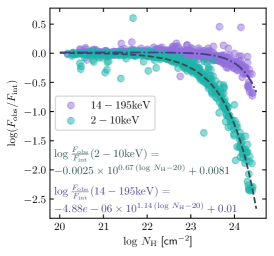
Middle: empirical X-ray extinction curves for the BAT 70 month AGN sample with for observed and intrinsic fluxes as well as values taken from Ricci et al. (2017). In purple is the shown the observed to intrinsic flux ratio for the 14-195 keV energy range, while in green the same is shown for the 2-10 keV range. The darker colored dot-dashed and dashed lines give exponential fits to the data, respectively, with the corresponding best parameters shown as well in the same color.
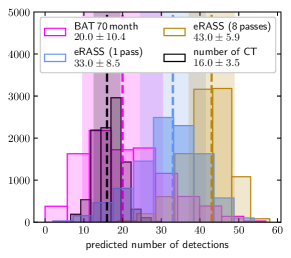
Right: simulated detection rates for Swift/BAT after 70 months (magenta) and SRG/eROSITA after one (blue) and eight all-sky passes (gold). The distributions show the results of the iterations of the Monte Carlo simulation using the intrinsic distribution, while the dashed lines give the median and the shaded areas the standard deviation. These values are given in the legend as well. In addition, the expected number of CT AGN is shown in black.
In particular, these steps are performed:
-
1.
prediction: we use the decontamination method from Sect. 4.1 to estimate .
-
2.
Intrinsic prediction: we use the most accurate determination of the MIR–X-ray luminosity relation by Asmus et al. (2015) to convert into :
with an observed scatter of 0.4 dex.
- 3.
- 4.
We then performed a Monte Carlo resampling of the above steps. We assumed the probability distributions of each and value to be Gaussian-distributed with width equal to the observed scatter in both conversions (much larger than the individual source X-ray fit uncertainties). For 104 iterations, the resulting observed X-ray flux distributions are stable (Fig. 19, right) and can be compared to the flux limits provided for the all-sky surveys of Swift/BAT and SRG/eROSITA232323 We omit ART-XC here because its different energy band would require futher conversion with additional uncertainties but given the flux limit of its all-sky survey (Pavlinsky et al., 2018), we expect detection rates to be a factor two to three lower than with eROSITA. .
According to this simulation, we would expect to detect of the 61 R90 AGN candidates already in the first pass of the eROSITA all-sky survey, and in the full survey. The remaining objects would then expected to be highly obscured, with objects expected to be CT obscured. However, if we convert the intrinsic 2-10 keV fluxes into 14-195 keV fluxes using the median ratio dex as determined from the BAT 70 month AGN, then we would expect that of the candidates242424 The large uncertainty on this expected number of detections is caused by the scatter of the flux ratio in the X-ray bands. would have been detected already in the 70 month Swift/BAT all-sky map with the nominal detection limit is (Baumgartner et al., 2013). This might indicate that a larger fraction of the R90 AGN candidates are highly obscured than assumed. On the other hand, the fact that none are detected in the 70 month BAT map is in fact consistent with the design-based expectation that only of the 221 galaxies that fulfill the R90 criterion indeed host an AGN. In other words, we have to expect that of the 221 R90 objects are contaminants, and all of them would be among the R90 AGN candidates.
Alternatively, one could argue that possibly many of the CT obscured AGN that are missing according to the difference of the intrinsic to observed distribution (Fig. 19) are among the R90 AGN candidates. If we assume that the R90 selection is independent of X-ray obscuration, we expect 54 CT objects according to the intrinsic distribution from Ricci et al. (2015), while only 18 AGN are currently known to be CT obscured, as we further discuss in Sect. 4.5. Therefore, easily twice as many CT AGN might be present among the candidates as assumed in the above simulation which would then lower the expected detection rates correspondingly, and, in particular, remove any expected detections in the BAT 70 month map.
4.5 On the CT AGN fraction and CT candidates
As discussed in Sect. 1, one of the main caveats of current AGN samples is the bias against the most obscured, i.e. CT, objects252525 Note that CT AGN are likely not a special class of AGN but just the high end of a continuous obscuration distribution in the AGN population which is hard to detect because obscuration becomes opaque even at the highest photon energies. . The real fraction of the CT AGN is still highly uncertain with estimates ranging from to of all AGN (e.g., Burlon et al. 2011; Ricci et al. 2015; Akylas et al. 2016; Lansbury et al. 2017; Georgantopoulos & Akylas 2019; Gandhi & Fabian 2003; Gilli et al. 2007; Ueda et al. 2014; Ananna et al. 2019; Boorman et al., in prep.). The effort of building a complete AGN sample, starting with this work, will hopefully help to narrow down the uncertainty on this fraction. In the meantime, we can derive lower limits on the CT fraction by simply adding up the number of known CT AGN in the volume. The first lower limit comes from the B70 AGN sample. It has 20 out of 153 AGN with within the volume determined to be CT, i.e., a fraction of . Among the R90 galaxies with , 10 of the 84 B70 AGN are CT obscured, i.e., . In addition, there are eight more known AGN that are not in the B70 but are CT and fulfill the R90 and luminosity cuts262626 These are IC 3639, Mrk 573 aka UGC 1214, NGC 660, NGC 1320, NGC 1386, NGC 4418, NGC 5135, and NGC 5347 (in order of the object list: Boorman et al. 2016; Guainazzi et al. 2005; Annuar et al., in prep.; Baloković et al. 2014; Levenson et al. 2006; Maiolino et al. 2003; Singh et al. 2012; Levenson et al. 2006). . Together, this means at least 18 of the 160 R90 AGN with are CT obscured, i.e., .
However, it is likely that the true CT fraction is significantly higher as was indicated in Sect. 4.4.2 already, since none of the (predicted) intrinsically X-ray-bright R90 AGN candidates have been detected by BAT. In particular, if we assume the bias-corrected distribution of Ricci et al. (2015), i.e., a CT fraction of , to apply for all 221 R90 objects with , then we would expect 60 CT AGN in total. Since in the BAT detected subset, there are only 10, there should be 50 CT AGN among the 137 R90 objects not in B70. To test whether this is consistent with the observations, we repeat the Monte Carlo simulation of Sect. 4.4.2 for these 137 objects assuming 50 CT AGN among them. As a result we would still expect objects to have been detected in the 70 month BAT map. Even if we assume again 22 contaminants as a result of the R90 selection, this leaves . In fact, it would take an intrinsic CT fraction of to become consistent with no BAT detection within uncertainty. On the other hand, we do not expect more than CT AGN among the 137 because of at least 14 of the known AGN being optically classified as type 1 AGN and thus unlikely CT. This would translate into an intrinsic CT fraction of which we regard as an upper limit. These findings suggest that the intrinsic CT fraction is between in the here probed luminosity regime. However, these numbers should be regarded as indicative only owing the large number of very simplified assumptions made here.
Let us examine some of the objects in more detail. The most promising CT candidates are those with the highest MIR-to-X-ray ratio, for example sources that are not detected by Swift/BAT after 70 months but are 1 dex brighter than the W3 magnitude corresponding to the nominal detection limit of , namely mag. Indeed, we find that six out of the eight known CT AGN that remained undetected in the BAT 70 month map fulfil this criterion, so a success rate. If we apply this magnitude limit to the whole R90 AGN sample excluding B70, we identify a further nine CT candidates among the known AGN. Six of them do not fulfil the S18 criterion and are in fact known to host starbursts (Arp 220, IC 1623B, NGC 253, NGC 3256, NGC 3690E, and NGC 7552)272727 However, Teng et al. (2015) find that the X-ray data of Arp 220 is consistent with a CT AGN being present in this source. . So their W3 emission could be star-formation dominated. This leaves three more robust CT AGN candidates (ESO 420-13, NGC 1377, and NGC 3094).
We can also apply this diagnostic to the R90 AGN candidates which yields six galaxies, of which three are known to host starbursts (MCG +12-02-001, NGC 520 and NGC 3690W), leaving another three candidates for CT AGN (ESO 127-11, ESO 173-15, and ESO 495-5). We plan to investigate these candidates further in the future.
4.6 Total number of AGN estimate
Even without having confirmed all the R90 objects as AGN, we can make a rough estimate of the total number of AGN above a given luminosity limit within the volume based on the characterisation of the criterion and found numbers from the previous sections. The main assumption is that the defining feature of the R90 criterion is valid also in our volume, namely that of galaxies with such a red W1-W2 colour indeed host an AGN, at least for objects with as concluded in Sect. 4.4.1. This lower luminosity limit matches well with our completeness limit for the LASr-GPS (Sect. 3.2). Furthermore, R90 selects the majority of AGN with luminosities greater than this threshold (Sect. 4.3). Therefore, we use here in the absence of a more accurate AGN power tracer.
There are 221 R90 galaxies with , of which 160 are known to host an AGN, 84 of which are in the B70 sample. According to the R90 definition, we expect that 199 () of them host genuine AGN. This number is consistent with applying the S18 cut to the R90 sample instead, which would return 186 objects, i.e., , which is slightly lower but we know that S18 also removes some AGN. Owing the complications of S18 discussed in Sect. 4.4.1, we stick with the simple R90-based estimate in the following, i.e., our initial estimate for the total number of AGN in the volume is . For the final best estimate, this number has to be corrected by the various factors of incompleteness as discussed in the following.
4.6.1 Colour selection incompleteness
The main source of incompleteness is the colour selection. The R90 criterion from Assef et al. (2018) was designed for high reliability. This reliability comes at the price of a significant level of incompleteness, which we have seen already in Sect. 4.3. Namely, for a lower luminosity of , only of AGN are selected. Thus, we require to be multiplied by a colour selection incompleteness correction factor, . This factor does not yet account for contamination of the flux, which is addressed next.
4.6.2 Host contribution to W3
Host contribution, mostly through star formation, to W3 leads us to overestimate the intrinsic AGN luminosity and, thus, to the inclusion of AGN with intrinsic luminosities below our completeness limit. We have already estimated this effect statistically in Sect. 4.1 and applied a corresponding correctop in the Monte Carlo simulations of Sect. 4.4.2. Thus, we here just repeat the first part of the Monte-Carlo simulation of that section to estimate the distribution for the AGN in our R90 galaxies, where no direct measurement is available. This way, we find that out of the 221 () of the R90 galaxies have expected . Therefore, the corresponding host contamination correction factor is .
4.6.3 Parent sample incompleteness
Another source of incompleteness is of course the galaxy parent sample used for the AGN selection. The level of incompleteness of the LASr-GPS was estimated in Sect. 3.2. There, we used W1 as rough tracer of the stellar mass of the galaxies, while here we want to know the completeness with respect to the luminosity threshold. Thus, we repeat the completeness analysis of Sect. 3.2 but using W3, and find that for and , the galaxy parent sample is complete282828 The crossmatching with WISE is normally another source of incompleteness but we found WISE counterparts for all galaxies in the LASr-GPS. On the other hand, the WISE counterparts for of the galaxies were drowned by brighter nearby objects (Sect. 2.7). However, we do not consider this effect in the total number of AGN estimate because it is much smaller than the uncertainties of the other corrections. . As discussed in Sect. 3.2.3, the shadow of the Milky Way further increases the incompleteness of the parent sample by . Therefore, we adopt a total galaxy parent sample incompleteness correction factor, .
4.6.4 Other corrections, not accounted for
We did not attempt to correct for the fact that redshift-independent distances are not available for all of the galaxies. This is the case for of the R90 AGN and candidates. We found that the redshift independent distances are on average smaller than the redshift-based distances. This would mean that the luminosities of these galaxies would decrease by 0.04 dex, leading to the loss of 3 candidate AGN but none of the known AGN. At the same time, 31 additional known AGN and 20 candidates would fall into the volume. However, since we did not consider redshift-independent distances for galaxies with Mpc, a correction is not straightforward and thus not applied here.
In addition to the above incompleteness effects, there are also object intrinsic effects like obscuration in the MIR. The latter, however, has little effect on the W1-W2 colour at low redshifts as shown in Stern et al. (2012), because extinction at the wavelengths of W1 and W2 is low and approximately constant in typical extinction laws (e.g., Fritz et al. 2011). Thus, no correction for that is applied here.
Finally, one might ask, what about beamed MIR emission, i.e., blazars? Out of the full sample of 838 AGN in the full BAT 70 month catalogue, 105 are classified as beamed sources according to BZCAT (Massaro et al., 2009), and 5 are in our Mpc volume, implying a beamed fraction of ! On the other hand, all of these 5 objects are known to have SEDs that are not dominated by beamed emission (Cen A, Mrk 348, NGC 1052, NGC 1275, NGC 7213). This suggests that the true beamed fraction is , and, thus we ignore this effect here.
4.6.5 Best estimate
We applied all the above correction factors to our initial average estimate, , to arrive at our best estimate:
AGN with (equivalent to ) in our Mpc volume. This corresponds to a number density of 10-5 Mpc-3.
We also repeat the above estimation for and , resulting in and AGN above these luminosity thresholds, respectively. These compare to 53 and 2 AGN known with and , respectively, within the volume.
4.7 Comparison to estimates from luminosity functions
Finally, with these purely observational estimates for the number of AGN within 100 Mpc, one might want to compare to the predictions from currently used AGN luminosity functions. First, we compare to an optical luminosity function, namely the one derived by Palanque-Delabrouille et al. (2013) for luminous AGN in the redshift range , whereas its shape was assumed to be a standard double power law following Boyle et al. (2000). For a redshift of 0.01, they found a break magnitude of -22.1 and the power-law indices and , while the break value for the bolometric luminosity is . Here, we used the lower cut-off of for the bolometric luminosity which with the simple assumption of (e.g., Vasudevan & Fabian 2007) corresponds to the same lower luminosity cut used for our total AGN number estimate in the previous section, i.e., . We then integrated the luminosity function over the whole sky up to a redshift of 0.0222 (corresponding to our distance limit of 100 Mpc). This results in an estimated number of optical AGN of 82. The latter number corresponds only to the unobscured AGN, so we need to correct for the obscuration fraction which is somewhere between to (e.g., Schmitt et al. 2001; Hao et al. 2005), resulting in 164 to 410 objects.
Instead of an optical luminosity function, using an X-ray luminosity function has the advantage of also including obscured AGN (e.g., Ueda et al. 2003). There is a large variety of such functions available in the literature. For simplicity, we here choose only one of the recent works that attempted to incorporate the CT fraction as well, namely Aird et al. (2015). This work compares several different approaches for determining an X-ray luminosity function, and we refer the reader to that work for more details. We try several of those functions, for example the luminosity-dependent density evolution model which returns an estimate of 125 AGN including obscured objects, while the flexible double power law (FDPL) yields a total number estimate of 175 AGN above our luminosity limit. Finally, Aird et al. (2015) put forward a model that includes a description of the absorption distribution function (XLAF), allowing to compute the number of unobscured and obscured AGN separately. It results in an estimate of 97 unobscured and 264 obscured AGN, i.e., 361 AGN in total. This number is indeed very close to our best estimate of 362 AGN in our volume and also agrees well with a corresponding estimate using the luminosity function from Ueda et al. (2014). Interestingly, the best fitting CT/Compton-thin obscured fraction found in Aird et al. (2015) of predicts that 90 out of the 361 AGN are CT, i.e., a total CT fraction of . Once, the R90 AGN sample has been better characterised and the candidates verified, more constraining tests will be possible.
5 Summary & Conclusions
The recent and ongoing sensitive all-sky surveys including WISE, eROSITA and ART-XC , in combination with the collected knowledge of large astronomical databases, now allow us to obtain a complete census of significantly accreting SMBHs manifesting as AGN in the local Universe. This is the goal of LASr, and this work has presented the first steps in this project. In particular, we first created a LASr galaxy parent sample, LASr-GPS, of k galaxies by combining NED, SIMBAD, SDSS and 2MRS for a volume of Mpc. We then crossmatched the sample with WISE to obtain the MIR properties of the host galaxy bulges. The analysis based on this sample leads to the following main results:
- •
-
•
The 20.6k galaxies above this luminosity harbour 4.3k known AGN collected from identifications in the literature (Sect. 2.4). However, we caution the reader that not all of these AGN identifications might be reliable which is particularly true for the controversial class of the LINERs. Of these have an optical classification as Seyfert with the apparent type 2 to type 1 ratio between 49 to .
-
•
We compute optical classification-based corrections to estimate the nuclear luminosities of the AGN from the W3 profile fitting magnitudes, and find that the majority of the known AGN have low luminosities, i.e., only are estimated to have erg s-1 (Sect. 4.1).
-
•
We then proceed to use WISE-based AGN identification by MIR colour to find new AGN candidates. For this purpose we employ the R90 criterion from Assef et al. (2018), which is based on the W1-W2 and selects AGN with a pureness. We estimate that this criterion has an average efficiency of to select AGN with (Sect. 4.3).
-
•
The R90 criterion selects 172 galaxies known to host AGN (Sect. 4.3), and 159 AGN candidates (Sect. 4.4). Of the R90 selected AGN, are classified optically as Seyferts with an apparent type 2 fraction between 38 and , depending on how objects with multiple or intermediate classifications are treated. The intrinsic optical type 2 fraction is likely higher than because we expect most of the R90 candidates to be type 2. It could be up to , depending how many of the R90 candidates are genuine AGN and obscured.
- •
-
•
A lower luminosity cut of is efficient at removing compact star-forming galaxies, so that remaining contamination in our R90 sample should be low (Sect. 4.4.1). This luminosity cut leaves 61 robust AGN candidates.
-
•
We predict detection rates for the eROSITA all-sky survey, and find that the majority of the AGN candidates are expected to be highly obscured, in order to explain their non-detection by Swift/BAT and reach the expected intrinsic CT fraction for the whole sample (Sect. 4.4.2).
-
•
The discussion of constraints on the CT fraction based on the R90 selected AGN sample indicates the intrinsic CT fraction is likely higher than the estimated from the BAT 70 month sample, and could be up to (Sect. 4.5).
- •
In future LASr work, we plan to follow up the new AGN candidates, e.g., with optical spectroscopy and present a full characterisation of the R90 AGN sample, before adding additional AGN identification techniques, e.g., based on MIR variability to increase the fraction of identified AGN within 100 Mpc. In the long term, data from the X-ray missions will complement the MIR-based identification of AGN and provide intrinsic AGN power estimates, allowing us to combine MIR and X-ray diagnostics to identify and characterise the majority of CT AGN. The final volume-limited sample of LASr AGN should provide a robust redshift zero anchor for AGN population models.
Acknowledgements
The authors would like to especially thank the user support teams of NED and SIMBAD, without whom this work would not have been possible. DA would also like to give special thanks to the development teams of the two fantastic and ever-improving tools TOPCAT and Aladin, both of which played a fundamental part in this research. Furthermore, we cordially thank the referee for valuable comments that helped to improve the manuscript. DA acknowledges funding through the European Union’s Horizon 2020 and Innovation programme under the Marie Sklodowska-Curie grant agreement no. 793499 (DUSTDEVILS). PG acknowledges support from STFC (ST/R000506/1) and a UGC-UKIERI Thematic Partnership. PG also acknowledges discussions with the eROSITA AGN team, especially A. Merloni and A. Georgakakis. P. B. acknowledges financial support from the STFC and the Czech Science Foundation project No. 19-05599Y. RJA was supported by FONDECYT grant number 1191124. SF acknowledges support from the Horizon 2020 ERC Starting Grant DUST-IN-THE-WIND (ERC-2015-StG-677117). FS acknowledges partial support from a Leverhulme Trust Research Fellowship. JA acknowledges support from an STFC Ernest Rutherford Fellowship, grant code: ST/P004172/1. This publication makes use of data products from the Wide-field Infrared Survey Explorer, which is a joint project of the University of California, Los Angeles, and the Jet Propulsion Laboratory/California Institute of Technology, funded by the National Aeronautics and Space Administration. We acknowledge the usage of the HyperLeda database (http://leda.univ-lyon1.fr; Makarov et al. 2014). This research made use of the NASA/IPAC Extragalactic Database (NED), which is operated by the Jet Propulsion Laboratory, California Institute of Technology, under contract with the National Aeronautics and Space Administration. This research has made use of the SIMBAD database, operated at CDS, Strasbourg, France (Wenger et al., 2000). This research has made use of “Aladin sky atlas" developed at CDS, Strasbourg Observatory, France (Bonnarel et al., 2000; Boch & Fernique, 2014). This research made use of Astropy, a community-developed core Python package for Astronomy (Astropy Collaboration et al., 2013, 2018). This research has made use of NASA’s Astrophysics Data System. This research has made use of TOPCAT (Taylor, 2005).
References
- Aguado et al. (2019) Aguado D. S., et al., 2019, ApJSS, 240, 23
- Aird et al. (2010) Aird J., et al., 2010, MNRAS, 401, 2531
- Aird et al. (2015) Aird J., Coil A. L., Georgakakis A., Nandra K., Barro G., Pérez-González P. G., 2015, MNRAS, 451, 1892
- Akylas et al. (2016) Akylas A., Georgantopoulos I., Ranalli P., Gkiokas E., Corral A., Lanzuisi G., 2016, A&A, 594, A73
- Alexander & Hickox (2012) Alexander D. M., Hickox R. C., 2012, New Astronomy Reviews, 56, 93
- Alexander et al. (2005) Alexander D. M., Bauer F. E., Chapman S. C., Smail I., Blain A. W., Brandt W. N., Ivison R. J., 2005, ApJ, 632, 736
- Almeida & Ricci (2017) Almeida C. R., Ricci C., 2017, Nature Astronomy, 1, 679
- Ananna et al. (2019) Ananna T. T., et al., 2019, ApJ, 871, 240
- Asmus et al. (2014) Asmus D., Hönig S. F., Gandhi P., Smette A., Duschl W. J., 2014, MNRAS, 439, 1648
- Asmus et al. (2015) Asmus D., Gandhi P., Hönig S. F., Smette A., Duschl W. J., 2015, MNRAS, 454, 766
- Assef et al. (2010) Assef R. J., et al., 2010, ApJ, 713, 970
- Assef et al. (2013) Assef R. J., et al., 2013, ApJ, 772, 26
- Assef et al. (2018) Assef R. J., Stern D., Noirot G., Jun H. D., Cutri R. M., Eisenhardt P. R. M., 2018, ApJSS, 234, 23
- Astropy Collaboration et al. (2013) Astropy Collaboration et al., 2013, A&A, 558, A33
- Astropy Collaboration et al. (2018) Astropy Collaboration et al., 2018, AJ, 156, 123
- Baldi et al. (2018) Baldi R. D., et al., 2018, MNRAS, 476, 3478
- Baldry et al. (2018) Baldry I. K., et al., 2018, MNRAS, 474, 3875
- Baloković et al. (2014) Baloković M., et al., 2014, ApJ, 794, 111
- Barthelmy et al. (2005) Barthelmy S. D., et al., 2005, Space Science Reviews, 120, 143
- Baumgartner et al. (2013) Baumgartner W. H., Tueller J., Markwardt C. B., Skinner G. K., Barthelmy S., Mushotzky R. F., Evans P. A., Gehrels N., 2013, ApJSS, 207, 19
- Belfiore et al. (2016) Belfiore F., et al., 2016, MNRAS, 461, 3111
- Best et al. (2005) Best P. N., Kauffmann G., Heckman T. M., Ivezić v., 2005, MNRAS, 362, 9
- Blanton et al. (2017) Blanton M. R., et al., 2017, AJ, 154, 28
- Boch & Fernique (2014) Boch T., Fernique P., 2014, in Astronomical Data Analysis Software and Systems XXIII. p. 277, http://cdsads.u-strasbg.fr/abs/2014ASPC..485..277B
- Bonnarel et al. (2000) Bonnarel F., et al., 2000, A&A Supplement Series, 143, 33
- Boorman et al. (2016) Boorman P. G., et al., 2016, ApJ, 833, 245
- Boyle et al. (2000) Boyle B. J., Shanks T., Croom S. M., Smith R. J., Miller L., Loaring N., Heymans C., 2000, MNRAS, 317, 1014
- Buchner et al. (2015) Buchner J., et al., 2015, ApJ, 802, 89
- Burlon et al. (2011) Burlon D., Ajello M., Greiner J., Comastri A., Merloni A., Gehrels N., 2011, ApJ, 728, 58
- Cid Fernandes et al. (2010) Cid Fernandes R., Stasińska G., Schlickmann M. S., Mateus A., Vale Asari N., Schoenell W., Sodré L., 2010, MNRAS, 403, 1036
- Cid Fernandes et al. (2011) Cid Fernandes R., Stasińska G., Mateus A., Vale Asari N., 2011, MNRAS, 413, 1687
- Cluver et al. (2014) Cluver M. E., et al., 2014, ApJ, 782, 90
- Collaboration et al. (2016) Collaboration P., et al., 2016, A&A, 594, A13
- Cutri & et al. (2012) Cutri R. M., et al. 2012, VizieR Online Data Catalog, 2311
- Cutri & et al. (2013) Cutri R. M., et al. 2013, VizieR Online Data Catalog, 2328
- Davies et al. (2015) Davies R. I., et al., 2015, ApJ, 806, 127
- Fabian (1999) Fabian A. C., 1999, MNRAS, 308, L39
- Fabian (2012) Fabian A. C., 2012, ARA&A, 50, 455
- Fritz et al. (2011) Fritz T. K., et al., 2011, ApJ, 737, 73
- Gandhi & Fabian (2003) Gandhi P., Fabian A. C., 2003, MNRAS, 339, 1095
- Gandhi et al. (2007) Gandhi P., Fabian A. C., Suebsuwong T., Malzac J., Miniutti G., Wilman R. J., 2007, MNRAS, 382, 1005
- Gandhi et al. (2009) Gandhi P., Horst H., Smette A., Hönig S., Comastri A., Gilli R., Vignali C., Duschl W., 2009, A&A, 502, 457
- Gehrels et al. (2004) Gehrels N., et al., 2004, ApJ, 611, 1005
- Georgantopoulos & Akylas (2019) Georgantopoulos I., Akylas A., 2019, A&A, 621, A28
- Gilli et al. (2007) Gilli R., Comastri A., Hasinger G., 2007, A&A, 463, 79
- Goulding et al. (2010) Goulding A. D., Alexander D. M., Lehmer B. D., Mullaney J. R., 2010, MNRAS, 406, 597
- Granato et al. (2004) Granato G. L., De Zotti G., Silva L., Bressan A., Danese L., 2004, ApJ, 600, 580
- Guainazzi et al. (2005) Guainazzi M., Matt G., Perola G. C., 2005, A&A, 444, 119
- Hainline et al. (2016) Hainline K. N., Reines A. E., Greene J. E., Stern D., 2016, ApJ, 832, 119
- Hao et al. (2005) Hao L., et al., 2005, AJ, 129, 1795
- Hickox & Alexander (2018) Hickox R. C., Alexander D. M., 2018, ARA&A, 56, 625
- Ho (2009) Ho L. C., 2009, ApJ, 699, 626
- Hönig (2019) Hönig S. F., 2019, ApJ, 884, 171
- Hsieh et al. (2017) Hsieh B. C., et al., 2017, The ApJL, 851, L24
- Huchra et al. (2012) Huchra J. P., et al., 2012, ApJSS, 199, 26
- Ichikawa et al. (2017) Ichikawa K., Ricci C., Ueda Y., Matsuoka K., Toba Y., Kawamuro T., Trakhtenbrot B., Koss M. J., 2017, ApJ, 835, 74
- Jarrett et al. (2003) Jarrett T. H., Chester T., Cutri R., Schneider S. E., Huchra J. P., 2003, AJ, 125, 525
- Jarrett et al. (2019) Jarrett T. H., Cluver M. E., Brown M. J. I., Dale D. A., Tsai C. W., Masci F., 2019, ApJSS, 245, 25
- Kewley et al. (2006) Kewley L. J., Groves B., Kauffmann G., Heckman T., 2006, MNRAS, 372, 961
- Kormendy & Ho (2013) Kormendy J., Ho L. C., 2013, ARA&A, 51, 511
- Koss et al. (2017) Koss M., et al., 2017, ApJ, 850, 74
- Kulkarni et al. (2018) Kulkarni S. R., Perley D. A., Miller A. A., 2018, ApJ, 860, 22
- Lansbury et al. (2017) Lansbury G. B., et al., 2017, ApJ, 846, 20
- Lapi et al. (2006) Lapi A., Shankar F., Mao J., Granato G. L., Silva L., De Zotti G., Danese L., 2006, ApJ, 650, 42
- Levenson et al. (2006) Levenson N. A., Heckman T. M., Krolik J. H., Weaver K. A., Życki P. T., 2006, ApJ, 648, 111
- Liske et al. (2015) Liske J., et al., 2015, MNRAS, 452, 2087
- Lutz et al. (2004) Lutz D., Maiolino R., Spoon H. W. W., Moorwood A. F. M., 2004, A&A, 418, 465
- Maiolino et al. (2003) Maiolino R., et al., 2003, MNRAS, 344, L59
- Makarov et al. (2014) Makarov D., Prugniel P., Terekhova N., Courtois H., Vauglin I., 2014, A&A, 570, A13
- Markwardt et al. (2005) Markwardt C. B., Tueller J., Skinner G. K., Gehrels N., Barthelmy S. D., Mushotzky R. F., 2005, The ApJL, 633, L77
- Martín et al. (2016) Martín S., et al., 2016, A&A, 590, A25
- Martini & Weinberg (2001) Martini P., Weinberg D. H., 2001, ApJ, 547, 12
- Massaro et al. (2009) Massaro E., Giommi P., Leto C., Marchegiani P., Maselli A., Perri M., Piranomonte S., Sclavi S., 2009, A&A, 495, 691
- Mateos et al. (2012) Mateos S., et al., 2012, MNRAS, 426, 3271
- Merloni et al. (2012) Merloni A., et al., 2012, arXiv e-prints, p. arXiv:1209.3114
- Montero-Dorta & Prada (2009) Montero-Dorta A. D., Prada F., 2009, MNRAS, 399, 1106
- Netzer (2015) Netzer H., 2015, ARA&A, 53, 365
- Padovani (2016) Padovani P., 2016, A&ARv, 24, 13
- Paggi et al. (2017) Paggi A., et al., 2017, ApJ, 841, 44
- Palanque-Delabrouille et al. (2013) Palanque-Delabrouille N., et al., 2013, A&A, 551, A29
- Pavlinsky et al. (2011) Pavlinsky M., et al., 2011, Society of Photo-Optical Instrumentation Engineers (SPIE) Conference Series, 8147, 814706
- Pavlinsky et al. (2018) Pavlinsky M., et al., 2018, Space Telescopes and Instrumentation 2018: Ultraviolet to Gamma Ray, 10699, 106991Y
- Predehl et al. (2010) Predehl P., et al., 2010, Space Telescopes and Instrumentation 2010: Ultraviolet to Gamma Ray, 7732, 77320U
- Reid et al. (2016) Reid B., et al., 2016, MNRAS, 455, 1553
- Ricci et al. (2015) Ricci C., Ueda Y., Koss M. J., Trakhtenbrot B., Bauer F. E., Gandhi P., 2015, The ApJL, 815, L13
- Ricci et al. (2017) Ricci C., et al., 2017, ApJSS, 233, 17
- Riffel et al. (2018) Riffel R. A., et al., 2018, MNRAS, 474, 1373
- Roche et al. (2015) Roche P. F., Alonso-Herrero A., Gonzalez-Martin O., 2015, MNRAS, 449, 2598
- Sakamoto et al. (2013) Sakamoto K., Aalto S., Costagliola F., Martín S., Ohyama Y., Wiedner M. C., Wilner D. J., 2013, ApJ, 764, 42
- Sakamoto et al. (2017) Sakamoto K., et al., 2017, ApJ, 849, 14
- Sarkar et al. (2019) Sarkar S., Pandey B., Khatri R., 2019, MNRAS, 483, 2453
- Satyapal et al. (2018) Satyapal S., Abel N. P., Secrest N. J., 2018, ApJ, 858, 38
- Schmitt et al. (2001) Schmitt H. R., Antonucci R. R. J., Ulvestad J. S., Kinney A. L., Clarke C. J., Pringle J. E., 2001, ApJ, 555, 663
- Shankar et al. (2006) Shankar F., Lapi A., Salucci P., De Zotti G., Danese L., 2006, ApJ, 643, 14
- Shankar et al. (2009) Shankar F., Weinberg D. H., Miralda-Escudé J., 2009, ApJ, 690, 20
- Shankar et al. (2016) Shankar F., et al., 2016, MNRAS, 460, 3119
- Shankar et al. (2019) Shankar F., et al., 2019, Nature Astronomy
- Singh et al. (2012) Singh V., Risaliti G., Braito V., Shastri P., 2012, MNRAS, 419, 2089
- Skrutskie et al. (2006) Skrutskie M. F., et al., 2006, AJ, 131, 1163
- Stalevski et al. (2016) Stalevski M., Ricci C., Ueda Y., Lira P., Fritz J., Baes M., 2016, MNRAS, 458, 2288
- Stasińska et al. (2008) Stasińska G., Vale Asari N., Cid Fernandes R., Gomes J. M., Schlickmann M., Mateus A., Schoenell W., Sodré L., 2008, MNRAS, 391, L29
- Steer et al. (2017) Steer I., et al., 2017, AJ, 153, 37
- Stern et al. (2012) Stern D., et al., 2012, ApJ, 753, 30
- Tadhunter (2016) Tadhunter C., 2016, A&ARv, 24, 10
- Taylor (2005) Taylor M. B., 2005, in Astronomical Data Analysis Software and Systems XIV. p. 29, http://adsabs.harvard.edu/abs/2005ASPC..347...29T
- Teng et al. (2015) Teng S. H., et al., 2015, ApJ, 814, 56
- Tueller et al. (2008) Tueller J., Mushotzky R. F., Barthelmy S., Cannizzo J. K., Gehrels N., Markwardt C. B., Skinner G. K., Winter L. M., 2008, ApJ, 681, 113
- Ueda et al. (2003) Ueda Y., Akiyama M., Ohta K., Miyaji T., 2003, ApJ, 598, 886
- Ueda et al. (2014) Ueda Y., Akiyama M., Hasinger G., Miyaji T., Watson M. G., 2014, ApJ, 786, 104
- Varenius et al. (2014) Varenius E., Conway J. E., Martí-Vidal I., Aalto S., Beswick R., Costagliola F., Klöckner H.-R., 2014, A&A, 566, A15
- Vasudevan & Fabian (2007) Vasudevan R. V., Fabian A. C., 2007, MNRAS, 381, 1235
- Véron-Cetty & Véron (2010) Véron-Cetty M.-P., Véron P., 2010, A&A, 518, 10
- Wen et al. (2013) Wen X.-Q., Wu H., Zhu Y.-N., Lam M. I., Wu C.-J., Wicker J., Zhao Y.-H., 2013, MNRAS, 433, 2946
- Wenger et al. (2000) Wenger M., et al., 2000, A&A Supplement Series, 143, 9
- Wright et al. (2010) Wright E. L., et al., 2010, AJ, 140, 1868
- Yan & Blanton (2012) Yan R., Blanton M. R., 2012, ApJ, 747, 61
- Yoast-Hull et al. (2017) Yoast-Hull T. M., Gallagher III J. S., Aalto S., Varenius E., 2017, MNRAS, 469, L89
- Zaw et al. (2019) Zaw I., Chen Y.-P., Farrar G. R., 2019, ApJ, 872, 134
| in | known | z | No | |||||||||||||||
|---|---|---|---|---|---|---|---|---|---|---|---|---|---|---|---|---|---|---|
| Name | Origin | 2MRS | AGN | starburst | RA | DEC | z | Flag | D | Nucleus | W1 | W2 | W3 | W4 | W1-W2 | W2-W3 | (W1) | (W3) |
| [∘] | [∘] | [Mpc] | [mag] | [mag] | [mag] | [mag] | [mag] | [mag] | [erg/s] | [erg/s] | ||||||||
| (1) | (2) | (3) | (4) | (5) | (6) | (7) | (8) | (9) | (10) | (11) | (12) | (13) | (14) | (15) | (16) | (17) | (18) | (19) |
| 2dFGRS S805Z417 | NED | False | False | False | 0.00162 | -56.14106 | 0.01010 | 0 | 45.0 | False | 15.98 | 15.92 | 12.56 | 9.00 | 0.07 | 3.36 | 40.4 | 40.3 |
| UGC 12889 | NED | True | False | False | 0.00696 | 47.27479 | 0.01673 | 0 | 75.0 | False | 11.07 | 11.13 | 9.04 | 7.03 | -0.05 | 2.09 | 42.8 | 42.1 |
| KUG 2357+156 | NED | False | False | False | 0.00905 | 15.88188 | 0.02002 | 0 | 89.9 | False | 12.18 | 12.09 | 8.11 | 6.02 | 0.09 | 3.98 | 42.6 | 42.7 |
| SDSS J000003.22-010646.9 | NED | False | False | False | 0.01342 | -1.11303 | 0.02178 | 0 | 98.0 | True | 15.41 | 15.11 | 11.98 | 8.88 | 0.30 | 3.13 | 41.3 | 41.2 |
| KUG 2357+228 | NED | False | False | False | 0.01464 | 23.08753 | 0.01488 | 0 | 66.6 | False | 14.77 | 14.69 | 11.81 | 8.62 | 0.08 | 2.88 | 41.3 | 40.9 |
| MCG -01-01-016 | NED | True | False | False | 0.03600 | -6.37400 | 0.02179 | 0 | 98.0 | False | 11.95 | 11.90 | 8.53 | 6.66 | 0.04 | 3.37 | 42.7 | 42.6 |
| MCG -01-01-017 | NED | True | True | False | 0.04708 | -5.15875 | 0.01898 | 0 | 85.2 | False | 12.43 | 12.45 | 9.40 | 7.46 | -0.02 | 3.05 | 42.4 | 42.1 |
| 2MASX J00001215+0205503 | NED | False | False | False | 0.05067 | 2.09742 | 0.02170 | 0 | 97.6 | False | 12.01 | 11.75 | 7.67 | 4.57 | 0.26 | 4.09 | 42.7 | 42.9 |
| CGCG 548-023 | NED | True | False | True | 0.05404 | 46.96514 | 0.01790 | 0 | 80.3 | False | 11.29 | 11.13 | 8.60 | 6.33 | 0.16 | 2.54 | 42.8 | 42.4 |
| CGCG 498-057 | NED | False | False | False | 0.05542 | 33.13417 | 0.01684 | 0 | 75.5 | False | 12.12 | 12.00 | 9.05 | 7.05 | 0.12 | 2.95 | 42.4 | 42.1 |
| 2MFGC 00003 | NED | False | False | False | 0.05975 | 70.03300 | 0.01530 | 0 | 68.5 | False | 11.80 | 11.57 | 7.50 | 5.59 | 0.23 | 4.07 | 42.5 | 42.7 |
| GALEXASC J000017.22+272403.0 | NED | False | False | False | 0.07208 | 27.40083 | 0.01552 | 0 | 69.5 | False | 15.18 | 14.95 | 12.02 | 8.97 | 0.22 | 2.93 | 41.1 | 40.9 |
| GALEXASC J000019.31-315611.3 | NED | False | False | False | 0.08050 | -31.93667 | 0.01230 | 0 | 54.9 | False | 15.42 | 15.06 | 12.30 | 9.07 | 0.36 | 2.76 | 40.8 | 40.6 |
| FAIRALL 1061 | NED | True | False | False | 0.09838 | -47.01881 | 0.01998 | 0 | 89.8 | False | 11.04 | 11.12 | 10.54 | 8.51 | -0.08 | 0.58 | 43.0 | 41.7 |
| 2MASX J00002482-0451473 | NED | False | False | False | 0.10351 | -4.86313 | 0.01892 | 0 | 85.0 | False | 13.10 | 13.17 | 11.48 | 7.97 | -0.06 | 1.69 | 42.1 | 41.3 |
| UGC 12893 | NED | False | False | False | 0.11638 | 17.21869 | 0.00367 | 0 | 16.3 | False | 14.95 | 15.00 | 12.58 | 8.22 | -0.05 | 2.42 | 40.0 | 39.4 |
| LEDA 089491 | NED | False | False | False | 0.12167 | -60.68076 | 0.02210 | 0 | 99.5 | False | 14.64 | 14.44 | 10.91 | 7.58 | 0.20 | 3.53 | 41.7 | 41.6 |
| ESO 293- G 027 | NED | False | False | False | 0.12283 | -40.48447 | 0.01061 | 0 | 47.3 | False | 12.60 | 12.58 | 9.42 | 7.22 | 0.02 | 3.15 | 41.8 | 41.6 |
| KUG 2357+225 | NED | False | False | False | 0.13946 | 22.77844 | 0.02020 | 0 | 90.8 | False | 13.20 | 13.03 | 9.43 | 6.73 | 0.18 | 3.59 | 42.1 | 42.1 |
| UGC 12898 | NED | False | False | False | 0.15600 | 33.60127 | 0.01594 | 0 | 71.4 | False | 15.08 | 14.88 | 12.39 | 8.22 | 0.20 | 2.48 | 41.2 | 40.7 |
| 2dFGRS S357Z026 | NED | False | False | False | 0.19546 | -30.64639 | 0.01428 | 0 | 63.9 | False | 16.00 | 16.07 | 12.63 | 8.86 | -0.08 | 3.45 | 40.7 | 40.6 |
| ESO 193- G 009 | NED | True | False | False | 0.22192 | -47.35681 | 0.01972 | 0 | 88.6 | False | 11.28 | 11.31 | 9.28 | 7.85 | -0.03 | 2.03 | 42.9 | 42.2 |
| APMUKS(BJ) B235824.83-412603.8 | NED | False | False | False | 0.24577 | -41.15485 | 0.00050 | 0 | 2.2 | True | 17.39 | 17.05 | 12.66 | 9.24 | 0.33 | 4.39 | 37.3 | 37.6 |
| NGC 7802 | NED | True | False | False | 0.25175 | 6.24206 | 0.01776 | 0 | 79.7 | False | 10.46 | 10.48 | 9.54 | 7.66 | -0.02 | 0.94 | 43.1 | 42.0 |
| SDSS J000103.59+143448.6 | NED | False | False | True | 0.26500 | 14.58018 | 0.00573 | 0 | 25.5 | False | 15.58 | 15.40 | 11.98 | 8.54 | 0.18 | 3.42 | 40.1 | 40.0 |
| GALEXASC J000109.10-162721.7 | NED | False | False | False | 0.28813 | -16.45619 | 0.01574 | 0 | 70.5 | False | 15.34 | 15.27 | 11.99 | 8.68 | 0.07 | 3.28 | 41.1 | 40.9 |
| KUG 2358+128A | NED | False | False | False | 0.30575 | 13.14406 | 0.01830 | 0 | 82.1 | False | 13.13 | 13.05 | 9.65 | 7.12 | 0.08 | 3.40 | 42.1 | 42.0 |
| MCG +02-01-010 | NED | False | False | False | 0.31238 | 13.11256 | 0.01873 | 0 | 84.1 | False | 14.20 | 14.06 | 11.02 | 8.36 | 0.14 | 3.04 | 41.7 | 41.4 |
| IC 5376 | NED | True | True | False | 0.33237 | 34.52572 | 0.01678 | 0 | 75.2 | False | 10.95 | 11.00 | 8.95 | 7.28 | -0.05 | 2.05 | 42.9 | 42.2 |
| NGC 7803 | NED | True | False | False | 0.33321 | 13.11125 | 0.01790 | 0 | 80.3 | False | 10.27 | 10.17 | 6.92 | 4.48 | 0.11 | 3.25 | 43.2 | 43.0 |
| 2MASX J00012334+4733537 | NED | True | True | False | 0.34764 | 47.56505 | 0.01747 | 0 | 78.3 | False | 11.77 | 11.18 | 7.76 | 5.19 | 0.59 | 3.42 | 42.6 | 42.7 |
| MRK 0934 | NED | False | False | False | 0.35850 | 13.11300 | 0.01753 | 0 | 78.6 | False | 12.59 | 12.44 | 8.65 | 6.25 | 0.15 | 3.80 | 42.3 | 42.3 |
| NGC 7805 | NED | True | False | False | 0.36154 | 31.43375 | 0.01605 | 0 | 71.9 | False | 10.55 | 10.61 | 10.13 | 8.89 | -0.06 | 0.49 | 43.0 | 41.7 |
| UGC 12910 | NED | False | False | False | 0.36833 | 5.38944 | 0.01317 | 0 | 58.9 | False | 15.48 | 15.08 | 12.02 | 8.38 | 0.40 | 3.06 | 40.9 | 40.7 |
| NGC 7806 | NED | True | False | False | 0.37521 | 31.44186 | 0.01590 | 0 | 71.2 | False | 10.82 | 10.80 | 8.62 | 6.89 | 0.03 | 2.17 | 42.9 | 42.2 |
| CGCG 433-016 | NED | False | False | True | 0.39146 | 15.08156 | 0.02119 | 0 | 95.3 | False | 14.25 | 14.03 | 10.20 | 7.52 | 0.22 | 3.82 | 41.8 | 41.9 |
| UGC 12913 | NED | False | False | False | 0.40292 | 3.50558 | 0.02115 | 0 | 95.1 | False | 14.21 | 14.05 | 11.32 | 8.47 | 0.16 | 2.73 | 41.8 | 41.4 |
| GALEXASC J000137.80+172918.9 | NED | False | False | False | 0.40708 | 17.48861 | 0.02151 | 0 | 96.7 | False | 16.50 | 16.43 | 12.50 | 9.01 | 0.06 | 3.94 | 40.9 | 41.0 |
| UGC 12914 | NED | True | True | False | 0.40967 | 23.48364 | 0.01458 | 0 | 65.2 | False | 10.28 | 10.25 | 7.78 | 5.34 | 0.03 | 2.47 | 43.0 | 42.5 |
| AGC 748776 | SIMBAD | False | False | False | 0.42229 | 13.84256 | 0.02112 | 0 | 95.0 | False | 15.27 | 14.95 | 12.17 | 8.80 | 0.33 | 2.78 | 41.4 | 41.1 |
| Abridged. Full table available online in digitial format. | ||||||||||||||||||
– Notes: (1) object name, mostly following NED nomenclature; (2) origin of object with preference to NED if available; (3) flag whether the galaxy is in 2MRS; (4) and (5) flag whether galaxy is known to host an AGN or starburst, respectively; (6) and (7) equatorial coordinates of the object centre in J2000 in degrees; (8) redshift; (9) redshift confidence flag: 0 means that the value is robust, 1 means that the value is not robust but there is no reason to doubt, and 2 means that the redshift is controversial; (10) object distance in Mpc; (11) No nucleus flag: If true, the source does not show any clear centre or nucleus in the optical/infrared images; (12), (13), (14), and (15) WISE profile-fitting photometric magnitudes; (16) and (17) WISE W1-W2 and W2-W3 colours; (18) and (19) observed W1 and W3 continuum luminosities , calculated from the selected distance and the profile-fitting magnitudes.
| in | ||||||||||||||||||
|---|---|---|---|---|---|---|---|---|---|---|---|---|---|---|---|---|---|---|
| Name | 2MRS | Seyfert | Sy 1 | Sy 2 | LINER | H II | starburst | RA | DEC | z | D | W1-W2 | W2-W3 | (W1) | (W3) | () | (2-10 keV) | S18 |
| [∘] | [∘] | [Mpc] | [mag] | [mag] | [erg/s] | [erg/s] | [erg/s] | [erg/s] | ||||||||||
| (1) | (2) | (3) | (4) | (5) | (6) | (7) | (8) | (9) | (10) | (11) | (12) | (13) | (14) | (15) | (16) | (17) | (18) | (19) |
| UGC 00006 | True | True | True | True | False | True | False | 0.79009 | 21.96016 | 0.02195 | 98.7 | 0.81 | 3.51 | 43.6 | 43.8 | 43.580.57 | … | True |
| MCG -01-01-069 | True | True | True | False | False | True | False | 4.36917 | -3.23050 | 0.02129 | 95.8 | 1.68 | 3.02 | 42.8 | 43.2 | 42.810.57 | … | True |
| 2MASX J00193596-0440105 | True | True | False | True | True | False | False | 4.89999 | -4.66957 | 0.02052 | 92.2 | 1.02 | 3.16 | 43.4 | 43.6 | 43.210.57 | … | True |
| 2MASX J00253292+6821442 | False | True | False | True | False | False | False | 6.38696 | 68.36228 | 0.01200 | 53.6 | 0.68 | 3.09 | 42.9 | 42.9 | 42.620.22 | 43.2 | True |
| ESO 350-IG 038 | False | False | False | False | False | True | False | 9.21958 | -33.55472 | 0.02060 | 92.6 | 1.34 | 4.46 | 43.2 | 44.0 | 43.390.23 | … | False |
| NGC 0253 | True | True | False | True | False | True | True | 11.88800 | -25.28822 | 0.00081 | 3.2 | 0.73 | 4.94 | 42.2 | 43.0 | 41.50 | 39.7 | False |
| NGC 0262 | True | True | True | True | False | False | False | 12.19642 | 31.95697 | 0.01502 | 67.2 | 1.21 | 3.11 | 43.4 | 43.6 | 43.450.22 | 43.5 | True |
| IC 1623B | True | True | True | False | False | True | False | 16.94817 | -17.50697 | 0.02025 | 91.0 | 1.24 | 3.85 | 43.6 | 44.1 | 43.920.57 | … | True |
| NGC 0424 | True | True | True | True | False | False | False | 17.86511 | -38.08347 | 0.01178 | 52.6 | 1.22 | 2.83 | 43.7 | 43.8 | 43.780.11 | 43.8 | True |
| NGC 0454 NED02 | True | True | False | True | False | False | False | 18.60387 | -55.39708 | 0.01213 | 54.2 | 0.70 | 2.88 | 43.1 | 43.0 | 43.080.09 | 42.2 | True |
| NGC 0449 | True | True | False | True | False | False | False | 19.03020 | 33.08956 | 0.01595 | 71.4 | 1.31 | 4.10 | 42.8 | 43.4 | 43.230.22 | … | True |
| MCG +08-03-018 | True | False | False | False | False | False | False | 20.64346 | 50.05500 | 0.02040 | 91.7 | 1.21 | 3.83 | 43.0 | 43.5 | 43.250.57 | 44.0 | True |
| NGC 0526A | True | True | True | True | False | False | False | 20.97664 | -35.06553 | 0.01897 | 85.2 | 0.79 | 2.52 | 43.7 | 43.5 | 43.710.05 | 43.3 | True |
| UGC 01032 | True | True | True | False | False | False | False | 21.88563 | 19.17883 | 0.01739 | 78.0 | 0.72 | 3.25 | 43.2 | 43.3 | 43.100.22 | 42.7 | True |
| ESO 543- G 008 | False | False | False | False | False | False | False | 24.83504 | -20.45306 | 0.02122 | 95.4 | 0.98 | 3.49 | 42.9 | 43.1 | 42.760.57 | … | True |
| NGC 0660 | True | True | False | True | True | True | False | 25.76000 | 13.64506 | 0.00286 | 13.4 | 1.15 | 3.33 | 42.6 | 42.8 | 42.430.57 | … | True |
| UGC 01214 | True | True | True | True | False | False | False | 25.99084 | 2.34990 | 0.01718 | 77.0 | 1.13 | 3.65 | 43.3 | 43.7 | 43.580.07 | 43.2 | True |
| 2MASX J01500266-0725482 | False | True | True | True | False | False | False | 27.51124 | -7.43014 | 0.01803 | 80.9 | 1.34 | 4.24 | 42.8 | 43.5 | 43.350.22 | … | True |
| NGC 0788 | True | True | True | True | False | False | False | 30.27686 | -6.81552 | 0.01360 | 60.8 | 0.78 | 3.17 | 43.2 | 43.2 | 43.170.05 | 43.0 | True |
| ESO 246- G 004 | True | True | True | False | False | False | False | 33.98746 | -45.60003 | 0.02131 | 95.8 | 1.04 | 2.76 | 43.0 | 43.0 | 42.790.22 | … | True |
| MRK 1044 | True | True | True | False | False | False | False | 37.52302 | -8.99814 | 0.01611 | 72.2 | 0.83 | 2.74 | 43.4 | 43.3 | 43.060.22 | 42.5 | True |
| MESSIER 077 | True | True | True | True | False | False | False | 40.66963 | -0.01328 | 0.00379 | 10.5 | 1.13 | 3.61 | 43.9 | 44.3 | 43.580.07 | 42.5 | True |
| MRK 1058 | True | True | False | True | False | False | False | 42.46596 | 34.98799 | 0.01714 | 76.8 | 0.69 | 3.45 | 43.0 | 43.1 | 42.870.22 | … | True |
| SWIFT J0250.2+4650 | False | True | False | True | False | False | False | 42.61325 | 46.79150 | 0.02120 | 95.3 | 1.04 | 3.16 | 42.6 | 42.8 | 42.540.22 | 42.9 | True |
| NGC 1125 | True | True | True | True | False | False | False | 42.91850 | -16.65067 | 0.01102 | 49.2 | 0.68 | 3.78 | 42.7 | 43.0 | 42.780.22 | 42.8 | True |
| MCG -02-08-014 | True | True | False | True | False | True | False | 43.09748 | -8.51041 | 0.01675 | 75.1 | 0.94 | 2.50 | 43.0 | 42.9 | 42.870.08 | 42.9 | True |
| UGC 02456 | True | True | False | True | False | False | False | 44.99413 | 36.82063 | 0.01202 | 53.7 | 0.81 | 4.05 | 43.1 | 43.5 | 43.380.22 | … | True |
| NGC 1194 | True | True | True | True | False | False | False | 45.95462 | -1.10374 | 0.01361 | 60.9 | 1.31 | 2.97 | 43.2 | 43.4 | 43.490.04 | 43.7 | True |
| NGC 1275 | True | True | True | True | False | False | False | 49.95067 | 41.51170 | 0.01756 | 78.8 | 1.01 | 4.01 | 43.7 | 44.2 | 44.230.04 | 44.0 | True |
| NGC 1320 | True | True | False | True | False | False | False | 51.20292 | -3.04228 | 0.00923 | 37.7 | 0.92 | 3.55 | 42.9 | 43.1 | 42.910.22 | … | True |
| ESO 116- G 018 | True | True | False | True | False | False | False | 51.22104 | -60.73844 | 0.01850 | 83.0 | 0.95 | 3.55 | 43.3 | 43.6 | 43.410.22 | … | True |
| NGC 1365 | True | True | True | True | False | True | False | 53.40155 | -36.14040 | 0.00550 | 17.8 | 0.76 | 3.89 | 42.9 | 43.3 | 42.530.04 | 42.1 | True |
| NGC 1386 | True | True | True | True | False | False | False | 54.19242 | -35.99939 | 0.00290 | 16.2 | 0.85 | 3.45 | 42.4 | 42.6 | 42.370.08 | 42.0 | True |
| ESO 548- G 081 | True | True | True | False | False | False | False | 55.51529 | -21.24426 | 0.01447 | 64.7 | 0.71 | 1.99 | 43.6 | 43.2 | 43.040.16 | 43.0 | True |
| ESO 420- G 013 | True | True | False | True | True | True | False | 63.45704 | -32.00697 | 0.01195 | 53.4 | 0.97 | 3.86 | 43.2 | 43.6 | 43.210.08 | … | True |
| 2MASX J04282604-0433496 | False | True | False | True | True | False | False | 67.10854 | -4.56375 | 0.01572 | 70.4 | 0.86 | 5.30 | 42.4 | 43.3 | 42.910.57 | … | False |
| 2MASX J04344151+4014219 | True | True | True | False | False | False | False | 68.67304 | 40.23939 | 0.02048 | 92.1 | 0.73 | 3.25 | 43.5 | 43.6 | 43.440.22 | … | True |
| 2MASX J04405494-0822221 | True | True | True | True | False | False | False | 70.22902 | -8.37284 | 0.01517 | 67.9 | 1.53 | 3.13 | 43.4 | 43.8 | 43.610.22 | … | True |
| UGC 03142 | True | True | True | False | False | False | False | 70.94496 | 28.97192 | 0.02168 | 97.5 | 0.80 | 2.98 | 43.3 | 43.3 | 43.080.22 | 43.3 | True |
| UGC 03157 | True | True | False | True | False | False | False | 71.62363 | 18.46089 | 0.01541 | 69.0 | 0.71 | 3.44 | 43.1 | 43.3 | 43.060.22 | 42.9 | True |
| 2MASX J04524451-0312571 | True | True | True | True | False | False | False | 73.18529 | -3.21593 | 0.01569 | 70.3 | 0.89 | 4.32 | 42.7 | 43.3 | 43.080.22 | … | True |
| ESO 033- G 002 | True | True | False | True | False | False | False | 73.99567 | -75.54117 | 0.01826 | 82.0 | 0.94 | 3.14 | 43.5 | 43.6 | 43.540.14 | 42.2 | True |
| CGCG 468-002 NED02 | True | True | True | False | False | False | False | 77.08837 | 17.36894 | 0.01684 | 75.5 | 0.76 | 4.42 | 42.7 | 43.3 | 43.080.22 | … | False |
| GALEXASC J051045.55+162958.9 | False | True | True | False | False | False | False | 77.68962 | 16.49885 | 0.01788 | 80.2 | 1.05 | 3.50 | 43.4 | 43.7 | 43.550.22 | 43.6 | True |
| 2MFGC 04298 | True | True | False | True | False | False | False | 79.09471 | 19.45311 | 0.01875 | 84.2 | 0.91 | 2.98 | 43.0 | 43.0 | 42.810.22 | 42.4 | True |
| ESO 362- G 018 | True | True | True | True | False | False | False | 79.89916 | -32.65758 | 0.01258 | 56.2 | 0.69 | 3.51 | 43.1 | 43.2 | 43.170.05 | 43.0 | True |
| 2MASX J05353211+4011152 | False | True | True | False | False | False | False | 83.88385 | 40.18770 | 0.02083 | 93.6 | 0.96 | 3.56 | 43.0 | 43.3 | 43.080.22 | 42.4 | True |
| NGC 2110 | True | True | True | True | True | False | False | 88.04742 | -7.45621 | 0.00780 | 35.6 | 0.78 | 2.62 | 43.3 | 43.2 | 43.080.06 | 42.7 | True |
| 2MASX J05523323-1122290 | True | True | False | True | False | False | False | 88.13837 | -11.37478 | 0.02189 | 98.5 | 1.17 | 3.75 | 43.1 | 43.6 | 43.420.22 | … | True |
| UGC 03374 | True | True | True | False | False | False | False | 88.72338 | 46.43934 | 0.02048 | 92.1 | 1.02 | 2.95 | 44.1 | 44.2 | 44.060.22 | 43.8 | True |
| UGC 03426 | True | True | True | True | False | False | False | 93.90152 | 71.03753 | 0.01350 | 60.4 | 0.87 | … | 43.4 | … | 43.690.10 | 43.7 | True |
| 2MASX J06230531-0607132 | True | True | False | True | False | False | False | 95.77217 | -6.12036 | 0.02015 | 90.6 | 0.84 | 4.33 | 43.0 | 43.5 | 43.340.22 | … | False |
| UGC 03478 | True | True | True | False | False | False | False | 98.19654 | 63.67367 | 0.01278 | 57.1 | 0.68 | 2.82 | 43.1 | 43.0 | 42.760.22 | 42.5 | True |
| UVQS J064939.21+261109.0 | False | False | False | False | False | False | False | 102.41337 | 26.18583 | 0.01700 | 76.2 | 0.73 | 4.95 | 41.5 | 42.3 | 41.760.57 | … | False |
| NGC 2273 | True | True | True | True | False | False | False | 102.53607 | 60.84581 | 0.00614 | 30.2 | 0.69 | 3.69 | 42.8 | 43.0 | 42.780.22 | … | True |
| IC 0450 | True | True | True | True | False | False | False | 103.05105 | 74.42707 | 0.01881 | 84.4 | 0.79 | 2.42 | 44.0 | 43.8 | 43.620.22 | 43.1 | True |
| CGCG 234-021 | True | True | False | True | False | False | False | 103.15412 | 45.78064 | 0.02184 | 98.3 | 0.75 | 3.90 | 43.1 | 43.5 | 43.300.22 | … | True |
| UGC 03752 | True | True | False | True | False | False | False | 108.51608 | 35.27928 | 0.01569 | 70.3 | 0.90 | 3.28 | 43.4 | 43.6 | 43.390.22 | 43.1 | True |
| 2MASX J07170726-3254197 | True | True | True | False | False | False | False | 109.28017 | -32.90542 | 0.00772 | 34.4 | 0.97 | 2.90 | 42.5 | 42.5 | 42.220.22 | … | True |
| CGCG 147-020 | True | False | False | False | False | False | False | 111.40569 | 29.95411 | 0.01885 | 84.6 | 1.15 | 3.31 | 43.1 | 43.4 | 43.080.57 | 43.3 | True |
| UGC 03901 | True | True | True | False | False | False | False | 113.47120 | 49.29183 | 0.02048 | 92.0 | 0.74 | 3.28 | 42.9 | 43.0 | 42.780.22 | … | True |
| UGC 03995B | True | True | False | True | False | False | False | 116.03803 | 29.24740 | 0.01597 | 71.5 | 0.85 | 2.94 | 43.4 | 43.4 | 43.190.22 | 42.5 | True |
| IC 2207 | True | True | False | True | False | True | False | 117.46204 | 33.96228 | 0.01602 | 71.8 | 0.75 | 2.51 | 43.1 | 42.8 | 42.410.57 | … | True |
| UGC 04145 | True | True | True | True | False | False | False | 119.91716 | 15.38682 | 0.01552 | 69.5 | 0.68 | 3.77 | 43.3 | 43.5 | 43.360.22 | … | True |
| Phoenix Galaxy | True | True | True | True | False | False | False | 121.02441 | 5.11385 | 0.01350 | 60.3 | 1.39 | 3.98 | 43.1 | 43.7 | 43.550.22 | 43.2 | True |
| MCG -02-22-003 | True | True | False | True | False | False | False | 125.38975 | -13.35114 | 0.01436 | 64.2 | 0.74 | 3.19 | 42.7 | 42.8 | 42.510.22 | … | True |
| FAIRALL 0272 | True | True | False | True | False | False | False | 125.75458 | -4.93486 | 0.02182 | 98.2 | 0.98 | 2.88 | 43.3 | 43.3 | 43.120.22 | 43.1 | True |
| CGCG 032-017 | False | False | False | False | False | True | True | 125.89518 | 3.22101 | 0.00978 | 43.6 | 0.81 | 5.05 | 41.0 | 41.8 | 40.680.23 | … | False |
| ESO 018- G 009 | True | True | False | True | False | False | False | 126.03288 | -77.78258 | 0.01762 | 79.0 | 1.24 | 3.87 | 42.9 | 43.4 | 43.250.22 | … | True |
| MRK 0093 | False | True | False | True | False | True | True | 129.17642 | 66.23292 | 0.01783 | 80.0 | 0.79 | 4.65 | 42.5 | 43.1 | 42.790.57 | … | False |
| NGC 2623 | True | True | True | True | True | False | False | 129.60032 | 25.75464 | 0.01818 | 81.6 | 0.76 | 4.22 | 43.1 | 43.6 | 43.550.20 | … | True |
| ARP 007 | True | True | True | False | False | True | False | 132.58433 | -16.57947 | 0.01860 | 83.5 | 0.65 | 3.69 | 42.9 | 43.1 | 42.780.57 | … | True |
| MCG -01-24-012 | True | True | True | True | False | False | False | 140.19271 | -8.05614 | 0.01968 | 88.4 | 1.13 | 3.47 | 43.0 | 43.3 | 43.410.04 | 43.3 | True |
| CGCG 122-055 | True | True | True | False | False | False | False | 145.51997 | 23.68526 | 0.02130 | 95.8 | 0.78 | 3.58 | 43.1 | 43.3 | 43.120.22 | 42.5 | True |
| ESO 434- G 040 | True | True | True | True | False | False | False | 146.91732 | -30.94873 | 0.00849 | 37.8 | 1.00 | 3.25 | 43.3 | 43.4 | 43.480.04 | 43.2 | True |
| MRK 1239 | True | True | True | False | False | False | False | 148.07959 | -1.61207 | 0.01960 | 88.0 | 1.05 | 2.70 | 44.2 | 44.2 | 44.120.07 | 43.2 | True |
| NGC 3094 | True | True | False | True | False | False | False | 150.35809 | 15.77007 | 0.00802 | 38.5 | 1.66 | 2.57 | 43.3 | 43.5 | 43.660.04 | … | True |
| WN 1 | False | True | True | False | False | False | False | 150.50023 | -8.16157 | 0.01524 | 68.2 | 0.72 | 3.97 | 41.8 | 42.2 | 41.850.22 | … | True |
| CGCG 064-055 | True | True | True | True | False | False | False | 151.46330 | 12.96130 | 0.00937 | 41.8 | 1.22 | 3.52 | 42.4 | 42.7 | 42.480.22 | … | True |
| NGC 3227 | True | True | True | True | False | False | False | 155.87741 | 19.86505 | 0.00386 | 20.6 | 0.71 | 3.47 | 42.7 | 42.8 | 42.410.10 | 42.3 | True |
| CGCG 009-034 | True | True | True | True | False | False | False | 156.58807 | 0.68493 | 0.02150 | 96.7 | 0.95 | 3.29 | 43.2 | 43.3 | 43.130.22 | … | True |
| NGC 3256 | True | True | False | True | False | True | True | 156.96362 | -43.90375 | 0.00941 | 37.4 | 0.79 | 4.75 | 43.3 | 44.0 | 43.810.57 | … | False |
| ESO 317- G 041 | True | False | False | False | False | False | False | 157.84633 | -42.06061 | 0.01932 | 86.8 | 0.87 | 3.36 | 43.4 | 43.6 | 43.310.57 | 43.3 | True |
| UGC 05713 | True | True | False | True | False | False | False | 157.91206 | 25.98392 | 0.02101 | 94.5 | 0.88 | 3.04 | 43.1 | 43.2 | 42.980.22 | … | True |
| NGC 3281 | True | True | False | True | False | False | False | 157.96704 | -34.85369 | 0.01067 | 47.6 | 1.46 | 3.36 | 43.3 | 43.7 | 43.520.04 | 43.1 | True |
| ESO 568- G 021 | True | True | True | True | False | False | False | 160.31317 | -21.02300 | 0.01209 | 54.0 | 0.72 | 3.15 | 42.2 | 42.2 | 41.900.22 | … | True |
| NGC 3516 | True | True | True | False | False | False | False | 166.69788 | 72.56858 | 0.00883 | 51.0 | 0.74 | 2.83 | 43.5 | 43.4 | 43.220.22 | 43.0 | True |
| IRAS 11215-2806 | True | True | False | True | False | False | False | 171.01137 | -28.38767 | 0.01376 | 61.5 | 1.52 | 3.61 | 42.7 | 43.2 | 43.000.22 | … | True |
| MRK 0040 | False | True | True | False | False | False | False | 171.40066 | 54.38255 | 0.02069 | 93.0 | 0.80 | 2.45 | 43.1 | 42.9 | 42.670.22 | 43.0 | True |
| NGC 3690 NED02 | False | False | False | False | False | True | True | 172.14004 | 58.56292 | 0.01046 | 46.6 | 1.03 | 4.66 | 43.1 | 43.9 | 43.260.19 | 39.7 | False |
| NGC 3783 | True | True | True | False | False | False | False | 174.75734 | -37.73867 | 0.00970 | 47.8 | 1.01 | 3.18 | 43.5 | 43.7 | 43.670.03 | 43.5 | True |
| CGCG 068-036 | True | True | True | True | False | False | False | 175.57032 | 14.06660 | 0.02074 | 93.2 | 1.01 | 3.54 | 42.9 | 43.2 | 43.030.22 | … | True |
| UGC 06728 | True | True | True | False | False | False | False | 176.31676 | 79.68151 | 0.00652 | 29.0 | 0.71 | 2.72 | 42.2 | 42.1 | 41.730.22 | 41.8 | True |
| NGC 4051 | True | True | True | False | False | False | False | 180.79006 | 44.53133 | 0.00233 | 13.3 | 0.91 | 3.39 | 42.2 | 42.4 | 42.390.04 | 41.6 | True |
| NGC 4151 | True | True | True | False | False | False | False | 182.63574 | 39.40573 | 0.00331 | 5.4 | 0.82 | 2.72 | 42.3 | 42.2 | 42.050.07 | 41.5 | True |
| NGC 4253 | True | True | True | False | False | False | False | 184.61046 | 29.81287 | 0.01271 | 56.8 | 0.91 | 3.51 | 43.3 | 43.5 | 43.330.22 | 42.7 | True |
| TOLOLO 1220+051 | False | True | False | True | False | True | True | 185.81890 | 4.83614 | 0.01784 | 80.0 | 0.82 | 4.55 | 41.1 | 41.7 | 41.070.57 | … | False |
| NGC 4388 | True | True | True | True | False | False | False | 186.44478 | 12.66209 | 0.00849 | 18.1 | 1.01 | 3.42 | 42.4 | 42.7 | 42.260.07 | 42.4 | True |
| NGC 4395 | True | True | True | True | True | False | True | 186.45359 | 33.54693 | 0.00106 | 4.3 | 0.79 | 3.23 | 39.7 | 39.8 | 39.720.08 | 40.4 | True |
| NGC 4355 | True | True | False | True | True | False | False | 186.72758 | -0.87761 | 0.00708 | 23.6 | 1.26 | 5.62 | 42.0 | 43.2 | 43.380.05 | … | False |
| NGC 4507 | True | True | True | True | False | False | False | 188.90263 | -39.90926 | 0.01180 | 52.7 | 1.08 | 3.16 | 43.5 | 43.7 | 43.710.04 | 43.5 | True |
| IC 3599 | False | True | True | True | False | True | False | 189.42168 | 26.70766 | 0.02076 | 93.3 | 0.97 | 2.69 | 43.1 | 43.0 | 42.600.57 | … | True |
| NGC 4593 | True | True | True | False | False | False | False | 189.91427 | -5.34426 | 0.00900 | 31.9 | 0.74 | 3.01 | 43.0 | 42.9 | 42.840.07 | 42.6 | True |
| IC 3639 | True | True | True | True | False | False | False | 190.22022 | -36.75586 | 0.01098 | 49.0 | 0.87 | 4.27 | 43.0 | 43.5 | 43.440.04 | 43.7 | True |
| NGC 4628 | True | True | False | True | False | False | False | 190.60525 | -6.97100 | 0.00943 | 44.8 | 0.79 | 3.50 | 42.9 | 43.1 | 42.900.22 | … | True |
| 2MASX J12423600+7807203 | True | True | True | True | False | False | False | 190.65014 | 78.12230 | 0.02210 | 99.4 | 0.72 | 3.13 | 43.1 | 43.2 | 42.940.22 | … | True |
| NGC 4945 | True | True | False | True | False | False | False | 196.36449 | -49.46821 | 0.00188 | 3.8 | 1.27 | 3.88 | 41.6 | 42.1 | 39.990.12 | 41.4 | True |
| ESO 323- G 077 | True | True | True | True | False | False | False | 196.60885 | -40.41467 | 0.01501 | 67.2 | 0.83 | 2.72 | 44.0 | 43.9 | 43.670.09 | 42.9 | True |
| NGC 4968 | True | True | False | True | False | False | False | 196.77492 | -23.67703 | 0.00985 | 43.9 | 0.89 | 4.00 | 42.8 | 43.2 | 43.030.22 | … | True |
| 2MASX J13084201-2422581 | False | True | False | True | False | False | False | 197.17529 | -24.38308 | 0.01400 | 62.6 | 1.20 | 4.51 | 42.5 | 43.2 | 43.030.22 | … | False |
| 2MASX J13201354+0754279 | False | True | False | True | False | False | False | 200.05655 | 7.90781 | 0.02169 | 97.6 | 0.71 | 3.39 | 42.4 | 42.6 | 42.290.22 | … | True |
| MCG -03-34-064 | True | True | True | True | False | False | False | 200.60190 | -16.72846 | 0.01692 | 75.8 | 1.43 | 3.90 | 43.5 | 44.1 | 43.960.05 | 43.5 | True |
| NGC 5135 | True | True | True | True | False | True | False | 201.43358 | -29.83367 | 0.01371 | 61.3 | 0.73 | 3.94 | 43.4 | 43.8 | 43.170.08 | 43.1 | True |
| ESO 383- G 018 | True | True | True | True | False | True | False | 203.35875 | -34.01478 | 0.01285 | 57.4 | 1.31 | 3.07 | 43.2 | 43.4 | 43.120.57 | 42.8 | True |
| ESO 383- G 035 | True | True | True | False | False | False | False | 203.97378 | -34.29554 | 0.00758 | 33.7 | 0.92 | 2.83 | 43.1 | 43.1 | 43.060.07 | 42.8 | True |
| UM 595 | False | True | True | False | False | True | True | 204.56407 | -0.39855 | 0.02204 | 99.2 | 0.85 | 3.71 | 42.0 | 42.3 | 41.810.57 | … | True |
| MRK 0796 | True | True | False | True | False | True | True | 206.70605 | 14.40047 | 0.02156 | 97.0 | 0.91 | 3.69 | 43.4 | 43.7 | 43.420.57 | … | True |
| 2MASS J13473599-6037037 | False | True | True | False | False | False | False | 206.89981 | -60.61772 | 0.01290 | 57.7 | 1.07 | 2.95 | 43.3 | 43.4 | 43.250.22 | 43.3 | True |
| IC 4329A | True | True | True | False | False | False | False | 207.33028 | -30.30944 | 0.01613 | 72.3 | 1.09 | 2.83 | 44.2 | 44.2 | 44.260.04 | 43.9 | True |
| 2MASX J13512953-1813468 | True | True | True | False | False | False | False | 207.87292 | -18.22972 | 0.01222 | 54.6 | 0.68 | 2.07 | 42.8 | 42.3 | 42.030.22 | 42.6 | True |
| NGC 5347 | True | True | True | True | False | False | False | 208.32431 | 33.49083 | 0.00790 | 21.2 | 1.05 | 3.83 | 42.1 | 42.5 | 42.570.04 | 42.1 | True |
| CGCG 074-129 | True | True | True | True | True | False | False | 212.67229 | 13.55800 | 0.01622 | 72.7 | 0.94 | 4.12 | 42.8 | 43.3 | 42.910.57 | … | True |
| Circinus Galaxy | False | True | True | True | False | False | False | 213.29146 | -65.33922 | 0.00145 | 4.2 | 0.79 | 3.80 | 43.1 | 43.4 | 42.640.05 | 42.3 | True |
| NGC 5506 | True | True | True | True | False | False | False | 213.31205 | -3.20758 | 0.00618 | 24.7 | 1.16 | 2.49 | 43.4 | 43.3 | 43.200.03 | 42.9 | True |
| NGC 5548 | True | True | True | False | False | False | False | 214.49806 | 25.13679 | 0.01672 | 75.0 | 0.81 | 2.80 | 43.6 | 43.5 | 43.320.21 | 43.1 | True |
| NGC 5610 | True | True | True | True | False | False | True | 216.09558 | 24.61413 | 0.01689 | 75.7 | 0.73 | 3.51 | 43.2 | 43.4 | 43.060.57 | 42.7 | True |
| 2MASX J14320869-2704324 | True | True | True | False | False | False | False | 218.03625 | -27.07561 | 0.01443 | 64.6 | 0.78 | 3.44 | 42.7 | 42.8 | 42.590.22 | … | True |
| NGC 5643 | True | True | True | True | False | False | False | 218.16977 | -44.17441 | 0.00400 | 10.4 | 0.65 | 3.99 | 41.8 | 42.1 | 41.920.10 | 42.0 | True |
| MRK 1388 | True | True | True | True | False | False | False | 222.65772 | 22.73434 | 0.02095 | 94.2 | 1.13 | 3.42 | 43.1 | 43.4 | 43.250.22 | … | True |
| WKK 4438 | True | True | True | False | False | False | False | 223.82254 | -51.57083 | 0.01600 | 71.7 | 0.82 | 3.35 | 43.1 | 43.3 | 43.060.22 | 42.8 | True |
| IC 4518A | False | True | False | True | False | False | False | 224.42158 | -43.13211 | 0.01630 | 73.0 | 1.23 | 3.49 | 43.2 | 43.6 | 43.500.06 | 42.7 | True |
| NGC 5861 | True | True | False | True | False | True | False | 227.31704 | -11.32167 | 0.00624 | 25.7 | 1.26 | 4.01 | 42.0 | 42.6 | 42.080.57 | … | True |
| IC 4553 | True | True | False | True | True | True | False | 233.73856 | 23.50314 | 0.01813 | 81.3 | 0.75 | 4.74 | 43.3 | 44.0 | 43.760.57 | … | False |
| NGC 5990 | True | True | False | True | False | False | True | 236.56816 | 2.41542 | 0.01228 | 54.9 | 0.79 | 3.44 | 43.4 | 43.6 | 43.290.57 | … | True |
| IRAS 15514-3729 | True | True | False | True | False | True | False | 238.69479 | -37.63867 | 0.01916 | 86.0 | 0.79 | 3.11 | 43.1 | 43.2 | 42.820.57 | … | True |
| WKK 6092 | True | True | True | False | False | False | False | 242.96421 | -60.63194 | 0.01564 | 70.0 | 0.72 | 2.39 | 43.2 | 42.9 | 42.640.22 | 42.4 | True |
| ESO 138- G 001 | True | True | False | True | False | False | False | 252.83386 | -59.23478 | 0.00914 | 40.7 | 1.24 | 3.48 | 43.2 | 43.6 | 43.580.02 | 44.1 | True |
| ESO 044- G 007 | True | True | False | True | False | False | False | 258.97996 | -73.34211 | 0.01693 | 75.9 | 0.71 | 3.26 | 42.6 | 42.7 | 42.400.22 | … | True |
| NGC 6300 | True | True | False | True | False | False | False | 259.24779 | -62.82056 | 0.00370 | 12.6 | 1.07 | 3.37 | 42.1 | 42.4 | 42.230.08 | 41.6 | True |
| 2MASS J17372838-2908021 | False | True | True | False | False | False | False | 264.36813 | -29.13403 | 0.02140 | 96.3 | 0.78 | 2.58 | 43.7 | 43.6 | 43.380.22 | 43.9 | True |
| ESO 139- G 012 | True | True | False | True | False | False | False | 264.41283 | -59.94072 | 0.01702 | 76.3 | 0.67 | 2.63 | 43.3 | 43.1 | 42.850.22 | 42.6 | True |
| IC 4709 | True | True | False | True | False | False | False | 276.08079 | -56.36917 | 0.01690 | 75.8 | 0.90 | 3.11 | 43.1 | 43.1 | 42.920.22 | 43.1 | True |
| 2MASX J18263239+3251300 | False | True | False | True | False | False | False | 276.63498 | 32.85834 | 0.02200 | 99.0 | 0.70 | 2.73 | 42.9 | 42.7 | 42.470.22 | 43.0 | True |
| FAIRALL 0049 | True | True | True | True | False | False | False | 279.24288 | -59.40239 | 0.02002 | 90.0 | 1.03 | 2.91 | 44.0 | 44.1 | 43.950.20 | 43.4 | True |
| ESO 103- G 035 | True | True | True | True | False | False | False | 279.58475 | -65.42756 | 0.01330 | 59.5 | 1.57 | 3.75 | 43.2 | 43.8 | 43.710.19 | 43.4 | True |
| ESO 140- G 043 | True | True | True | False | False | False | False | 281.22492 | -62.36483 | 0.01418 | 63.4 | 0.87 | 2.82 | 43.7 | 43.6 | 43.670.04 | 43.1 | True |
| IC 4769 | True | True | False | True | False | False | False | 281.93354 | -63.15700 | 0.01512 | 67.7 | 0.85 | 3.87 | 43.1 | 43.4 | 43.260.22 | … | True |
| ESO 281- G 038 | True | True | True | False | False | False | False | 284.08738 | -43.14686 | 0.01667 | 74.7 | 0.90 | 2.51 | 43.1 | 43.0 | 42.750.22 | … | True |
| UGC 11397 | True | True | False | True | False | False | False | 285.95479 | 33.84469 | 0.01509 | 67.6 | 0.67 | 2.95 | 42.9 | 42.9 | 42.630.22 | 42.6 | True |
| 2MASX J19373299-0613046 | True | True | True | False | False | False | False | 294.38754 | -6.21800 | 0.01031 | 46.0 | 0.83 | 3.45 | 43.2 | 43.4 | 43.200.22 | 42.8 | True |
| ESO 339- G 011 | True | True | False | True | False | False | False | 299.40658 | -37.93564 | 0.01947 | 87.4 | 0.68 | 4.32 | 43.3 | 43.8 | 43.650.22 | … | False |
| NGC 6860 | True | True | True | False | False | False | False | 302.19538 | -61.10019 | 0.01525 | 68.3 | 0.94 | 2.50 | 43.7 | 43.6 | 43.460.05 | 43.2 | True |
| 2MASX J20183871+4041003 | False | True | False | True | False | False | False | 304.66133 | 40.68339 | 0.01420 | 63.5 | 0.81 | 2.96 | 43.1 | 43.1 | 42.850.22 | 42.6 | True |
| IC 4995 | True | True | True | True | False | False | False | 304.99571 | -52.62197 | 0.01646 | 73.8 | 0.71 | 3.62 | 43.0 | 43.3 | 43.050.22 | … | True |
| MCG +04-48-002 | True | True | True | True | False | False | False | 307.14608 | 25.73333 | 0.01390 | 62.2 | 0.69 | 4.14 | 43.2 | 43.6 | 43.450.22 | 43.2 | True |
| ESO 234- G 050 | True | True | True | False | False | True | False | 308.99117 | -50.19225 | 0.00877 | 39.1 | 0.77 | 3.50 | 42.3 | 42.5 | 42.040.57 | 41.6 | True |
| IC 5063 | True | True | True | True | False | False | False | 313.00975 | -57.06878 | 0.01140 | 50.9 | 1.30 | 4.02 | 43.2 | 43.8 | 43.800.03 | 43.1 | True |
| 2MASX J21025564+6336248 | True | False | False | False | True | True | False | 315.73179 | 63.60686 | 0.01099 | 49.1 | 0.94 | 2.56 | 42.7 | 42.6 | 41.660.23 | … | True |
| IC 1368 | True | True | False | True | False | False | False | 318.55246 | 2.17800 | 0.01305 | 58.3 | 0.84 | 3.62 | 42.8 | 43.1 | 42.830.22 | … | True |
| UGC 11717 | True | False | False | False | True | False | False | 319.64713 | 19.71813 | 0.02102 | 94.5 | 0.69 | 2.85 | 43.3 | 43.2 | 42.440.23 | … | True |
| 4C +50.55 | False | True | True | False | False | False | False | 321.16354 | 50.97328 | 0.02000 | 89.9 | 0.89 | 2.37 | 43.6 | 43.4 | 43.190.22 | 44.0 | True |
| IRAS 21262+5643 | False | True | True | False | False | False | False | 321.93914 | 56.94303 | 0.01440 | 64.4 | 0.99 | 2.81 | 43.5 | 43.5 | 43.330.22 | 43.1 | True |
| NGC 7130 | True | True | True | True | True | True | False | 327.08133 | -34.95124 | 0.01620 | 72.6 | 0.73 | 4.30 | 43.3 | 43.8 | 43.220.08 | 42.2 | False |
| NGC 7172 | True | True | True | True | False | True | False | 330.50788 | -31.86967 | 0.00863 | 33.9 | 0.84 | 2.44 | 43.2 | 43.0 | 42.800.04 | 42.7 | True |
| NGC 7314 | True | True | True | True | False | False | False | 338.94246 | -26.05047 | 0.00477 | 17.3 | 0.70 | 3.09 | 42.0 | 42.0 | 41.740.08 | 42.2 | True |
| NGC 7378 | True | True | False | True | False | False | False | 341.94875 | -11.81664 | 0.00850 | 29.6 | 0.70 | 2.76 | 42.1 | 42.0 | 41.660.22 | … | True |
| NGC 7469 | True | True | True | False | False | False | False | 345.81510 | 8.87400 | 0.01631 | 73.1 | 0.79 | 3.91 | 43.9 | 44.2 | 43.890.04 | 43.2 | True |
| NGC 7479 | True | True | True | True | True | False | False | 346.23604 | 12.32289 | 0.00793 | 27.7 | 1.34 | 3.89 | 42.5 | 43.1 | 43.200.06 | 41.9 | True |
| NGC 7552 | True | True | True | False | True | True | False | 349.04483 | -42.58474 | 0.00535 | 11.2 | 0.79 | 4.44 | 42.4 | 42.9 | 41.41 | 39.7 | False |
| NGC 7582 | True | True | True | True | False | False | False | 349.59792 | -42.37056 | 0.00525 | 22.2 | 0.93 | 3.18 | 43.2 | 43.3 | 42.810.07 | 43.5 | True |
| IC 1495 | True | True | True | True | False | False | False | 352.69892 | -13.48544 | 0.02119 | 95.3 | 0.77 | 3.13 | 43.1 | 43.2 | 42.970.22 | … | True |
| IC 1490 | True | True | True | False | False | False | False | 359.79467 | -4.12700 | 0.01858 | 83.4 | 0.75 | 2.77 | 43.4 | 43.3 | 43.110.22 | … | True |
– Notes: (1) object name, mostly following NED nomenclature; (2) flag whether the galaxy is in 2MRS; (3), (4), (5), (6), (7) (8) flags whether galaxy has Seyfert, Sy 1, Sy 2, LINER, H II or starburst classification, respectively; (9) and (10) equatorial coordinates of the object centre in J2000 in degrees; (11) redshift; (12) object distance in Mpc; (13) and (14) WISE W1-W2 and W2-W3 colours; (15) and (16) observed W1 and W3 continuum luminosities , calculated from the selected distance and the profile-fitting magnitudes. (17) nuclear luminosity of the AGN either taken from Asmus et al. (2014), if uncertainty dex, or estimated from and optical type (see Sect. 4.1 for details); (18) intrinsic 2-10 keV X-ray luminosity for AGN from the BAT70 sample (Ricci et al., 2017), and from Asmus et al. (2015) otherwise, where available; (19) flag whether the source fulfils the S18 criterion or not (see Sect. 4.4.1 for details);
| in | |||||||||||||
|---|---|---|---|---|---|---|---|---|---|---|---|---|---|
| Name | 2MRS | H II | starburst | RA | DEC | z | D | W1-W2 | W2-W3 | (W1) | (W3) | () | S18 |
| [∘] | [∘] | [Mpc] | [mag] | [mag] | [erg/s] | [erg/s] | [erg/s] | ||||||
| (1) | (2) | (3) | (4) | (5) | (6) | (7) | (8) | (9) | (10) | (11) | (12) | (13) | (14) |
| 2MASX J00042025+3120313 | False | False | False | 1.08440 | 31.34204 | 0.01692 | 75.8 | 1.14 | 4.02 | 42.5 | 43.0 | 42.640.57 | True |
| ESO 409-IG 015 | False | False | False | 1.38273 | -28.09818 | 0.00244 | 8.2 | 0.83 | 3.88 | 39.4 | 39.8 | 38.810.57 | True |
| HS 0017+1055 | False | False | False | 5.08917 | 11.20583 | 0.01885 | 84.6 | 1.27 | 4.70 | 41.1 | 41.9 | 41.370.57 | False |
| 2MASS J00203545-2751440 | False | False | False | 5.14779 | -27.86225 | 0.02079 | 93.5 | 0.69 | 2.88 | 41.9 | 41.8 | 41.230.57 | True |
| UGC 00521 | False | False | False | 12.80075 | 12.02525 | 0.00226 | 33.0 | 0.66 | 1.97 | 40.8 | 40.3 | 39.440.57 | True |
| MCG +12-02-001 | True | False | False | 13.51664 | 73.08485 | 0.01576 | 70.6 | 0.65 | 4.82 | 43.3 | 44.0 | 43.740.57 | False |
| UM 296 | False | True | True | 14.76710 | 1.00119 | 0.01782 | 79.9 | 0.93 | 3.89 | 42.0 | 42.4 | 41.440.23 | True |
| MCG -01-03-072 | False | False | False | 15.59546 | -4.50859 | 0.00584 | 25.9 | 1.54 | 3.52 | 39.4 | 39.9 | 38.960.57 | True |
| SDSS J011136.95+001621.7 | False | False | True | 17.90399 | 0.27270 | 0.00628 | 27.9 | 1.04 | 3.39 | 39.8 | 40.0 | 38.500.23 | True |
| GALEXASC J011551.69-393638.8 | False | False | False | 18.96581 | -39.61122 | 0.02197 | 98.9 | 1.21 | 2.48 | 41.1 | 41.1 | 40.330.57 | True |
| UGC 00819 | False | False | False | 19.00258 | 6.63703 | 0.00806 | 28.5 | 0.74 | 2.92 | 40.4 | 40.4 | 39.500.57 | True |
| NGC 0520 | True | False | False | 21.14613 | 3.79242 | 0.00756 | 23.9 | 0.65 | 4.39 | 42.5 | 43.0 | 42.620.57 | False |
| 2MASS J01290606+5511020 | False | False | False | 22.27538 | 55.18392 | 0.01836 | 82.4 | 1.31 | 3.35 | 42.4 | 42.7 | 42.260.57 | True |
| GALEXASC J013121.37+284812.1 | False | True | False | 22.83875 | 28.80333 | 0.01613 | 72.3 | 0.83 | 5.10 | 41.3 | 42.1 | 41.100.23 | False |
| LSBC F613-V05 | False | False | False | 28.48752 | 13.46764 | 0.02068 | 93.0 | 1.05 | 3.49 | 41.7 | 42.0 | 41.470.57 | True |
| GALEXASC J020645.07-365655.2 | False | False | False | 31.68796 | -36.94894 | 0.02064 | 92.8 | 1.77 | 3.43 | 42.4 | 43.0 | 42.590.57 | True |
| KUG 0204-106 | False | False | False | 31.81279 | -10.40844 | 0.01863 | 83.6 | 0.75 | 4.57 | 41.4 | 42.0 | 41.430.57 | False |
| GALEXASC J020827.99+322705.6 | False | False | False | 32.11708 | 32.45139 | 0.01682 | 75.4 | 1.39 | 4.86 | 41.0 | 42.0 | 41.430.57 | False |
| NGC 0814 | True | True | False | 32.65679 | -15.77358 | 0.00539 | 24.0 | 0.68 | 4.88 | 41.6 | 42.4 | 41.370.23 | False |
| GALEXASC J021131.52+241253.8 | False | False | False | 32.88167 | 24.21500 | 0.00930 | 41.5 | 1.05 | 3.92 | 40.3 | 40.8 | 39.980.57 | True |
| MRK 1039 | False | True | False | 36.89054 | -10.16493 | 0.00704 | 20.0 | 0.94 | 5.20 | 40.9 | 41.8 | 40.700.23 | False |
| AM 0234-652 | False | False | False | 38.84271 | -65.26039 | 0.01930 | 86.7 | 1.26 | 3.45 | 42.6 | 43.0 | 42.600.57 | True |
| SDSS J023850.49+272159.0 | False | False | False | 39.70833 | 27.36556 | 0.00489 | 21.7 | 0.71 | 2.55 | 40.3 | 40.1 | 39.180.57 | True |
| SHOC 137 | False | True | True | 42.06638 | -8.28792 | 0.00458 | 20.3 | 0.74 | 4.70 | 40.1 | 40.7 | 39.390.23 | False |
| NGC 1377 | True | True | False | 54.16283 | -20.90225 | 0.00591 | 23.4 | 1.99 | 3.70 | 42.1 | 42.8 | 41.990.23 | True |
| FCOS 4-2106 | False | False | False | 54.37321 | -34.99769 | 0.02193 | 98.7 | 1.29 | 3.01 | 41.1 | 41.3 | 40.640.57 | True |
| SBS 0335-052 | False | True | True | 54.43359 | -5.04450 | 0.01350 | 60.4 | 1.99 | 4.85 | 41.3 | 42.5 | 41.530.23 | False |
| IRAS 03337+6725 | False | False | False | 54.60490 | 67.59092 | 0.00478 | 21.2 | 0.75 | 5.11 | 40.4 | 41.3 | 40.560.57 | False |
| 6dF J0356565-352240 | False | False | False | 59.23550 | -35.37783 | 0.02218 | 99.8 | 0.90 | 3.54 | 41.3 | 41.6 | 40.950.57 | True |
| 6dF J0358492-413530 | False | False | False | 59.70479 | -41.59161 | 0.02130 | 95.8 | 0.81 | 4.19 | 41.7 | 42.1 | 41.580.57 | True |
| 6dF J0410497-272959 | False | False | False | 62.70733 | -27.49978 | 0.01192 | 53.2 | 1.09 | 3.12 | 40.5 | 40.6 | 39.800.57 | True |
| 2MASS J04111822-2314422 | False | False | False | 62.82596 | -23.24511 | 0.00539 | 24.0 | 0.75 | 3.05 | 40.6 | 40.6 | 39.780.57 | True |
| 2MASS J04211939-3138045 | False | False | False | 65.33075 | -31.63458 | 0.00851 | 37.9 | 1.13 | 2.69 | 41.8 | 41.8 | 41.210.57 | True |
| FGC 0483 | False | False | False | 66.31421 | 4.98758 | 0.01653 | 74.1 | 0.79 | 2.69 | 42.1 | 42.0 | 41.370.57 | True |
| 2MASX J04275677+4050536 | False | False | False | 66.98663 | 40.84825 | 0.01963 | 88.2 | 1.77 | 3.89 | 42.3 | 43.0 | 42.610.57 | True |
| IRAS 04277+5918B | False | False | False | 68.00985 | 59.40909 | 0.01524 | 68.2 | 1.45 | 3.15 | 42.6 | 42.9 | 42.530.57 | True |
| UGC 03097 | True | True | False | 68.95154 | 2.25805 | 0.01197 | 53.5 | 1.54 | 4.25 | 42.3 | 43.1 | 42.240.23 | True |
| 2MASX J04355886+4743034 | False | False | False | 68.99550 | 47.71747 | 0.02158 | 97.1 | 1.09 | 3.70 | 43.2 | 43.6 | 43.270.57 | True |
| UGC 03147 | True | False | False | 71.95737 | 72.86006 | 0.00963 | 47.1 | 0.84 | 4.61 | 42.2 | 42.9 | 42.470.57 | False |
| 2MASX J04483527-0449105 | False | False | False | 72.14696 | -4.81958 | 0.01590 | 71.2 | 1.78 | 3.57 | 42.4 | 43.0 | 42.630.57 | True |
| 2MASS J04505295-3556304 | False | False | False | 72.72067 | -35.94178 | 0.01759 | 78.9 | 1.30 | 4.35 | 42.3 | 43.0 | 42.620.57 | True |
| 2MASS J05150251-2624114 | False | False | False | 78.76042 | -26.40300 | 0.01330 | 59.4 | 0.67 | 3.90 | 41.6 | 41.9 | 41.290.57 | True |
| IRAS 05321+3205 | False | False | False | 83.83745 | 32.11793 | 0.00909 | 40.5 | 1.40 | 2.73 | 41.7 | 41.9 | 41.280.57 | True |
| MCG +08-11-002 | True | False | False | 85.18212 | 49.69486 | 0.01916 | 86.0 | 0.68 | 4.26 | 43.3 | 43.7 | 43.470.57 | True |
| NGC 2087 | True | False | False | 86.06679 | -55.53244 | 0.01491 | 66.7 | 0.69 | 4.41 | 42.5 | 43.1 | 42.680.57 | False |
| 2MASX J05521634-8123257 | False | True | False | 88.06846 | -81.39042 | 0.01285 | 57.4 | 0.83 | 4.39 | 42.3 | 42.9 | 42.020.23 | False |
| UGCA 116 | False | True | False | 88.92750 | 3.39222 | 0.00265 | 10.3 | 1.40 | 5.49 | 40.8 | 42.0 | 40.980.23 | False |
| IC 2153 | False | True | False | 90.02158 | -33.91975 | 0.00956 | 42.6 | 0.66 | 4.85 | 41.8 | 42.5 | 41.570.23 | False |
| UGC 03435 | True | False | False | 96.23817 | 82.31846 | 0.01440 | 64.4 | 0.75 | 4.07 | 42.9 | 43.3 | 43.000.57 | True |
| ESO 308-IG 015 | False | True | False | 98.79371 | -41.56119 | 0.01700 | 76.2 | 0.93 | 5.05 | 41.6 | 42.5 | 41.560.23 | False |
| 2MASX J06463429+6336323 | False | True | False | 101.64400 | 63.60909 | 0.01890 | 84.9 | 0.96 | 4.82 | 42.1 | 42.9 | 42.090.23 | False |
| ESO 256-IG 009 | False | False | False | 104.13942 | -45.17725 | 0.01412 | 63.2 | 0.91 | 4.91 | 41.8 | 42.6 | 42.180.57 | False |
| HIZSS 003B | False | False | False | 105.10227 | -4.22013 | 0.00100 | 4.4 | 0.86 | 4.02 | 38.6 | 39.1 | 37.980.57 | True |
| HIZOA J0701-07 | False | False | False | 105.60745 | -7.31115 | 0.00584 | 25.9 | 0.74 | 6.04 | 40.7 | 41.8 | 41.250.57 | False |
| HIZOA J0705+02 | False | False | False | 106.40715 | 2.63388 | 0.00582 | 25.9 | 0.86 | 4.09 | 40.9 | 41.3 | 40.650.57 | True |
| IRAS 07155-2215 | False | False | False | 109.40867 | -22.35272 | 0.00940 | 41.9 | 0.67 | 4.84 | 42.2 | 42.9 | 42.530.57 | False |
| ESO 257- G 006 | False | False | False | 109.78892 | -44.28869 | 0.01214 | 54.2 | 0.71 | 3.06 | 42.4 | 42.4 | 41.860.57 | True |
| ESO 163- G 007 | False | False | False | 113.78563 | -55.28668 | 0.00994 | 44.3 | 1.16 | 3.16 | 40.8 | 41.1 | 40.320.57 | True |
| CGCG 058-009 | True | True | False | 113.93072 | 11.70932 | 0.01625 | 72.8 | 1.28 | 3.61 | 43.0 | 43.4 | 42.680.23 | True |
| 2MASX J08100697+1838176 | False | True | False | 122.52917 | 18.63836 | 0.01626 | 72.9 | 1.31 | 4.65 | 42.6 | 43.5 | 42.750.23 | False |
| ESO 495- G 005 | True | False | False | 124.81142 | -25.18797 | 0.00557 | 24.8 | 1.23 | 3.52 | 42.8 | 43.2 | 42.830.57 | True |
| UGC 04459 | False | False | False | 128.53000 | 66.18167 | 0.00005 | 3.6 | 1.36 | 3.72 | 38.5 | 39.0 | 37.940.57 | True |
| CGCG 331-070 | True | False | False | 133.21858 | 72.92656 | 0.01262 | 56.4 | 0.67 | 3.77 | 42.6 | 42.9 | 42.450.57 | True |
| ESO 060- G 019 | True | False | False | 134.36133 | -69.06008 | 0.00483 | 18.9 | 0.77 | 4.66 | 41.4 | 42.0 | 41.480.57 | False |
| ESO 090-IG 014 NED03 | True | False | False | 135.40533 | -64.27433 | 0.02204 | 99.2 | 0.84 | 3.89 | 43.2 | 43.6 | 43.320.57 | True |
| 2MASX J09224519-6845085 | False | False | False | 140.68842 | -68.75239 | 0.01176 | 52.5 | 1.19 | 4.66 | 41.5 | 42.3 | 41.750.57 | False |
| 2MASS J09315693+4248577 | False | False | True | 142.98707 | 42.81609 | 0.01444 | 64.6 | 1.13 | 4.45 | 41.4 | 42.1 | 41.060.23 | False |
| NGC 2964 | True | True | False | 145.72596 | 31.84739 | 0.00439 | 17.5 | 0.86 | 2.47 | 42.6 | 42.4 | 41.440.23 | True |
| UGC 05189 NED02 | False | True | True | 145.73644 | 9.47116 | 0.01085 | 48.4 | 1.29 | 5.02 | 41.1 | 42.1 | 41.110.23 | False |
| CGCG 007-025 | False | True | True | 146.00780 | -0.64227 | 0.00482 | 21.4 | 1.35 | 4.77 | 40.5 | 41.4 | 40.170.23 | False |
| 2MASS J09472215+0044270 | False | False | False | 146.84223 | 0.74081 | 0.02013 | 90.5 | 1.75 | 4.54 | 41.8 | 42.8 | 42.380.57 | False |
| CASG 46 | False | False | True | 149.76996 | 30.47364 | 0.02142 | 96.3 | 0.78 | 4.24 | 41.5 | 42.0 | 40.910.23 | True |
| 6dF J101101.7-144041 | False | False | False | 152.75864 | -14.67686 | 0.00786 | 35.0 | 2.05 | 4.03 | 41.5 | 42.4 | 41.960.57 | True |
| ESO 127- ?011 | True | False | False | 153.04942 | -62.53339 | 0.01147 | 51.2 | 0.67 | 4.80 | 43.1 | 43.8 | 43.540.57 | False |
| GALEXASC J101921.18-220835.0 | False | True | False | 154.83846 | -22.14306 | 0.01214 | 54.2 | 1.21 | 4.87 | 41.1 | 42.0 | 40.980.23 | False |
| 2MASS J10242019-2014571 | False | False | False | 156.08400 | -20.24931 | 0.01724 | 77.3 | 0.99 | 2.57 | 41.9 | 41.8 | 41.150.57 | True |
| SDSS J1044+0353 | False | True | True | 161.24082 | 3.88698 | 0.01287 | 57.5 | 1.00 | 4.88 | 40.6 | 41.4 | 40.250.23 | False |
| CTS 1020 | False | True | False | 161.93479 | -20.96350 | 0.01241 | 55.4 | 0.68 | 5.18 | 41.4 | 42.2 | 41.170.23 | False |
| ESO 264- G 050 | True | False | False | 163.61912 | -46.21150 | 0.01957 | 87.9 | 0.81 | 3.06 | 42.8 | 42.9 | 42.440.57 | True |
| CGCG 038-051 | False | True | True | 163.91321 | 2.39576 | 0.00341 | 21.7 | 0.75 | 4.28 | 40.1 | 40.6 | 39.170.23 | True |
| LCRS B111014.3-021907 | False | False | False | 168.19754 | -2.59083 | 0.00890 | 39.7 | 0.71 | 3.03 | 41.1 | 41.1 | 40.380.57 | True |
| ECO 1305 | False | True | True | 169.68633 | 2.90836 | 0.02033 | 91.4 | 0.96 | 4.48 | 41.2 | 41.9 | 40.790.23 | False |
| 2MASS J11225861-2601456 | False | False | False | 170.74417 | -26.02931 | 0.01176 | 52.5 | 1.04 | 2.95 | 41.9 | 42.0 | 41.400.57 | True |
| UGC 06433 | False | False | True | 171.38254 | 38.06058 | 0.00704 | 31.3 | 0.73 | 5.03 | 40.9 | 41.7 | 40.610.23 | False |
| NGC 3690 NED01 | True | True | True | 172.12925 | 58.56131 | 0.01022 | 45.6 | 1.50 | 3.59 | 43.7 | 44.2 | 43.680.21 | True |
| WISE J113858.90-380041.9 | False | False | False | 174.74546 | -38.01164 | 0.00896 | 39.9 | 1.29 | 2.98 | 40.9 | 41.1 | 40.350.57 | True |
| 6dF J115111.7-203557 | False | True | False | 177.79870 | -20.59890 | 0.01217 | 54.4 | 1.12 | 4.75 | 41.4 | 42.3 | 41.270.23 | False |
| UM 461 | False | True | False | 177.88896 | -2.37276 | 0.00352 | 15.6 | 0.75 | 4.88 | 39.9 | 40.7 | 39.310.23 | False |
| GALEXASC J115153.52-132447.1 | False | False | False | 177.97329 | -13.41311 | 0.00674 | 30.0 | 0.81 | 5.30 | 40.5 | 41.4 | 40.700.57 | False |
| MRK 0193 | False | True | True | 178.86808 | 57.66444 | 0.01726 | 77.4 | 1.46 | 4.69 | 41.4 | 42.4 | 41.380.23 | False |
| SHOC 357 | False | True | True | 180.34295 | 2.18564 | 0.00325 | 14.0 | 1.83 | 3.98 | 39.7 | 40.5 | 39.040.23 | True |
| ESO 380- G 027 | False | True | False | 186.44562 | -36.23353 | 0.00934 | 41.6 | 1.13 | 4.42 | 40.5 | 41.2 | 39.960.23 | False |
| MRK 0209 | False | True | True | 186.56539 | 48.49398 | 0.00100 | 5.7 | 0.66 | 4.45 | 39.3 | 39.8 | 38.260.23 | False |
| 2MASS J12265539+4242081 | False | False | False | 186.73081 | 42.70230 | 0.00890 | 39.7 | 0.86 | 4.20 | 40.7 | 41.2 | 40.530.57 | True |
| 2MASX J12294019-4007220 | False | False | False | 187.41742 | -40.12272 | 0.01044 | 46.6 | 0.76 | 4.80 | 41.4 | 42.1 | 41.490.57 | False |
| ESO 322-IG 021 | True | False | False | 187.56675 | -40.87131 | 0.01535 | 68.7 | 0.82 | 3.28 | 42.8 | 42.9 | 42.540.57 | True |
| SDSS J123529.26+504803.4 | False | False | False | 188.87419 | 50.80194 | 0.00028 | 1.2 | 0.94 | 3.11 | 37.2 | 37.3 | 35.880.57 | True |
| KUG 1243+265 | False | False | True | 191.54517 | 26.24915 | 0.00631 | 28.0 | 0.88 | 4.56 | 40.3 | 41.0 | 39.680.23 | False |
| HIPASS J1247-77 | False | False | False | 191.88805 | -77.58309 | 0.00138 | 3.2 | 1.63 | 3.79 | 37.8 | 38.4 | 37.180.57 | True |
| UGCA 307 | False | False | False | 193.48566 | -12.10540 | 0.00274 | 8.0 | 0.76 | 2.84 | 39.2 | 39.1 | 38.030.57 | True |
| WISE J125949.83-322328.8 | False | False | False | 194.95754 | -32.39136 | 0.01375 | 61.5 | 0.98 | 3.00 | 41.8 | 41.9 | 41.300.57 | True |
| LEDA 200293 | False | False | True | 194.99062 | 2.05030 | 0.00292 | 12.9 | 0.69 | 5.18 | 40.1 | 41.0 | 39.670.23 | False |
| GMP 1966 | False | False | False | 195.40133 | 28.15158 | 0.02007 | 90.2 | 1.52 | 3.15 | 42.0 | 42.3 | 41.830.57 | True |
| ESO 443- G 035 | False | False | False | 195.53371 | -29.21706 | 0.01313 | 58.7 | 0.79 | 4.26 | 41.3 | 41.8 | 41.210.57 | True |
| MCG -02-33-098W | False | True | False | 195.58120 | -15.76810 | 0.01610 | 72.1 | 0.68 | 4.81 | 42.8 | 43.5 | 42.740.23 | False |
| LEDA 045394 | False | False | False | 196.67681 | -12.07282 | 0.02085 | 93.7 | 0.79 | 4.78 | 41.2 | 41.9 | 41.350.57 | False |
| ESO 323-IG 083 | False | True | False | 196.83929 | -38.91215 | 0.01398 | 62.5 | 1.71 | 5.31 | 40.9 | 42.2 | 41.200.23 | False |
| LEDA 045469 | False | True | False | 196.90580 | -35.64330 | 0.01393 | 62.3 | 0.92 | 4.47 | 40.9 | 41.5 | 40.370.23 | False |
| SDSS J131447.36+345259.7 | False | True | True | 198.69736 | 34.88328 | 0.00288 | 12.8 | 0.98 | 4.97 | 39.9 | 40.8 | 39.450.23 | False |
| 2MASXi J1320008-195924 | False | False | False | 200.00350 | -19.99019 | 0.02049 | 92.1 | 0.67 | 4.25 | 41.7 | 42.1 | 41.550.57 | True |
| ESO 173- G 015 | True | False | False | 201.84908 | -57.48950 | 0.00974 | 43.4 | 0.88 | 4.51 | 43.0 | 43.7 | 43.380.57 | False |
| SDSS J132932.41+323417.0 | False | False | False | 202.38508 | 32.57142 | 0.01561 | 69.9 | 0.73 | 2.59 | 41.1 | 40.9 | 40.120.57 | True |
| ESO 383-IG 043 | False | True | False | 204.28460 | -32.92560 | 0.01209 | 54.0 | 1.21 | 4.78 | 40.9 | 41.8 | 40.680.23 | False |
| NGC 5253 | True | True | True | 204.98318 | -31.64011 | 0.00136 | 3.6 | 1.74 | 4.74 | 40.9 | 42.0 | 40.910.23 | False |
| NGC 5471 | False | True | False | 211.12283 | 54.39647 | 0.00098 | 4.3 | 0.70 | 4.83 | 39.4 | 40.1 | 38.650.23 | False |
| SDSS J141755.49+215534.2 | False | False | False | 214.48125 | 21.92619 | 0.01594 | 71.4 | 1.19 | 3.27 | 41.0 | 41.3 | 40.590.57 | True |
| UGC 09164 | False | False | False | 214.68007 | 21.81612 | 0.00877 | 39.1 | 0.68 | 4.91 | 40.7 | 41.4 | 40.710.57 | False |
| SBS 1420+544 | False | False | False | 215.66188 | 54.23589 | 0.02060 | 92.6 | 1.36 | 4.64 | 40.9 | 41.8 | 41.150.57 | False |
| PKS 1444-301 | False | False | False | 221.97243 | -30.30868 | 0.01600 | 71.7 | 1.08 | 2.86 | 42.3 | 42.3 | 41.840.57 | True |
| GLIMPSE:[JKK2007] G1 | False | False | False | 222.15000 | -60.12083 | 0.01522 | 68.1 | 0.73 | 3.90 | 42.5 | 42.8 | 42.400.57 | True |
| SBS 1533+574B | False | True | False | 233.55901 | 57.28430 | 0.01144 | 51.1 | 1.00 | 4.65 | 41.1 | 41.9 | 40.770.23 | False |
| MRK 0487 | False | True | True | 234.26740 | 55.26406 | 0.00218 | 15.0 | 0.96 | 4.49 | 40.4 | 41.1 | 39.810.23 | False |
| SBS 1543+593 | False | False | False | 236.08458 | 59.20672 | 0.00930 | 41.5 | 1.28 | 2.98 | 41.4 | 41.5 | 40.890.57 | True |
| 2MASX J15480728-4738187 | False | False | False | 237.03025 | -47.63864 | 0.02077 | 93.4 | 0.89 | 3.66 | 43.4 | 43.7 | 43.450.57 | True |
| SDSS J155320.20+420735.6 | False | False | False | 238.33416 | 42.12658 | 0.02164 | 97.4 | 1.09 | 3.10 | 41.2 | 41.3 | 40.650.57 | True |
| SDSS J162054.53+622558.1 | False | False | True | 245.22685 | 62.43331 | 0.01005 | 44.8 | 0.82 | 4.26 | 40.6 | 41.1 | 39.880.23 | True |
| 2MASX J16241633-2209314 | False | True | False | 246.06817 | -22.15883 | 0.01406 | 62.9 | 0.68 | 4.98 | 42.5 | 43.2 | 42.420.23 | False |
| WKK 6774 | False | False | False | 246.16450 | -56.33019 | 0.00891 | 39.7 | 1.08 | 3.91 | 42.3 | 42.8 | 42.380.57 | True |
| ESO 101- G 007 | True | False | False | 250.14123 | -67.45249 | 0.02202 | 99.1 | 0.90 | 3.26 | 43.1 | 43.3 | 42.930.57 | True |
| ESO 069- G 011 | True | False | False | 252.47550 | -71.20222 | 0.01722 | 77.2 | 0.94 | 3.19 | 42.6 | 42.8 | 42.320.57 | True |
| IC 4662 | True | False | False | 266.78830 | -64.63870 | 0.00101 | 2.3 | 0.66 | 4.78 | 39.4 | 40.0 | 39.110.57 | False |
| CGCG 055-018 | True | True | False | 267.27879 | 8.10275 | 0.02117 | 95.2 | 1.18 | 3.44 | 43.6 | 43.9 | 43.320.23 | True |
| MCG +03-45-037 | False | False | False | 267.84371 | 18.75218 | 0.01126 | 50.3 | 1.04 | 5.12 | 41.1 | 42.1 | 41.520.57 | False |
| 2MASX J18195279-4324572 | False | False | False | 274.96999 | -43.41578 | 0.01204 | 53.8 | 0.68 | 4.59 | 42.1 | 42.7 | 42.280.57 | False |
| ESO 338- G 008 | False | False | False | 292.55515 | -39.40985 | 0.00941 | 42.0 | 1.36 | 4.80 | 40.6 | 41.5 | 40.900.57 | False |
| 2MASX J19331434+4101056 | False | False | False | 293.30971 | 41.01822 | 0.01575 | 70.5 | 1.94 | 3.08 | 42.8 | 43.3 | 42.990.57 | True |
| 2MASXi J1937323+234438 | False | False | False | 294.38488 | 23.74394 | 0.01334 | 59.7 | 1.16 | 2.86 | 42.7 | 42.8 | 42.320.57 | True |
| IRAS 19402+0948 | False | False | False | 295.64750 | 9.92694 | 0.01722 | 77.2 | 1.00 | 3.84 | 42.4 | 42.8 | 42.400.57 | True |
| CGCG 324-002 | True | False | False | 296.52263 | 64.14714 | 0.01881 | 84.4 | 0.65 | 3.98 | 42.7 | 43.0 | 42.640.57 | True |
| AM 2040-620 | True | False | False | 311.04829 | -61.98875 | 0.01096 | 48.9 | 0.72 | 1.07 | 42.3 | 41.5 | 40.800.57 | True |
| GALEXASC J211258.71-462852.8 | False | False | False | 318.24550 | -46.48167 | 0.01710 | 76.7 | 0.99 | 3.01 | 41.3 | 41.4 | 40.720.57 | True |
| 2MASS J21212094-1317300 | False | False | False | 320.33738 | -13.29164 | 0.01111 | 49.6 | 1.08 | 2.41 | 41.4 | 41.3 | 40.590.57 | True |
| ESO 343-IG 013 NED02 | False | True | False | 324.04627 | -38.54250 | 0.01945 | 87.4 | 0.79 | 4.66 | 42.7 | 43.4 | 42.670.23 | False |
| 2MASX J21423859+4330562 | True | False | False | 325.66104 | 43.51581 | 0.01791 | 80.3 | 0.98 | 3.05 | 43.5 | 43.6 | 43.320.57 | True |
| 2MASS J22101082-5604285 | False | False | False | 332.54529 | -56.07483 | 0.01360 | 60.8 | 0.97 | 2.90 | 41.5 | 41.5 | 40.850.57 | True |
| GALEXASC J222611.41-282412.7 | False | False | False | 336.54784 | -28.40351 | 0.01553 | 69.6 | 0.74 | 2.69 | 41.4 | 41.2 | 40.490.57 | True |
| 2MASX J22263365-2917276 | False | False | False | 336.64013 | -29.29103 | 0.00342 | 15.2 | 1.01 | 2.75 | 40.9 | 40.8 | 40.060.57 | True |
| SDSS J223831.12+140029.7 | False | False | True | 339.62967 | 14.00827 | 0.02061 | 92.6 | 1.73 | 4.56 | 41.1 | 42.1 | 41.080.23 | False |
| FGC 2420 | False | False | False | 341.81000 | 75.75528 | 0.00518 | 37.2 | 2.46 | 1.83 | 40.9 | 41.1 | 40.330.57 | True |
| KUG 2251+110 | False | False | False | 343.42644 | 11.27555 | 0.00748 | 33.3 | 0.85 | 5.07 | 40.6 | 41.4 | 40.730.57 | False |
| GALEXASC J230718.90+231153.9 | False | False | False | 346.82875 | 23.19833 | 0.02099 | 94.4 | 0.76 | 4.56 | 41.3 | 41.9 | 41.280.57 | False |
| UGC 12381 | True | False | False | 346.84521 | 43.60394 | 0.01546 | 69.2 | 0.93 | 3.13 | 42.8 | 42.9 | 42.530.57 | True |
| 2MASX J23154464+0654391 | False | False | False | 348.93608 | 6.91089 | 0.00800 | 35.6 | 0.87 | 4.21 | 41.7 | 42.2 | 41.710.57 | True |
| 2MASS J23195620-3025139 | False | False | False | 349.98425 | -30.42072 | 0.01390 | 62.2 | 0.84 | 2.72 | 41.6 | 41.5 | 40.800.57 | True |
| UM 161 NED02 | False | False | False | 351.93500 | -2.01317 | 0.01820 | 81.7 | 1.25 | 4.46 | 41.1 | 41.8 | 41.220.57 | False |
| 2MASX J23313624-1235537 | False | False | False | 352.90104 | -12.59817 | 0.02120 | 95.4 | 2.35 | 3.92 | 42.4 | 43.4 | 43.080.57 | True |
| 2MASS J23352324-3945052 | False | False | False | 353.84692 | -39.75144 | 0.01875 | 84.1 | 1.07 | 2.84 | 42.0 | 42.0 | 41.470.57 | True |
| NGC 7770 | True | True | False | 357.84393 | 20.09652 | 0.01373 | 61.4 | 0.84 | 3.99 | 42.8 | 43.2 | 42.390.23 | True |
| 2MASX J23535252-0005558 | False | False | False | 358.46880 | -0.09872 | 0.02196 | 98.8 | 1.83 | 3.53 | 42.1 | 42.7 | 42.240.57 | True |
– Notes: (1) object name, mostly following NED nomenclature; (2) flag whether the galaxy is in 2MRS; (3) and (4) flags whether galaxy has a H II or starburst classification, respectively; (5) and (6) equatorial coordinates of the object centre in J2000 in degrees; (7) redshift; (8) object distance in Mpc; (9) and (10) WISE W1-W2 and W2-W3 colours; (11) and (12) observed W1 and W3 continuum luminosities, calculated from the selected distance and the profile-fitting magnitudes. (13) nuclear luminosity of an assumed AGN estimated from and optical type (see Sect. 4.1 for details); (14) flag whether the source fulfils the S18 criterion or not (see Sect. 4.4.1 for details);