PyODDS: An End-to-end Outlier Detection System with Automated Machine Learning
Abstract.
Outlier detection is an important task for various data mining applications. Current outlier detection techniques are often manually designed for specific domains, requiring large human efforts of database setup, algorithm selection, and hyper-parameter tuning. To fill this gap, we present PyODDS, an automated end-to-end Python system for Outlier Detection with Database Support, which automatically optimizes an outlier detection pipeline for a new data source at hand. Specifically, we define the search space in the outlier detection pipeline, and produce a search strategy within the given search space. PyODDS enables end-to-end executions based on an Apache Spark backend server and a light-weight database. It also provides unified interfaces and visualizations for users with or without data science or machine learning background. In particular, we demonstrate PyODDS on several real-world datasets, with quantification analysis and visualization results.
1. Introduction
Outliers refer to the objects with patterns or behaviors that are significantly rare and different from the rest of the majority. Outlier detection plays an important role in various applications, such as fraud detection, cyber security, medical diagnosis, and industrial manufacturer. The research of outlier detection traces far back, and numerous approaches have been proposed to tackle the problem. Representative categories of outlier detection approaches include density-based, distance-based and model-based approaches.
Despite the exciting results in outlier detection research, it is challenging and expensive to apply outlier detection to tackle real-world problems. First, there is no single outlier detection algorithm outperforms the others on all scenarios, since many outlier detection techniques have been specifically developed for certain application domains (Li et al., 2019a, b; Huang et al., 2019); Second, most outlier detection methods highly depend on their hyper-parameter settings; Third, the contamination ratio of outliers in the given task is usually unknown.
Recently, efforts have been made to integrate various outlier detection algorithms into a single package. Existing approaches (Li et al., 2019c; Zhao and et al, 2019) contain different outlier detection methods with various programming languages, yet they do not tackle with optimal pipeline design as searching and exploration problems, and do not cater specifically to backend-servers for large-scale applications.
In the meanwhile, a large focus of the machine learning community has been to find better hyper-parameter settings, which has been successfully tackled using Bayesian optimization, reinforcement learning, etc., and forms a core component of AutoML systems. However, less attention has been paid to finding a good solution for an end-to-end, joint optimization problem including multiple components, especially in real-world data mining tasks.
To bridge the gap, we present PyODDS, a full-stack, end-to-end system for outlier detection. PyODDS has desirable features from the following perspectives. First, to our best knowledge, PyODDS describes the first attempt to incorporate automated machine learning with outlier detection, and belongs to one of the first attempts to extend automated machine learning concepts into real-world data mining tasks. Second, we carefully design an end-to-end framework for outlier detection, including database operations and maintenance, the search process of automated outlier detection (including the search space and the search strategy design). Finally, we present a visual analytic system based on our proposed framework for demonstration.
2. PyODDS System Architecture
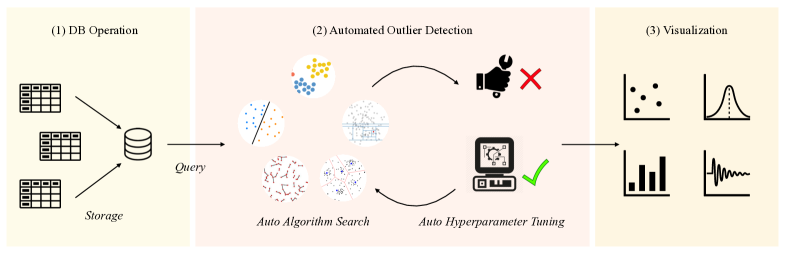
The pipeline from query data to evaluation and visualization is outlined in Figure 1, which consists of 3 components. The first component is the information extraction, which collects the source data via query functions with flexible time-slices segmentation, including user-info confirmation, database operation, and maintenance. The second component is the suspicious outlier detection. It detects suspicious instances with traditional outlier detection approaches as an automated machine learning problem, including the search space design and the search strategy development. The last component is the visualization part, which designs for users to understand the detection results better. In the following subsections, we focus on the first and second components. We will discuss the visualization in Section 4.
2.1. Information Extraction
In this component, we extract the information from a specific time range through database operations. PyODDS includes database operation functions for client users: (1) function allows the client to connect the server with host address and user information for safety verification; (2) function designs for flexible time-slices segmentation.
2.2. Automated Outlier Detection
To detect suspicious outliers, we need to find the best pipeline configuration. We formulate the problem of finding the best policy as a conjunctive search problem. In this component, our method consists of two subsections: a search space and a search strategy.
2.2.1. Search Space
In our search space, a policy consists of sub-policies as a batch of outlier detection algorithms. Additionally, the policy also contains the hyper-parameters as another conditional sub-policy: 1) specific hyper-parameter settings corresponding to each algorithm sub-policy which controls the learning process; 2) the contamination ratio which determines the portion of outliers corresponding to the given data source.
Each algorithm we included also comes with a default range of hyper-parameter settings. Within each algorithm sub-policy, hyper-parameters which might be discrete, ordinal, or continuous, need to be optimized in the meanwhile.
2.2.2. Search Strategy
Following the search space setting we proposed above, we define the problem of automated outlier detection with algorithm selection and hyper-parameter tuning as follows. Let be a set of outlier detection algorithms, and be the set of corresponding hyper-parameters. We assume is given. Let and be the training set and validation set, respectively. Denote as the performance on in terms of metric when trained on with algorithm and corresponding hyper-parameters . The algorithm is to find optimal solution via observation history . We define the objective as
| (1) |
To get a step further, Sequential Model-Based Global Optimization (SMBO) algorithms have been used in many applications where evaluation of the fitness function is expensive, i.e., automated machine learning tasks (Bergstra et al., 2011). To optimize the evaluation function , we optimize the criterion of Expected Improvement, the expectation under when negatively exceed the threshold :
| (2) |
where the point that maximizes the surrogate (or its transformation) becomes the proposal for where the function should be evaluated.
The tree-structured Parzen estimator (TPE) models by transforming to a generative process, which replaces the distributions of the configuration prior to non-parametric densities. We borrow the strategy in (Bergstra et al., 2011) here to minimize the EI. We keep the Estimation of Distribution (EDA, (Larrañaga and Lozano, 2001)) approach on the discrete part of our search space (algorithm selection and discrete hyper-parameters), where we sample candidate points according to binomial distributions, while we use the Covariance Matrix Adaptation - Evolution Strategy, a gradient-free evolutionary algorithm (CMA-ES, (Hansen, 2006)) for the remaining part of our search space (continuous hyper-parameters). The whole optimization process can be summarized in Algorithm 1.
3. Experimental Evaluation
3.1. Data Source
The time-series data, which is used to train and evaluate PyODDS, comes from a benchmark dataset, NAB corpus (Ahmad et al., 2017). NAB corpus contains 58 different individual tasks with ground-truth. The reasons why we employ this data source are in three folds. First, NAB corpus provides fine-grained labels, where the core principles in independence, transparency and fairness guarantee. Second, the data in NAB corpus are ordered, timestamped, which cover a varies of real-world application scenarios, including server monitor logs from AmazonCloudwatch service, online advertisement clicking-rates, real-time traffic transportation, and collection from Twitters with trading related contents. Third, each raw data file is a dictionary of key-value pair, which is naturally to be represented as tabular data that meets the requirements of the backend database service in the PyODDS.
3.2. Algorithm Space Configurations
We implemented 13 state-of-the-arts outlier detection algorithms as the search space, including statistical approaches, and recent neural network frameworks. In the meanwhile, in order to support both static and time series data analysis, the search space covers algorithms with different settings.
3.3. Detection Results Evaluation
In this section, we empirically investigate the performance of PyODDS to answer the following questions: first, how does the algorithm with hyper-parameters discovered by PyODDS compare with state-of-the-art handcrafted algorithms? Second, how does the search process affect performance?
In Table 1, we show the performance on the NAB corpus. We follow the default setting in NAB as the scoring algorithm, which uses a scaled sigmoidal scoring function to quantify the detection performance. The smooth score function ensures that small labeling errors will not cause large changes in reported scores. The evaluation matrix includes the standard profile, reward low FPs, and reward low FNs. The standard profile assigns TPs, FPs, and FNs with relative weights, and the latter two profiles accredit greater penalties for FPs and FNs, respectively. For more detailed definitions, please refer to the default setting (Lavin and Ahmad, 2015).
To answer the first question, we use PyODDS to find the best policies on the NAB corpus. As can be seen from Table 1, the outlier detection solution discovered by PyODDS architecture achieves competitive performance with current state-of-the-art models: the handcrafted algorithms, and random searched results. It shows that PyODDS could find optimal solutions within a large range of configurations for different detection tasks.
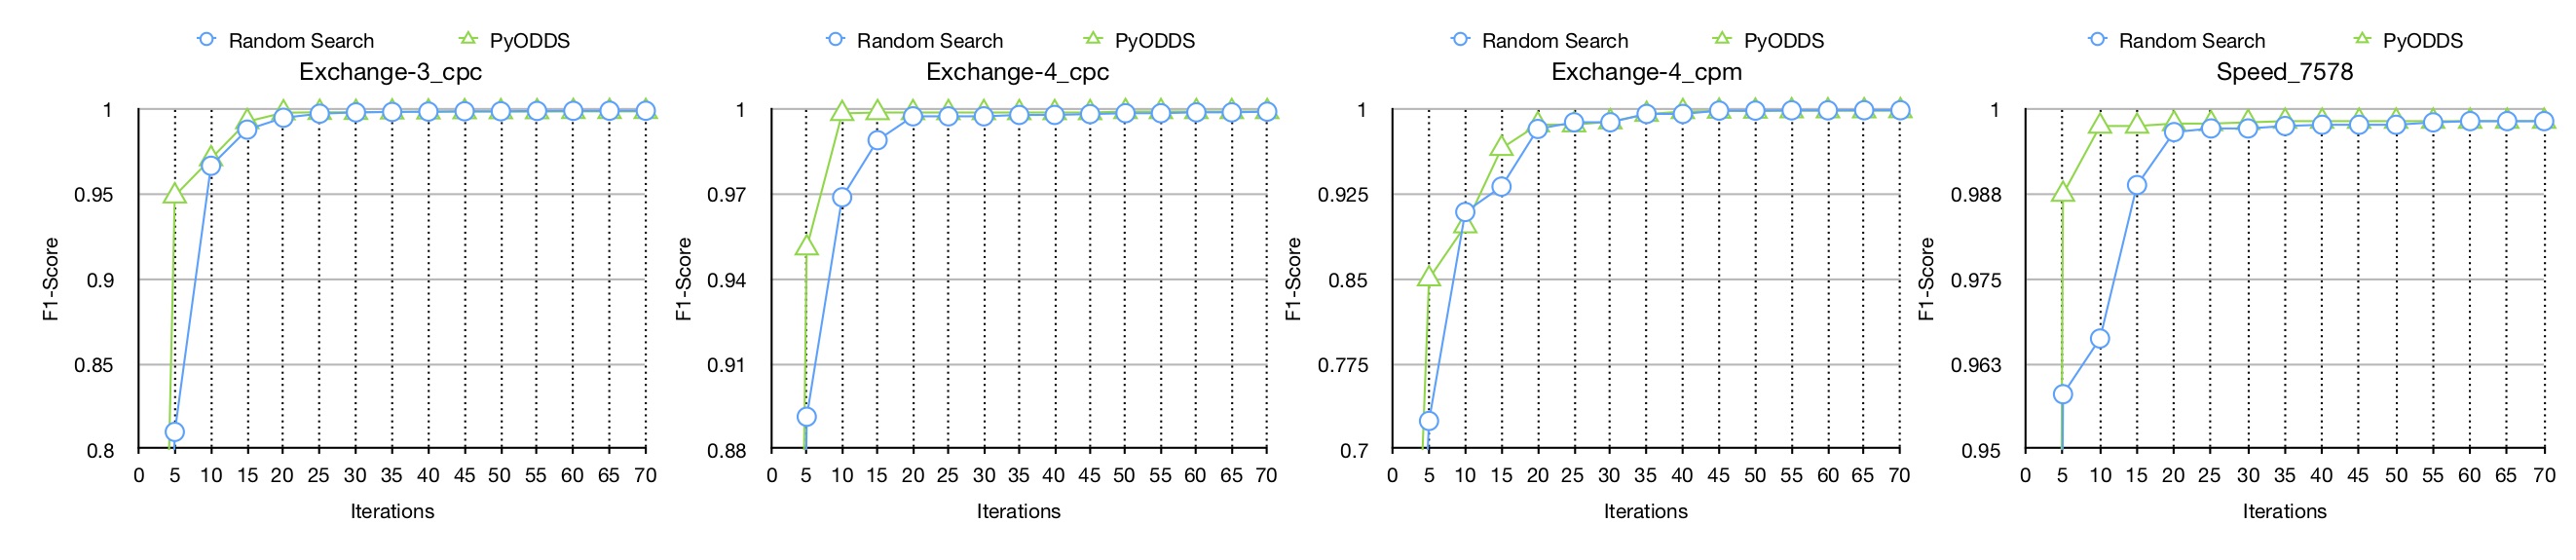
For the second question, we conduct the search process in the same search space with different search strategies. As can be seen from Figure 2, PyODDS is more efficient in finding the well-performed architectures during the search progress. Comparing with the random search, the top-5 architectures discovered by PyODDS have better performance (F1-score) and could convergence faster on different datasets. It shows the effectiveness of the search strategy PyODDS implemented could enhance the performance and accelerate the search efficiency.
| Model | Standard Profile | Reward Low FP | Reward Low FN |
|---|---|---|---|
| Perfect | 100 | 100 | 100 |
| CBLOF (He et al., 2003) | 94.56 | 93.29 | 96.68 |
| HBOS (Aggarwal, 2015) | 91.86 | 95.74 | 93.47 |
| IFOREST (Liu et al., 2008) | 92.44 | 92.10 | 94.38 |
| KNN (Ramaswamy et al., 2000) | 90.76 | 96.12 | 93.42 |
| LOF (Breunig et al., 2000) | 92.61 | 88.78 | 89.86 |
| OCSVM (Schölkopf and et.al, 2001) | 88.63 | 94.60 | 91.31 |
| PCA (Shyu and et al, 2003) | 93.15 | 94.50 | 96.28 |
| RobustCovariance | 96.68 | 95.27 | 94.76 |
| SOD (Kriegel et al., 2009) | 78.46 | 78.46 | 82.93 |
| AUTOENCODER (Hawkins et al., 2002) | 94.74 | 96.41 | 93.64 |
| DAGMM (Zong and et al, 2018) | 85.27 | 83.35 | 90.21 |
| LSTMAD (Malhotra and et al, 2015) | 93.19 | 95.18 | 92.43 |
| LSTMENCDOC (Malhotra and et al, 2016) | 94.31 | 89.23 | 89.23 |
| RANDOM | 87.38 | 90.79 | 86.90 |
| PyODDS | 96.68 | 95.27 | 94.76 |
4. Demonstration
PyODDS is composed of a frontend and a server backend. Our system is written in Python and uses Apache Spark as the server backend and TDengine as the database support service. We demonstrate our system based on the real-world datasets from the Numenta Anomaly Benchmark (NAB) corpus (Ahmad et al., 2017).
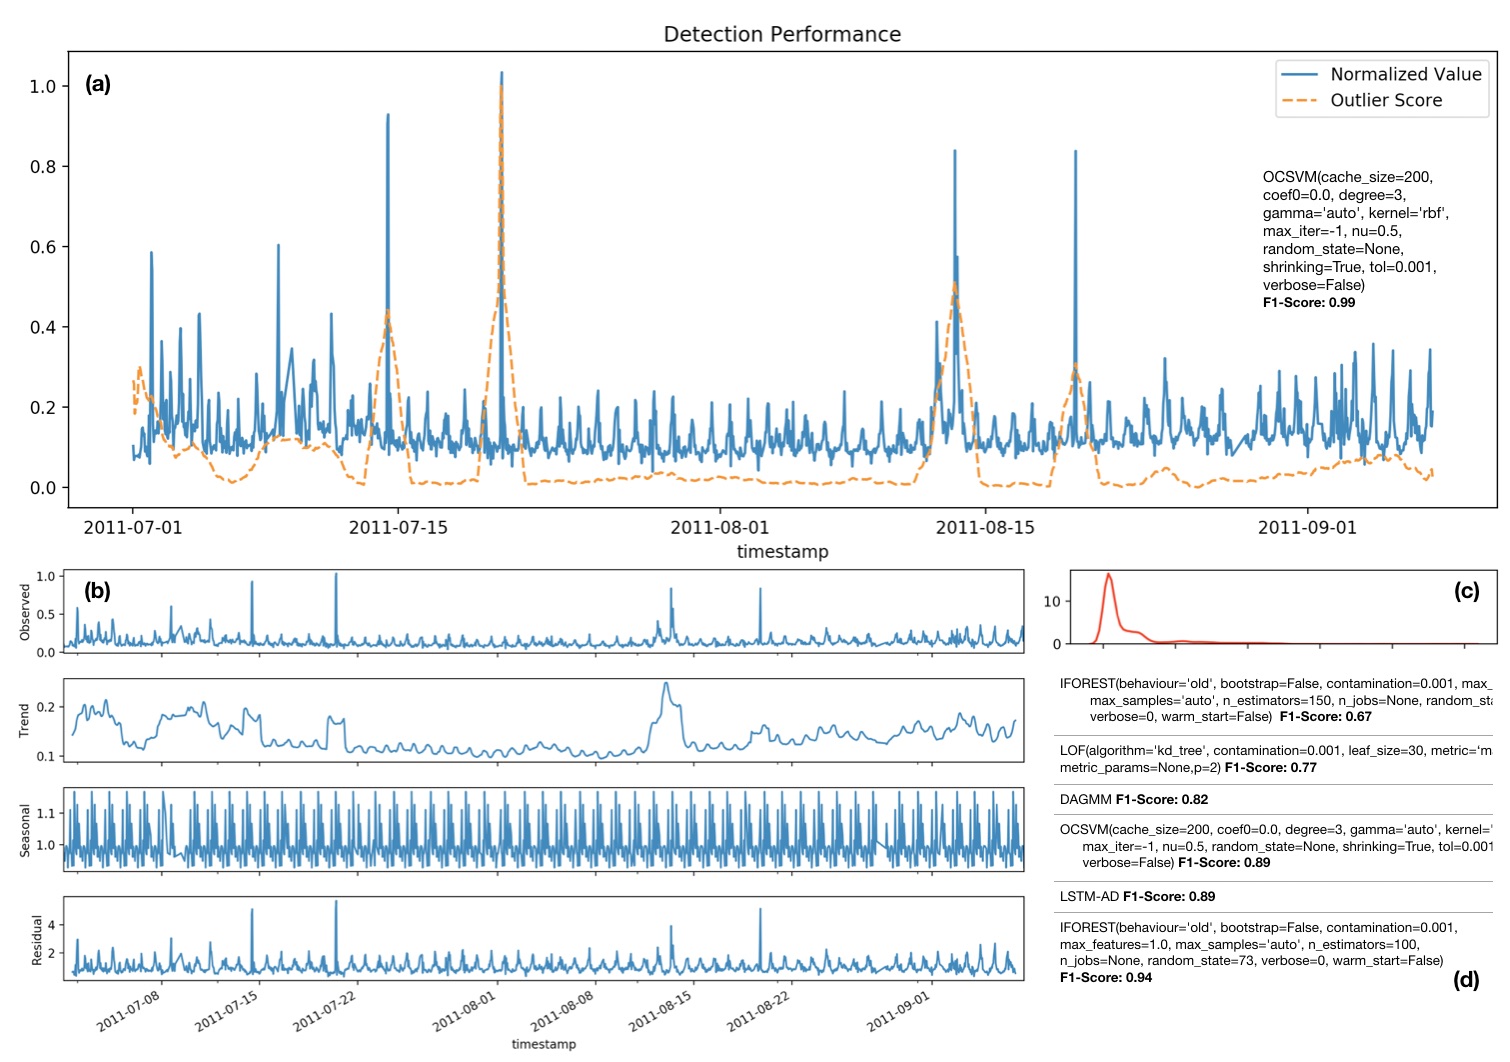
First, after selecting the data source and time range, our system will automatically find an algorithm with default hyper-parameter settings from the search space, and show the detection results. Illustrated by Figure 3(a), we provide the normalized value from the original time series as the blue line, and outlier score as orange line, to help users understand the data distribution in the original data source, as well as the detection results. Lower outlier score indicates that the data point is considered “normal”. Higher values indicate the presence of an outlier in the data.
In addition, PyODDS provides time series analysis tools for users to better understand the data source. Illustrated in Figure 3(b), PyODDS decomposes the original time series as a combination of level, trend, seasonality, and residual components. The residual values could also act as denoters for outlier detection in time-series. In the meanwhile, in Figure 3(c), PyODDS estimates the probability density function of the values in each timestamp, which provides a comprehensive scope of the data distribution in the original data source. According to the search strategy and search space we proposed in the previous sections, we also provide trace logs to illustrate the search process for records. After several iterations of the search process, the selected algorithms with specific configurations are listed in Figure 3(d)). As shown in the user case, extreme values and spikes without seasonal patterns (i.e., in the time stamp 2011-07-15, etc) have larger outlier score than the rest majority as normal cases (shown in (a) and (c)), as well as larger residual value after time series decomposition (shown in (b)). Current best solution is the sub-policy OCSVM with specific hyperparameter settings.
5. Conclusion
In this demo, we propose an end-to-end approach to detect outliers, and demonstrate the prediction results for users to better understand the data source. PyODDS automatically search an optimal outlier detection pipeline for a new dataset at hand out of a defined proposed search space via the proposed search strategy.
References
- (1)
- Aggarwal (2015) Charu C Aggarwal. 2015. Outlier analysis. In Data mining. Springer.
- Ahmad et al. (2017) Subutai Ahmad, Alexander Lavin, Scott Purdy, and Zuha Agha. 2017. Unsupervised real-time anomaly detection for streaming data. Neurocomputing (2017).
- Bergstra et al. (2011) James S Bergstra, Rémi Bardenet, Yoshua Bengio, and Balázs Kégl. 2011. Algorithms for hyper-parameter optimization. In NIPS.
- Breunig et al. (2000) Markus M Breunig, Hans-Peter Kriegel, Raymond T Ng, and Jörg Sander. 2000. LOF: identifying density-based local outliers. In ACM sigmod record.
- Hansen (2006) Nikolaus Hansen. 2006. The CMA evolution strategy: a comparing review. In Towards a new evolutionary computation.
- Hawkins et al. (2002) Simon Hawkins, Hongxing He, Graham Williams, and Rohan Baxter. 2002. Outlier detection using replicator neural networks. In ICDWKD. Springer.
- He et al. (2003) Zengyou He, Xiaofei Xu, and Shengchun Deng. 2003. Discovering cluster-based local outliers. Pattern Recognition Letters (2003).
- Huang et al. (2019) Xiao Huang, Qingquan Song, Yuening Li, and Xia Hu. 2019. Graph Recurrent Networks with Attributed Random Walks. (2019).
- Kriegel et al. (2009) Hans-Peter Kriegel, Peer Kröger, Erich Schubert, and Arthur Zimek. 2009. Outlier detection in axis-parallel subspaces of high dimensional data. In PAKDD.
- Larrañaga and Lozano (2001) Pedro Larrañaga and Jose A Lozano. 2001. Estimation of distribution algorithms: A new tool for evolutionary computation. Springer Science & Business Media.
- Lavin and Ahmad (2015) Alexander Lavin and Subutai Ahmad. 2015. Evaluating Real-Time Anomaly Detection Algorithms–The Numenta Anomaly Benchmark. In ICML.
- Li et al. (2019a) Yuening Li, Xiao Huang, Jundong Li, Mengnan Du, and Na Zou. 2019a. SpecAE: Spectral AutoEncoder for Anomaly Detection in Attributed Networks. In CIKM.
- Li et al. (2019b) Yuening Li, Ninghao Liu, Jundong Li, Mengnan Du, and Xia Hu. 2019b. Deep Structured Cross-Modal Anomaly Detection. In IJCNN.
- Li et al. (2019c) Yuening Li, Daochen Zha, Na Zou, and Xia Hu. 2019c. PyODDS: An End-to-End Outlier Detection System. arXiv preprint arXiv:1910.02575 (2019).
- Liu et al. (2008) Fei Tony Liu, Kai Ming Ting, and Zhi-Hua Zhou. 2008. Isolation forest. In ICDM.
- Malhotra and et al (2015) Pankaj Malhotra and et al. 2015. Long short term memory networks for anomaly detection in time series. Presses universitaires de Louvain.
- Malhotra and et al (2016) Pankaj Malhotra and et al. 2016. LSTM-based encoder-decoder for multi-sensor anomaly detection. arXiv preprint arXiv:1607.00148 (2016).
- Ramaswamy et al. (2000) Sridhar Ramaswamy, Rajeev Rastogi, and Kyuseok Shim. 2000. Efficient algorithms for mining outliers from large data sets. In ACM Sigmod Record.
- Schölkopf and et.al (2001) Bernhard Schölkopf and et.al. 2001. Estimating the support of a high-dimensional distribution. Neural computation (2001).
- Shyu and et al (2003) Mei-Ling Shyu and et al. 2003. A Novel Anomaly Detection Scheme Based on Principal Component Classifier. (2003).
- Zhao and et al (2019) Yue Zhao and et al. 2019. PyOD: A python toolbox for scalable outlier detection. JMLR (2019).
- Zong and et al (2018) Bo Zong and et al. 2018. Deep autoencoding gaussian mixture model for unsupervised anomaly detection. (2018).