Real-space cluster dynamical mean-field theory:
Center focused extrapolation on the one- and two particle level
Abstract
We revisit the cellular dynamical mean-field theory (CDMFT) for the single band Hubbard model on the square lattice at half filling, reaching real-space cluster sizes of up to sites. Using benchmarks against direct lattice diagrammatic Monte Carlo at high temperature, we show that the self-energy obtained from a cluster center focused extrapolation converges faster with the cluster size than the periodization schemes previously introduced in the literature. The same benchmark also shows that the cluster spin susceptibility can be extrapolated to the exact result at large cluster size, even though its spatial extension is larger than the cluster size.
I Introduction
Even after decades of intense research, the single band Hubbard model in finite dimensions larger than one remains an unsolved cornerstone paradigm in theoretical solid state physics. As a non-perturbative technique dynamical mean-field theory (DMFT) Metzner and Vollhardt (1989); Georges and Kotliar (1992); Georges et al. (1996) led to a significant leap forward as it provided an approximation which is nowadays widely used to treat material realistic lattice models Kotliar et al. (2006). In this approximation, the lattice problem is mapped to a self-consistent auxiliary quantum impurity model, leading to a local approximation of the self-energy.
Single site DMFT has led to many successes, e.g. a description of the Mott-Hubbard metal-to-insulator transition (MIT) from a weak coupling metallic over to a strongly correlated Fermi liquid and eventually Mott insulating state Georges et al. (1996); Hansmann et al. (2013) within a single theoretical framework. The locality of the self-energy is however a major limitation for some of the most interesting problems as for example cuprate high- superconductivity Bednorz and Müller (1986); Dagotto (1994); Timusk and Statt (1999); Lee et al. (2006) where the pseudo-gap phase is characterized by a strong node-antinode differentiation. Note, however, that in material-realistic multi-orbital models even local DMFT self-energies can lead to dependent effects in the spectral function due to orbital mixing as, e.g., shown in Tamai et al. (2019). Quantum critical behavior Löhneysen et al. (2007); Büttgen et al. (2010); Gegenwart et al. (2008) in low dimensions and/or at low temperatures is another example where the physics is dominated by non-local correlations beyond the mean-field description of spatial fluctuations within DMFT.
In recent years, several methods have been introduced to overcome the locality of the self-energy approximation in DMFT. Firstly, cluster extensions of DMFT, in reciprocal space (DCA) Hettler et al. (1998, 2000); Aryanpour et al. (2002); Maier et al. (2005a), in real space (CDMFT) Lichtenstein and Katsnelson (2000); Kotliar et al. (2001) or in its first ”nested” form Georges et al. (1996); Biroli et al. (2004); Vučičević et al. (2018). This transformed DMFT into a controlled method. The control parameter is the size of the cluster, which determines also the resolution of the approximation in momentum space. These approaches have found extensive use, e.g. in the study of the Hubbard model Parcollet et al. (2004); Stanescu et al. (2006); Sakai et al. (2012); Park et al. (2008); Fratino et al. (2017); Walsh et al. (2019a, b); Foley et al. (2019); Vučičević et al. (2019); Civelli et al. (2008); Ferrero et al. (2010); Gull et al. (2013); Maier et al. (2004, 2005b); Gull et al. (2010); Yang et al. (2011a); Okamoto et al. (2010); Ferrero et al. (2009). Secondly, several diagrammatic extensions Toschi et al. (2007); Katanin et al. (2009); Valli et al. (2010); Rohringer et al. (2011); Rubtsov et al. (2008); Hafermann et al. (2009); Ayral and Parcollet (2015, 2016a, 2016b); Vučičević et al. (2017); Ayral et al. (2017); Rohringer et al. (2013); Hague et al. (2004); Slezak et al. (2009); Yang et al. (2011b); Taranto et al. (2014); Rohringer et al. (2018) have been proposed to obtain a better resolution in momentum or a better convergence than cluster methods.
In this paper, we focus on the real space CDMFT method Kotliar et al. (2001). While large cluster sizes were studied in DCA up to convergence and compared to exact methods like diagrammatic Monte Carlo in some parameter regimes, e.g. Wu et al. (2017); LeBlanc et al. (2015), large CDMFT clusters have not received the same attention. The central issue is that CDMFT breaks translational invariance by definition for any finite cluster. One therefore needs to use re-periodization schemes to restore the translation symmetry of the lattice self-energy when approximating it from the cluster self-energy Kotliar et al. (2001). Several ways to do this have been discussed in the literature Stanescu and Kotliar (2006); Sénéchal et al. (2000); Sakai et al. (2012).
In this work, we solve large CDMFT clusters of up to sites for the half-filled Hubbard model, and benchmark their convergence against exact results obtained with diagrammatic Monte Carlo (DiagMC) Prokof’ev and Svistunov (1998); Van Houcke et al. (2010); Kozik et al. (2010) in its connected determinant formulation (CDet Rossi (2017) for one particle reducible quantities and DDMC Moutenet et al. (2018); Šimkovic and Kozik (2019); Šimkovic et al. (2020) for one particle irreducible quantities).
We show that if we use a center-focused extrapolation (CFE) to approximate the lattice self-energy, instead of averaging over the whole cluster as done in previous works, we obtain a much better approximation. This CFE converges faster and is in excellent agreement with the DiagMC result at moderate temperature. We further present results at lower temperature and larger than the range currently accessible with diagrammatic Monte Carlo methods.
The paper is organized as follows. In Section II we introduce the 2D Hubbard model and present the CDMFT formalism. We then present in Section III the center focused extrapolation technique, and benchmark it against DiagMC. In Section IV we discuss the spin-spin correlation function and finally summarize our results in Section V.
II Model and Method
We study the 2D single-orbital Hubbard model on the square lattice
| (1) |
where () denotes the creation (annihilation) operator for an electron with spin on site , with the density operator and the chemical potential . and are nearest-neighbor hopping amplitude and onsite Hubbard repulsion respectively. We study the half-filled case which corresponds to . For a single-orbital unit cell the electronic dispersion relation in momentum space reads .
In the following, we compute propagators of single- and two-particle excitations in the CDMFT approximation Kotliar et al. (2001). CDMFT is a DMFT approximation on the super-lattice made of real space clusters on the original Bravais lattice Kotliar et al. (2001), where the cluster sites within the super-cell play the role of orbitals. Hence, the Green’s functions and self-energy contains inter-sites elements. They are computed using a self-consistent quantum impurity model, which is solved by a continuous time Quantum Monte-Carlo solver using an interaction expansion Rubtsov and Lichtenstein (2004), implemented with the TRIQS library Parcollet et al. (2015).
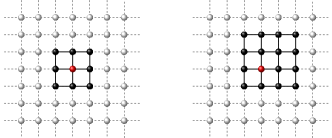
For the present study we consider square clusters of up to atoms (see Fig. 1 for a schematic illustration). Technically, the equations for the Green’s functions and self-energies are identical to those of a multi-orbital (single-site) DMFT with a density-density interaction. The local lattice Green’s function in Matsubara frequencies is computed by integrating over the reduced Brillouin zone (RBZ) of the super-lattice :
| (2) |
with indexing cluster sites, dispersion relation (with ), and self-energy . The Weiss field is given by the standard equation Kotliar et al. (2001)
| (3) |
The self-energy acquires intersite components. Hence it can capture correlation effects up to distances of about the linear size of the cluster.
The cluster self-energies break translational invariance for any finite cluster size. Transformation to lattice quantities in the Brillouin zone of the original lattice therefore requires restoring translational invariance for the Green’s function, the self-energy, or its cumulants Lichtenstein and Katsnelson (2000); Kotliar et al. (2001); Stanescu et al. (2006); Stanescu and Kotliar (2006); Sakai et al. (2009); Staar et al. (2013); Sakai et al. (2012, 2016) (see also Appendix B).
III Center focused extrapolation
In a very large cluster, we expect on general grounds the Green function at the center of the cluster to converge faster with cluster size than at the boundary. In this section, we use this insight to improve on the re-periodization within the CDMFT algorithm. We begin with the study of single-particle cluster quantities, and analyze the convergence of the local and the nearest neighbor self-energy w.r.t. cluster size. In a second step we use these converged self-energies to approximate the lattice self-energy, and benchmark it against exact DiagMC results.
III.1 Cluster quantities
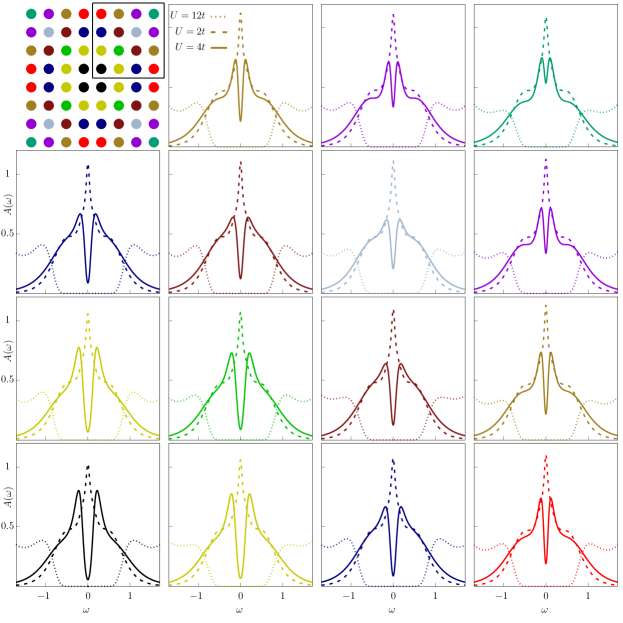
Let us first concentrate on the cluster Green’s and spectral functions. In Fig. 2 we show site-resolved single particle spectral functions obtained from an CDMFT calculation for different values of . Exploiting cluster symmetry, we show only the upper right quadrant of the cluster sites, where equivalent spectra are plotted in the same color. The violation of the translational invariance is most pronounced for (solid lines) as can be seen by comparing the spectra in the center at with those in the corners at . For all spectra exhibit a finite quasiparticle weight at , while for they are all gaped.
In Fig. 3 we show the corresponding site-dependent value of . The spectra in the cluster center are generally more correlated/insulating than those at the edges/corners of the cluster. Given the fact that the exact solution has a critical value of at , the single particle spectrum of the central site appears to be a better approximation than the average over the whole cluster (dashed line in Fig. 3).
III.2 Convergence of cluster quantities
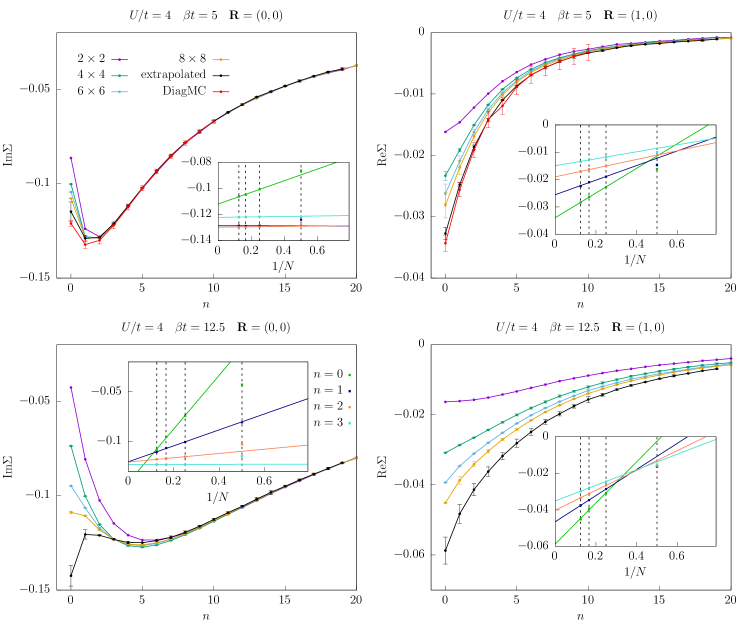
We now study systematically the convergence of the onsite and first neighbor self-energy with cluster size, and compare it to the exact lattice DiagMC result in the regime where it is available. In the left panels of Fig. 4 we plot the (purely imaginary) onsite self-energies of the four inner-core sites of the even clusters as a function of Matsubara frequency for and two different temperatures. In the right panels we plot the (purely real) nearest neighbor self-energy corresponding to the inter-site correlation between two of the innermost cluster sites. The overall cluster-size dependence is pronounced in all plots and stronger for the lower temperature. In the insets of Fig. 4, we show the linear extrapolation of the data at each Matsubara frequency as a function of . A linear extrapolation is possible 111 According to spin-wave theory White et al. (1989) finite-size corrections scale as , which may apply to the half-filled Hubbard model dominated by antiferromagnetic spin fluctuations. , if we neglect the smallest cluster . The extrapolated self-energies are plotted in black. The error bar combines errors from three sources: the QMC statistics in the quantum impurity solver, the convergence of the CDMFT self-consistency loop, and the extrapolation in .
At high temperature (, upper panels of Fig. 4) we compare CDMFT results to DiagMC benchmark data for Matsubara frequencies up to (red color). For both the onsite and nearest neighbor self-energies, the extrapolated CDMFT results are compatible with the DiagMC data within error bars. For the onsite self-energy (upper left panel), the extrapolated (and DiagMC) self-energy is quite different from the largest considered cluster , especially at the first Matsubara frequency. For the nearest-neighbor self-energy, the extrapolation effect extends to Matsubara frequencies as high as .
At lower temperature (, lower panels of Fig. 4), which is out of reach of the DiagMC algorithm, the effects of the extrapolation are even stronger, and enhance the impact of the correlations.
III.3 Center focused extrapolation (CFE) of the self-energy
After extrapolating the self-energy at the center of the cluster, we approximate the lattice self-energy in real space by a center focused extrapolation (CFE) defined in the following. For each lattice displacement with vector elements greater than or equal to zero, we take the large extrapolation of the cluster self-energy between the central site (c.f. Fig. 1) and , i.e.
| (4) |
For negative displacements we infer the value by using the rotational symmetry of the cluster. This procedure differs substantially from the conventional periodization, where averages over the whole cluster are performedKotliar et al. (2001).
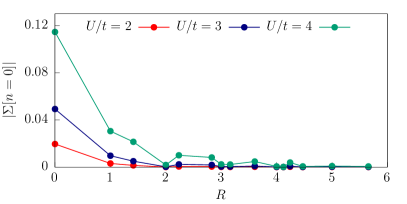
In practice, given that we solve CDMFT only up to , our strategy is two-fold. For the short distances , we use the extrapolated self-energy values computed in the previous subsection. For the largest however, where no extrapolation is possible given the lack of data points, we use instead the value of the largest cluster. This approximation is justified because the self-energy in real space decays on length scales smaller than our largest cluster. Indeed in Fig. 5 we show for and different values of the interaction . Even for the largest interaction value do we observe a decay of the absolute value of the self-energy at the first Matsubara frequency to zero within less than lattice constants.
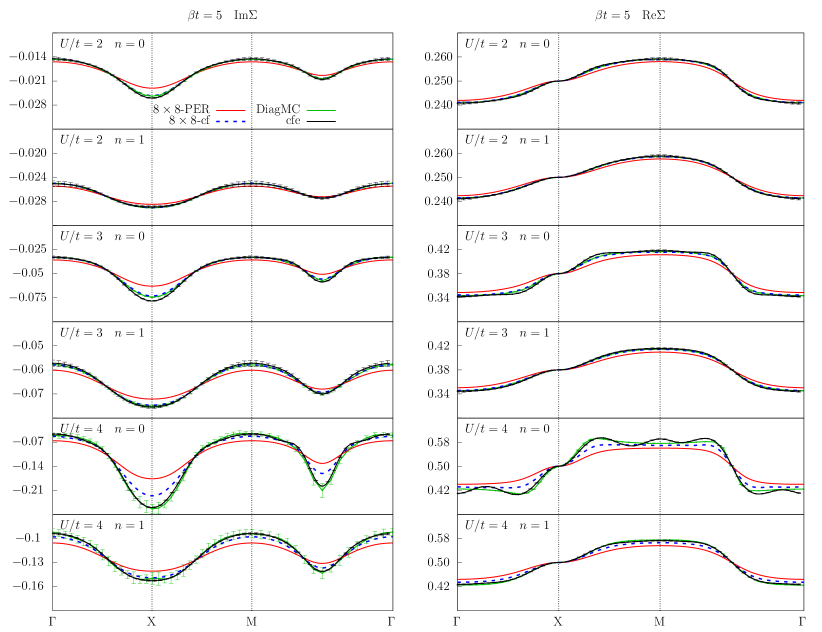
In Fig. 6 we compare the Fourier transform
| (5) |
of this estimator of the lattice self-energy (black) with the exact DiagMC computation (green) for the first two Matsubara frequencies (), at the temperature where it is available. We further compare these to the self-energy obtained by using the same procedure directly on the results, i.e. without the large extrapolation (blue dashed), and to the “standard” periodization of the self-energy (red) Kotliar et al. (2001). We find again an excellent agreement, within error bars, between the CDMFT+CFE and the exact DiagMC results. In particular, for the largest available , we see a substantial improvement over the conventional self-energy periodization, and a sizable correction of the self-energy data obtained without extrapolation. We see in the second to lowest panel on the right side (, , ) that the CFE procedure significantly improves even details of the self-energy along the path --- (i.e. non-monotonous behavior between and points).
III.4 Lattice spectral function of CDMFT+CFE
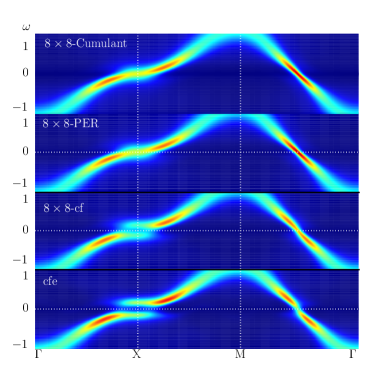
The single particle spectra corresponding to the self-energy data of Fig. 6 are presented in Fig. 7. In addition we present here also the spectrum for the cumulant periodization scheme applied to the cluster (see Appendix B).
The qualitative differences between the CFE results and the conventional schemes using data without extrapolation are sizable and most visible around the Fermi level. The gaps around and between and at are more pronounced due to the larger value of the CFE self-energies. This shows that the CFE has a qualitative impact on computed observables, even at high temperature.
IV Spin-spin correlation function
Let us now consider the spin susceptibility of the cluster
| (6) |
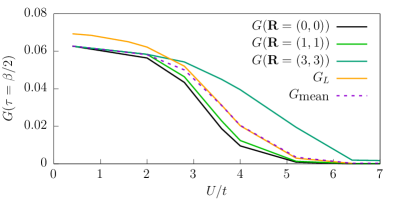
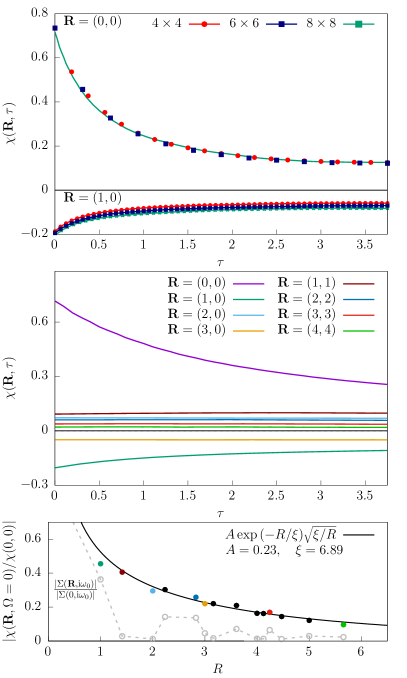
The computation of the full lattice susceptibility, which uses the impurity two-particle vertex function as an input to the lattice Bethe-Salpeter equationGeorges et al. (1996), is currently computationally too demanding for large clusters. However, in the limit of infinite cluster size, we expect the two quantities to coincide. In Fig. 8 (upper panel), we show the imaginary time onsite and nearest-neighbor spin-spin correlation functions for and , for different cluster sizes. For these parameters both components are i) sizable, ii) fully dynamic (i.e. beyond static mean-field approaches), and iii) antiferromagnetic (as expected for the present model). We see a quick convergence of the onsite susceptibility with . The nearest-neighbor component for has a stronger cluster dependence. In the central panel of Fig. 8 we show the spatially resolved dynamical susceptibility for the cluster. Remarkably, the dynamic part of the susceptibility seems to decay much faster with distance than the static part (i.e. already is barely dependent on ). This could indicate the presence of two length scales, one for coherent (i.e. dynamic) and one for non-local correlations that can be captured by static mean fields. The real-space decay of the static (i.e. -integrated) spin susceptibility is presented on the bottom panel of Fig. 8 and compared to that of the corresponding self-energy at the smallest Matsubara frequency. The susceptibility data is well approximated by an Ornstein-Zernike form with a correlation length of . The fact that we manage to capture the exponential decay of spin-spin correlations reaching far beyond the scale of the clusters under consideration is indeed quite remarkable. A similar analysis for the self-energy proves to be less feasible, given the fact that it exhibits a much stronger radial dependence. We observe, however, that the self-energy decays overall on smaller length scales than the susceptibility.
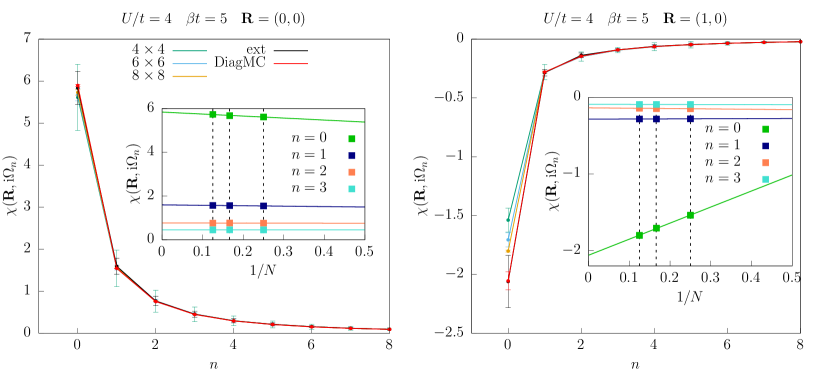
In order to assess the validity of these susceptibility results we compare it for different cluster sizes to the DiagMC benchmark in Fig. 9, where plot as a function of Matsubara frequency for the two displacements (left) and (right).
As for the self-energy, we perform an extrapolation to infinite cluster size (c.f. insets of Fig. 9) and obtain excellent agreement, within error bars, with the DiagMC data. We observe a strong dependence on only for the displacement at the first Matsubara frequency.
Our analysis of the spin-spin susceptibility suggests that real-space cluster approaches such as CDMFT are valid even at temperatures and/or interaction values for which the magnetic correlation length exceeds the cluster size, as long as the self-energy decay in real-space is sufficiently captured. However, we expect that the feedback of this long range magnetic mode onto the electronic self-energy is not correctly described at this cluster size.
V Conclusion
In this work, we have revisited the CDMFT calculations for the single band Hubbard model on the 2D square lattice at half filling. We performed a detailed momentum and real-space analysis of the spectral properties for different cluster sizes of up to sites. Using a systematic benchmark with the exact DiagMC result at the lowest temperature for which it is obtainable, we have shown that an approximation scheme of the lattice self-energy based on the center of the cluster is superior to the conventional periodization approaches based on averages over the cluster. In fact, the broken translational symmetry of the cluster Green’s function and self-energy is simply a manifestation of the bulk-like nature of the central cluster sites, making them the proper basis for the approximation of the respective lattice quantities. We have further shown that the exponential decay of spin-spin correlations is very well captured by CDMFT calculations, even when correlations extend far beyond the size of the cluster. Finally, CDMFT calculations and the CFE extrapolation can be carried out to temperatures currently inaccessible to exact diagrammatic Monte Carlo techniques, making the CDMFT+CFE procedure a powerful computational tool to access the physics of non-local correlations beyond dynamical mean-field theory.
VI Acknowledgments
The authors thank A. Georges, K. Held, J. LeBlanc, A. Toschi, G. Sangiovanni and in particular A.-M. Tremblay for very valuable discussions, and S. Heinzelmann and C. Hille for a critical reading of the manuscript. The Flatiron Institute is a division of the Simons Foundation. We acknowledge financial support from the Deutsche Forschungsgemeinschaft (DFG) through ZUK 63 and Project No. AN 815/6-1. The present work was also supported by the Austrian Science Fund (FWF) through the Erwin-Schrödinger Fellowship J 4266 - ”Superconductivity in the vicinity of Mott insulators” (SuMo, T.S.), as well as the European Research Council for the European Union Seventh Framework Program (FP7/2007-2013) with ERC Grant No. 319286 (QMAC, T.S.) and the Simons Collaboration on the Many-Electron Problem. Calculations were partly performed on the cluster at the MPI for Solid State Research in Stuttgart. The authors acknowledge also the CPHT computer support team for their help.
Appendix A Antiferromagnetic order
In this appendix, we consider antiferromagnetic (AFM) ordering in our CDMFT computations.
In Fig. 10 we provide the phase boundary as determined by the CDMFT with the criterion: AFM order for and PM one for . We consider cluster sizes up to . Due to commensurability with the AFM checkerboard symmetry, we restrict our analysis to even (even though odd clusters could also be easily accessed in self-consistent cycles analogous to AFM single site DMFT). We observe a monotonous reduction of the Néel temperature with increasing cluster size, with a pronounced -dependence: the reduction of in the strong coupling regime is significantly stronger compared to the small region. This reduction is expected, and compatible with the exact Néel temperature of the 2D square lattice, which is known to be from the Mermin-Wagner theorem Mermin and Wagner (1966).
Appendix B Re-periodized spectral functions

In this supplemental section we present directly postprocessed CDMFT data without extrapolation for various cluster sizes. In order to compute momentum dependent spectral functions in the Brillouin zone of the 2D square lattice we follow the cumulant periodization scheme of Ref. Sakai et al., 2012. Instead of periodizing the self-energy directly, its cumulant is periodized to obtain the lattice Green’s function by
| (7) |
with , being the real-space positions of the sites and in the cluster, and the origin in corresponding to the central site for odd and to one of the innermost sites for even. We note that also the application of this scheme turned out to be problematic in some situations - which actually motivates the present analysis to account for the real-space anisotropies of CDMFT - but is used here as a reference since it was shown to perform better than re-periodizations of the self-energy or the Green’s function Sakai et al. (2012).
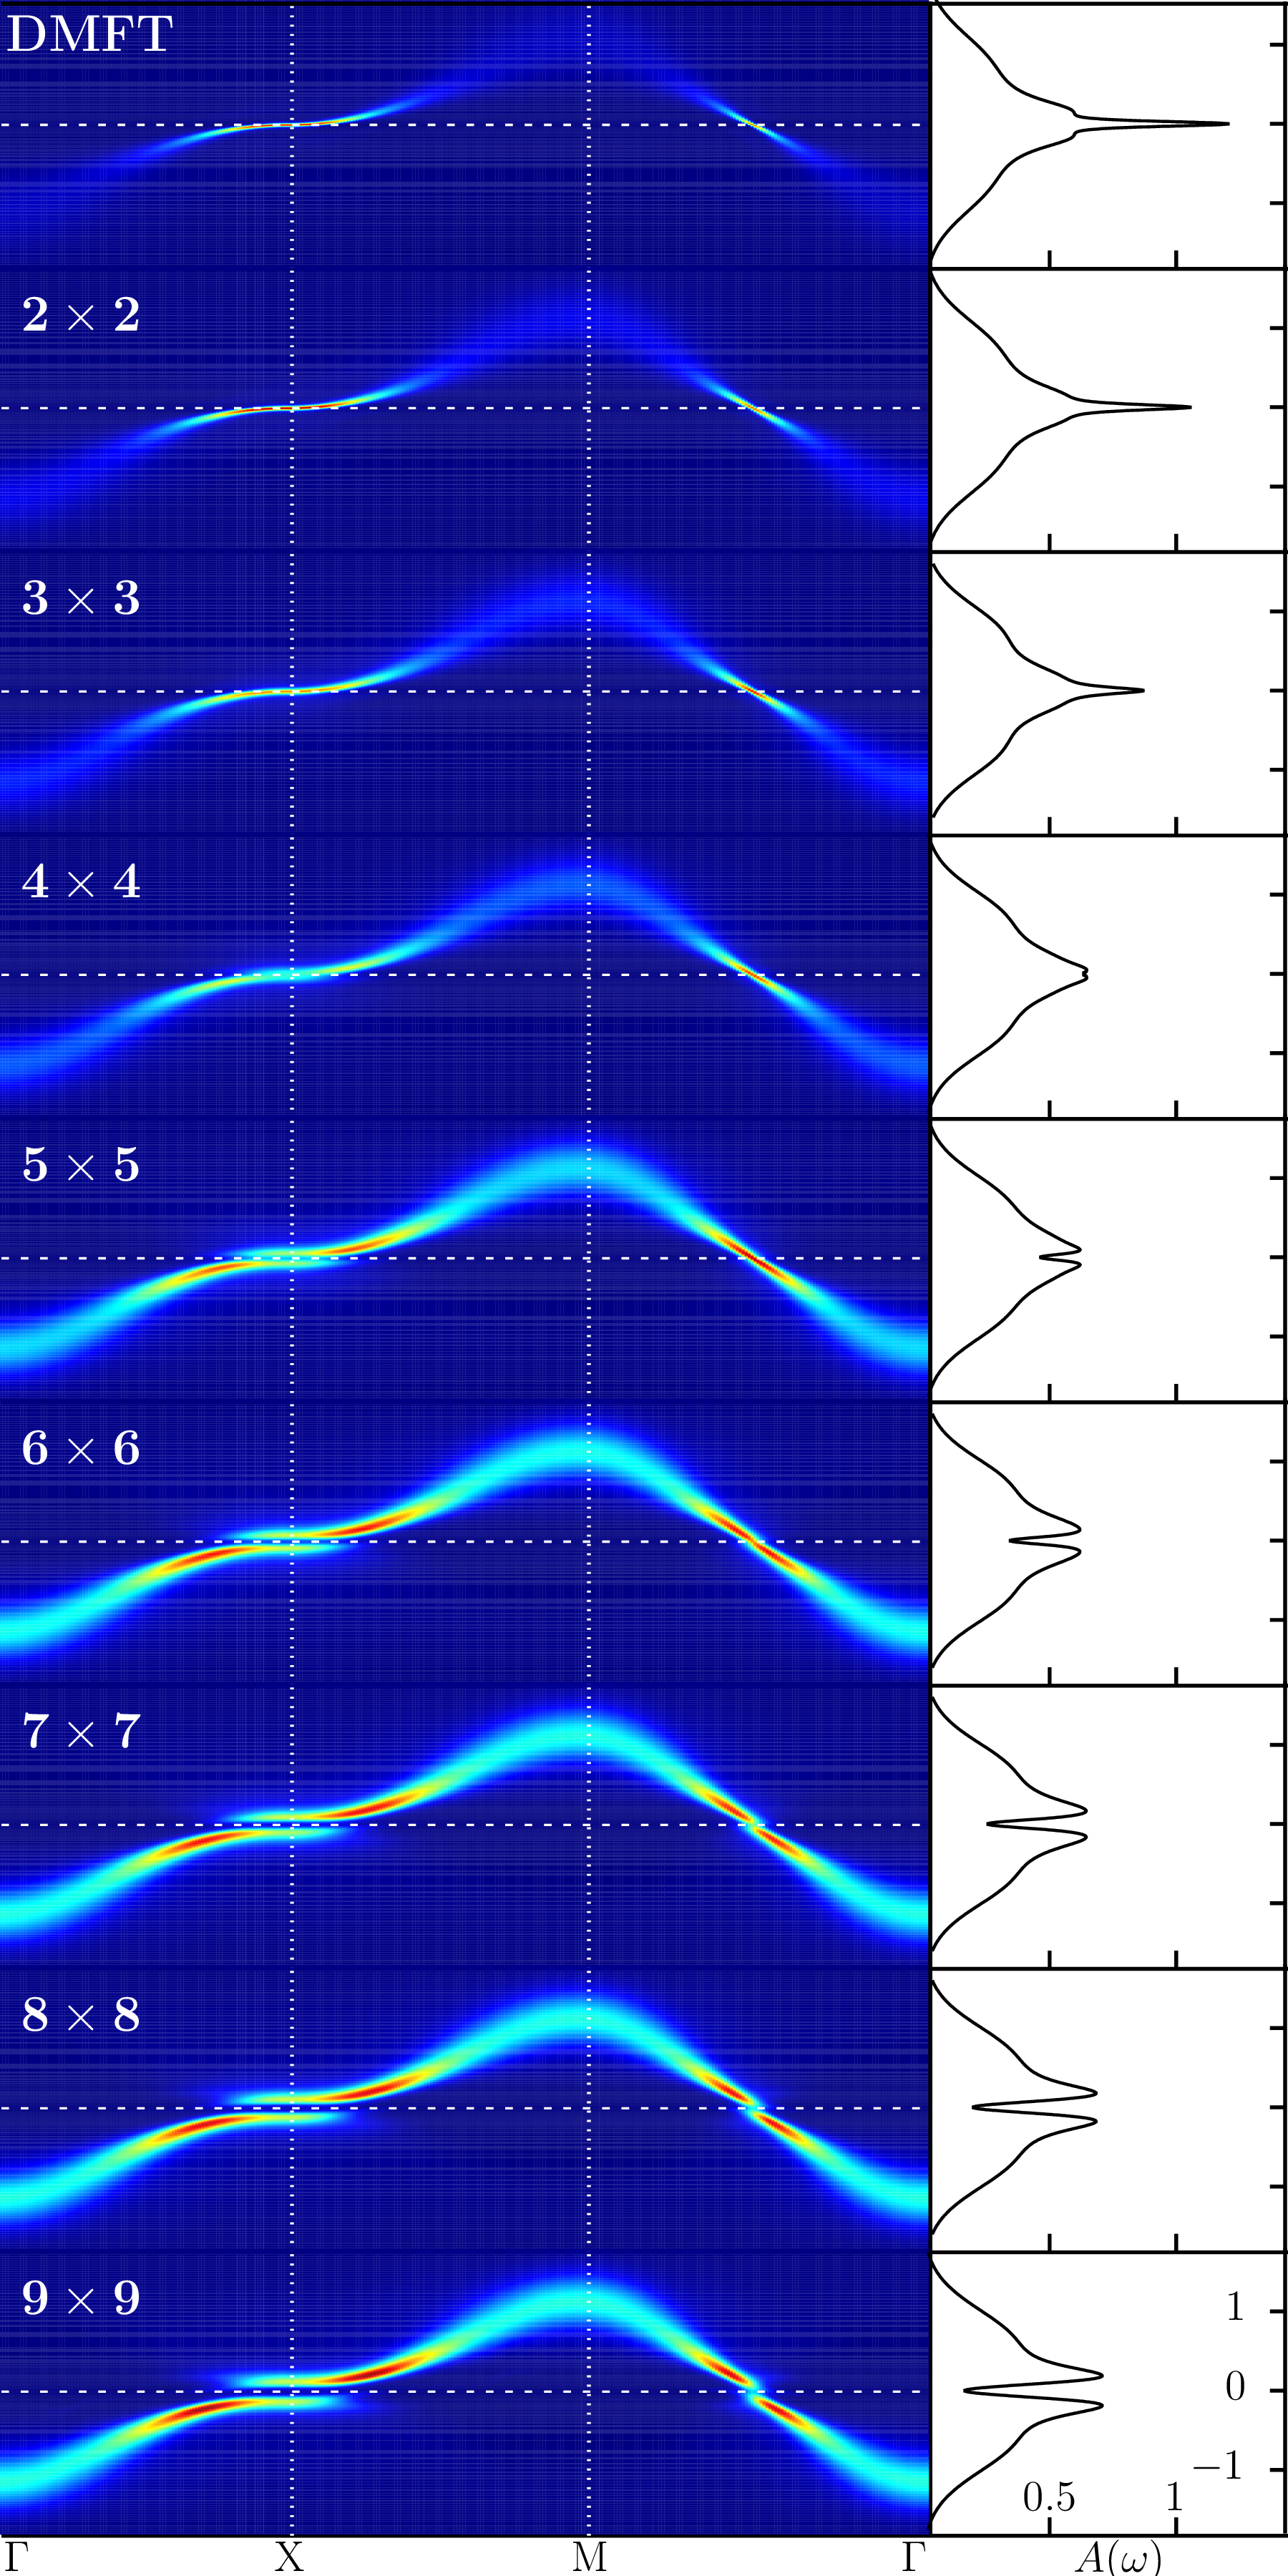
In Fig. 11 we show results for the single-particle spectral function as obtained from CDMFT for and an inverse temperature by employing (7) and subsequent analytical continuation with the Maximum Entropy method Skilling J. (1984); Kraberger et al. (2017). Each of the nine horizontal panels contains a momentum resolved intensity map for (left) on the path --- in the cubic Brillouin zone and the -integrated local spectral function (right). The evolution from top (“DMFT”) to bottom (“”) illustrates the cluster size dependence of the spectrum at fixed interaction and temperature. As function a of , we observe an MIT transition which reflects in as a spectral weight transfer from sharp quasiparticle excitations around the Fermi-level to incoherent Hubbard bands, in agreement with previous studies on smaller cluster sizes Park et al. (2008); Parcollet et al. (2004). However, the opening of the gap in is a gradual process crossing a pseudogap-like regime between and . This effect originates from a momentum selective opening of the gap (see also Ref. Rost et al., 2012). Closer inspection of for the intermediate regime of and clearly reveals the absence of a Fermi surface at the antinodal point , while the quasiparticle band crossing in the nodal direction around remains sharp.
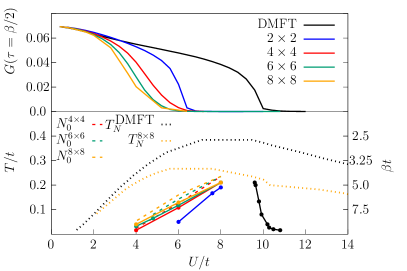
To complement our analysis of the MIT we also study the and dependencies of . Figure 12 shows for and . The temperature dependence, especially of the spectral weight at , indicates the presence of a fully developed gap (in agreement with the corresponding momentum resolved spectrum) which is barely closed by incoherent thermal smearing. Data without analytical continuation are reported in the lower panel of Fig. 13, with .
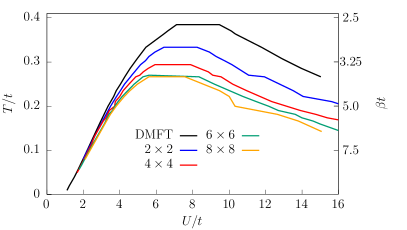
Here our results for the MIT as a function of , , and temperature are summarized. Remarkably, the slope of the vs. transition line is inverted with respect to the single-site DMFT already for the smallest cluster, in agreement with previous works Parcollet et al. (2004). Increasing leads to a simultaneous increase of at fixed and decrease of at fixed which is consistent with previous calculations directly in the thermodynamic limit, e.g. DA Schäfer et al. (2015, 2016) and DiagMC Šimkovic et al. (2020); Kim et al. (2019), where the critical value shows the behavior .
References
- Metzner and Vollhardt (1989) W. Metzner and D. Vollhardt, Phys. Rev. Lett. 62, 324 (1989).
- Georges and Kotliar (1992) A. Georges and G. Kotliar, Phys. Rev. B 45, 6479 (1992).
- Georges et al. (1996) A. Georges, G. Kotliar, W. Krauth, and M. J. Rozenberg, Rev. Mod. Phys. 68, 13 (1996).
- Kotliar et al. (2006) G. Kotliar, S. Y. Savrasov, K. Haule, V. S. Oudovenko, O. Parcollet, and C. A. Marianetti, Rev. Mod. Phys. 78, 865 (2006).
- Hansmann et al. (2013) P. Hansmann, A. Toschi, G. Sangiovanni, T. Saha-Dasgupta, S. Lupi, M. Marsi, and K. Held, Physica Status Solidi (b) 250, 1251 (2013).
- Bednorz and Müller (1986) J. Bednorz and K. Müller, Z. Physik B - Condensed Matter 64, 189 (1986).
- Dagotto (1994) E. Dagotto, Rev. Mod. Phys. 66, 763 (1994).
- Timusk and Statt (1999) T. Timusk and B. Statt, Reports on Progress in Physics 62, 61 (1999).
- Lee et al. (2006) P. A. Lee, N. Nagaosa, and X.-G. Wen, Rev. Mod. Phys. 78, 17 (2006).
- Tamai et al. (2019) A. Tamai, M. Zingl, E. Rozbicki, E. Cappelli, S. Riccò, A. de la Torre, S. McKeown Walker, F. Y. Bruno, P. D. C. King, W. Meevasana, M. Shi, M. Radović, N. C. Plumb, A. S. Gibbs, A. P. Mackenzie, C. Berthod, H. U. R. Strand, M. Kim, A. Georges, and F. Baumberger, Phys. Rev. X 9, 021048 (2019).
- Löhneysen et al. (2007) H. v. Löhneysen, A. Rosch, M. Vojta, and P. Wölfle, Rev. Mod. Phys. 79, 1015 (2007).
- Büttgen et al. (2010) N. Büttgen, H. Krug von Nidda, W. Kraetschmer, A. Günther, S. Widmann, S. Riegg, A. Krimmel, and A. Loidl, J. of Low Temp. Phys. 161, 148 (2010).
- Gegenwart et al. (2008) P. Gegenwart, Q. Si, and F. Steglich, Nature Physics 4, 186–197 (2008).
- Hettler et al. (1998) M. H. Hettler, A. N. Tahvildar-Zadeh, M. Jarrell, T. Pruschke, and H. R. Krishnamurthy, Phys. Rev. B 58, R7475 (1998).
- Hettler et al. (2000) M. H. Hettler, M. Mukherjee, M. Jarrell, and H. R. Krishnamurthy, Phys. Rev. B 61, 12739 (2000).
- Aryanpour et al. (2002) K. Aryanpour, M. H. Hettler, and M. Jarrell, Phys. Rev. B 65, 153102 (2002).
- Maier et al. (2005a) T. Maier, M. Jarrell, T. Pruschke, and M. H. Hettler, Rev. Mod. Phys. 77, 1027 (2005a).
- Lichtenstein and Katsnelson (2000) A. I. Lichtenstein and M. I. Katsnelson, Phys. Rev. B 62, R9283 (2000).
- Kotliar et al. (2001) G. Kotliar, S. Y. Savrasov, G. Pálsson, and G. Biroli, Phys. Rev. Lett. 87, 186401 (2001).
- Biroli et al. (2004) G. Biroli, O. Parcollet, and G. Kotliar, Phys. Rev. B 69, 205108 (2004).
- Vučičević et al. (2018) J. Vučičević, N. Wentzell, M. Ferrero, and O. Parcollet, Phys. Rev. B 97, 125141 (2018).
- Parcollet et al. (2004) O. Parcollet, G. Biroli, and G. Kotliar, Phys. Rev. Lett. 92, 226402 (2004).
- Stanescu et al. (2006) T. D. Stanescu, M. Civelli, K. Haule, and G. Kotliar, Annals of Physics 321, 1682 (2006).
- Sakai et al. (2012) S. Sakai, G. Sangiovanni, M. Civelli, Y. Motome, K. Held, and M. Imada, Phys. Rev. B 85, 035102 (2012).
- Park et al. (2008) H. Park, K. Haule, and G. Kotliar, Phys. Rev. Lett. 101, 186403 (2008).
- Fratino et al. (2017) L. Fratino, P. Sémon, M. Charlebois, G. Sordi, and A.-M. S. Tremblay, Phys. Rev. B 95, 235109 (2017).
- Walsh et al. (2019a) C. Walsh, P. Sémon, D. Poulin, G. Sordi, and A.-M. S. Tremblay, Phys. Rev. Lett. 122, 067203 (2019a).
- Walsh et al. (2019b) C. Walsh, P. Sémon, D. Poulin, G. Sordi, and A.-M. S. Tremblay, Phys. Rev. B 99, 075122 (2019b).
- Foley et al. (2019) A. Foley, S. Verret, A.-M. S. Tremblay, and D. Sénéchal, Phys. Rev. B 99, 184510 (2019).
- Vučičević et al. (2019) J. Vučičević, J. Kokalj, R. Žitko, N. Wentzell, D. Tanasković, and J. Mravlje, Phys. Rev. Lett. 123, 036601 (2019).
- Civelli et al. (2008) M. Civelli, M. Capone, A. Georges, K. Haule, O. Parcollet, T. D. Stanescu, and G. Kotliar, Phys. Rev. Lett. 100, 046402 (2008).
- Ferrero et al. (2010) M. Ferrero, O. Parcollet, A. Georges, G. Kotliar, and D. N. Basov, Phys. Rev. B 82, 054502 (2010).
- Gull et al. (2013) E. Gull, O. Parcollet, and A. J. Millis, Phys. Rev. Lett. 110, 216405 (2013).
- Maier et al. (2004) T. A. Maier, M. Jarrell, A. Macridin, and C. Slezak, Phys. Rev. Lett. 92, 027005 (2004).
- Maier et al. (2005b) T. A. Maier, M. Jarrell, T. C. Schulthess, P. R. C. Kent, and J. B. White, Phys. Rev. Lett. 95, 237001 (2005b).
- Gull et al. (2010) E. Gull, M. Ferrero, O. Parcollet, A. Georges, and A. J. Millis, Phys. Rev. B 82, 155101 (2010).
- Yang et al. (2011a) S.-X. Yang, H. Fotso, S.-Q. Su, D. Galanakis, E. Khatami, J.-H. She, J. Moreno, J. Zaanen, and M. Jarrell, Phys. Rev. Lett. 106, 047004 (2011a).
- Okamoto et al. (2010) S. Okamoto, D. Sénéchal, M. Civelli, and A.-M. S. Tremblay, Phys. Rev. B 82, 180511 (2010).
- Ferrero et al. (2009) M. Ferrero, P. S. Cornaglia, L. D. Leo, O. Parcollet, G. Kotliar, and A. Georges, EPL (Europhysics Letters) 85, 57009 (2009).
- Toschi et al. (2007) A. Toschi, A. A. Katanin, and K. Held, Phys. Rev. B 75, 045118 (2007).
- Katanin et al. (2009) A. A. Katanin, A. Toschi, and K. Held, Phys. Rev. B 80, 075104 (2009).
- Valli et al. (2010) A. Valli, G. Sangiovanni, O. Gunnarsson, A. Toschi, and K. Held, Phys. Rev. Lett. 104, 246402 (2010).
- Rohringer et al. (2011) G. Rohringer, A. Toschi, A. Katanin, and K. Held, Phys. Rev. Lett. 107, 256402 (2011).
- Rubtsov et al. (2008) A. N. Rubtsov, M. I. Katsnelson, and A. I. Lichtenstein, Phys. Rev. B 77, 033101 (2008).
- Hafermann et al. (2009) H. Hafermann, G. Li, A. N. Rubtsov, M. I. Katsnelson, A. I. Lichtenstein, and H. Monien, Phys. Rev. Lett. 102, 206401 (2009).
- Ayral and Parcollet (2015) T. Ayral and O. Parcollet, Phys. Rev. B 92, 115109 (2015).
- Ayral and Parcollet (2016a) T. Ayral and O. Parcollet, Phys. Rev. B 93, 235124 (2016a).
- Ayral and Parcollet (2016b) T. Ayral and O. Parcollet, Phys. Rev. B 94, 075159 (2016b).
- Vučičević et al. (2017) J. Vučičević, T. Ayral, and O. Parcollet, Phys. Rev. B 96, 104504 (2017).
- Ayral et al. (2017) T. Ayral, J. Vučičević, and O. Parcollet, Phys. Rev. Lett. 119, 166401 (2017).
- Rohringer et al. (2013) G. Rohringer, A. Toschi, H. Hafermann, K. Held, V. I. Anisimov, and A. A. Katanin, Phys. Rev. B 88, 115112 (2013).
- Hague et al. (2004) J. P. Hague, M. Jarrell, and T. C. Schulthess, Phys. Rev. B 69, 165113 (2004).
- Slezak et al. (2009) C. Slezak, M. Jarrell, T. Maier, and J. Deisz, Journal of Physics: Condensed Matter 21, 435604 (2009).
- Yang et al. (2011b) S.-X. Yang, H. Fotso, H. Hafermann, K.-M. Tam, J. Moreno, T. Pruschke, and M. Jarrell, Phys. Rev. B 84, 155106 (2011b).
- Taranto et al. (2014) C. Taranto, S. Andergassen, J. Bauer, K. Held, A. Katanin, W. Metzner, G. Rohringer, and A. Toschi, Phys. Rev. Lett. 112, 196402 (2014).
- Rohringer et al. (2018) G. Rohringer, H. Hafermann, A. Toschi, A. A. Katanin, A. E. Antipov, M. I. Katsnelson, A. I. Lichtenstein, A. N. Rubtsov, and K. Held, Rev. Mod. Phys. 90, 025003 (2018).
- Wu et al. (2017) W. Wu, M. Ferrero, A. Georges, and E. Kozik, Phys. Rev. B 96, 041105 (2017).
- LeBlanc et al. (2015) J. P. F. LeBlanc, A. E. Antipov, F. Becca, I. W. Bulik, G. K.-L. Chan, C.-M. Chung, Y. Deng, M. Ferrero, T. M. Henderson, C. A. Jiménez-Hoyos, E. Kozik, X.-W. Liu, A. J. Millis, N. V. Prokof’ev, M. Qin, G. E. Scuseria, H. Shi, B. V. Svistunov, L. F. Tocchio, I. S. Tupitsyn, S. R. White, S. Zhang, B.-X. Zheng, Z. Zhu, and E. Gull (Simons Collaboration on the Many-Electron Problem), Phys. Rev. X 5, 041041 (2015).
- Stanescu and Kotliar (2006) T. D. Stanescu and G. Kotliar, Phys. Rev. B 74, 125110 (2006).
- Sénéchal et al. (2000) D. Sénéchal, D. Perez, and M. Pioro-Ladrière, Phys. Rev. Lett. 84, 522 (2000).
- Prokof’ev and Svistunov (1998) N. V. Prokof’ev and B. V. Svistunov, Phys. Rev. Lett. 81, 2514 (1998).
- Van Houcke et al. (2010) K. Van Houcke, E. Kozik, N. Prokof’ev, and B. Svistunov, Physics Procedia 6, 95 (2010).
- Kozik et al. (2010) E. Kozik, K. Van Houcke, E. Gull, L. Pollet, N. Prokof’ev, B. Svistunov, and M. Troyer, EPL (Europhysics Letters) 90, 10004 (2010).
- Rossi (2017) R. Rossi, Phys. Rev. Lett. 119, 045701 (2017).
- Moutenet et al. (2018) A. Moutenet, W. Wu, and M. Ferrero, Phys. Rev. B 97, 085117 (2018).
- Šimkovic and Kozik (2019) F. Šimkovic and E. Kozik, Phys. Rev. B 100, 121102 (2019).
- Šimkovic et al. (2020) F. Šimkovic, J. P. F. LeBlanc, A. J. Kim, Y. Deng, N. V. Prokof’ev, B. V. Svistunov, and E. Kozik, Phys. Rev. Lett. 124, 017003 (2020).
- Rubtsov and Lichtenstein (2004) A. N. Rubtsov and A. I. Lichtenstein, Journal of Experimental and Theoretical Physics Letters 80, 61 (2004).
- Parcollet et al. (2015) O. Parcollet, M. Ferrero, T. Ayral, H. Hafermann, I. Krivenko, L. Messio, and P. Seth, Computer Physics Communications 196, 398 (2015).
- Sakai et al. (2009) S. Sakai, Y. Motome, and M. Imada, Phys. Rev. Lett. 102, 056404 (2009).
- Staar et al. (2013) P. Staar, T. Maier, and T. C. Schulthess, Phys. Rev. B 88, 115101 (2013).
- Sakai et al. (2016) S. Sakai, M. Civelli, and M. Imada, Phys. Rev. Lett. 116, 057003 (2016).
- Note (1) According to spin-wave theory White et al. (1989) finite-size corrections scale as , which may apply to the half-filled Hubbard model dominated by antiferromagnetic spin fluctuations.
- Mermin and Wagner (1966) N. D. Mermin and H. Wagner, Phys. Rev. Lett. 17, 1133 (1966).
- Skilling J. (1984) R. K. Skilling J., Bryan, Monthly Notices of the Royal Astronomical Society 211 (1984), 10.1093/mnras/211.1.111.
- Kraberger et al. (2017) G. J. Kraberger, R. Triebl, M. Zingl, and M. Aichhorn, Phys. Rev. B 96, 155128 (2017).
- Rost et al. (2012) D. Rost, E. V. Gorelik, F. Assaad, and N. Blümer, Phys. Rev. B 86, 155109 (2012).
- Schäfer et al. (2015) T. Schäfer, F. Geles, D. Rost, G. Rohringer, E. Arrigoni, K. Held, N. Blümer, M. Aichhorn, and A. Toschi, Phys. Rev. B 91, 125109 (2015).
- Schäfer et al. (2016) T. Schäfer, A. Toschi, and K. Held, Journal of Magnetism and Magnetic Materials 400, 107 (2016).
- Kim et al. (2019) A. J. Kim, F. S. IV, and E. Kozik, (2019), arXiv:1905.13337 .
- White et al. (1989) S. R. White, D. J. Scalapino, R. L. Sugar, E. Y. Loh, J. E. Gubernatis, and R. T. Scalettar, Phys. Rev. B 40, 506 (1989).