Present address: ]Institute of Particle and Nuclear Studies, High Energy Accelerator Research Organization (KEK), Tsukuba, Japan
RHICf Collaboration
Transverse single-spin asymmetry for very forward neutral pion production in polarized collisions at GeV
Abstract
Transverse single-spin asymmetries of very forward neutral pions generated in polarized collisions allow us to understand the production mechanism in terms of perturbative and non-perturbative strong interactions. During 2017 the RHICf Collaboration installed an electromagnetic calorimeter in the zero-degree region of the STAR detector at the Relativistic Heavy Ion Collider (RHIC) and measured neutral pions produced at pseudorapidity larger than 6 in polarized + collisions at = 510 GeV. The large non-zero asymmetries increasing both in longitudinal momentum fraction and transverse momentum have been observed at low transverse momentum GeV/ for the first time at this collision energy. The asymmetries show an approximate scaling in the region where non-perturbative processes are expected to dominate. A non-negligible contribution from soft processes may be necessary to explain the nonzero neutral pion asymmetries.
Although the largest fraction of energy in high-energy hadronic collisions is concentrated in the very forward region, the reaction mechanism there is not well understood, yet. RHIC has an advantage to study the production mechanism via the transverse single-spin asymmetry () of neutral particles in transversely polarized collisions. is defined by or the corresponding azimuthal angular modulation where designates the particle production cross sections in the left (right) side of the polarization direction of the proton beam. Large values of in hadron production have been measured in the forward pseudorapidity () region, 1 4, in a wide range of collision energies Adare:2013ekj ; Abelev:2008af ; Adams:1991rw ; Bonner:1988rv ; Klem:1976ui .
These results have been explained by Transverse Momentum Dependent (TMD) Sivers:1989cc ; Collins:1992kk and higher-twist functions Qiu:1991wg ; Eguchi:2006mc ; Kanazawa:2014dca in an initial or final state effect combined with the transverse motions of quarks and gluons. The TMD functions are used in describing Drell-Yan or weak boson production where the transverse momentum and momentum transfer scales are observed. On the other hand, the higher-twist functions are used in inclusive hadron, photon, or jet production processes where only a single scale in is observed.
Although large asymmetries could be explained by hard processes, recent measurements additionally suggest that they may originate from soft processes such as diffractive scattering. The AnDY experiment reported small values in forward jet production, compared to that of forward hadron production Bland:2013pkt . The difference can be explained not only by the mixture and cancellation of and -quark jets, but potentially also by diffractive effects contributing to the hadron asymmetries.
The STAR experiment also reported a multiplicity dependence of for with the number of detected photons Mondal:2014vla . It showed that the decreases as the event complexity increases and jet-like events show small asymmetries. It poses a question whether the large values of are due to diffractive scattering. This study tries to understand the asymmetries in the region where soft processes dominate by measuring of at very forward rapidities and small .
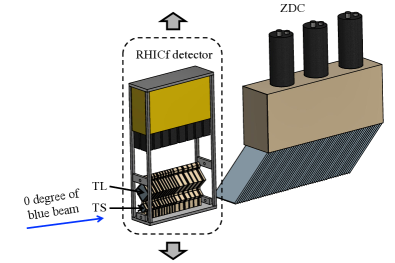
We installed the former LHCf Arm1 detector Adriani:2008zz , now dubbed as RHICf detector, in front of one of the STAR Zero-Degree Calorimeters (ZDC) starzdc , which was located 18 m away from the beam collision point as shown in Fig. 1. At RHIC, the proton bunches rotating clockwise are referred to as ”blue beam” and counterclockwise as ”yellow beam”, and the RHICf detector is located in the downstream side of the blue beam. The direction of 0 degree of the blue beam is also shown in Fig. 1. The RHICf detector consists of the two position-sensitive sampling calorimeters with square shape in the transverse plane, called TS (small tower, with a 20 mm size) and TL (large tower, with a 40 mm size). Each detector consists of 17 tungsten absorbers with a total of 44 radiation le./ngths (or 1.6 nuclear interaction lengths), 16 sampling layers of GSO scintillators, and 4 X-Y pairs of the position layers with multianode PMT readout. Each pair of position layers is composed of 20 (for TS) or 40 (for TL) 1 mm wide GSO bars gsobar . The RHICf detector has an energy resolution of 23 and position resolution of 100150 m for 100250 GeV photons. The two photons from decays can be detected in two different towers (Type-I) or within one tower (Type-II) Adriani:2015iwv . For , the energy resolution at energies of 100250 GeV is 2.53.5 and the resolution in GeV/ is 3.04.5 for both types.
In order to cover a wide range, the data were taken at three vertical positions of the detector where the beam enters (1) the center of the TL, (2) the center of the TS, and (3) 24 mm below the center of the TS. With three configurations, we were able to measure of the very forward s at RHIC in 1.0 GeV/. The measured longitudinal momentum fraction region was larger than . Further limits were imposed by the shadows of the upstream horizontal bending magnet, DX, and the beam pipe, resulting in the accepted pseudorapidity region of . Note that the current RHICf setup kinematically covers a lower region than the PHENIX and STAR measurements, which is beneficial to studying the soft quantum chromodynamics (QCD) effects.
The RHIC proton beams are usually vertically polarized. 111 of 120 bunches are filled with beam spin orientation up or down in fixed bunch patterns. During the RHICf operation in 2017, the direction of the beam polarization was rotated by 90 degrees by using the spin rotator magnets to radial polarization in order to reach maximal sensitivity of and a maximal range covered by the RHICf detector. The polarization ranged from 0.53 to 0.59 with a systematic uncertainty less than 0.02 rhicpol . The center-of-mass energy () was 510 GeV with large value of 8 m to make the angular beam divergence small. As a result, the luminosity of cm-2s-1 in the RHICf operation was smaller than that in usual RHIC operation with a small .
Three kinds of triggers were generally used for the neutral particle measurement. A shower trigger with a large prescale factor of 30 was the baseline trigger. It required hits in three consecutive GSO sampling layers of the TS or TL tower. The Type-I trigger was designed for the entire luminosity without any prescale factor. It required hits in the three consecutive layers in the upstream seven sampling layers of both TS and TL. Finally, the high-energy electromagnetic (high-EM) trigger was designed and optimized for the measurements of high-energy photons and Type-II s. It required a large energy deposit in the fourth sampling layer of the TS or TL, and was operated with a small prescale factor of 2. In total, 1.1 events and an integrated luminosity of about 700 nb-1 were accumulated in four days of the dedicated RHIC operation spanning about 28 hours of data taking.
The hit positions of photons were estimated by fitting a Lorentzian-based function to the energy deposit distribution in the GSO bars. The photon energy was reconstructed based on the correlation between the energy deposit in the detector and its incident energy simulated by GEANT4 geant4 . The position dependent light collection efficiency and shower leakage effect were also considered for the reconstructed hit position. See Ref. Adriani:2015iwv ; LHCf_recon for more details on the correction procedure.
The photon events were separated from neutron background by requiring , where is defined by the longitudinal depth for the measured energy deposit to reach of the total one. The rejection efficiencies for neutron and photon events with the above criterion are and , respectively, based on the GEANT4 simulation using the QGSP-BERT 4.0 model. The neutron contamination in the sample was further suppressed to less than by applying the two photon invariant mass cut which will be described later. Due to the poor energy and position resolutions, the photon hits in the DX magnet shadow region and the regions less than 2 mm from the detector edges were excluded in this analysis. The distribution was analyzed as functions of and and the two-dimensional dependence was investigated. The boundaries of the and bins were determined in such a way that the of all bins were not biased by specific detector position or the types of .
For the forward single-spin asymmetry, only the polarization of the blue beam, the one moving towards the RHICf detector, is taken into account. On the other hand, for the backward asymmetry, where the sign of the is reversed, only the polarization of the yellow beam is taken into account. The value in each and bin was estimated by
| (1) |
where is the beam polarization, is the number of detected in the left (right) side of the beam polarization direction, and is the luminosity ratio of the spin orientations resulting into the events to right and left sides. The value of , ranging from 0.958 to 0.995 was estimated using the charged particle rates tagged by the STAR Beam Beam Counter (BBC) starbbc and Vertex Position Detector (VPD) starvpd . The dilution of the asymmetry in azimuthal angle () of was corrected using the dilution factor defined as
| (2) |
where is the of from the beam polarization direction in the -th event and the is the number of the detected s. In this analysis, only Type-I triggered events were used for the Type-I analysis and high-EM triggered events for the Type-II analysis before combining the asymmetries. In this way, the trigger efficiencies cancel in Eq. (1).
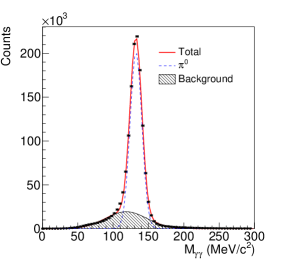
The obtained was corrected for the background contamination and the detector smearing effect. Figure 2 shows the reconstructed invariant mass distribution of the two photons and a clear peak at 135 MeV/ is observed. Most of the background ( 80) comes from accidental coincidences between photons from different s. Another major background is the combinatorial two particle background from direct photons, photons from decays, and mis-identified neutrons. According to the QGSJET II-04 model qgsget , the distribution near the peak is well described by the superposition of the Gaussian (for the peak) and the 6 th order polynomial (for the background) function. The fitted function and their sum are shown in Fig. 2. The width of 3 around the peak position was chosen for the signal+background region, and the regions beyond 5 to the left or right of the peak position were chosen as the pure background regions. The background-to-signal ratio, , was estimated in the signal+background region. It decreases as increases ( at the lowest and at the highest bin) because higher energy s require narrower opening angles, which reduces the acceptance of accidental coincidences.
The background asymmetries were subtracted by
| (3) |
where , , and are the estimated asymmetries in the signal+background, signal only and background only, respectively, regions. According to the Monte-Carlo simulation, the two photon invariant mass distribution has a small tail to the lower mass region due to the underestimated reconstruction energy in a few events. A small fraction (4) of real events in the background region contributes to this tail and the actual can be smaller than the one estimated by the fitting due to these events. Because the probability of the underestimated reconstruction energy increases when the photon hit approaches to the edge of the tower, even larger area along the edge than the one applied for ,with the width of 4 mm, was excluded for the background estimation. With this condition, the tail in the background region almost disappears (). All background asymmetries were consistent with zero within the statistical uncertainties. The variation of for the distributions with and without the tail was considered as one of the systematic uncertainties. The typical size of this uncertainty is 0.0003.
For additional sources of the systematic uncertainty, the variation in the beam center position and the smearing effect for and were considered. The beam center is obtained by extrapolating the direction of the blue beam to the detector as follows. In the first method, the high energy neutron hit distribution was fitted by the two-dimensional Gaussian function. In the second method, the neutron asymmetries were scanned as a function of their mean vertical position by using the fact that very forward neutrons have zero asymmetry at the vertical position of the beam center neutronAN . The difference of the two determined beam centers was less than 1.3 mm and the corresponding systematic uncertainty was 0.00030.0089 depending on and which is assigned to the systematic uncertainty of .
The effect of smearing due to the resolutions of and was studied in detail with GEANT4. The dependence of asymmetries on and were artificially generated using weights. Single s were generated considering the detection efficiencies matching the reconstructed energy and distributions of the data. The simulation was tuned to the data for the beam profile, detector noise, signal attenuation, and measured fluctuations including the cross talk effect in the GSO bars described in Ref. lhcfJINST . The data analysis code was also used in the simulation for the reconstruction of s and the calculation of the asymmetry. The contamination level defined by the ratio of the incorrectly and the legitimately reconstructed events in a given (, ) bin was estimated in the simulation, where the reconstructed and values of the incorrect events were out of the range for the bin and the true values belong to. The contamination level for Type-I and Type-II are all less than , and more than of the migrated events are from and GeV/ of the bin boundaries. The differences between the reconstructed and true , , and values of each bin due to smearing are less than 0.008, 0.009 GeV/, and 0.0015, respectively, which are negligible. This result is in agreement with our expectations because the resolutions of and of the detector are much smaller than the bin sizes.
Furthermore, to find any missing systematic effects having not been considered, the “bunch shuffling” analysis was performed by randomly assigning the bunch numbers given for a fixed polarization pattern. Ideally, the calculated asymmetries and their fluctuations after the bunch shuffling should be centered around zero with the width of the statistical uncertainties of the asymmetries. The bunch shuffled asymmetries were consistent with zero with comparable fluctuations with statistical uncertainties. Therefore, we, finally, concluded that there are no noticeable fake asymmetries introduced in the experiment and analysis.
| (GeV/) | Statistical uncertainty | Systematic uncertainty | |||||
|---|---|---|---|---|---|---|---|
| Total | Beam center | Polarization | Background | ||||
| 0.77 | 0.0025 | 0.0328 | 0.0108 | 0.0107 | 0.0001 | 0.0009 | |
| 0.55 | 0.0105 | 0.0136 | 0.0018 | 0.0017 | 0.0004 | 0.0001 | |
| 0.37 | 0.0076 | 0.0007 | 0.0006 | 0.0003 | 0.0000 | ||
| 0.24 | 0.0088 | 0.0022 | 0.0021 | 0.0002 | 0.0000 | ||
| 0.15 | 0.0078 | 0.0008 | 0.0007 | 0.0002 | 0.0000 | ||
| 0.04 | 0.0175 | 0.0050 | 0.0049 | 0.0009 | 0.0001 | ||
| 0.53 | 0.0350 | 0.0048 | 0.0044 | 0.0020 | 0.0004 | ||
| 0.34 | 0.0079 | 0.0014 | 0.0012 | 0.0006 | 0.0004 | ||
| 0.23 | 0.0001 | 0.0061 | 0.0007 | 0.0006 | 0.0001 | 0.0002 | |
| 0.14 | 0.0047 | 0.0006 | 0.0005 | 0.0001 | 0.0003 | ||
| 0.04 | 0.0004 | 0.0108 | 0.0023 | 0.0022 | 0.0001 | 0.0003 | |
| 0.33 | 0.0198 | 0.0018 | 0.0016 | 0.0006 | 0.0001 | ||
| 0.23 | 0.0073 | 0.0007 | 0.0005 | 0.0004 | 0.0003 | ||
| 0.14 | 0.0030 | 0.0058 | 0.0009 | 0.0007 | 0.0003 | 0.0004 | |
| 0.06 | 0.0109 | 0.0120 | 0.0031 | 0.0027 | 0.0012 | 0.0007 | |
| 0.21 | 0.0045 | 0.0186 | 0.0034 | 0.0033 | 0.0006 | 0.0003 | |
| 0.13 | 0.0047 | 0.0073 | 0.0009 | 0.0009 | 0.0003 | 0.0001 | |
| 0.04 | 0.0181 | 0.0047 | 0.0045 | 0.0009 | 0.0009 | ||
| 0.30 | 0.04 | 0.0167 | 0.0179 | 0.0024 | 0.0023 | 0.0005 | 0.0004 |
| 0.31 | 0.13 | 0.0217 | 0.0068 | 0.0011 | 0.0010 | 0.0006 | 0.0000 |
| 0.31 | 0.21 | 0.0331 | 0.0186 | 0.0044 | 0.0043 | 0.0010 | 0.0002 |
| 0.38 | 0.06 | 0.0061 | 0.0116 | 0.0017 | 0.0015 | 0.0010 | 0.0001 |
| 0.39 | 0.14 | 0.0275 | 0.0049 | 0.0009 | 0.0003 | 0.0009 | 0.0002 |
| 0.39 | 0.23 | 0.0318 | 0.0069 | 0.0012 | 0.0006 | 0.0010 | 0.0003 |
| 0.41 | 0.33 | 0.0777 | 0.0189 | 0.0039 | 0.0019 | 0.0035 | 0.0002 |
| 0.50 | 0.04 | 0.0119 | 0.0107 | 0.0030 | 0.0029 | 0.0007 | 0.0001 |
| 0.51 | 0.14 | 0.0321 | 0.0045 | 0.0013 | 0.0007 | 0.0011 | 0.0000 |
| 0.50 | 0.23 | 0.0637 | 0.0053 | 0.0017 | 0.0006 | 0.0016 | 0.0001 |
| 0.52 | 0.34 | 0.0654 | 0.0076 | 0.0024 | 0.0017 | 0.0017 | 0.0002 |
| 0.54 | 0.53 | 0.0811 | 0.0342 | 0.0054 | 0.0040 | 0.0036 | 0.0006 |
| 0.64 | 0.04 | 0.0174 | 0.0061 | 0.0060 | 0.0007 | 0.0000 | |
| 0.66 | 0.15 | 0.0561 | 0.0071 | 0.0025 | 0.0014 | 0.0021 | 0.0001 |
| 0.66 | 0.24 | 0.0773 | 0.0087 | 0.0030 | 0.0018 | 0.0024 | 0.0001 |
| 0.68 | 0.37 | 0.0801 | 0.0068 | 0.0024 | 0.0011 | 0.0022 | 0.0002 |
| 0.70 | 0.55 | 0.1237 | 0.0134 | 0.0038 | 0.0012 | 0.0036 | 0.0004 |
| 0.79 | 0.77 | 0.2067 | 0.0321 | 0.0124 | 0.0081 | 0.0092 | 0.0019 |
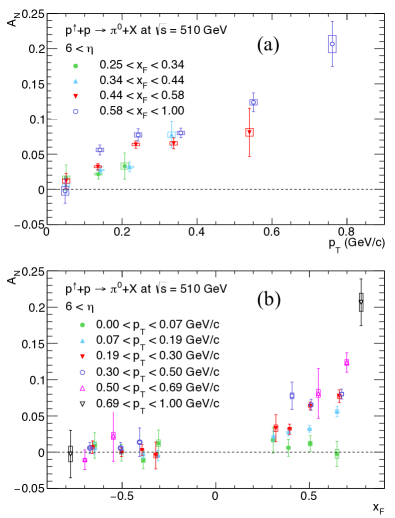
Figure 3 and Table 1 summarize the values of very forward s as functions of and . In addition to the systematic effects described above, additional systematic uncertainties of 0.00050.0092 were caused by the variation of the determined beam polarization. Because all discussed systematic uncertainties are independent, the quadratic sums of them are considered as the total systematic uncertainties. The uncertainties of the dilution factors are not included because its magnitude is less than 0.0001.
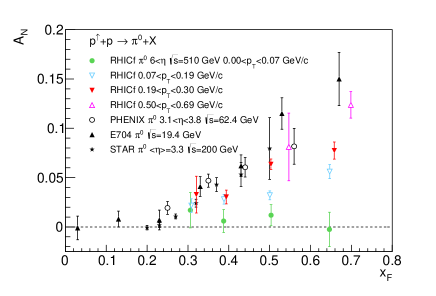
Figure 3(a) shows that of the very forward s increases with reaching about 0.2 at 0.8 GeV/, where the production mechanism is mainly governed by non-perturbative QCD. Figure 3(b) shows that the backward distributions are consistent with zero. Similarly, the forward is consistent with zero in 0.07 GeV/ but it starts to increase as a function of at higher . The comparison with the previous forward measurements is depicted in Fig. 4 fermipi0 ; phenixpi0 ; starpi0 . It shows that the increasing trend of the very forward asymmetry is comparable to the previous measurements at higher region from FNAL and RHIC that were successfully described by hard processes for the production in polarized collisions Kanazawa:2014dca . The current results are the first measurement showing the onset of the rising asymmetry at GeV/ at RHIC energy. The present data with the previous STAR data Mondal:2014vla raise the interesting question on the relation between the soft and hard process contributions for of s. The same question also applies to the similar scaling phenomenon for the charged pion asymmetries at lower of ZGS zgs and AGS ags and that at higher of FNAL and RHIC. To answer this question, it is desired to investigate the same observables in the unexplored kinematic region between the low and high values of 0.82.0 GeV/.
A clear non-zero in the RHICf data at low and the same scaling with the previous measurements for forward s indicate that the diffractive processes may also contribute to the asymmetries at higher where the hard processes are expected to be dominant. For more detailed studies, STAR’s central detectors and Roman pots romanpot will be helpful to understand the mechanism for the asymmetries and the relative contributions of the soft and hard processes.
In summary, the single-spin asymmetries of very forward s have been measured by the RHICf detector at the zero-degree area of the STAR detector at RHIC in polarized collisions at = 510 GeV. Large values up to 0.2 were observed in the very forward region for GeV/. The empirical scaling was also observed in GeV/ which is similar to the data at higher region.
We thank the staff of the Collider-Accelerator Department at Brookhaven National Laboratory, the STAR Collaboration and the PHENIX Collaboration to support the experiment. We especially acknowledge the essential supports from the STAR members for the design and the construction of the detector manipulator, installation/uninstallation, integration of the data acquisition system, operation and management of all these collaborative activities. This program is partly supported by the Japan-US Science and Technology Cooperation Program in High Energy Physics, JSPS KAKANHI (Nos. JP26247037 and JP18H01227), the joint research program of the Institute for Cosmic Ray Research (ICRR), University of Tokyo, and the National Research Foundation of Korea (Nos. 2016R1A2B2008505 and 2018R1A5A1025563).
References
- (1) A. Adare et al. (PHENIX Collaboration), Phys. Rev. D 90, 012006 (2014).
- (2) B. I. Abelev et al. (STAR Collaboration), Phys. Rev. Lett. 101, 222001 (2008).
- (3) D. L. Adams et al. (E581 and E704 Collaborations), Phys. Lett. B 261, 201 (1991).
- (4) B. E. Bonner et al., Phys. Rev. Lett. 61, 1918 (1988).
- (5) R. D. Klem et al., Phys. Rev. Lett. 36, 929 (1976).
- (6) D. W. Sivers, Phys. Rev. D 41, 83 (1990).
- (7) J. C. Collins, Nucl. Phys. B 396, 161 (1993)
- (8) J. W. Qiu and G. F. Sterman, Nucl. Phys. B 378, 52 (1992).
- (9) H. Eguchi, Y. Koike and K. Tanaka, Nucl. Phys. B 763, 198 (2007).
- (10) K. Kanazawa, Y. Koike, A. Metz and D. Pitonyak, Phys. Rev. D 89, 111501 (2014)
- (11) L. C. Bland et al. (AnDY Collaboration), Phys. Lett. B 750, 660 (2015).
- (12) M. M. Mondal (STAR Collaboration), PoS DIS 2014, 216 (2014).
- (13) O. Adriani et al. (LHCf Collaboration), Phys. Rev. D 94, 032007 (2016).
- (14) C. Adler et al. Nucl. Intru. Meth. A 470, 488 (2001).
- (15) T. Suzuki et al., JINST 8 T01007 (2013).
- (16) O. Adriani et al. (LHCf Collaboration), Phys. Rev. D 94, 032007 (2016).
-
(17)
RHIC p-Carbon Measurements,
https://www.phy.bnl.gov/cnipol/rundb/. - (18) The Geant4 Collaboration, Nucl. Instrum. Meth. 506, 250 (2003).
- (19) O. Adriani et al. (LHCf Collaboration) Phys. Lett. B 703, 128 (2011).
- (20) C. A. Whitten Jr. et al. (STAR Collaboration), The Beam-Beam Counter: A Local Polarimeter at STAR, https://www.star.bnl.gov/eca/LocalPol.
- (21) W. J. Llope et al., The STAR Vertex Position Detector, arXiv:1403.6855 [physics.ins-det].
- (22) S. Ostapchenko, Nucl. Phys. Proc. Suppl. 151, 143 (2006).
- (23) A. Adare et al. (PHENIX Collaboration), Phys. Rev. D 88, 032006 (2013).
- (24) Y. Makino et al. (LHCf Collaboration), JINST 12, P03023 (2017).
- (25) D. L. Adams et al. (FNAL-E581 and E704 Collaborations), Phys. Lett. B 261, 201 (1991).
- (26) A. Adare et al. (PHENIX Collaboration), Phys. Rev. D 90, 012006 (2014).
- (27) B. I. Abelev et al. (STAR Collaboration), Phys. Rev. D 101, 222001 (2008).
- (28) R. D Kelm et al., Phys. Rev. Lett. 36, 929 (1976).
- (29) C. E. Allgower et al. (E925 Collaboration), Phys. Rev. D 65, 092008 (2002).
- (30) S. Bltmann et al. Nucl. Instrum. Meth. 535, 415 (2004).