Effects of the body force on the pedestrian and the evacuation dynamics
Abstract
The Social Force Model (SFM) is a suitable model for describing crowd behaviors under emotional stress. This research analyzes the role of the body force in the original SFM. We focused on the parameter associated with the body stiffness () and its impact on the pedestrian dynamics for two different geometries: bottlenecks and corridors. Increasing produces opposite effects on the crowd dynamics for each geometry: an increase of the crowd velocity for bottlenecks, and a decrease for corridors. The former reflects the fact that an increase in the stiffness reduces the overlap between pedestrians and, as a consequence, the sliding friction is diminished. This phenomenon reduces the number of blocking clusters close to the exit door. In the case of the corridor, instead, due to the confining walls, the pedestrians get tight into a lattice-like configuration due to space limitations. The friction interaction with the walls determines the velocity of the whole crowd along the corridor. Additionally, the corridor geometry generates a flux slowing down for very crowded environments, as observed in many real-life situations. We also explored the dimensionless parameters that arose from the reduced-in-units equation of motion and tuned them to reproduce the qualitative behavior of the empirical fundamental diagram.
keywords:
Pedestrian Dynamics , Social Force Model , Body ForcePACS:
45.70.Vn , 89.65.Lm1 Introduction
The Social Force Model (SFM) models the crowd dynamics considering three kinds
of forces: desired forces, social forces, and physical forces. In its original
version, the SFM, addresses two physical forces as essential: the “body
force” and the “sliding friction”. Both are inspired by granular
interactions and were claimed to be necessary for attaining the particular
effects in panicking crowds [1]. The “sliding friction”
actually proved to be an essential feature of the “faster-is-slower” effect,
although the role of the “body force” appears, at a first instance, not so
clear [2, 3, 4].
The existence of a “body force” in the context of highly dense crowds (say,
more than 5 people/m2) is a commonsense matter
[5, 6]. Researchers, however, question the numerical
setting for this force in the SFM context [7]. As a matter of
fact, the usual set of parameters provided by Helbing prevents the excessive
overlapping among pedestrians, but it is known to accomplish artificially high
force levels [1, 7, 8, 9]. The force
estimates from the SFM appear to be remarkably higher with respect to the
reported real life data (say, an order of magnitude). The crowd motion
simulations, however, present realistic results
[7, 8, 10]. The point seems to be that the SFM
focuses on the “collective behavior” due to clogging, missing the
“individualistic” perspective of single pedestrians or very small groups
[1, 5, 11].
Many researchers realized that modifying the SFM may (partially) fix the
misleading results. It was proposed that the pedestrians’ psychological force
(say, the “social force”) should be suppressed in the context of highly dense
crowds [12, 13, 14, 15], or
smoothly quenched according to the crowd density [16]. The authors
in Refs. [17, 18] further proposed a rigid body model
in order to completely avoid the overlapping phenomenon. This perspective
dismisses any connection to a “sliding friction”. Conversely, other authors
tried to limit the pedestrians acceleration by introducing “static friction”
between the pedestrians and the floor [19]. This kind of friction,
however, reduces the effective willings of the pedestrians.
A unique (and universal) set of parameters appears not available yet to our
knowledge. The reason is that different numerical sets of parameters can lead
to the same crowd dynamics. Actually, only a small set of dimensionless
“numbers” control the crowd dynamics [20]. These are similar to
those encountered in other active matter systems (Péclet number, etc.)
[21]. We may hypothesize that while the dimensionless
parameters provide some kind of control on the collective behavior in crowds,
only a few numerical set of parameters can attain an “individualistic”
meaning.
The numerical parameters for the “faster is slower” effect presented by
Helbing and co-workers appears to have some drawbacks
Ref. [1, 10, 20]. Although a single parameter
(say, the desired velocity ) is numerically varied to explain the
phenomenon, the researcher may loose sight of the dimensionless “numbers”
that truly control the crowd dynamics. The set of parameters in
Ref. [1] also misses the “faster is faster” effect reported
to occur at very high pedestrian densities [10, 22].
Moreover, the empirical fundamental diagram raises as a point of reference for
the SFM control parameters [23, 10].
The fundamental diagram exhibits the flux behavior for either low density crowds
(with rare contacts between pedestrians) and highly dense crowds (dominated by
two body interactions). In the second case, crowds experience a flux slowing
down, but other behaviors are also possible [23, 24]. We
may suspect that the modeling of the “flux slowing down” within the context
of the SFM will require the proper setting of the (dimensionless) controlling
parameters. This working hypothesis was already examined in
Ref. [20], but the parameter exploration was limited to the
sliding friction, disregarding the body force. In this paper, we widen the
investigation on the set of parameters to include the one associated to the
body force. We will explore the complex interplay between the body force and
the sliding friction among pedestrians. Recall that the interplay dynamics is
not directly controlled by the set of parameters, but through dimensionless
“numbers”, where the model parameters appear mixed between each other. Thus,
this step up offers a challenge to the “individualistic” meaning of the
parameter’s set.
The paper is organized as follows. We first recall the available experimental values on the body force and the sliding friction (see Section 2). Secondly, we introduce the reduced-in-units SFM and the three dimensionless numbers that control the crowd dynamics (see Section 3). We present our numerical simulations in Section 5. For the sake of clarity, this Section is separated into three major parts: the bottleneck scenario, the corridor scenario and the comparison with empirical data in Sections: 5.1, 5.2 and 5.3, respectively. Section 6 opens a detailed discussion from results in Section 5 and resumes our main conclusions.
2 Experimental background
The complex behavior of pedestrians features either his (her) feelings and the environmental conditions. The former is expressed, for example, by his (her) moving “attitude” (say, relaxed, normal, aggressive, etc). The latter brings out the observed separation between pedestrians. Also, the “contacts” between individuals produce some kind of “unwanted” slowing down. All these observed patterns are commonly quantified in the literature into a set of characteristic parameters. It is worth mentioning that the empirical data reported in this Section corresponds to non-panicking situations in which pedestrians do not experience high anxiety levels (see below). The experimental meaning of these parameters is as follows.
- (i)
-
(ii)
Despite the reactive attitude , the pedestrian adopts a “free” (undisturbed) walking speed . This speed expresses his (her) motivation or intention to reach a certain destination (as comfortable as possible). Observations commonly associate m/s, m/s or m/s to relaxed, normal or nervous walking speeds, respectively [25, 1, 27]. Nevertheless, when pedestrians are in a panic situation, they may not reach the “free” walking speed, but, may still be associated to his (her) motivation to get to a target position.
-
(iii)
The walking speed of pedestrians appears to be lower in a crowded walkway with respect to their usually expected “free” walking speeds [28, 7]. Pedestrians tend to reduce their speed within crowded environments because they perceive not enough space for taking a step [26]. This (perceived) step distance is therefore an influential parameter on the pedestrians behavior. It is known as the characteristic length .
-
(iv)
Physical interactions occur in very crowded environments. The “body force” and “sliding friction” can be introduced straight forward. This will be done in Section 3. But it is worth noting that both are associated to the moving difficulties (say, slowing down and obstructions) observed in contacting pedestrians.
Table 1 shows a few empirical values for the most common
parameters. More data is available throughout the literature (see, for example,
Refs. [29, 30, 31, 32, 33, 34, 27] ). We intentionally omitted data that assumes a
specific mathematical model. The exhibited values should also be considered as a
general purpose approach, since no distinction has been made on age, gender or
cultural habits.
| [s] | [kg] | [m/s] | [m] | [kg/s2] | Refs. |
|---|---|---|---|---|---|
| 0.61 | — | 1.24 | — | [30] | |
| 0.50∗ | 80∗ | 1.34 | 0.50 | — | [28, 7] |
| — | 1.39 | — | [16] | ||
| — | 1.39 | — | [16] |
A first examination of the figures in Table 1 shows that the
choice s seems to be a reasonable estimation for the
relaxation time, although this may vary with respect to gender or culture
[35]. Additionally, we confirm that normal pedestrians attain
desired velocities around m/s.
The reports from Refs. [30, 28] do not include any
values for the compressibility since these experiments were carried out
under low density and non-panicking conditions. The minimum (perceived) step
distance is m according to Ref. [30], but the
pedestrians seem to require larger distances when they walk faster. The
commonly accepted value m is somewhat valid for walking speeds
under m/s and non-panicking conditions [30]. Higher
walking speeds (say, m/s) will require a step distance of m for the
pedestrians to feel that there is enough space to move along.
The reported data from Ref. [16] correspond to the crowded
environment of the Beijing subway. This environment was not suitable for
providing information on the step distance , but estimates for the desired
speed and the body compressibility could be achieved. The reported magnitude
assesses either the clothes and the body compressibility. The final
value, though, is linearly related to the compression (overlap) .
We measured contact forces during the spring of 2019 at the subway in Buenos
Aires, Argentina. Our preliminary results show that pedestrians feel
“uncomfortable” whenever a body force ranging from to N is applied
for at least ten minutes. Short lasting forces (say, less than 4 minutes) may
also be perceived as “uncomfortable” for values ranging from to N.
We also recorded body forces up to N during very short “hits”. The
comparison with the fittings provided by Ref. [16] shows that these
magnitudes accomplish densities around 5 people/m2.
The maximum (realistic) overlap may be computed from the Hooke’s relation
and the compressibility reported in
Table 1. An “uncomfortable” body force N N
can address overlap values in the range of m. Also, a
“hitting” force of N can address overlap values between and
m. Besides, no reliable values for the sliding friction appears
to be available in the literature (to our knowledge).
3 Theoretical background
3.1 The Social Force Model
The Social Force Model (SFM) provides a necessary framework for simulating the collective dynamics of pedestrians (i.e. self-driven particles). The pedestrians are considered to follow an equation of motion involving either “socio-psychological” forces and physical forces (say, granular forces). The equation of motion for any pedestrian (of mass ) reads
| (1) |
where the subscript corresponds to any neighboring pedestrian or
the walls. The three forces , and
are different in nature. The desire force represents the
acceleration (or deceleration) of the pedestrian due to his (her) own will. The
social force , instead, describes the tendency of the pedestrians
to stay away from each other. The granular force stands for both
the sliding friction and the compression between pedestrians.
Notice that these forces are supposed to influence the behavior of the
pedestrians in a similar fashion as mentioned in Section 2.
Thus, the set of (empirical) parameters described in Section 2
is expected to be also present in the SFM. These will appear in connection to
the forces.
The pedestrians’ own will is modeled by the desire force . This force stands for the acceleration (deceleration) required to move at the desired walking speed . This involves, however, a personal attitude that makes him (her) appear more or less “assertive”. As mentioned in Section 2, the reaction time reflects this attitude. Thus, the desire force is modeled as follows
| (2) |
where represents the unit vector pointing to the
target position. stands for the pedestrian velocity at time .
The tendency of any individual to preserve his (her) “private sphere” is accomplished by the social force . This force is expected to prevent the pedestrians from getting too close to each other (or to the walls) in a any environment. The model for this kind of “socio-psychological” behavior is as follows
| (3) |
where means the distance between the center of mass of the
pedestrians and , and is the sum of the pedestrians
radius. The unit vector points from pedestrian to
pedestrian , meaning a repulsive interaction.
The net distance (overlap) scales to the parameter in the
expression (3). This parameter plays the role of a fall-off
length within the model, and thus, it may be somewhat connected to the
(perceived) step distance mentioned in Section 2. Besides, the
parameter reflects the intensity of the social repulsion.
The granular force (say, the sliding friction plus the body force) reflects the moving difficulties encountered in very crowded environments. The expression for the granular force has been borrowed from the granular matter field, the mathematical expression reads as follows
| (4) |
where equals if and
vanished otherwise.
represents the relative tangential velocities of the sliding bodies (or between
the individual and the walls).
The sliding friction occurs in the tangential direction while the body force
occurs in the normal direction. Both are assumed to be linear with respect to
the net distance between contacting pedestrians. The sliding friction is also
linearly related to the difference between the (tangential) velocities. The
coefficients (for the sliding friction) and (for the body force)
are supposed to be related to the areas of contact and the clothes material,
among others.
We stress that the expression (4) assumes fixed values for
(and ). This may not be completely true according to
Table 1. The local density (and thus, the pedestrians’
compression) may affect the compressibility parameter by more than an
order of magnitude. We will vary (and ) in order to explore this
phenomenon.
3.2 The set of parameters
The numerical set of parameters may affect the dynamics of the pedestrians.
Some values, however, yield similar collective dynamics. We introduce
dimensionless magnitudes and proceed straightforward as indicated in
A. We realize from A that only three
(dimensionless) parameters are the true “control” parameters for the
collective dynamics. These are , , as
defined in A. Recall that and are
precisely the same as in Ref. [20], but a novel
parameter has been introduced due to the body force.
The logical relations between the dimensionless parameters and the
“individual” parameters can be studied by means of the Venn diagrams
exhibited in Fig. 1. The parameters ,
and are represented as intersecting sets, and the
“individual” parameters are represented as elements within each set. The
shared elements between , and are
placed inside the intersecting regions.
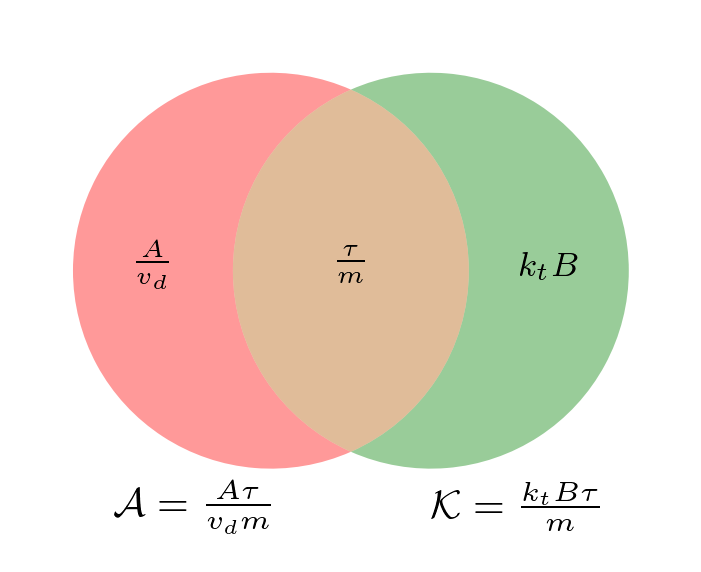
A first inspection of the diagrams in Fig. 1 shows that the
relaxation time (per unit mass) is always a common parameter to all
sets, regardless of the body force. This means that the “assertive” attitude
of the pedestrian, addressed by the reaction time (see
Section 2), applies to all stimuli and the own willings. The
role of has already been discussed in
Refs. [26, 20].
Fig. 1a represents the situation when is
absent. Notice that or may control the collective dynamic, in
spite of the “assertive” attitude. The individual character of or
appears somehow “loosely” in the crowd dynamic. We mean by “loosely” that
any numerical set for these parameters may be counterbalanced by the right
choice of or , keeping the collective dynamic (qualitatively)
unchanged.
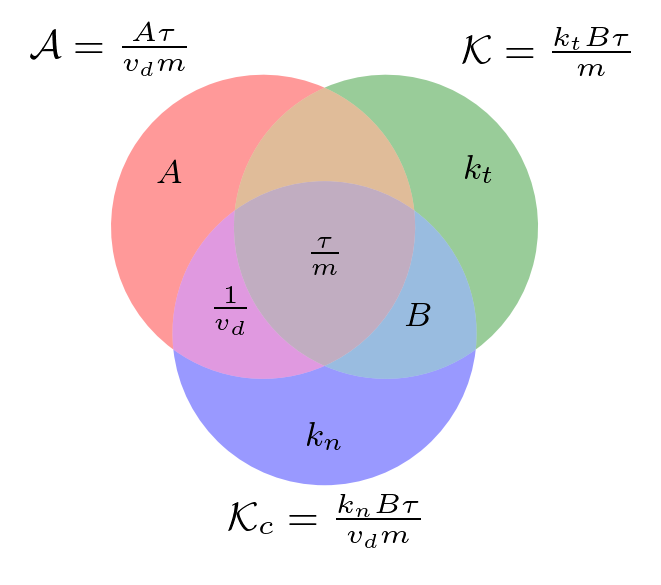
Fig. 1b provides a picture of the parameters’ relations
after introducing . Surprisingly, appears as a
wider set (say, a four elements set) than or (three
elements’ sets). It shares the parameter with and the
parameter with . The practical consequence to these (logical)
relations is that or affect simultaneously two “control” parameters
of the collective dynamics. Conversely, either and may counterbalance
in order to keep the collective dynamic (qualitatively)
unchanged.
We confirm from these diagrams that no univocal relations can be established
between the individual parameters and the collective dynamics (in a crowded
environment). The presence of the body force moves the dynamics to a more
complex context. We will investigate this context in Section 5.
3.3 Blocking clusters
A characteristic feature of pedestrian dynamics is the formation of clusters. Clusters of pedestrians can be defined as the set of individuals that for any member of the group (say, ) there exists at least another member belonging to the same group () in contact with the former. Thus, we define a “granular cluster” () following the mathematical formula given in Ref. [40]
| (5) |
where () indicate the ith pedestrian and is his (her) radius (shoulder width). That means, is a set of pedestrians that interact not only with the social force, but also with physical forces (i.e. friction force and body force). A “blocking cluster” is defined as the subset of clusterized particles (granular cluster) closest to the door whose first and last component particles are in contact with the walls at both sides of the door [2]. This clogging structure is responsible for worsening the evacuation performance.
4 Working hypotheses and procedures
4.1 Working hypotheses
Our working hypotheses are similar to those mentioned in Ref. [20], although the presence of the body force opens inquiries about the proper exploration of the parameter space. To be precise
-
(a)
The “faster-is-slower” (or the “faster-is- faster”) phenomenon occurs when varying the values of (see Section 5.1). This is equivalent to vary simultaneously and by the same amount in the (dimensionless) parameter space (see Section 3.2). We may visualize this sampling procedure as moving along a straight line in the space . Further variations of turns the sample points out of this line, but on the plane of constant . We will step up by several orders of magnitude in order to get the big picture of this surface.
-
(b)
We will consider the parameter set from Ref. [1] as a starting point for exploring the parameter space. The reason for this is that a complete set of experimental parameters is still not available (to our knowledge). We are aware, though, of the drawbacks of this choice, say, the unrealistic meanings for the length and the compressibility (see Section 2). But these are irrelevant in the context of the (dimensionless) parameter space and the corresponding collective dynamics (see Section 1).
-
(c)
We will explore crowd densities allowing body compressions (overlaps) up to m. This corresponds to remarkably high densities, since our own (real- life) estimates do not surpass m (see Section 2). Therefore, the extremely high density scenarios (say, above m) will be considered for the purpose of a tendency, but not as a common real-life situation. No casualties due to high pressures will be further considered.
We stress the fact that our concern is placed on the collective dynamics of
crowded environments. We will work on the hypothesis that any “reasonable”
parameter set should reproduce the collective behavior (say, the slowing down in
the fundamental diagram; see Section 5.3). We will not attempt
to optimize parameters from other objective functions.
We will further sustain the hypothesis of soft matter in the context of crowded
environments. The body compression and the sliding friction parameters are
supposed to be connected in some way under this hypothesis. However, we will not
introduce any direct link between and . We will
investigate the interplay between both in Section 5.3.
In order to keep the model as simple as possible, we will only consider
isotropic pedestrian interactions, since anisotropic interactions do not play a
relevant role at high densities.
4.2 Procedures
The SFM was implemented on the LAMMPS simulation software [39].
Additional modules for LAMMPS were also written in C++ in order to expand the
software capabilities. All these were able to run in a high performance
environment (HPC).
The implemented SFM parameters were the same as those in
Ref. [1] (at the beginning of the exploratory procedure only).
But the pedestrian’s mass and radius were set to the more realistic values of
kg and m, respectively. The force interactions between
pedestrians were limited, however, to a cut-off distance of m for
attaining a privacy sphere that excludes second neighbors. The desired
velcity was always set to m/s in the corridor situation. Besides, the
explored values of for the bottleneck scenario ranged from m/s to the
extremely anxious situation of m/s.
The Eq. (1) was numerically integrated by means of the velocity
Verlet algorithm, with a timestep of seconds. The pedestrians
positions and velocities were recorded every sec, but post-processing
computing was done over samples acquired at least every sec., in order to
avoid data correlations. Those pedestrians leaving the simulations box were
re-introduced into the box, on the opposite side (periodic boundary
conditions). We only omitted this mechanism when computing the evacuation time
for the bottleneck geometry.
The post-processing computing was assisted by Python functions. The NetworkX
package was used among others.
We warn the reader that, for simplicity, we will not include the units
corresponding to the numerical results. Remember that the friction coefficient
has units Kg m-1 s-1,
the body stiffness coefficient Kg s-2,
the density p m-2 and the flow p m-1 s-1.
5 Results
5.1 Bottleneck
We present in this section the results corresponding to the bottleneck geometry.
We show the consequences of modifying the body force coefficient on the
evacuation dynamics. Recall that this coefficient is associated to the
compression of the human body.
Fig. 2 shows the evacuation time as a function of the pedestrian’s
desired velocity for different values of . The evacuation time is defined
as the time lapsed until 80% of the pedestrians have left the room. In this
section we will focus on the evacuation time for m/sm/s.
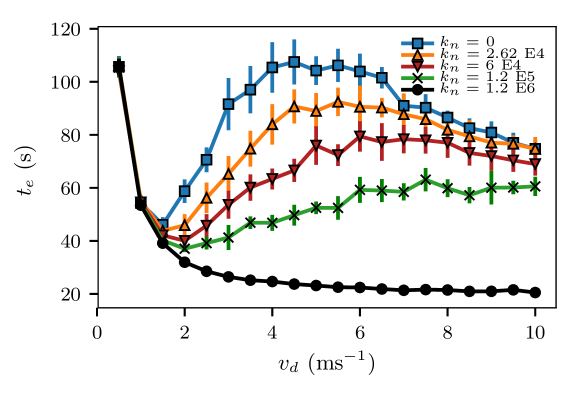
Three behavioral patterns can be distinguished in Fig. 2. Each
pattern can display a positive slope, a negative slope or both. The interval in
which the slope is positive means that the harder the pedestrians try to get
out (higher ), the longer it takes them to evacuate. This is the Faster-
is-slower (FIS) regime. Conversely, the interval in which the slope is
negative corresponds to a Faster-is-Faster (FIF) regime (the harder they try,
the quicker they leave).
Fig. 2 shows either FIS or FIF, and a FIS+FIF pattern for desired
velocities m/s. The evacuation time attains a FIS+FIF pattern for
compression coefficients below E5. This means that “soft”
individuals can attain this behavioral pattern. Notice that higher values of
allow only FIS or FIF patterns. For the highest explored value
E6, no FIS can be seen at all. Besides, the evacuation pattern for
and E4 are very similar since the body force intensity
is of the same order or less than the social force for these stiffness values.
Despite the presence of the FIS or FIF pattern, the evacuation time at a fixed
value of decreases for increasing values of (within the examined
interval). This means that stiffer pedestrians evacuate faster than soft
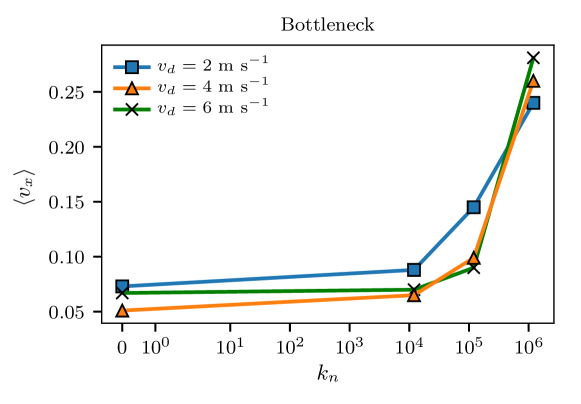
pedestrians. To further investigate this phenomenon, we computed the mean
velocity of the whole crowd as a function of the stiffness .
Fig. 3 shows the actual mean velocity in the
direction as a function of the stiffness for three different desired
velocities. In all cases, the velocity increases with the stiffness. The most
significative increment of velocity is in the interval .
The existence of the FIF phenomenon for only “stiff” individuals opens many
questions on the microscopic dynamics of pedestrians. We may presume that
contacts between pedestrians are quite different for soft individuals than for
stiff individuals. Thus, we proceed to study the dynamics of contacting
pedestrians, regardless of the overlap effects. We will assimilate the
pedestrians as nodes and the whole crowd as a network. We will link any two
individuals whenever they get in physical contact (i.e. ).
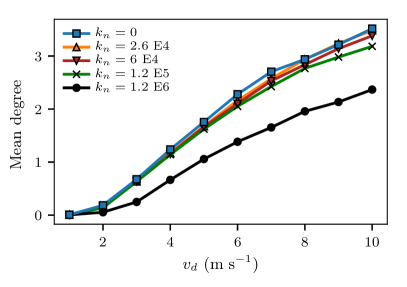
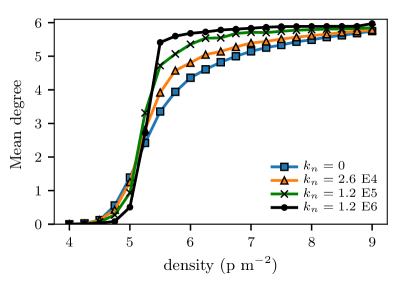
Fig. 4a shows the mean degree of the contact network as a function
of the desired velocity. The degree of a node is defined as the number of links
that connects this node to any other node. This means, the number of pedestrians
that are in physical contact with a given pedestrian. The mean degree is the
average of the degree over all the nodes (pedestrians) and over the whole
sampled interval. We computed mean values only after the system reached the
stationary state, that is, after a well-formed bulk has been established.
Notice that the mean degree increases as increases, as expected. This
expresses the fact that higher values accomplish higher densities, forcing
individuals to touch each other. For a given , the mean degree reduces as
the value increases. A noticeable decrease in the mean degree can be seen
for the highest explored value of . This opens the question on how would
this affect the sliding friction among pedestrians.
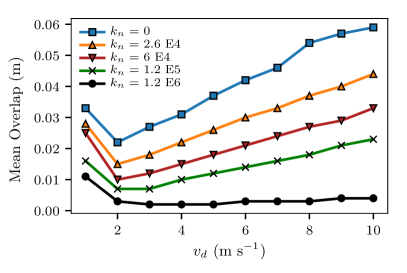
A more detailed insight into the contact dynamics can be acquired from
Fig. 4b. The overlap between individuals is shown as a function of
. Recall from Section 3.1 that the overlap is defined as
where , is the sum of radius of particle and
particle and is the distance between both particles. Except for
very low desired velocities (say, m/s), we can see that the mean
overlap is an increasing function of (withing the studied range of
and ).
The regime for m/s is qualitatively different from the clogged regime
since most of the pedestrians are not touching each other (as was already
observed in Ref [2, 4]). The only pedestrians who touch
each other are the ones who are being re-injected on the opposite side of the
room. These collide with the bulk, providing some kind of overlap during very
short time. We will not analyze this regime.
Besides, for a given m/s, the overlap increases as the value
decreases. This can be explained by considering the bulk at a (quasi)
equilibrium situation. The social and compression forces counterbalance the
desired force. Thus, for any fixed , the product remains (almost) fixed. Any decrease in allows a more
significant intrusion. This (partially) supports the argument that the sliding
friction should weaken for stiffer pedestrians (say increasing values).
The sliding friction reduction appears as the first feature for enhancing the
overall evacuation performance. Either reducing the mean overlap and the mean
degree tend to diminish the mean sliding friction within the crowd. Notice,
however, that switching from a FIS regime (positive slope) to a FIF regime
(negative slope) in Fig. 2 appears as a more complex phenomenon.
We will focus on this issue in an upcoming investigation.
The body force has a notorious impact in the number of pedestrians touching
each other (say, the degree). This is clearly depicted in
Fig. 5 where four different configurations of the
evacuation dynamics are shown. The configurations represent 225 pedestrians
trying to escape through a door (see caption for details). The colors
correspond to the degree of each node (pedestrian), and the lines between
pedestrians represent the contacts among them.
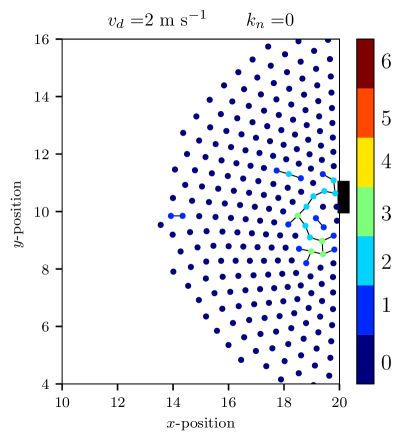
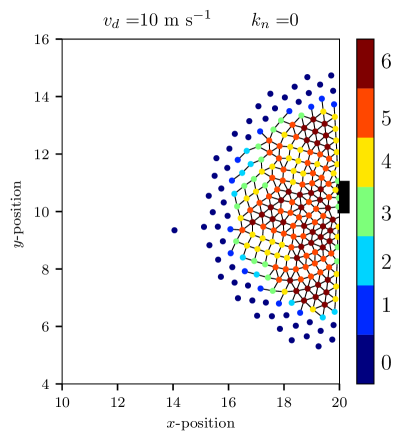
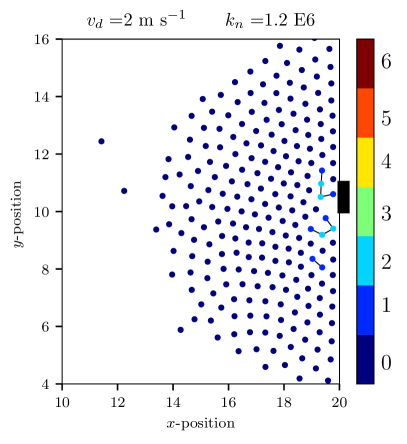
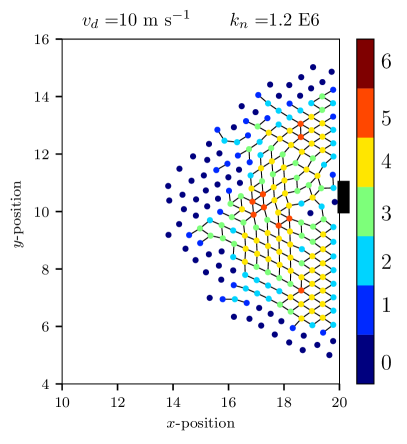
The four configurations corresponds to two different and two different
values (say, the minimum and maximum explored values).
Fig. 5a and Fig. 5b show snapshots for
, at the desired velocities of 2 m/s and 10 m/s, respectively.
Fig. 5c and Fig. 5d show
similar situations, but for E6. As expected, increasing the desired
velocity compresses the crowd towards the exit.
The four snapshots in Fig. 5 confirm (visually) the fact
that more rigid pedestrians ease the crowded environment, widening the occupied
region. At m/s (the maximum explored velocity), it can hardly be found
pedestrians with degree 6 when E6, while a lot of them are present
for =0.
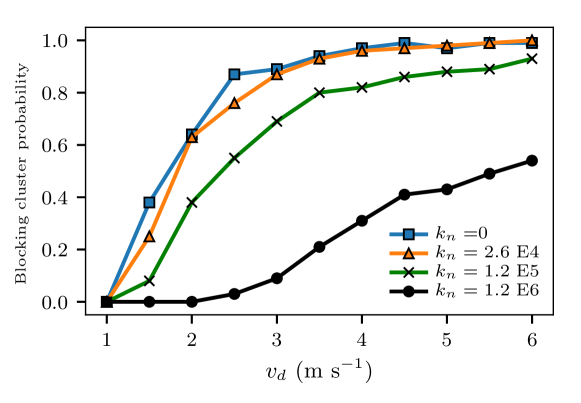
The clusterization of the pedestrians has a significant impact on the blocking
clusters (the group of pedestrians that clog the exit).
Fig. 6 shows the blocking cluster probability as a
function of the desired velocity for different values (see caption for
details). The blocking clusters become more probable for high desired velocity,
since the clogged area gets more compact as increases (for any fixed value
of ). But, the most remarkable fact in Fig. 6 is
that increasing the body stiffness reduces the blocking cluster probability for
any fixed value of . Recall from Ref. [2] that the evacuation
time is controlled by the blocking. Thus, increasing the body stiffness affects
the presence of the blocking clusters, and consequently improves the evacuation
time. This raises as a second feature for enhancing the overall evacuation
performance.
We may summarize this Section as follows. We explored the parameter space along
and for the bottleneck situation. This is similar to explore the
dimensionless plane . Soft pedestrians attain a FIS
or FIS+FIF evacuation pattern but, stiff pedestrians (for any fixed
value within the explored range) exhibit a single FIF pattern.
Stiffness affects either the presence of the blocking clusters and the
pedestrians overlap. The less they overlap, the less intense becomes the sliding
friction among them. Additionally, the fewer the blocking clusters the easier
they get out.
5.2 Corridor
We present in this section the results corresponding to the corridor geometry.
We show the effects of varying the body force coefficient on the
collective dynamics. We will keep (or ) fixed along this
Section.
We first computed the contact network in the same way as in the bottleneck
geometry. Fig. 7a shows the mean degree as a function of the
global density for different values (see caption for details). The mean
degree vanishes at very low densities because the pedestrians do not touch each
other. When the density surpasses 4.5, a few pedestrians start to touch each
other, raising the mean degree. As the density continuous increasing, the mean
degree approaches the asymptotic value of six. Degree six corresponds to the
maximum packing density for identical hard disks.
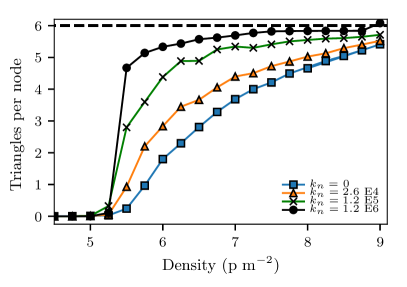
It is worth noting from Fig. 7a that “stiff” pedestrians
exhibit a sharper transition to the maximum packing density than the “soft”
pedestrians. We further checked this phenomenon by counting the number of loops
of three nodes (say, the triangles) present in the network. This magnitude was
reported to be a sensitive magnitude for characterizing the jamming transition
in a compressed granular packing (see Ref. [36] for details).
As can be seen in Fig. 7b, the “stiff” pedestrians share more
triangles than the “soft” ones.
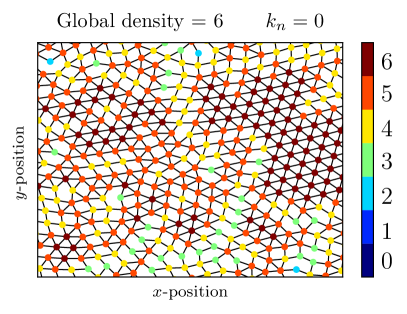
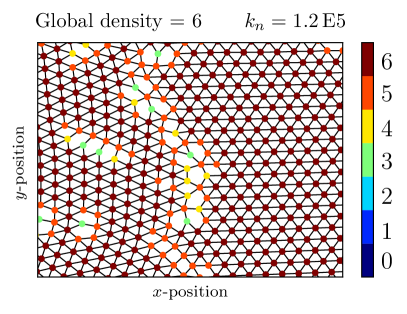
In order to get a better insight on how the pedestrians contact to each other,
we present in Fig. 8 two snapshots of the corridor at the
stationary situation. Fig. 8a corresponds to , while
Fig. 8b corresponds to E5. The former shows a
somewhat disordered network, while the latter exhibits an almost completely
ordered lattice. The missing triangles in Fig. 8a are
replaced by other polygons of more than three edges.
We find these topological magnitudes useful for comparing the pedestrian
behavior in the corridor geometry with respect to the bottleneck geometry. A
re-examination of Fig. 7a (corridor) and Fig. 4a
(bottleneck) reveal that the pedestrian stiffness affects differently the
way they contact each other. The mean degree increases for “stiff”
pedestrians moving along the corridor as the density increased with a sharp
increase at p/m2. Conversely, the mean degree increases for “soft”
pedestrians in the bottleneck situation.
Fig. 5 and Fig. 8 illustrate the
connectivity differences between the bottleneck and the corridor situation. The
bulk in Fig. 5 appears more heavily connected among
“soft” pedestrians than among “stiff” pedestrians (see both snapshots at
). The opposite occurs in Fig. 8. This discrepancy
seems to be related to the boundary conditions, since the same SFM parameters
were applied on both situations. We may speculate that this phenomenon occurs
because, in the corridor, the lateral walls act like a confining barrier that
forces the “stiff” pedestrian to increase his (her) contacts. On the contrary,
no real confining walls exist in the bottleneck situation (regardless the side
walls).
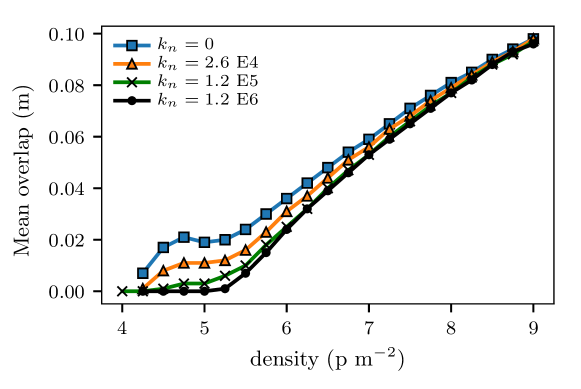
We can test our hypothesis by computing the mean overlap.
Fig. 9 shows this magnitude for the corridor situation. Notice
that “soft” pedestrians attain more overlap than the “stiff”
ones, as expected. This is in agreement with Fig. 4b for the
bottleneck situation (at a fixed value of ). The curves in
Fig. 4b, however, do not meet each other as in
Fig. 9 where all the curves meet each other at
high-density values. This phenomenon occurs due to space limitations
in the corridor that produces overlapping (almost) independently of
the value of .
The above results represent an important step in the investigation.
The inter-pedestrian connectivity differences between the bottleneck geometry
and the corridor geometry were not expected and opens two major questions: how
do the pedestrians interact with the walls as a function of the body stiffness,
and consequently, how does this affect the flux across the corridor.
We start by computing the mean velocity across the corridor.
Fig. 10 shows the mean velocity
(parallel to the corridor) as a function
of the stiffness for different global density levels. This
plot shows a flat pattern for and a slowing down above this
threshold. Notice from Fig. 3 that this is opposed
to what happens in the bottleneck geometry.
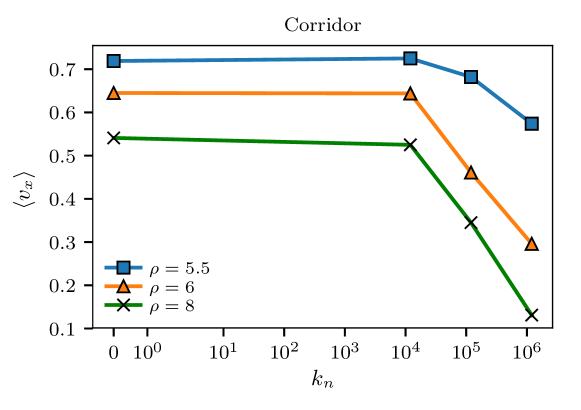
The values in Fig. 10 were computed
at densities . According to Fig. 9, at these
densities, the overlaps among pedestrians attain significant values.
Furthermore, stiffness values move the system to a more heavily
connected stage, and thus, pedestrians have no choice but to walk at (almost)
the same speed as his (her) neighbors. This behavior may be envisaged as the
passage from a “free” walking movement to a constrained walking movement as
the stiffness increases. A more physical picture would assimilate the former as
a “fluid-like state” and the latter as a “solid-like state”. When the
stiffness is very high (say 1.2 E6), all the pedestrians are expected to
walk at a common velocity. The pedestrians that walk in physical contact with
the wall are the ones who determine the velocity of the whole crowd, as
discussed below.
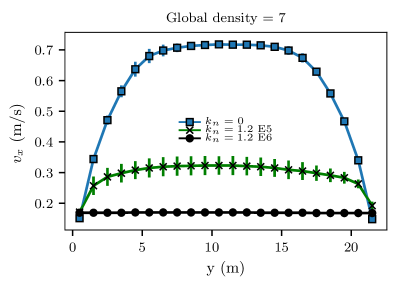
Fig. 11a shows the velocity profile ( vs. the
transversal coordinate ) for different values. For , we can see
a parabolic-like velocity profile which means that the friction with the walls
reduces the speed of pedestrians. The velocity profile resembles the Poiseuille
flow (similar to Newtonian and incompressible fluids in a laminar regime). This
behavior was also observed in empirical measurements of crowd dynamics reported
in Ref. [38]. But as increases the velocity profile
flattens until becoming (almost) uniform (see Fig. 11a for
E6). In this scenario, attains a much lower value than in the
case of soft pedestrians (0).
From the results displayed above, we realize that the crowd behaves like a solid
for very stiff pedestrians. This means that the crowd can not be easily
“deformed”. In this context, deformation means that some parts of the crowd
may be allowed to move faster than other parts of the crowd.
The strain rate tensor displays the rate of change of the deformation of a body in the vicinity of a given point. We consider the following discrete definition of the strain rate:
| (6) |
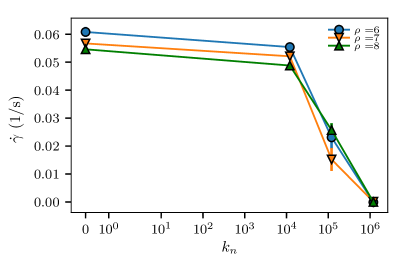
Where means the average taken over time. This definition
compares the velocity of the pedestrians close to the wall (boundary) with
respect to the velocity of the pedestrians at the center of the corridor
(center). Thus, the strain rate vanishes (no deformation) as the
stiffness level increases. This phenomenon is shown in
Fig. 11b where we can see that the strain rate drops for
high values of .
We conclude this Section by stressing, once again, that stiffer pedestrians
attain opposite results in corridors with respect to bottlenecks. The walls in
the corridors play a critical role that prevents pedestrians from detaching from
each other. This effect can be observed as an increment in the connectivity
of the contact network and the flattening of the velocity profile (thus reducing
the strain rate). High enough stiffness values stuck the pedestrians
leading to a “solidification” of the crowd. All the pedestrians walk at almost
the same velocity at this stage. The pedestrians that are in contact with the
walls are the ones that determine the velocity of the whole crowd. We already
analyzed this situation in Ref [20].
5.3 Dimensionless numbers and comparison with empirical data
The final stage of our investigation deals with the plausible values of the
dimensionless numbers and , in comparison to the
empirical measurements. We vary the body force coefficient () and the
friction coefficient () to explore different values of and
, respectively.
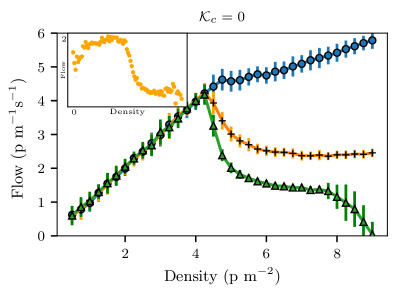
We consider the empirical measurements from Ref. [23]
corresponding to the fundamental diagram obtained at the entrance of the
Jamaraat bridge (see the inset in Fig. 12a). Our
aim is to reproduce the qualitative behavior of these measurements.
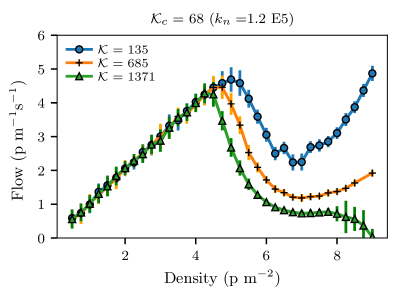
Figs. 12 show the pedestrian flow as a function of the global
density (fundamental diagram). Fig. 12a corresponds
to 0 (this is i.e. ) while
Fig. 12b corresponds to 68
corresponding to the original SFM with E5. Each curve represents
different friction values (see the caption for details).
According to the empirical measurements at Jamaraat, the flow slows down for
high enough densities due to jamming. Notice that the original SFM
(corresponding to 137) does not produce the expected slowing down
for null body force ( 0). However, when the body force is
present (the original SFM) an “U” shape behavior occurs for densities above 5
p-2.
The increase in to 685 (five times the original
SFM value) slows down the flux for densities above 5 p m-2, regardless of
the presence of the body force. Including the body force, however, produces a
subtle increment in the flow for densities higher than 7 p m-2 (see orange
curve from Fig. 12a).
A further increment of to 1371 (ten times the
original SFM value) attains a plateau ( p m-2) before vanishing at
very high densities. This occurs on either 0 and
68.
These results suggest that although increasing slows down the
flux, it is still necessary to increase (by increasing the
friction coefficient ) to avoid an “U” shape behavior for extremely high
densities. It is still a challenge to find the optimal dimensionless numbers
for the fundamental diagram. Our
inspection into the parameter set is a first approach to narrow down the
search.
6 Conclusions
Having adopted as fundamental philosophy of work that the parameters of the SFM
should be properly determined by requiring that the model reproduces
well established experimental data; we explored the effect on the pedestrians
dynamics of the (sometimes neglected) body force in the framework of the SFM. We
showed that the stiffness coefficient () has a significant impact on the
evacuation dynamics (bottleneck) and also in the dynamics of pedestrians walking
along a straight corridor.
In the bottleneck geometry, the evacuation time diminishes (pedestrians move
faster) as pedestrians become stiffer along the explored desired velocities.
This phenomenon occurs because stiffer pedestrians reduce the overlapping and
hence the sliding friction intensity. This scenario releases more easily the
pedestrians and reduces the probability of producing a cluster of pedestrians
blocking the exit (blocking cluster). This leads to a more efficient evacuation
dynamics.
The opposite behavior is obtained in the corridor geometry with respect to the
bottleneck geometry. The major difference is that pedestrians are limited to the
available space between walls in the corridor geometry. Walls are not relevant
in the bottleneck geometry. Thus, the overlap between pedestrians is controlled
by the available space. But, stiffer pedestrians are more likely to get stuck.
The whole crowd can be compared to a granular material. Granular materials can
be disordered (amorphous) or ordered depending on how particles interact with
each other. In the present context, at low stiffness levels, the crowd appears
disordered attaining a parabolic velocity profile. If the stiffness level is
high, the whole crowd appears ordered into a lattice (like a crystalline solid)
with a uniform velocity profile that depends on the friction interaction with
the walls.
Our efforts to “tune” the original SFM to reproduce empirical data (say, the
fundamental diagram) moved us to explore the dimensionless parameter space. We
found that we can qualitatively reproduce the empirical data if the parameters
are close to , and .
Nevertheless, this is a first attempt to arrive at suitable parameters, although
we do not claim these to be optimal. We encourage further research to find
dimensionless numbers that may better fit experimental data.
Acknowledgments
This work was supported by the National Scientific and Technical
Research Council (spanish: Consejo Nacional de Investigaciones Científicas
y Técnicas - CONICET, Argentina) grant Programación Científica 2018
(UBACYT) Number 20020170100628BA.
The authors want to thank the degree students Josefina Catoni and Ayelen Santos
for providing data acquired at the subway in Buenos Aires, Argentina.
G. Frank thanks Universidad Tecnolólica Nacional (UTN) for partial support through Grant PID Number SIUTNBA0006595.
Appendix A Reduced-in-units equation of motion
The SFM description in section 3.1 introduces seven parameters (,
, , , , and ) attaining for the “individual”
behavior of each pedestrian. The collective dynamic, however, requires a
smaller set of parameters. In order to identify this smaller set, we introduce
the following dimensionless magnitudes
| (7) |
The equation of motion (1) can be rewritten in terms of these
(dimensionless) magnitudes, while only three (reduced) parameters are needed.
| (8) |
where the smaller set (,,)
means
| (9) |
Notice that the SFM will arrive to similar collective dynamics whenever the
reduced set (,,) remains unchanged
(although some “individual” parameters are allowed to change). For a deep
explanation on the meaning of the set
(,,) see section 3.2.
References
- [1] D. Helbing, I. Farkas, and T. Vicsek. Simulating dynamical features of escape panic. Nature, 407:487–490, 2000.
- [2] D. Parisi and C. Dorso. Microscopic dynamics of pedestrian evacuation. Physica A, 354:606–618, 2005.
- [3] D. Parisi and C. Dorso. Morphological and dynamical aspects of the room evacuation process. Physica A, 385:343–355, 2007.
- [4] G. Frank and C. Dorso. Room evacuation in the presence of an obstacle. Physica A, 390:2135–2145, 2011.
- [5] Colin M. Henein and Tony White. Macroscopic effects of microscopic forces between agents in crowd models. Physica A: Statistical Mechanics and its Applications, 373:694 – 712, 2007.
- [6] J. Fruin. The causes and prevention of crowd disasters. In R.A. Smith and J.F. Dickie, editors, Engineering for Crowd Safety. Elsevier, 1993.
- [7] Taras I. Lakoba, D. J. Kaup, and Neal M. Finkelstein. Modifications of the helbing-molnár-farkas-vicsek social force model for pedestrian evolution. SIMULATION, 81(5):339–352, 2005.
- [8] Paul A. Langston, Robert Masling, and Basel N. Asmar. Crowd dynamics discrete element multi-circle model. Safety Science, 44(5):395 – 417, 2006.
- [9] Peng Lin, Jian Ma, You-Ling Si, Fan-Yu Wu, Guo-Yuan Wang, and Jian-Yu Wang. A numerical study of contact force in competitive evacuation. Chinese Physics B, 26(10):104501, sep 2017.
- [10] I. M. Sticco, F. E. Cornes, G. A. Frank, and C. O. Dorso. Beyond the faster-is-slower effect. Phys. Rev. E, 96:052303, Nov 2017.
- [11] Rahul Narain, Abhinav Golas, Sean Curtis, and Ming C. Lin. Aggregate dynamics for dense crowd simulation. ACM Trans. Graph., 28(5):122:1–122:8, December 2009.
- [12] N. Pelechano, J.Allbeck, and N. Badler. Controlling individual agents in high-density crowd simulation. Proceedings of the 2007 ACM SIGGRAPH/Eurographics Symposium on Computer Animation, pages 99–108, 2007.
- [13] Mehdi Moussaïd, Dirk Helbing, and Guy Theraulaz. How simple rules determine pedestrian behavior and crowd disasters. Proceedings of the National Academy of Sciences, 108(17):6884–6888, 2011.
- [14] Fernando Alonso-Marroquín, Jonathan Busch, Coraline Chiew, Celia Lozano, and Álvaro Ramírez-Gómez. Simulation of counterflow pedestrian dynamics using spheropolygons. Phys. Rev. E, 90:063305, Dec 2014.
- [15] Arianna Bottinelli and Jesse L. Silverberg. How to: Using mode analysis to quantify, analyze, and interpret the mechanisms of high-density collective motion. Frontiers in Applied Mathematics and Statistics, 3:26, 2017.
- [16] J. Song, F. Chen, Y. Zhu, N. Zhang, W. Liu, and K. Du. Experiment calibrated simulation modeling of crowding forces in high density crowd. IEEE Access, 7:100162–100173, 2019.
- [17] Bachar Kabalan. Crowd dynamics: modeling pedestrian movement and associated generated forces. Theses, Université Paris-Est, January 2016.
- [18] A. Jebrane, P. Argoul, A. Hakim, and M. El Rhabi. Estimating contact forces and pressure in a dense crowd: Microscopic and macroscopic models. Applied Mathematical Modelling, 74:409 – 421, 2019.
- [19] Litao Wang and Shifei Shen. A pedestrian dynamics model based on heuristics considering contact force information and static friction. Transportmetrica B: Transport Dynamics, 7(1):1117–1129, 2019.
- [20] I.M. Sticco, G.A. Frank, F.E. Cornes, and C.O. Dorso. A re-examination of the role of friction in the original social force model. Safety Science, 121:42 – 53, 2020.
- [21] Yaouen Fily, Silke Henkes, and M. Cristina Marchetti. Freezing and phase separation of self-propelled disks. Soft Matter, 10:2132–2140, 2014.
- [22] Milad Haghani, Majid Sarvi, and Zahra Shahhoseini. When ‘push’ does not come to ‘shove’: Revisiting ‘faster is slower’ in collective egress of human crowds. Transportation Research Part A: Policy and Practice, 122:51 – 69, 2019.
- [23] Dirk Helbing, Anders Johansson, and Habib Zein Al-Abideen. Dynamics of crowd disasters: An empirical study. Phys. Rev. E, 75:046109, Apr 2007.
- [24] Rainald Lohner, Britto Muhamad, Prabhu Dambalmath, and Eberhard Haug. Fundamental diagrams for specific very high density crowds. Collective Dynamics, 2, 2018.
- [25] Dirk Helbing and Péter Molnár. Social force model for pedestrian dynamics. Phys. Rev. E, 51:4282–4286, May 1995.
- [26] Anders Johansson. Constant-net-time headway as a key mechanism behind pedestrian flow dynamics. Phys. Rev. E, 80:026120, Aug 2009.
- [27] Meifang Li, Yongxiang Zhao, Lerong He, Wenxiao Chen, and Xianfeng Xu. The parameter calibration and optimization of social force model for the real-life 2013 ya’an earthquake evacuation in china. Safety Science, 79:243 – 253, 2015.
- [28] Ulrich Weidmann. Transporttechnik der fussgänger. IVT Schriftenreihe, 90, Jan 1992.
- [29] S.P. Hoogendoorn and W. Daamen. Microscopic Calibration and Validation of Pedestrian Models: Cross-Comparison of Models Using Experimental Data. In A. Schadschneider, T. Pöschel, R. Kühne, M. Schreckenberg, and D. E. Wolf, editors, Traffic and granular flow ’05, volume Part III. Springer, 2007.
- [30] A. Seyfried, B. Steffen, W. Klingsch, Th. Lippert, and M. Boltes. The Fundamental Diagram of Pedestrian Movement Revisited - Empirical Results and Modelling. In A. Schadschneider, T. Pöschel, R. Kühne, M. Schreckenberg, and D. E. Wolf, editors, Traffic and granular flow ’05, volume Part III. Springer, 2007.
- [31] A. Johansson, D. Helbing, and P.K. Shukla. Specification of the social force pedestrian model by evolutionary adjustment to video tracking data. Advances in Complex Systems, 10(supp02):271–288, 2007.
- [32] Mehdi Moussaï d, Dirk Helbing, Simon Garnier, Anders Johansson, Maud Combe, and Guy Theraulaz. Experimental study of the behavioural mechanisms underlying self-organization in human crowds. Proceedings of the Royal Society B: Biological Sciences, 276(1668):2755–2762, 2009.
- [33] M. Luber, J. A. Stork, G. D. Tipaldi, and K. O. Arras. People tracking with human motion predictions from social forces. In 2010 IEEE International Conference on Robotics and Automation, pages 464–469, May 2010.
- [34] Stefan Seer, Christian Rudloff, Thomas Matyus, and Norbert Brändle. Validating social force based models with comprehensive real world motion data. Transportation Research Procedia, 2:724 – 732, 2014. The Conference on Pedestrian and Evacuation Dynamics 2014 (PED 2014), 22-24 October 2014, Delft, The Netherlands.
- [35] S. M. P. Siddharth and P. Vedagiri. Modeling the gender effects of pedestrians and calibration of the modified social force model. Transportation Research Record, 2672(31):1–9, 2018.
- [36] Arévalo, Roberto and Pugnaloni, Luis A and Zuriguel, Iker and Maza, Diego Contact network topology in tapped granular media. Physical Review E, 87(2):022203, 2013.
- [37] Melvin, John W AATD system technical characteristics, design concepts, and trauma assessment criteria. Task EF final report
- [38] Zhang, XL and Weng, WG and Yuan, HY and Chen, JG Empirical study of a unidirectional dense crowd during a real mass event Physica A: Statistical Mechanics and its Applications, 392:2781–2791, 2013.
- [39] Plimpton, Steve Fast parallel algorithms for short-range molecular dynamics Sandia National Labs,1993
- [40] Strachan, A and Dorso, CO Fragment recognition in molecular dynamics Physical Review C, 56:995, 1997.