SDSS-IV MaNGA: Kinematic Asymmetry as An Indicator of Galaxy Interaction in Paired Galaxies
Abstract
The interaction between galaxies is believed to be the main origin of the peculiarities of galaxies, which disturbs not only the morphology but also their kinematics. These disturbed and asymmetric features are the indicators of galaxy interaction. We study the velocity field of the ionized gas of the paired galaxies in the SDSS-IV MaNGA IFU survey. Using the kinemetry package, we fit the velocity field of the ionized gas to quantify the degree of kinematic asymmetry. We find that the star formation rate (SFR) of the paired galaxies with high kinematic asymmetry is significantly enhanced even when the projected separation between the pair members is quite large (). On the contrary, no significant SFR enhancement is found for the paired galaxies with low kinematic asymmetry even when their projected separation is small (). Moreover, we also find that the fraction of galaxies with high kinematic asymmetry is much higher in close pairs () than those with larger , which explains well the early statistical finding of the significant SFR enhancement in close pairs. Our new findings illustrate that the kinematic asymmetry is an excellent indicator of galaxy-galaxy interaction strength, which helps us better understand the merging stage of the observed galaxy pairs.
1 Introduction
In the hierarchical galaxy formation scenario, galaxies assemble most of their masses through galaxy-galaxy mergers. For major mergers, two comparable galaxies are first bounded by gravity and then form a galaxy pair. This pair status may last for a few Gyrs, where the strong galaxy-galaxy interaction significantly alters the physical properties of the member galaxies. In observation, galaxy pairs are usually selected with combined criteria, including the projected separation () and line-of-sight velocity difference () (Karachentsev, 1987; Ellison et al., 2008; Shen et al., 2016; Feng et al., 2019). A large number of statistical studies have revealed that the galaxy pairs with small projected separations (e.g. ) show significantly different features comparing with the field galaxies, such as the disturbed morphology (Hernández-Toledo et al., 2005, 2006; Patton et al., 2016), enhanced star formation rates (SFR) (Ellison et al., 2008; Li et al., 2008; Patton et al., 2013), diluted metallicities (Kewley et al., 2006; Michel-Dansac et al., 2008; Scudder et al., 2012) and stronger nuclear activities (Ellison et al., 2011; Liu et al., 2012; Satyapal et al., 2014). All these observations suggest strong interactions between the pair members with small separations. Numerical simulations suggest that the peculiar physical properties of the paired galaxies are originated from the strong tidal effect during the pericenter passage between two galaxies (Toomre & Toomre, 1972; Mihos & Hernquist, 1996; Torrey et al., 2012; Moreno et al., 2015).
Although the projected separation is a good indicator of the galaxy-galaxy interaction strength for a statistical sample, it may not be an ideal indicator of the galaxy-galaxy merging stage for individual galaxy pairs. First of all, the projected separation of two galaxies does not represent their physical separation because of the projection effect(Soares, 2007). On the other hand, pairs with the same physical separation do not necessarily have the same degree of interaction, which also depends on their merging stage (e.g., before or after their first passage) (Torrey et al., 2012). Therefore, to better characterize the interaction process between the merging galaxies, we need some other indicators, e.g., morphology (Pan et al., 2019).
Numerical simulations show that, during two galaxies merging, their tidal force disturbs both their morphology and kinematic fields (Hung et al., 2016). The irregular kinematics of galaxies provides a clear signal of galaxy-galaxy interaction, which may happen even before the morphology disturbance. Indeed, recent integral field spectrograph (IFS) surveys such as CALIFA (Sánchez et al., 2012) and SAMI (Croom et al., 2012) have suggested that the galaxy-galaxy interaction is one of the main drivers of the irregular velocity field of galaxies (Barrera-Ballesteros et al., 2015; Bloom et al., 2017, 2018). Therefore, we expect that the kinematic field of the paired galaxies would be a good indicator of the galaxy-galaxy interaction as well as the projected separation. By including the parameters of kinematic fields, the details of the galaxy merging process may be better depicted.
In this work, we study the kinematic asymmetry of the ionized gas of a large sample of paired galaxies using the MaNGA (Mapping Nearby Galaxies at APO) data (Bundy et al., 2015; Law et al., 2015; Wake et al., 2017) in the Sloan Digital Sky Survey IV (SDSS-IV Blanton et al., 2017; Smee et al., 2013; Gunn et al., 2006). The paper is organized as follows. In Section 2, we first introduce the galaxy pair sample and the measurement of kinematic asymmetry using MaNGA data. Next, we show the results of the data analysis in Section 3, and make relevant discussions in Section 4. Finally, a brief summary is listed in Section 5. Throughout this paper, we adopt a standard cosmology, with , , and with .
2 Data
2.1 Paired Galaxy Sample
The galaxy pair sample are taken from Feng et al. (2019), which selects isolated galaxy pairs in the main sample galaxies of SDSS with the following criteria: (1) the projected separation: ; (2) the line-of-sight velocity difference: ; (3) each pair member only has one neighbor satisfying above criteria.
Among the galaxy pair sample, member galaxies have been observed and processed by MaNGA Product Launch 8 (MPL-8) (Drory et al., 2015; Law et al., 2016; Yan et al., 2016a, b). In this study, we only consider star-forming galaxies, whose velocity and star formation rate maps could be well quantified from the IFS data. We use a criterion, the global specific star formation rate (taken from the GALEX-SDSS-WISE Legacy Catalog 2 (Salim et al., 2016, 2018) ) to select the star-forming galaxies and have obtained 632 of them. We take the advanced products of the MaNGA Data Analysis Pipeline (DAP, Westfall et al., 2019) to obtain the velocity map and flux maps 111The emission line fluxes are measured from Gaussian fit (Belfiore et al., 2019) for each galaxy.
2.2 Measurement of Kinematic Asymmetry
We use the kinemetry package222http://davor.krajnovic.org/idl/ to fit the H velocity map for each galaxy in our sample (Krajnović et al., 2006). This package divides the velocity map into a sequence of concentric elliptical rings according to the pre-defined parameters, including galaxy center, kinematic position angle, and ellipticity. Then, it fits the velocity values in each ellipse to the Fourier series:
| (1) |
where is the azimuthal angle in the galaxy plane, is the semi-major axis of the ellipse, and is zero-order Fourier component. The parameters and are the amplitude and the phase coefficient of th order Fourier component, respectively. The first-order coefficient describes the symmetric pattern of the velocity map, which is typically contributed by the rotating motion of galaxies, while high-order coefficients describe the asymmetric pattern of the velocity map, indicating the contribution from non-rotating motion. Thus, the kinematic asymmetry at a given radius is expressed as
| (2) |
The characteristic value of the kinematic asymmetry for the entire galaxy, denoted as , is represented by its average value within 1 . With this definition, the larger value of means higher asymmetry of the velocity field. A galaxy with a higher value means that the contribution of non-rotating motion to the velocity maps is higher.
In practice, the kinematic position angle and ellipticity of concentric elliptical rings are fixed as the best fit values from the single Sersic fit of -band photometric image (SERSIC_PHI and SERSIC_BA from NSA catalog 333http://www.nsatlas.org/). We take the center of the MaNGA velocity map as the center of kinemetry fitting. Few galaxies whose center of velocity map is not located at the photometric center are not taken into account. We only fit the galaxies, which have more than spaxels with the S/N of H in 1.5. Finally, paired galaxies are kept in our sample.
2.3 Sub-samples and Control Sample
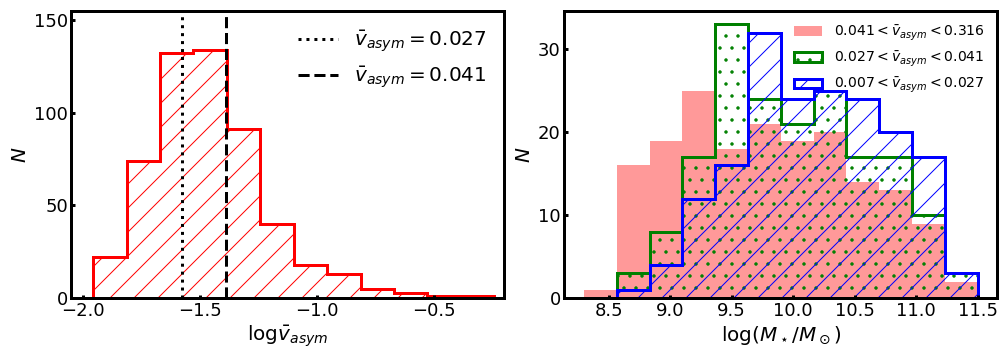
We show the distribution of the 578 paired galaxies with the hatched histogram in the left panel of Figure 1, and separate these paired galaxies into three equal size sub-samples according to their values. The intervals of three sub-samples are (low asymmetry, LA), (medium asymmetry, MA) and (high asymmetry, HA), respectively. The dotted and dashed vertical lines represent two thresholds ( and ) respectively. We also show the distribution of stellar mass of three sub-samples in the right panel of Figure 1. The blue, green and red histograms represent the LA, MA and HA respectively. It is clear that the fraction of lower mass galaxies of HA is higher than MA and LA, which is consistent with the finding of Bloom et al. (2017) for the general galaxy population.
The control sample of galaxies are selected from the non-paired star-forming galaxies () by matching their stellar mass and redshift to the paired galaxies one-by-one with and redshift . Specifically, the non-paired galaxies are also selected from MaNGA MPL-8 and are defined as those without bright neighbors () within the interval of and (Feng et al., 2019). Since the galaxies with measurement might be biased towards these objects with strong emission lines, we also require the control galaxies to have more than 70% spaxels with 5- detection of flux in as that done for the paired galaxies in Section 2.2.
3 Properties of Paired Galaxies with Different Kinematic Asymmetry
In this section, we compare the physical properties of three sub-samples of paired galaxies and explore their connection with kinematic asymmetry.
3.1 Projected Separation
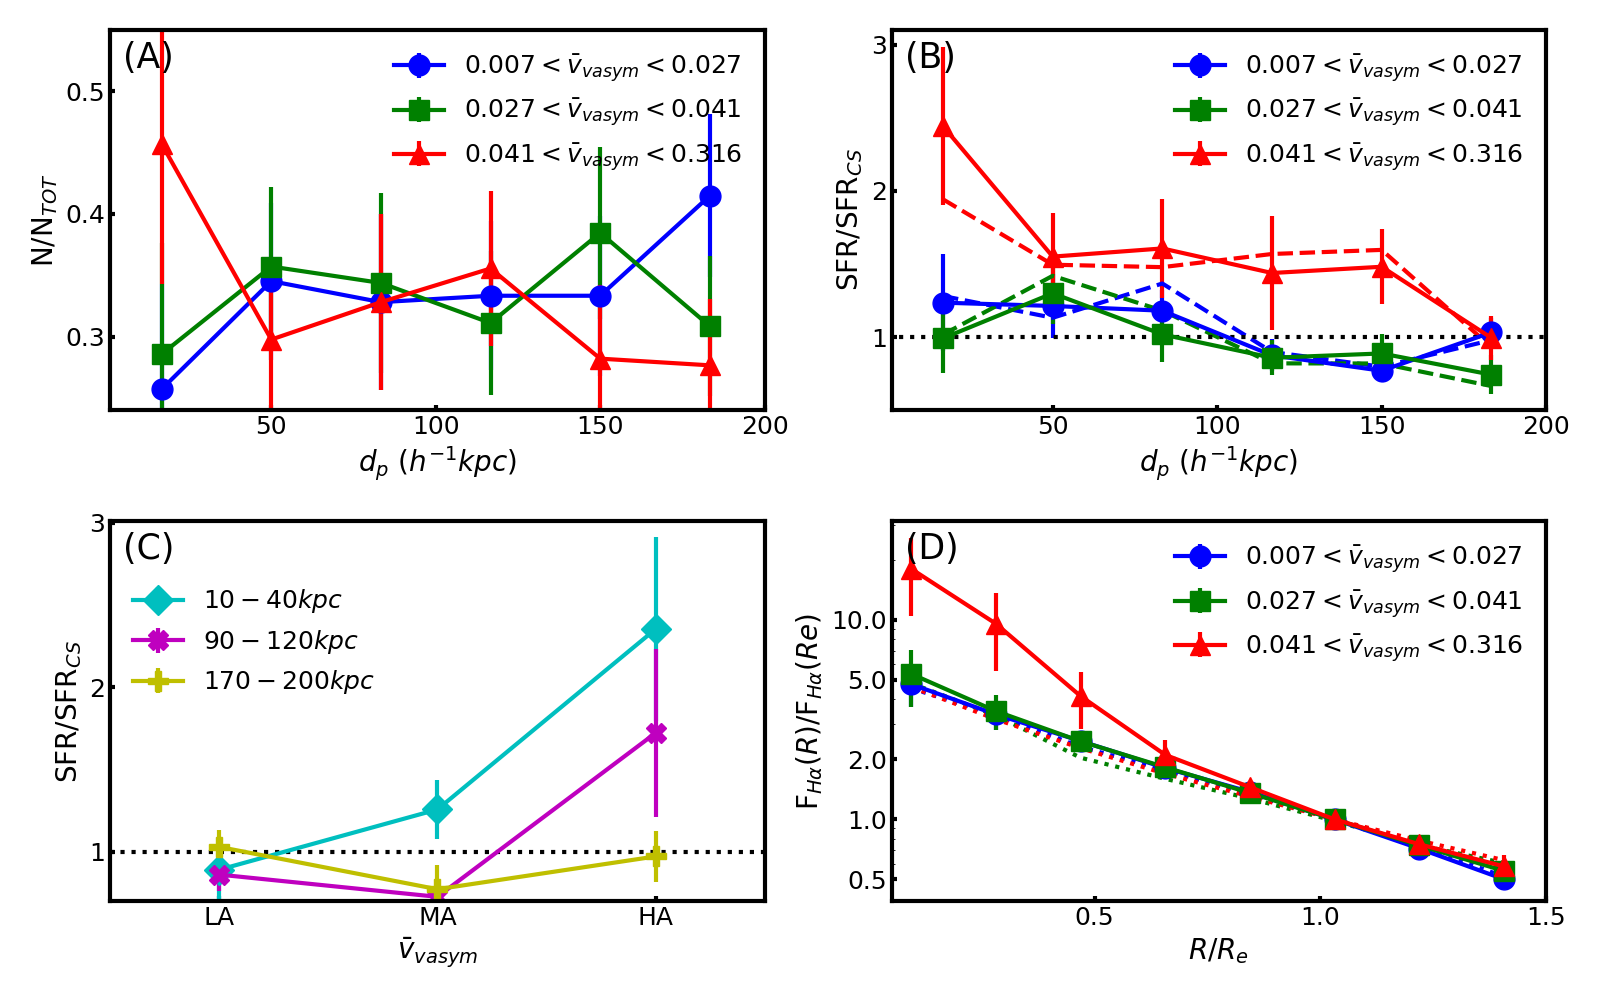
We first compare the fraction of three sub-samples in different bins and show the result in the panel (A) of Figure 2. The solid blue circles, green squares, and red triangles represent the sub-samples of LA, MA, and HA, respectively. The error bars are estimated from the bootstrap sampling of the paired galaxy sample. In the largest bin (), the fraction of LA is the largest (larger than ), while the fraction of HA is the lowest (lower than ). For the smallest bin (), the fraction of HA becomes the largest, which increases up to . At the same time, the fractions of MA and LA drop to . We mention that the stellar mass distribution of our paired galaxies is almost independent of . Therefore, this result is not influenced by the different distributions of stellar mass of three sub-samples.
These results show that the fraction of paired galaxies with high kinematic asymmetry is correlated with projected separation. Paired galaxies with smaller projected separation are more likely to have a highly asymmetric kinematic field. Especially for , the fraction of paired galaxies with a highly asymmetric kinematic field is close to half.
The higher fraction of HA galaxies in closer pairs is normally attributed to the stronger tidal force from companion galaxies (Barrera-Ballesteros et al., 2015; Bloom et al., 2018). Statistically, paired galaxies with smaller physical separation would also show smaller projected separation. In the simplest case, the tidal force is inversely proportional to the cube of the physical separation between the paired members. As the decrease of the separation, the tidal force increases dramatically. However, this simple scenario can not give a full explanation of the observed trends we have discussed.
During the galaxy merging process, the physical separation decreases until the pericenter passage and then increases until reaching the apocenter (Torrey et al., 2012). On the other hand, the disturbance of the velocity field not only depends on the tidal force (acceleration) but also on the interaction time. As a result, because of longer interaction time, paired galaxy after the pericenter passage would show a more disturbed velocity field than that before the passage (Hung et al., 2016). Also, because of the energy dissipation from dynamical friction, paired galaxies after the pericenter passage, on average, have a smaller physical separation than those before the passage. Putting all these effects together, we see that paired galaxies with smaller show a higher fraction of HA galaxies. This scenario also explains that there are about half of the close pairs () do not show high kinematic asymmetry. These LA/MA galaxies in close pairs are either caused by projection effect or before the pericenter passage. On the other hand, a significant fraction of the large separation pairs () shows high kinematic asymmetry. These HA galaxies are possibly at the stage after the pericenter passage and may approach the apocenter, resulting in a disturbed velocity field and a large separation with the companion galaxy (see more discussion in Section 3.2).
3.2 Total SFR
In this section, we explore the correlation between the kinematic asymmetry and the enhancement of star formation in paired galaxies. We use the ratio of the total SFRs of the paired galaxies to their corresponding control galaxies, , to represent the SFR enhancement in paired galaxies.
The panel (B) of Figure 2 displays the SFR enhancement of three sub-samples with different kinematic asymmetry as a function of . Generally, HA galaxies show significant SFR enhancement at . The reaches about in the smallest bin (). At very large (), the is still at the level of . In contrast, the enhancement of the total SFRs of the other two sub-samples (MA and LA) is not significant, even in the smallest bin ().
We also show the SFR enhancement as a function of kinematic asymmetry within given intervals in the panel (C). The bins follow the intervals of three sub-samples. For clarity, we show three cases of intervals: , , , which represent the galaxy pairs with very small, medium and large projected separation respectively. In the largest interval, we see there is no SFR enhancement regardless of values. This result is in good consistency with the recent study of Feng et al. (2019), where the member galaxies in pairs with are shown with few interactions through a strictly statistical approach. Nevertheless, there is still a small but significant fraction () of HA galaxies at such large in the panel (A) of Figure 2, which don’t show SFR enhancement at all. The HA features of these galaxies might be caused by the internal process (e.g., bar effect, see more discussion in Section 4) and/or the peculiarities of the galaxies themselves instead of galaxy interactions. However, a detailed study of the HA features of these galaxies is out the scope of this study. For these paired galaxies within intermediate interval, the majority of them (LA and MA, ) still show no enhanced star formation, which is also consistent with early finding that the paired galaxies out to in general show very weak enhanced star formation (Scudder et al., 2012; Patton et al., 2013). However, in this case, there are a fraction of galaxies (HA, ) that indeed show significantly enhanced star formation (). As we have discussed, these HA galaxies might be in the stage of being after the first pericenter passage and approaching the apocenter. Among the galaxies with very close companions (), the LA galaxies do not show enhanced star formation at all. While the MA galaxies show moderate SFR enhancement (), and the HA galaxies show the highest (). According to the discussion in Section 3.1, the LA galaxies might be affected by the projection effect, i.e., there are not in real close galaxies pairs. On the other hand, although both the MA and HA galaxies are in real pairs, they might still be affected by the projection effect differently or at the different stages of the merging process, which are before and after the first passage, respectively.
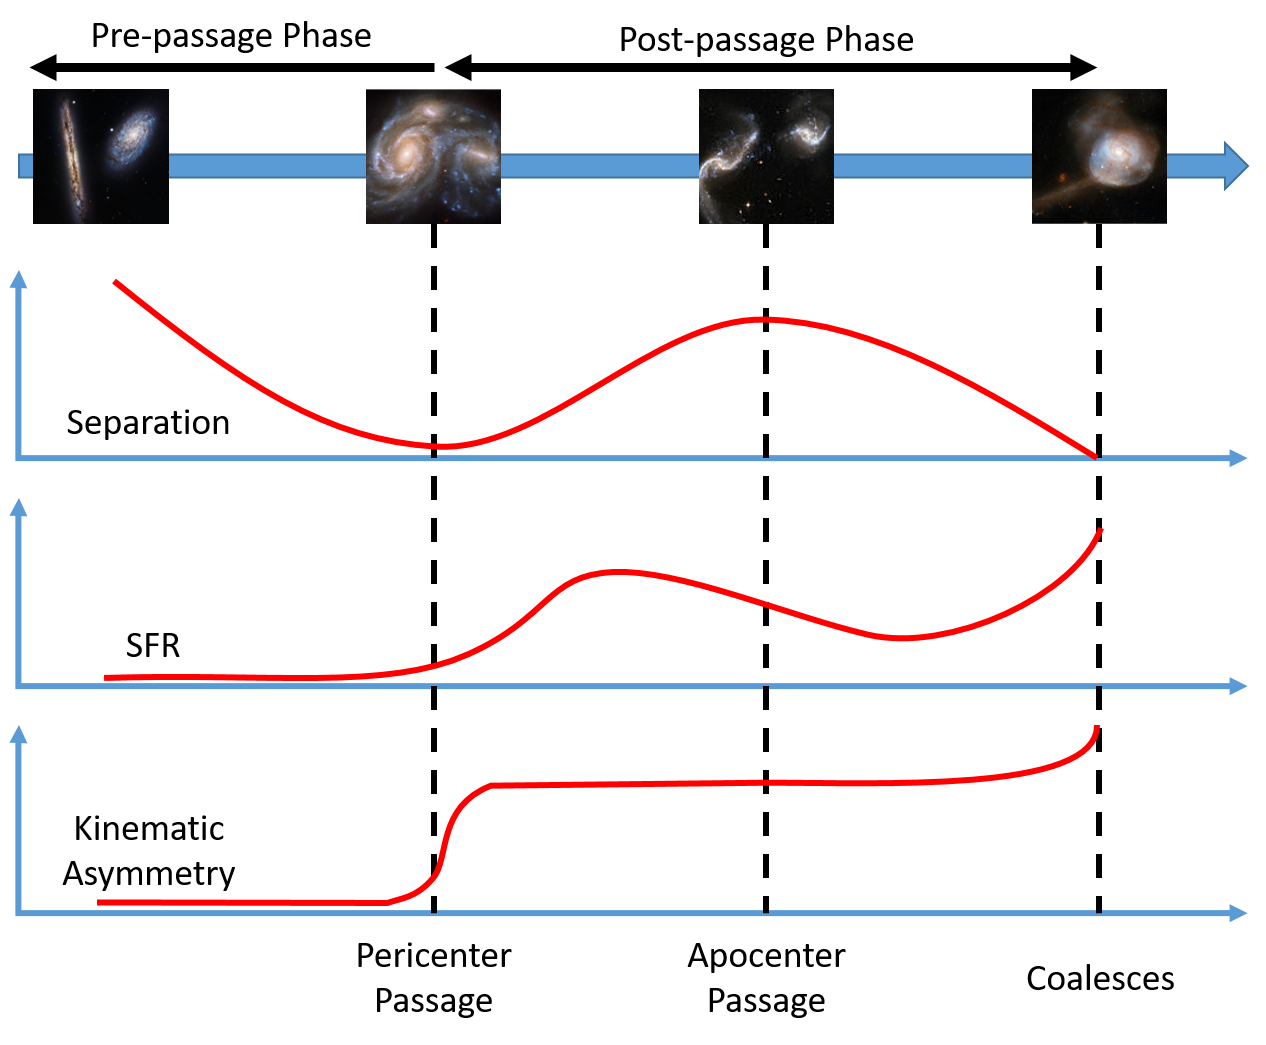
The SFR enhancement results shown in Panel (B), and (C) are in good agreement with the merging stage scenario we discussed in Section 3.1. Numerical simulations suggest that the SFR enhancement mainly happens after the pericenter passage of galaxy merging (Moreno et al., 2015). It means, only at the late stage of galaxy merging (e.g., after the first pericenter passage), there is enough time to disturb both the ionized gas (to induce kinematic asymmetry) and neutral gas (to enhance star formation). To sum up, we outline the global galaxy merging process below, and illustrate it with a schematic diagram in Figure 3.
During the hierarchical structure formation, two galaxies begin to form a galaxy pair and have interactions on each other, starting from a projected separation out to . In the process of galaxies approaching each other, the tidal force increases, and the velocity field starts to be disturbed. Then, at the stage of the first pericenter passage, the tidal force reaches the maximum, and the member galaxies show moderate velocity asymmetry and enhanced star formation. After the first pericenter passage, accompanying with the gas consumption, the tidal force decreases and so that the enhanced star formation might also gradually decrease, while the disturbed velocity field (morphology) is kept. At the very late stage of galaxy merging, i.e., at the second pericenter passage or right before the final coalescence, these paired galaxies have very small separation (projected separation), suffer the strongest tidal effect, and therefore show the highest SFR enhancement.
Within this merging stage scenario, the statistical correlation between the SFR enhancement and the projected separation reported in many previous works (e.g. Scudder et al., 2012; Patton et al., 2013) is a natural conclusion. Moreover, only the galaxies with both small projected separation and high velocity asymmetry are in the late stage of the galaxy merging and show the strongest enhanced star formation. As a corroboration, the average is about for the galaxies in close pairs in general (Ellison et al., 2008; Feng et al., 2019), while is as high as for these HA galaxies in close pairs.
3.3 Radial Profiles of SFR
In Section 3.2, we have shown that only the paired galaxies with high kinematic asymmetry show significant SFR enhancement. In this section, we take advantage of IFS data to explore further where the enhanced SFR happens.
We use the radial profiles of flux to represent the SFR profiles. For each galaxy, we take flux maps from MaNGA DAP and bin it into a sequence of concentric elliptical rings. The position angle and ellipticity of concentric elliptical rings are taken from the SERSIC_PHI and SERSIC_BA of -band in NSA catalog. The semi-major axes of elliptical rings span from to , where is the effective radius of -band image for the single Sersic fitting. We only use the spaxels with reliable emission line flux measurements (S/N for , and S/N for , and ) and that are classified as star-forming regions according to the criteria of Kauffmann et al. (2003) in BPT diagram. We make corrections on flux for each star-forming spaxel using the Balmer decrement:
| (3) |
where the intrinsic line ratio of is assumed to be 2.86, and the attenuation curve is adopted as Calzetti et al. (2000). Then, the radial profile of flux of each paired galaxy, is obtained by calculating the mean values of the star-forming spaxels enclosed by the elliptical rings. To simplify the comparison in the next steps, we normalize the flux profile of each galaxy with its flux at an effective radius . Finally, we take the mean values of of a sub-sample of galaxies to represent their average SFR profiles.
We show the relative SFR profiles of three sub-samples of paired galaxies in the panel (D) of Figure 2. The SFR profiles of their corresponding control galaxies are also plotted as dotted lines for comparison. The three samples of control galaxies, although with different stellar mass distributions (right panel of Figure 1), show almost identical SFR profiles after scaled with their effective radii . Also, as expected, the SFR profiles of the LA and MA galaxies are very similar to the control galaxies because of their negligible SFR enhancement. For the HA galaxies, the radial profile of the outer region () is almost the same as the control galaxies, while it is significantly enhanced in the inner region (). Combining the enhancement of total SFR shown in the panel (B) and (C) of Figure 2 (Section 3.2), we further conclude that the SFR enhancement of HA galaxies mainly happens in their inner region. Our finding is consistent with Moreno et al. (2015), where the enhanced SFR in paired galaxies is found inside a few kpcs (see also Pan et al. 2019).
The inner SFR enhancement () shown in panel (D) is very likely due to the increase of the gas density caused by the tidal-induced gas inflow. In the paired galaxies, the tidal-induced gas inflow usually happens after the pericenter passage (Torrey et al., 2012), which then contributes an asymmetric component into its velocity field, and so that increases the value. Not only that, the inflowing gas also increases the gas density of the inner regions (Barnes & Hernquist, 1996; Moreno et al., 2015) and then enhance the star formation there in short time-scales (Feng et al., 2019). Therefore, this radial dependent SFR enhancement result reinforces the merging stage scenario we proposed in Section 3.2.
4 Discussion: Bar-induced Asymmetry
Kinematic asymmetry is mainly contributed by non-rotating motion. Besides the tidal-induced gas disturbance, the bar-driven gas inflow also enhances non-rotating components of the velocity field (Regan et al., 1999). Moreover, many observations have suggested that barred galaxies also show enhanced SFR (Chown et al., 2019). To test whether the barred galaxies play a role in our study, we further check the correlation between the velocity field asymmetry and enhanced SFR for the non-bar paired galaxies. We take the bar and non-bar classification from the Galaxy Zoo project (Willett et al., 2013; Hart et al., 2016). In our 578 paired galaxies, 270 galaxies have reliable classification. Among them, 227 are non-bar, and 53 are barred galaxies.
We repeat all the earlier analysis of these non-bar galaxies. The results for non-bar galaxies are almost the same as the results for all paired galaxy sample. As an example, we show the enhanced SFR as a function of the projected distance for non-bar galaxies with dashed lines in panel (B) of Figure 2. Therefore, we conclude that the increase of and SFR in paired galaxies are mainly caused by the tidal-induced gas inflow rather than the bar effect. Does the bar-phenomena play any roles in galaxy pairs? Taking a preliminary look, the fraction of barred galaxy in our paired galaxy sample is , which is slightly larger than the control sample (). That indicates interactions between pair members may induce the bar structure (Peschken & Łokas, 2019). The detailed answer to this question, however, is beyond the scope of this study.
5 Summary
We select paired star-forming galaxies from the MaNGA survey. Using kinemetry package, we successfully fit the velocity map of 578 galaxies and quantify their kinematic asymmetry by the parameter . Then, we separate these galaxies into three sub-samples according to the and compare their physical properties.
First, We find that the fraction of galaxies with large values is much higher in close pairs () than in pairs with larger separations. Second, for the total SFR, only the paired galaxies with large values have significant enhancement comparing to isolated galaxies. In contrast, there is little SFR enhancement in the paired galaxies with small values, even for . Third, the SFR enhancement of paired galaxies with large values mainly happens in the inner region of galaxies ().
From these results, we suggest that the kinematic asymmetry is a better indicator of galaxy-galaxy interaction than the projected separation, which is commonly used in statistical studies of galaxy pairs. The paired galaxies with high kinematic asymmetry are very likely at the stage after pericenter passage. During this stage, the tidal-induced inflow significantly increases the gas density at the inner region of galaxies and enhances the star formation there in short time scales.
In our scenario, tidal effects first produce the acceleration, change the velocity field, and then disturb the morphology. Therefore, the disturbed morphology is also a good indicator of the interactions between galaxy pairs (Barrera-Ballesteros et al., 2015; Pan et al., 2019). Correlations between the kinematic asymmetry and disturbed morphology have also been found (Hung et al., 2016; Bloom et al., 2017). Comparing with kinematics measurement, photometric morphology is much cheaper. Nevertheless, we emphasize the distortion of the velocity field happens on shorter time scales than the distortion of morphology. Also, given the accuracy of the velocity measurement is up to a few kilometers per second for typical resolution galaxy spectroscopy, we conclude that the velocity field asymmetry measurement is a more sensitive indicator of galaxy interaction than morphology.
In the future, by combining the analysis of the velocity field and morphology of the paired galaxies together and comparing it with the numerical simulations, it is possible to establish a complete and detailed merging scenario of galaxies.
References
- Barnes & Hernquist (1996) Barnes, J. E., & Hernquist, L. 1996, ApJ, 471, 115
- Barrera-Ballesteros et al. (2015) Barrera-Ballesteros, J. K., García-Lorenzo, B., Falcón-Barroso, J., et al. 2015, A&A, 582, A21
- Belfiore et al. (2019) Belfiore, F., Westfall, K. B., Schaefer, A., et al. 2019, AJ, 158, 160
- Blanton et al. (2017) Blanton, M. R., Bershady, M. A., Abolfathi, B., et al. 2017, AJ, 154, 28
- Bloom et al. (2017) Bloom, J. V., Fogarty, L. M. R., Croom, S. M., et al. 2017, MNRAS, 465, 123
- Bloom et al. (2018) Bloom, J. V., Croom, S. M., Bryant, J. J., et al. 2018, MNRAS, 476, 2339
- Bundy et al. (2015) Bundy, K., Bershady, M. A., Law, D. R., et al. 2015, ApJ, 798, 7
- Calzetti et al. (2000) Calzetti, D., Armus, L., Bohlin, R. C., et al. 2000, ApJ, 533, 682
- Chown et al. (2019) Chown, R., Li, C., Athanassoula, E., et al. 2019, MNRAS, 484, 5192
- Croom et al. (2012) Croom, S. M., Lawrence, J. S., Bland-Hawthorn, J., et al. 2012, MNRAS, 421, 872
- Drory et al. (2015) Drory, N., MacDonald, N., Bershady, M. A., et al. 2015, AJ, 149, 77
- Ellison et al. (2011) Ellison, S. L., Patton, D. R., Mendel, J. T., & Scudder, J. M. 2011, MNRAS, 418, 2043
- Ellison et al. (2008) Ellison, S. L., Patton, D. R., Simard, L., & McConnachie, A. W. 2008, AJ, 135, 1877
- Feng et al. (2019) Feng, S., Shen, S.-Y., Yuan, F.-T., et al. 2019, ApJ, 880, 114
- Gunn et al. (2006) Gunn, J. E., Siegmund, W. A., Mannery, E. J., et al. 2006, AJ, 131, 2332
- Hart et al. (2016) Hart, R. E., Bamford, S. P., Willett, K. W., et al. 2016, MNRAS, 461, 3663
- Hernández-Toledo et al. (2005) Hernández-Toledo, H. M., Avila-Reese, V., Conselice, C. J., & Puerari, I. 2005, AJ, 129, 682
- Hernández-Toledo et al. (2006) Hernández-Toledo, H. M., Avila-Reese, V., Salazar-Contreras, J. R., & Conselice, C. J. 2006, AJ, 132, 71
- Hung et al. (2016) Hung, C.-L., Hayward, C. C., Smith, H. A., et al. 2016, ApJ, 816, 99
- Karachentsev (1987) Karachentsev, I. D. 1987, Dvojnye galaktiki (Double galaxies).
- Kauffmann et al. (2003) Kauffmann, G., Heckman, T. M., Tremonti, C., et al. 2003, MNRAS, 346, 1055
- Kewley et al. (2006) Kewley, L. J., Geller, M. J., & Barton, E. J. 2006, AJ, 131, 2004
- Krajnović et al. (2006) Krajnović, D., Cappellari, M., de Zeeuw, P. T., & Copin, Y. 2006, MNRAS, 366, 787
- Law et al. (2015) Law, D. R., Yan, R., Bershady, M. A., et al. 2015, AJ, 150, 19
- Law et al. (2016) Law, D. R., Cherinka, B., Yan, R., et al. 2016, AJ, 152, 83
- Li et al. (2008) Li, C., Kauffmann, G., Heckman, T. M., Jing, Y. P., & White, S. D. M. 2008, MNRAS, 385, 1903
- Liu et al. (2012) Liu, X., Shen, Y., & Strauss, M. A. 2012, ApJ, 745, 94
- Michel-Dansac et al. (2008) Michel-Dansac, L., Lambas, D. G., Alonso, M. S., & Tissera, P. 2008, MNRAS, 386, L82
- Mihos & Hernquist (1996) Mihos, J. C., & Hernquist, L. 1996, ApJ, 464, 641
- Moreno et al. (2015) Moreno, J., Torrey, P., Ellison, S. L., et al. 2015, MNRAS, 448, 1107
- Pan et al. (2019) Pan, H.-A., Lin, L., Hsieh, B.-C., et al. 2019, ApJ, 881, 119
- Patton et al. (2016) Patton, D. R., Qamar, F. D., Ellison, S. L., et al. 2016, MNRAS, 461, 2589
- Patton et al. (2013) Patton, D. R., Torrey, P., Ellison, S. L., Mendel, J. T., & Scudder, J. M. 2013, MNRAS, 433, L59
- Peschken & Łokas (2019) Peschken, N., & Łokas, E. L. 2019, MNRAS, 483, 2721
- Regan et al. (1999) Regan, M. W., Sheth, K., & Vogel, S. N. 1999, ApJ, 526, 97
- Salim et al. (2018) Salim, S., Boquien, M., & Lee, J. C. 2018, ApJ, 859, 11
- Salim et al. (2016) Salim, S., Lee, J. C., Janowiecki, S., et al. 2016, ApJS, 227, 2
- Sánchez et al. (2012) Sánchez, S. F., Kennicutt, R. C., Gil de Paz, A., et al. 2012, A&A, 538, A8
- Satyapal et al. (2014) Satyapal, S., Ellison, S. L., McAlpine, W., et al. 2014, MNRAS, 441, 1297
- Scudder et al. (2012) Scudder, J. M., Ellison, S. L., Torrey, P., Patton, D. R., & Mendel, J. T. 2012, MNRAS, 426, 549
- Shen et al. (2016) Shen, S.-Y., Argudo-Fernández, M., Chen, L., et al. 2016, Research in Astronomy and Astrophysics, 16, 43
- Smee et al. (2013) Smee, S. A., Gunn, J. E., Uomoto, A., et al. 2013, AJ, 146, 32
- Soares (2007) Soares, D. S. L. 2007, AJ, 134, 71
- Toomre & Toomre (1972) Toomre, A., & Toomre, J. 1972, ApJ, 178, 623
- Torrey et al. (2012) Torrey, P., Cox, T. J., Kewley, L., & Hernquist, L. 2012, ApJ, 746, 108
- Wake et al. (2017) Wake, D. A., Bundy, K., Diamond-Stanic, A. M., et al. 2017, AJ, 154, 86
- Westfall et al. (2019) Westfall, K. B., Cappellari, M., Bershady, M. A., et al. 2019, AJ, 158, 231
- Willett et al. (2013) Willett, K. W., Lintott, C. J., Bamford, S. P., et al. 2013, MNRAS, 435, 2835
- Yan et al. (2016a) Yan, R., Tremonti, C., Bershady, M. A., et al. 2016a, AJ, 151, 8
- Yan et al. (2016b) Yan, R., Bundy, K., Law, D. R., et al. 2016b, AJ, 152, 197