Phonon structure of titanium under shear deformation along twinning mode
Abstract
We investigated phonon behavior of hexagonal close packed titanium under homogeneous shear deformation corresponding to the twinning mode using first-principles calculation and phonon calculation. By this deformation, we found that a phonon mode located at a point on Brillouin zone boundary is drastically soften increasing the shear and finally it triggers a spontaneous structural transition by breaking the crystal symmetry toward twin from parent.
I Introduction
The crystallography of deformation twinning has been studied by Bilby et al.Bilby et al. (1965) in 1965 and Bevis et al.Bevis et al. (1968) in 1968. Croker and Bevis also reported that for titanium specifically in 1970.Crocker and Bevis (1970) These studies were well summarized in the review paper by Christian and Mahajan in 1995.Christian and Mahajan (1995) These studies are based on the concept that the deformation twinning is characterized by collective displacement of atoms.Cayron (2018) Therefore, phonon should play a central role in the deformation twinning. Recently, increase of computational power has enabled to perform first principles phonon calculation routinely. We applied this phonon calculation to the deformation twinning to discuss the structural transition from parent to twin in a quantitative manner as described in the following sections. In this report, we take the twinning mode of the hexagonal close-packed (HCP) titanium as a simple example to apply our general approach using the phonon calculation.
There are recent reports by using first principles calculations on microscopic mechanism of deformation twinning involving twin boundary.Pei et al. (2017); Jiang et al. (2019) However we take the traditional crystallographic approach to construct the calculation model with homogeneous shear without including the twin boundary. The first-principles phonon calculation is applied to this sheared-parent structure model to seek a characteristic phonon mode that exhibits structural instability under a certain shear. We show that the spontaneous structural transition induced by this phonon instability triggers transformation from the sheared-parent to twin. The final collective displacement of atoms predicted by this calculation excellently agrees with those reported in Refs. Bilby et al., 1965; Bevis et al., 1968; Crocker and Bevis, 1970; Christian and Mahajan, 1995 as the shuffling mechanism.
Throughout this report, we employ symmetry constraints to distinguish the parent, sheared-parent, shuffling, sheared-twin, and twin structures. Here the shuffling structure is defined as the instantaneous structure that appears during rearrangement of atomic positions by the transformation from the sheared-parent to sheared-twin structure. More details are provided in the following sections. The aim of use of crystal symmetry is to analyze the mechanism of the deformation twinning in a comprehensible way by limiting the number of degrees of atomistic freedom. Thus an important contribution from this report may be detailed symmetry information provided along the transition pathway from the parent to twin structure.
This report is organized as follows. In Sec. II, a calculation model of the crystal structure is defined using a transformation matrix to represent the homogeneous shear corresponding to the twinning mode. In Sec. III, computational details of the first principles calculation and phonon calculation are given along with the convergence test against -point density and smearing width of electronic structure calculation. In Sec. IV, the transformation from the parent to twin structure is discussed from a viewpoint of collective displacement of atoms. Finally, shuffling mechanism of the deformation twinning is associated with symmetry breaking of the sheared-parent structure induced by the unstable phonon mode.
II Calculation model
II.1 Unit cell representations
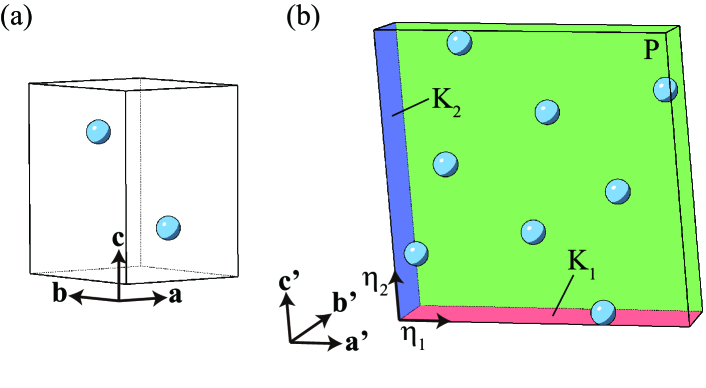
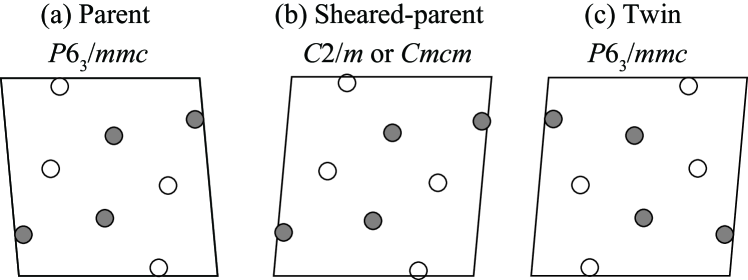
The HCP crystal structure is shown in Fig. 1 (a). The set of the basis vectors is given as . To represent the twinning mode characterized by and directions, and planes, and the plane of shear , it is convenient to retake the HCP unit cell by its extended unit cell as depicted in Fig. 1 (b). The set of the basis vectors of the extended unit cell, , is chosen to satisfy the conditions , , and . The change-of-basis is easily represented using an integer matrix :
| (1) |
with
| (2) |
where the bars on the matrix elements denote the negative numbers. The conditions of and are easily confirmed finding .
II.2 Lattice under homogeneous shear
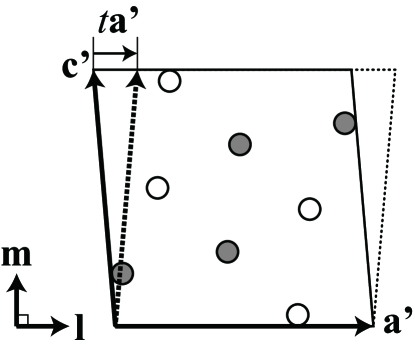
Following the usual crystallographic definition of deformation twinning,Christian and Mahajan (1995) we impose homogeneous shear corresponding to the twinning mode to the extended unit cell. In Fig. 2, the extended unit cell is illustrated being projected on the plane of shear . The basis vectors and are parallel to the plane, and the basis vector is perpendicular to the plane.
The homogeneous shear is written by an affine transformation:
| (3) |
where is the matrix representation of the shear, and and are the vectors. By this homogeneous shear , the basis vectors are transformed to as follows:
| (4) |
Following the convention by Christian and Mahajan in Ref. Christian and Mahajan, 1995, to represent the twinning mode, we take a Cartesian axis the unit vector parallel to and the unit normal to the plane as shown in Fig. 2. Choosing the orientation by and , the basis vectors are given in the Cartesian coordinates as
| (5) |
By this choice of the coordinates, the homogeneous shear is simply represented by only one free variable Christian and Mahajan (1995),
| (6) |
The basis vectors and are unchanged applying this , whereas is transformed to .
It is more convenient for us to represent the homogeneous shear as a linear combination of the basis vectors since the choice of the orientation in the Cartesian coordinates becomes arbitrary. This is written by a transformation matrix :
| (7) |
To have as shown in Fig. 2, we take
| (8) |
In the Cartesian coordinates (5), the relationship between and is given as
| (9) |
This is found by combining Eqs. (4) and (7) as , where is the matrix whose columns are , , and in the Cartesian coordinates (5).
From Eqs. (1) and (7), we obtain the basis vectors under the homogeneous shear, , by
| (10) |
Here Eq. (10) is independent on the orientation of Cartesian coordinates. The combined transformation matrix is used to construct the sheared HCP unit cells for the first-principles calculation and phonon calculation.
II.3 Sheared-parent structure and shuffling
At a certain twinning shear in the matrix (6), the sheared lattice gets to have the same lattice as the parent lattice with a different orientation, and thus the same point group symmetry as the parent lattice. The twinning shear of the twinning mode is known as with .Bilby et al. (1965); Bevis et al. (1968); Crocker and Bevis (1970) Similarly, that in is easily found from Fig. 2 as . Sicne the ratio is a good measure of the homogeneous shear in this study, we employ as the representative parameter in the following part of this report.
Even at , the space group symmetry of the sheared-parent structure is unnecessarily the same as that of the parent structure. For the sheared-parent structure to have the same space group symmetry as the parent, i.e., to form the twin, usually a certain rearrangement of the atomic positions is required. This rearrangement may be called “shuffling”, and for the use of this terminology clearly in our calculations, we define it in a little more detail as follows.
The space group type of the HCP crystal structure is (No. 194) and its site symmetry type (Wyckoff position) of all atoms is (). Obviously, the homogeneous shear for the twinning mode breaks these symmetries. Keeping crystallographic coordinates of atoms unchanged under the lattice shear, these symmetries are reduced to (No. 12) and (), respectively, except at , (No. 63) and (), respectively.
For simplicity, we assume that sheared structure is either sheared-parent structure or sheared-twin structure in the interval of , and the sheared-parent and sheared-twin structures may transform each other by rearranging their atomic positions. In this rearrangement, we expect that the atoms are displaced collectively and their displacement distances are much shorter than the distance between the nearest neighboring atoms.
We fix the crystal symmetry of the sheared-parent structure as . Unless breaking this symmetry, we allow to relax the positions of the atoms, by which the atoms can be displaced within their planes parallel to the plane of shear . The atomic displacement by this relaxation is written as
| (11) |
where is the position of the atom after the relaxation at and is the crystallographic coordinates corresponding to . The second line of Eq. (II.3) is the convenient expression for us to construct the crystal structure models. This relaxation is not considered as a part of the shuffling in this study. We require that the shuffling arises in association with temporal symmetry breaking by the rearrangement of the atomic positions.
III Method of calculation
III.1 Computational details
The phonon calculations were performed by the finite displacement method with the supercell approach, where the atoms were displaced. The supercells were created by multiplication of the sheared HCP unit cells obtained by in Eq. (10). For each phonon calculation, atomic displacements of 0.02 Å were introduced to the perfect supercells along and in plus and minus directions individually. For the phonon calculation, we employed the phonopy code.Togo and Tanaka (2015)
For the first-principles calculations, we employed the plane-wave basis projector augmented wave method Blöchl (1994) within the framework of density functional theory (DFT) as implemented in the VASP code.Kresse (1995); Kresse and Furthmüller (1996); Kresse and Joubert (1999) The generalized gradient approximation of Perdew, Burke, and Ernzerhof revised for solids Perdew et al. (2008) was used as the exchange correlation potential. A plane-wave energy cutoff of 300 eV was employed. The radial cutoff of the PAW dataset of Ti was 1.323 Å. The 3p electrons for Ti were treated as valence and the remaining electrons were kept frozen. The smearing method was used with the -point sampling on a uniform mesh for the Brillouin zone integration of the electronic structure. The and -point sampling meshes with half grid shifts along directions were used for the sheared HCP unit cells and their supercells, respectively, in conjunction with the smearing width eV in the Methfessel-Paxton scheme.Methfessel and Paxton (1989) These parameters were chosen after convergence check of the lattice parameter and phonon band structure as presented in the next section.
III.2 Choices of calculation parameters
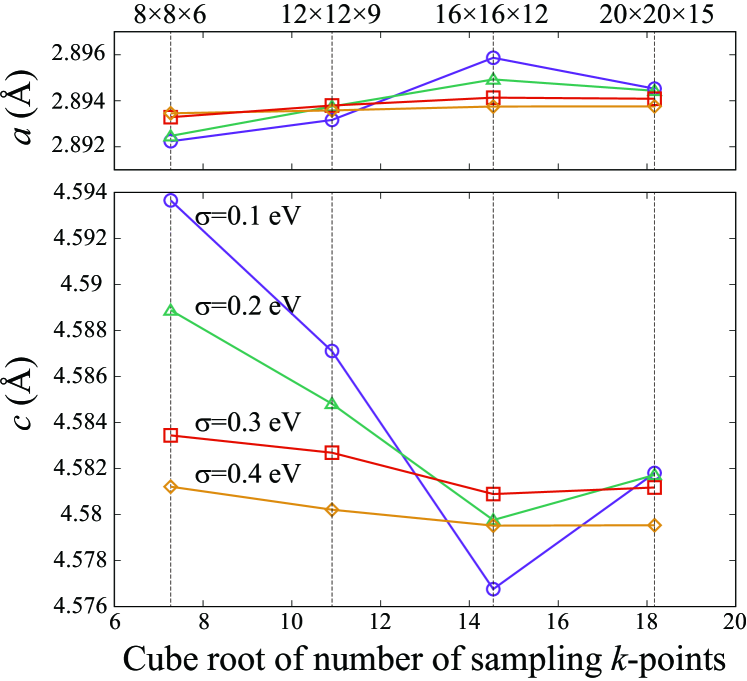
To choose the -point sampling mesh density and smearing width , we examined convergence of the lattice parameter of the HCP conventional unit cell and the phonon band structure with respect to these values. In general, use of denser -point sampling mesh provides better calculation accuracy at a constant smearing width . However, to save the computational demand, we expect to employ a sparser -point sampling mesh. For this purpose, we may choose a larger value although sacrificing fine detail of electronic structure. We have to find a good compromise between the -point sampling mesh and smearing width against the required accuracy of our computational research.
The calculated lattice parameters and with respect to the -point sampling mesh of , , , and for the HCP unit cell and , , , and eV are shown in Fig. 3. Clearly, the lattice parameter is more sensitive to both of the -point sampling mesh density and than . At , , and eV, the lattice parameters are getting to converge increasing the -point sampling mesh density. Use of eV requires an even denser -point sampling mesh, for which the phonon calculation with the supercell approach can be computationally too demanding for us. Therefore, we decided not to consider the use of eV. At eV, the lattice parameters are roughly constant at the different -point sampling meshes, and and are enough close to the more accurate results by eV and mesh. With the parameter pair of eV and mesh, which requires the smallest computational demand in this convergence test, we obtained and Å. These values underestimate the experimental values of and Å Wood (1962) by a few percent. This discrepancy is considered reasonably small for the purpose of this study.
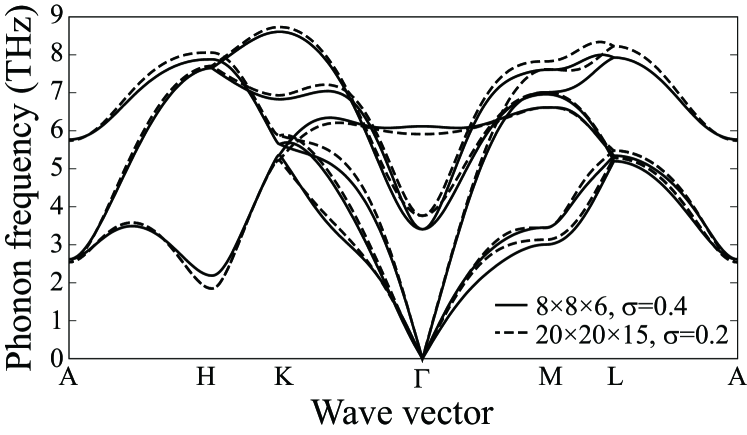
The phonon band structure calculated with the -point sampling mesh ( for supercell) and eV is compared with that with the -point sampling mesh ( for supercell) and eV as shown in Fig. 4. These phonon band structures reasonably agree with the experiment in Ref. Stassis et al., 1979 and calculation in Ref. Ko et al., 2015. Although we can see noticeable difference in phonon frequency between them, we consider this difference is small enough to discuss characteristic behavior of the phonon mode that we are interested in. Therefore we chose the -point sampling mesh of along with the smearing width of eV.
IV Results and discussion
IV.1 Optimization of sheared-parent structures
The crystal structure models of the parent, sheared-parent, and twin structures are shown in Fig. 5. The parent and twin structures have the space group type of whereas the twin is oriented in a different direction from the parent after the shuffling.
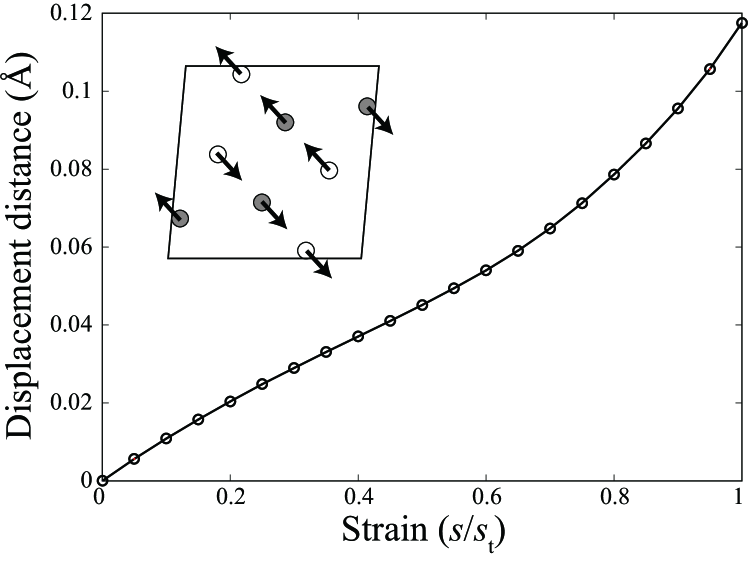
To create the sheared-parent structure models, we sampled 21 homogeneous shears in the interval of uniformly, and the first-principles calculations were performed to optimize their internal atomic positions under the symmetry constraint. The displacement distances (see Eq. (II.3)) obtained as the results of the structure optimizations are shown in Fig. 6. Since of the all atoms in the unit cell at each are the same due to the crystal symmetry, only one value at each is shown. The approximate directions of the displacements are shown in the inset. The atoms having the same displacement directions in this figure are symmetrically equivalent by the lattice translation, i.e., only two directions can exist and they are directed in the opposite directions as proposed by the crystal symmetry. The displacement distances increase as increasing . Even at , the displacement distance is only about 4% of the nearest neighbor distance. Therefore, for the schematic analysis, performing this optimization is considered unimportant, although it is necessary for accurate phonon calculation.
IV.2 Energy increase by homogeneous shear
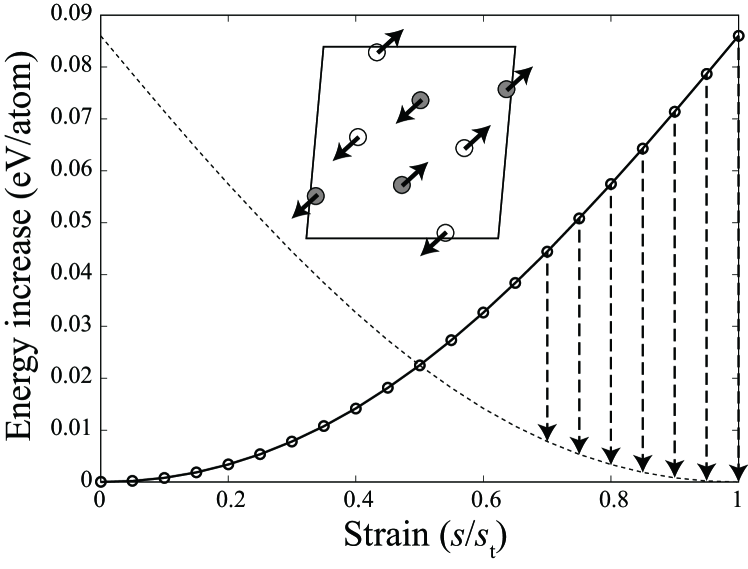
In Fig. 7, we show electronic total energy increase of the sheared-parent structure with respect to the homogeneous shear under the symmetry constraint. Increasing the shear, the energy increases harmonically. From the definition of the deformation twinning, we know that the sheared-twin structures have to give the same energy curve with respect to . This is drawn by the dotted curve as the mirror image of that of the parent. The crossing of these energy curves at implies that their energy surfaces are disjointed in the atomic configuration space under the symmetry constraints of .
IV.3 Spontaneous symmetry breaking due to shear
At , breaking the symmetry constraint may allow the sheared-parent structure to transform to the sheared-twin structure spontaneously. This is guessed due to the fact that the twinning mode exists. Therefore, we investigated this systematically as follows.
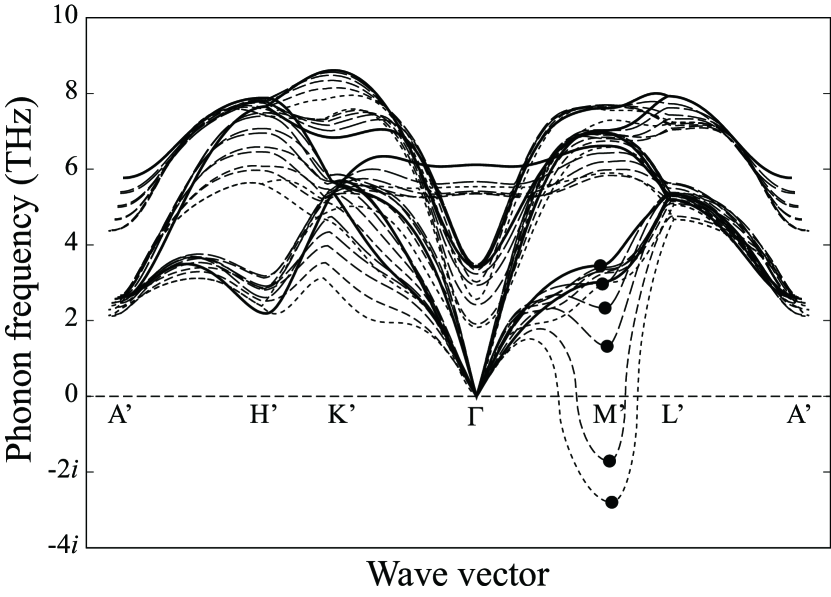
We applied a series of the phonon calculations to the sheared-parent structures at the 21 homogeneous shears that are the same shears as those chosen in Secs. IV.1 and IV.2. The phonon band structures calculated at the selected shears are shown in Fig. 8. One phonon mode at the wave vector exhibits imaginary frequency at the larger shears. This indicates that spontaneous structural transformation should occur by breaking symmetry. Note that the coordinates of are represented in the basis vectors given by Eq. (10).
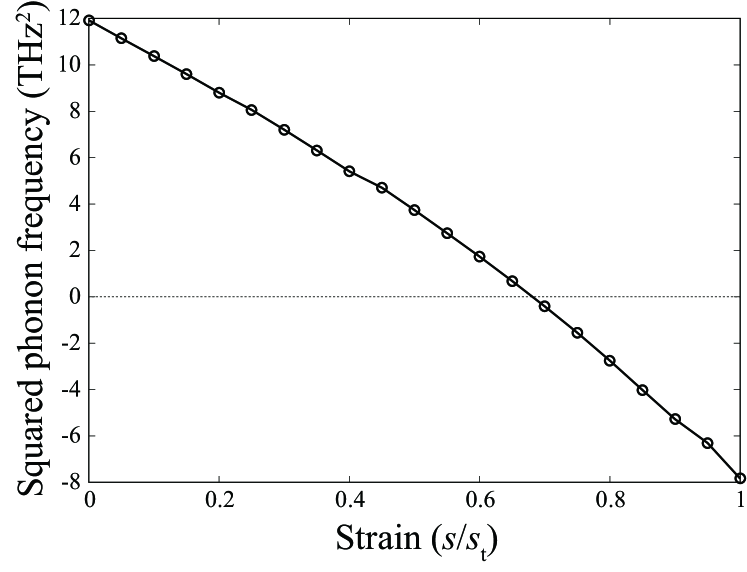
This behavior is similar to the structural phase transition induced by changing an intensive parameter such as pressure or temperature.Dove (1993) Assuming the second-order-like structural phase transition, the squared frequency of the characteristic phonon mode is considered to be related to the order parameter. Hence we plotted it as a function of the homogeneous shear as shown in Fig. 9, and the roughly linear trend was found as expected. From this plot, the critical shear was estimated as .
IV.4 Shuffling
The polarization vector (eigenvector) of the characteristic phonon mode at contains necessary information to properly break the crystal symmetry by introducing collective displacement of atoms that is illustrated in the inset of Fig. 7. In this figure, the arrows directed from the atoms in the sheared-parent structure depict directions of the atomic displacements with the same relative amplitude. This symmetry breaking doubles the primitive cell and the space group type is reduced to (No. 15).
Small finite displacements along the polarization vector were introduced to the sheared-parent structure models so that the first-principles calculation code, VASP, can detect the broken symmetry correctly. Then, we performed the first-principles calculation to optimize these structure models at the homogeneous shears with their basis vectors fixed. After the structure optimizations, we obtained the sheared-twin structures at and the twin structure at , i.e., the structures did not fall into local minima. This structural transformation is the shuffling that we consider.
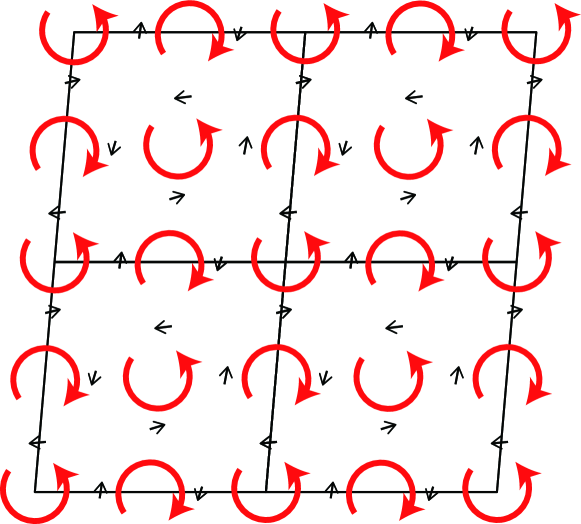
The atomic displacements by this transformation at is shown by small (black) arrows in Fig. 10. The displacement distance is roughly constant by 0.5 Å (17% of the interatomic distance) at all larger than the critical shear. The minimum structural unit of the collective displacement is composed of four atoms. We can see that two types of the parallelogram units are arranged to fill the crystal structure by alternately changing their rotation directions depicted by the (red) circular arrows. The spaces surrounded by these rotation units behave like breathing. In this manner, it is considered that the internal structural distortion required by the shuffling is minimized. This illustration is almost the same as that obtained from the crystallographic discussion of the shuffling for the twinning mode by Crocker and Bevis in Ref. Crocker and Bevis, 1970. What was found in this study is that this shuffling necessarily occurs at the shear larger than the critical shear.
Energy difference between the sheared-parent and sheared-twin structures is released by the shuffling as depicted by the arrows with the vertical dashed lines in Fig. 7. In between and the critical shear , the potential energy barrier should prevent the shuffling from being initiated. In real materials, imperfection of crystal may lower the potential energy barrier locally, and the shuffling initiated from this point will propagate over the whole crystal body at the velocity of sound by the help of the released energy to result in the macroscopic transformation. It would be difficult to observe how the twin forms from the parent microscopically, since the sheared parent relaxes toward the twin instantaneously. What we can measure by experiments as an evidence of this shuffling mechanism like a structural phase transition is the systematic frequency change of the characteristic phonon mode at as the precursor effect, for which inelastic neutron or X-ray scattering techniques can be employed.
V Summary
We investigated the microscopic mechanism of the twinning mode of the HCP titanium using the first principles calculation and phonon calculation. As the calculation model, the sheared-parent structures were defined by change of basis and transformation matrices at the specific homogeneous shears corresponding to the twinning mode. At the homogeneous shears of , the phonon mode instability under the symmetry constraint was exhibited at a Brillouin zone boundary of . Breaking the crystal symmetry following the polarization vector (eigenvector) of this characteristic phonon mode, the sheared-twin structure was obtained after optimizing internal positions of atoms. This indicates the mechanism of the formation of the deformation twinning of this system. These calculations provide the structural transition pathway from the parent to twin, which may be widely accepted as the “shuffling”. The collective displacement of atoms obtained from the phonon calculation agrees with the shuffling mechanism reported by Crocker and Bevis Crocker and Bevis (1970) from the crystallographic argument. We applied the same approach to the other twinning modes of HCP metals and found that the shuffling of the twinning mode is the simplest case. For the others, it may be hard for the simple crystallographic approach to find their reasonable collective displacements of atoms since those atoms are rearranged in more complicated ways three dimensionally than that of the twinning mode. These results of the other twinning modes will be published elsewhere. In this report, we provided a systematic calculational approach to explore microscopic mechanism of deformation twinning, and the technical details were written in this report. The computational resource and tools necessary to perform this calculation are usual. Therefore any researcher who is interested in the deformation twinning can achieve the similar calculations immediately and find specific details of their twinning modes. This is probably the largest contribution of this report to the field of deformation twinning.
ACKNOWLEDGMENTS
This work was supported by MEXT Japan through ESISM (Elements Strategy Initiative for Structural Materials) of Kyoto University.
References
- Bilby et al. (1965) B. A. Bilby, A. G. Crocker, and A. H. Cottrell, Proc. Roy. Soc. A 288, 240 (1965).
- Bevis et al. (1968) M. Bevis, A. G. Crocker, and L. Rosenhead, Proc. Roy. Soc. A 304, 123 (1968).
- Crocker and Bevis (1970) A. G. Crocker and M. Bevis, in The Science, Technology and Application of Titanium, edited by R. I. Jaffee and N. E. Promisel (Pergamon, 1970) pp. 453–458.
- Christian and Mahajan (1995) J. W. Christian and S. Mahajan, Progress in Materials Science 39, 1 (1995).
- Cayron (2018) C. Cayron, Crystals 8 (2018).
- Pei et al. (2017) Z. Pei, X. Zhang, T. Hickel, M. Friák, S. Sandlöbes, B. Dutta, and J. Neugebauer, Npj Comput. Mater. 3, 6 (2017).
- Jiang et al. (2019) S. Jiang, Z. Jiang, and Q. Chen, Sci. Rep. 9, 618 (2019).
- Togo and Tanaka (2015) A. Togo and I. Tanaka, Scr. Mater. 108, 1 (2015).
- Blöchl (1994) P. E. Blöchl, Phys. Rev. B 50, 17953 (1994).
- Kresse (1995) G. Kresse, J. Non-Cryst. Solids 193, 222 (1995).
- Kresse and Furthmüller (1996) G. Kresse and J. Furthmüller, Comput. Mater. Sci. 6, 15 (1996).
- Kresse and Joubert (1999) G. Kresse and D. Joubert, Phys. Rev. B 59, 1758 (1999).
- Perdew et al. (2008) J. P. Perdew, A. Ruzsinszky, G. I. Csonka, O. A. Vydrov, G. E. Scuseria, L. A. Constantin, X. Zhou, and K. Burke, Phys. Rev. Lett. 100, 136406 (2008).
- Methfessel and Paxton (1989) M. Methfessel and A. T. Paxton, Phys. Rev. B 40, 3616 (1989).
- Pizzi et al. (2016) G. Pizzi, A. Cepellotti, R. Sabatini, N. Marzari, and B. Kozinsky, Comput. Mater. Sci. 111, 218 (2016).
- Aii (265a) https://github.com/aiida-vasp/aiida-vasp (commit be4b265a).
- Aii (ad35) https://github.com/aiida-phonopy/aiida-phonopy (commit 26c3ad35).
- Wood (1962) R. M. Wood, Proc. Phys. Soc. 80, 783 (1962).
- Stassis et al. (1979) C. Stassis, D. Arch, B. N. Harmon, and N. Wakabayashi, Phys. Rev. B 19, 181 (1979).
- Ko et al. (2015) W.-S. Ko, B. Grabowski, and J. Neugebauer, Phys. Rev. B 92, 134107 (2015).
- Aroyo et al. (2014) M. I. Aroyo, D. Orobengoa, G. de la Flor, E. S. Tasci, J. M. Perez-Mato, and H. Wondratschek, Acta Crystallogr. Sect. A 70, 126 (2014).
- Dove (1993) M. T. Dove, Introduction to Lattice Dynamics (Cambridge University Press, 1993).