Computational Modeling of Cardiac Growth and Remodeling in Pressure Overloaded Hearts — Linking Microstructure to Organ Phenotype
Abstract
Cardiac growth and remodeling (G&R) refers to structural changes in myocardial tissue in response to chronic alterations in loading conditions. One such condition is pressure overload where elevated wall stresses stimulate the growth in cardiomyocyte thickness, associated with a phenotype of concentric hypertrophy at the organ scale, and promote fibrosis. The initial hypertrophic response can be considered adaptive and beneficial by favoring myocyte survival, but over time if pressure overload conditions persist, maladaptive mechanisms favoring cell death and fibrosis start to dominate, ultimately mediating the transition towards an overt heart failure phenotype. The underlying mechanisms linking biological factors at the myocyte level to biomechanical factors at the systemic and organ level remain poorly understood. Computational models of G&R show high promise as a unique framework for providing a quantitative link between myocardial stresses and strains at the organ scale to biological regulatory processes at the cellular level which govern the hypertrophic response. However, microstructurally motivated, rigorously validated computational models of G&R are still in their infancy.
This article provides an overview of the current state-of-the-art of computational models to study cardiac G&R. The microstructure and mechanosensing/mechanotransduction within cells of the myocardium is discussed and quantitative data from previous experimental and clinical studies is summarized. We conclude with a discussion of major challenges and possible directions of future research that can advance the current state of cardiac G&R computational modeling.
Statement of Significance
The mechanistic links between organ-scale biomechanics and biological factors at the cellular size scale remain poorly understood as these are largely elusive to investigations using experimental methodology alone. Computational G&R models show high promise to establish quantitative links which allow more mechanistic insight into adaptation mechanisms and may be used as a tool for stratifying the state and predict the progression of disease in the clinic. This review provides a comprehensive overview of research in this domain including a summary of experimental data. Thus, this study may serve as a basis for the further development of more advanced G&R models which are suitable for making clinical predictions on disease progression or for testing hypotheses on pathogenic mechanisms using in-silico models.
Keywords:
Growth and Remodeling, Pressure Overload, Structural Remodeling, Computational Modeling, Hypertrophy.
1 Introduction
The heart is an electrically controlled mechanical pump that propels blood through systemic and pulmonary circulations. It is able to adapt its output in various ways by changing rate or stroke volume to match metabolic demands of peripheral tissues over a broad range of conditions, from sleep to exercise. Its function depends on a highly complex and tightly orchestrated interaction between a collection of cells (such as myocytes, fibroblasts, endothelial, and vascular smooth muscle cells) and constituents of the extracellular matrix (ECM) (mainly collagen, but also proteoglycans and some elastin). The myocardium responds to changes in the environment, such as alterations in the electrical activation sequences or in mechanical loading conditions, by adaptation processes that alter myocardial structure and function. These adaptation processes which involve multiple molecular signaling pathways are generally referred to as growth and remodeling (G&R). Prevalent processes implicated in most remodeling patterns comprise altered myocyte dimensions (such as changes in myocyte size and shape due to the addition of sarcomeres), cell proliferation and apoptosis, and myocardial fibrosis. Depending on the type of outcome processes can be classified either as adaptive when favoring myocyte survival or as maladaptive when promoting apoptosis. Overall, G&R results in either adaptive or maladaptive patterns of hypertrophy where adaptation during early states of a disease tends to be a compensatory beneficial mechanism that normalizes heart function. If pathological stimuli persist, maladaptation increasingly dominates, initiating a gradual progression towards more severe diseased states.
Pressure overload of the left ventricle (LV) is a mechanical condition that causes G&R with a characteristic evolution of hypertrophic patterns [1]. The most prevalent pathologies causing pressure overload include aortic stenosis, aortic coarctation or systemic hypertension. These conditions are characterized by an elevated hemodynamic impedance during LV systole. Since cardiac output is governed by the metabolic demands of peripheral tissues the needed hydrodynamic energy and, thus, the biomechanical energy generated by the LV for providing adequate cardiac output meeting these demands increases with impedance of the systemic circulation. Thus the LV cavity must produce a higher pressure to compensate the pressure losses due to the elevated impedance. Higher pressure during systole translates then directly into an elevation in afterload for the LV, that is, the LV myocardium must produce higher systolic wall stresses, but also indirectly to an increase in preload, i.e. increased wall stresses during diastole, to maintain stroke volumes to produce the same normal cardiac output for a given heart rate.
According to the systolic-stress-correction hypothesis [2] pressure overload stimulates myocytes to grow in width, thereby increasing wall thickness and reducing wall stresses back to normal levels as the increased myocardial wall volume facilitates the generation of the same chamber force at lower stress levels. Thus LV hypertrophy (from the Greek word for increased growth) can be considered a compensatory remodeling response, leading to a typical concentric pattern of hypertrophy characterized by an altered ratio of wall thickness to chamber volume. Due to this adaptation the LV is able to maintain a normal cardiac output at a healthy ejection fraction (EF) despite potentially impaired diastolic LV function as a thicker walled potentially stiffer hypertrophied LV requires higher end-diastolic pressure to achieve adequate filling. At this mechanically compensated stage, pressure overload is usually asymptomatic. However, over time if pressure overload is sustained, end-diastolic pressure continues to rise, cardiac output and ejection fraction start to decrease and the LV cavity dilates. At the microstructural level, progressive myocardial fibrosis and cell death takes place [1], which leads to reduced ventricular compliance and progressive diastolic dysfunction [3, 4]. Eventually, the initially compensatory, adaptive growth associated with a concentric hypertrophic LV anatomy transits into maladaptive growth associated with ventricular dilation, initiating progress towards overt heart failure. It remains unclear whether molecular mechanisms account for this transition – from adaptive to maladaptive G&R – and, if so, whether interfering with signaling pathways can lead to new therapeutic approaches. Studies on hypertrophic signaling pathways do not necessarily support the stress correction hypothesis which is derived from macroscopic reasoning based on Laplace’s law [5, 6, 7].
While it appears obvious that any therapy must treat the root pathology causing the pressure overload condition, this is, to a lesser extent, the case concerning the decision on optimal type and timing of an intervention. For instance, aortic stenoses cause transvalvular pressure gradients leading to pressure overload in the LV. Various clinical options exist to lower pressure gradients back to normal such as surgical aortic valve repair or, for older or more frail patients, transcatheter aortic valve implant [8, 9]. As those carry specific risks interventions are often postponed long after the asymptomatic phase when first symptoms of heart failure start to manifest. However, if interventions are carried out too late the LV may have remodeled already to a significant degree where the potential of beneficial reverse remodeling is substantially reduced. [10, 11, 12, 13].
Also, there is a discrepancy between the onset of symptoms and identified markers of long-term outcome after aortic valve replacement (AVR) [14]. While reverse remodeling from a progressed state of disease to perfectly healthy conditions appears improbable, a partial reversion of structural changes has been reported, associated with marked reductions in LV mass and diastolic cavity size. However, at a too progressed disease state the potential of myocardial plasticity appears exhausted [15]. Therefore, the search for biomarkers has been the target of current research to find a better time point for surgical intervention, i.e., the time point when adaptive remodeling turns maladaptive [16]. Up until now there are no reliable criteria available to choose an optimal time point for an intervention where the risk of progressing towards heart failure exceeds the risk of intervention and at which remodeling is still largely reversible.
Similarly, the evaluation of the treatment’s success poses challenges as well, as the regression of fibrosis is progressing at slower time scales than the regression of contractility [4]. For instance, it has been reported by Krayenbuehl et al. [4] that reverse remodeling remained incomplete even years after surgical aortic valve repair as structural abnormalities still existed. Thus, faster regression of contractility combined with slower regression of fibrosis may lead to a LV with reduced compliance, thus impairing diastolic filling and – due to insufficient preload – the Frank-Starling mechanism, and a limited contractile reserve. Additionally, Krayenbuehl et al. [4] hypothesized that this may point to a maladaption of the extracellular matrix (ECM) which manifested before aortic stenosis.
The underlying mechanisms driving these pathological processes occurring during pressure overload are controversially debated [1]. While plausible hypotheses exist, neither the mechanisms by which cellular components at the molecular and microstructural level respond to altered mechanical stimuli are fully understood [1], nor is the time-point known where adaptive changes turn maladaptive and irreversible. As G&R processes are governed by a number of pathways that interact in a complex manner, computational modeling has been recognized as a promising tool to quantitatively characterize the underlying mechanisms [17]. Such computational models usually combine a growth law based on a growth evolution model, mostly adopting the approaches by Skalak et al. [18] and Rodriguez et al. [19], where growth was modeled by adding volume in prescribed directions. While conceptually simple, these models suffer from several disadvantages, such as, e.g., the need of defining a priori the direction in which growth will take place or the limit at which growth will stop [20]. Therefore, microstructurally motivated models in a framework such as constrained mixture theory (see section 2.2) could provide deeper insight into the actual events leading to physiological and pathological G&R. To our knowledge, G&R of the heart has not been modelled this way yet.
This review paper aims to give an overview of the recent developments in the dynamic field of G&R with a specific focus on methodological aspects of modeling G&R. In the first part different concepts of modeling G&R are reviewed. Several excellent reviews have already covered the simulation of G&R [21, 22, 23, 24, 25, 26, 27]. However, to our knowledge a detailed summary of different modeling assumptions is lacking, such as geometry, constitutive equations, the driving factors of growth, and the growth laws employed. Witzenburg and Holmes [27] are the only ones to have systematically summarized, compared and evaluated eight studies in the kinematic growth theory in a simple finite element setting. To fill this gap we provide and discuss extensive summary tables for the two most widely used G&R frameworks, kinematic growth theory, see section 2.1, and constrained mixture theory, see section 2.2.
The second part of the review provides a comprehensive overview of all microstructural components of the heart which might be important to be understood and considered from a engineering point of view. Only then, a detailed description of the changes in microstructure in pressure overloaded hearts is given which aims to provide a common ground based on which the pathogenesis might be modeled. An extensive table summarizes quantitative findings on changes in microstructure from studies of the last years which utilized biopsies from surgeries at different time points before, during, or after AVR. As detailed quantitative data are essential for sound model development and validation, we believe that this review might serve as a motivation and a great help to extend the already growing field of phenomenological G&R models to the use of constrained mixture theory. This might enhance the understanding of multiscale mechanisms responsible for the progression towards heart failure or for full recovery post-treatment which may translate eventually into clinically applicable modeling tools for stratifying the disease state and predicting its progression and the potential for reverse remodeling. As there has been a considerable debate about which growth stimuli are being sensed by cells, a final subchapter is devoted to mechanosensing and mechanotransduction in cells.
2 Computational Treatment of Growth and Remodeling
Several models to study G&R computationally have been developed in the past, such as a recently proposed framework of ”relaxed growth” by [28], simple lumped parameter models to study growth stimuli [29] or the theory of porous media [30]. However, we first concentrate on the two most widely used approaches, namely kinematic growth theory and constrained mixture models and give a summary of structural adaptation theory and fully structural theory, as the latter proposes a solution to the problem of the assumption of bijectivity, see chapter 2.4. We then give a short summary on hybrid approaches and conclude with a summary of strain-energy functions used in the literature.
2.1 Kinematic Growth Theory
Based on the concept of plasticity [31] the construct of volumetric growth in a continuum formulation was first proposed by Rodriguez et al. [19]. Growth is modeled there as a change in shape and size of an unloaded body by means of the inelastic growth deformation gradient . Stress-free changes of volume elements are described due to added or lost mass, leading by itself to a not compatible, intermediate configuration, see Figure 1. In a second step, geometrical compatibility is achieved by the elastic deformation gradient , which assembles the volume elements into an unloaded body, leading to the development of residual stresses. Overall, the total deformation gradient results in
| (1) |
This approach leads to two separate constitutive relations: an evolution equation for the growth tensor and a strain-energy density function, dependent only on the elastic deformation as at any time . While this approach is conceptually simple, the definition of the growth law remains a major challenge.
The concept of kinematic growth has been utilized for the computation of patient-specific geometries of the aorta in several studies [32, 33, 34, 35, 36, 37]. The first to use this concept to model G&R in the heart were Kroon et al. [38], using a simple truncated ellipsoid geometry and a transversely isotropic material model. They investigated the impact of two different reference configurations: a single one which remains fixed throughout the entire growth process, and one which is updated after each growth increment. They concluded that the choice of the reference configuration is of great importance as it has a significant impact on the growth stimulus. The biomechanical driving factors of growth are still unknown. However, the current prevailing hypothesis states that stress is the driving factor for concentric cardiac hypertrophy due to pressure overload, and strain drives eccentric cardiac hypertrophy due to volume overload. Both stimuli were incorporated in the works by Göktepe et al. [39, 40] that described both eccentric and concentric growth. They hypothesized that eccentric growth is due to serial sarcomere deposition, whereas parallel sarcomere deposition leads to concentric growth. ECM remodeling was neglected in these studies, and a phenomenological critical myofiber stretch was used, from which an excess would trigger eccentric remodeling. Only passive material parameters were used and simulations started from an unloaded state. Several studies followed the approach, such as, e.g., Lee et al. [41] where reverse growth occurred when myofiber stretch fell below a prescribed homeostatic value. An isotropic growth tensor was used to study the influence of the chosen growth multiplier. The growth multiplier was modeled in such a way that reverse growth was possible when the stretch fell below the threshold of a critical fiber stretch which initiated growth in the first place. The model was integrated into an electromechanical model of the heart [42] to model active states of the myocardium as well in a subsequent study [43]. In 2011, Rausch et al. [44] investigated the mechanisms by which the heart remodels due to pressure-induced sarcomerogenesis. The contribution of active stresses was introduced by modifying equations due to Guccione et al. [45]. Klepach et al. [46] examined the influence of myocardial infarction on the shape of the heart, inducing heterogeneity by different (passive) material parameters for infarct and healthy regions. Kerckhoffs et al. [47] gave a detailed explanation on their choice of biomechanical stimuli, resulting in a more complicated growth law, where the relation between the orthotropic components of the growth tensor and the stimuli was incremental and described by sigmoidal functions. It was assumed that all adaptation mechanisms were present under all conditions, i.e., while sarcomeres are mostly added in parallel in pressure overload and in series in volume overload, both adaptation mechanisms should be present independent of the driving conditions, but to different extents. The homeostatic value for fiber and cross-fiber strain was set to . Genet et al. [48] applied kinematic growth to a four-chamber human heart model, examining the question whether computational modeling can provide patient-specific information about the progression of heart failure. Recently, Witzenburg and Holmes [49] coupled the growth law proposed by Kerckhoffs et al. [47] to a time-varying elastance compartmental model, which was connected to a lumped model of the circulation. In their extensive study, multiple experimental results were reproduced by simulation of volumetric and pressure overload, and the ability of the model to predict growth in three studies of pressure and volume overload as well as post-infarction remodeling was examined. Despite using a phenomenological growth law, they were able to predict results from independent studies of all loading conditions and claimed that their model was able to automatically customize model parameters and to calculate 3 months of G&R in 6 minutes simulation time. In 2018, Del Bianco et al. [50] investigated how hypertrophy affects the heart’s electrophysiology. They assumed that growth depends on multiple stimuli throughout the cardiac cycle as opposed to just one stimulus from one specific point in the cycle. Hence they modelled growth to occur at the end of each cycle. The most recent study was performed by Peirlinck et al. [51], utilizing machine learning and information from multiple scales obtained from a porcine model of volume overload.
An overview on studies utilizing the kinematic growth approach to model G&R in the heart is given in Table 1, where the used growth stimuli, growth laws, and geometries are summarized.
Further work, which is not included in Table 1, has been done by Taber et al. [52, 53] who used the framework of kinematic growth theory to describe the growth of a developing heart. Similar to Kroon et al. [38] and Kerckhoffs [54] they utilized the excess of the stress tensor from its target value as the growth stimulus. As the incompatibility of the growth tensor induces naturally residual stresses and strains, the framework has been also used to model residual stresses by Skalak et al. [18] in general and more recently for the heart by Genet et al. [28].
As each of the discussed studies not only utilizes different growth laws, but also different geometries, (passive) constitutive equations and loading conditions, Witzenburg and Holmes [27] systematically compared eight kinematic growth laws. They conducted a literature review of different surgical procedures and summarized a range of change of stretches induced by them. These data were then used as an input for comparison of the different growth laws and compared to the amount actual growth reported from experimental studies. They concluded that only laws using multiple inputs which were weakly correlated with one another in experimental studies were able to capture features of both pressure- and volume-overload. However, none of the tested models were able to return to homeostasis in prescribed-force simulations, but some were in prescribed-stretch simulations. Witzenburg and Holmes [27] summarized a range of data they gathered for their study and found that in pressure overload, end-systolic fiber stretch was increased and volume overload it was decreased, whereas end-diastolic stretch (often used as an input in kinematic growth laws) increased in both overload scenarios. Hence they concluded that it should be possible to capture pressure and volume overload with a single input connected to end-systolic fiber stretch.
Kinematic growth theory is a conceptually simple and computationally convenient method, which is, however, limited mechanobiologically [25]. Initially, the theory was designed to model growth of stress-free configurations. Yet, living tissues such as the heart are pre-stressed and consist of multiple constituents whose removal, deposition, and adaptation governs the stress state inside the body. Especially during pathogenesis the disturbed deposition and removal of constituents such as collagen has a significant impact on the mechanics [55, 56], which cannot be captured by a single phenomenological evolution law of . Additionally, the spatial density is often assumed to remain constant during both elastic deformation and G&R. In summary, kinematic growth theory is able to capture the consequences of growth, but not the processes which lead to it.
2.2 Constrained Mixture Theory
A fundamentally different approach are constrained mixture models, first proposed in the context of biomechanics by Humphrey and Rajagopal [57], which are based on the theory by Truesdell and Noll [58] of interdiffusing, non-reactive materials. Here, G&R is attributed to the deposition and degradation of individual constituents within a tissue. The main hypothesis is that cells can synthesize new components of a constituent which are deposited in preferred directions at time with a certain pre-stretch . This stretch can be interpreted as the homeostatic stretch imposed on a fiber that is incorporated within the ECM. At the same time mechanisms such as cell apoptosis or matrix degeneration can lead to the degradation of components. Let and denote the deformation gradients that account for motion of the whole continuum from the reference configuration at time to configurations at times and , respectively. Then, the product represents the deformation of the whole continuum from time to the current time . Then the individual deformation gradient for a constituent that describes the deformation from its natural, stress-free state at time of production , emphasized by the superscript , to the current time results in
| (2) |
Further, the individual right Cauchy–Green tensor of each cohort of each constituent is defined as
| (3) |
Constrained mixture models assume that all constituents, regardless of their time of deposition or their individual pre-stretch, deform together when subjected to an external load.
The existence of multiple constituents, deposited at different times and under different pre-stretches, gives rise to residual stresses, without incompatible growth strains as assumed in kinematic growth theory [23].
The concept of constrained mixture theory basically leads to three types of constitutive relations which have to be defined:
-
1.
the stored energy function for a constituent , depending on the deformation experienced at the current time , relative to its natural configuration at the G&R time of its production ;
-
2.
the rate of production of mass per unit volume ; and
-
3.
the associated survival function , describing the half-life of each constituent, i.e., the percentage of constituent , deposited at time , and surviving to the current time [23].
The total stored energy density function , where is the number of constituents, is usually calculated using a mass average rule, such as, e.g., in [59]:
| (4) |
where is the mass density of constituent at time and equals the total mass density. The production rate is the difference between production and degradation of constituent and often assumed to be stress-dependent. Additionally, survival functions are often chosen to take an exponential form.
Applications of constrained mixture models to cardiac modeling problems, to the best of our knowledge, have not been reported yet. The bulk of the modeling work in the literature focused on vascular applications. The state-of-the-art in vascular constrained mixture modeling has been summarized in reviews by Ateshian and Humphrey [23], who showed examples of the diverse applications of mixture theory in biological growth and remodeling and discussing open problems. At the same time, Valentín and Holzapfel [60] reviewed ten years of constrained mixture models, summarized the core hypotheses in these studies and briefly recapitulated the core mathematical concepts used, mostly focusing on arterial G&R. The majority of publications in this field utilized 2-D membrane models in which volume growth was incorporated through a change in membrane thickness, e.g., [61, 62, 63, 64, 65], often assuming a mean intramural stress. The formulation was extended to 3-D by, e.g., Karšaj et al. [66], who used a semi-analytical solution of the extension and distension of a straight cylindrical segment of an artery.
Constrained mixture models were used within the finite element framework by, e.g., Machyshyn et al. [67], who simulated isotropic growth in an externally unloaded state and assumed stretch as a growth stimulus. The growth-induced stress was assumed to disappear due to tissue remodeling. Further studies assuming isotopic growth kinematics were conducted in the following years [59, 68, 69], however, unrealistic model predictions were reported by Valentín et al. [59], leading to models employing anisotropic model kinematics, e.g., Wan et al. [70] for orthotropy. Anisotropic model kinematics can be uniquely defined by eigenvectors and eigenvalues of the deformation due to growth, as earlier studies showed for transversely isotropic growth kinematics, e.g., Baek et al. [71].
Table 2 summarizes constitutive equations and assumptions used by exemplary studies published after the reviews of [23] and [60], utilizing the classical constrained mixture theory or a hybrid approach, discussed in the following chapter. In 2013, Valentín et al. [59] simulated the growth of an aneurysm within a 3D framework by an exponential decay of the original shear modulus of elastin. They analyzed the numerical stability of their implementation and concluded that for their case of an axisymmetric problem, at least 10 half-lives of collagen had to be tracked in order to ensure numerical stability. Wu and Shadden [72] modeled aneurysm development in a membrane model of a patient-specific infrarenal aorta, coupling G&R with blood flow simulations. In the same year, Virag et al. [73] extended the model of aneurysm development by Karšaj et al. [66] by incorporating the evolution of multiple layers of an intraluminal thrombus. More recently, Famaey et al. [74] studied the influence of the Ross procedure on arterial wall mechanics, where the pulmonary artery is exposed to a seven fold increase in blood pressure. They studied four virtual tests using one single element with boundary conditions assigned using Laplace’s law. Finally, in 2019, Horvat et al. [75] studied the influence of the volumetric-isochoric split of the strain-energy function on G&R in a 3D finite element implementation of a three-layered aorta.
Latorre and Humphrey [76] proposed a mechanobiologically equilibrated, steady-state formulation, valid for states in which the tissue has completed G&R due to long term external stimuli. In the case of a thin-walled artery the steady-state formulation yielded the exact same solution as a full constrained mixture model.
Other applications of the constrained mixture theory are, e.g., the definition of constitutive laws based on constituent-specific pre-stretches, leading to residual stresses as introduced by Mousavi and Avril [77]. This can be used to understand the influence of sample preparation before uniaxial or biaxial tensile testing on the microstructure and hence on the mechanical behavior.
2.3 Structural Adaptation Theory
As mentioned in chapter 2.1 kinametic growth theory is able to model the consequences of growth, but not the processes during growth. A group of models to include structural reorientation was first described by Arts et al. [78], where the left ventricle was modeled by a set of concentric cylinders. The model yielded a transmural variation of myofiber orientation similar to experimental observations. The orientation as well as the wall thickness were adapted by optimization of the local deviation of the fiber shortening during systole and the sarcomere length at the beginning of the ejection from a set value. It was assumed that remodeling occurs due to continuous creation and breaking down of connections between fibers and their environments. The model predicted a homogeneous fiber stress and strain distribution during the ejection phase. This finding was then translated into the ’one fiber model’ which approximated fiber stress and strain by single values throughout the whole wall [79]. The model approximated LV cavity volume and LV pressure by relating them to myofiber stress and stretch through a simple law. The model by Arts et al. [78] was extended with rules for adaptation to account for cardiac growth by Arts et al. [80].
In 2005, Arts et al. [81] proposed an adaptation model named ”CircAdapt”. Here, two one fiber models for left and right ventricular function together with a lumped parameter model of the circulation were utilized to simulate patient hemodynamics. Cavity volume was increased in case sarcomere shortening during the ejection exceeded a predefined amount of shortening and wall volume increased when sarcomere length exceeded a predefined length at end diastole. The model was able to predict adaptive changes of the heart three months before until three months after birth.
Lumens et al. [82] extended this framework to model the interaction between left and right ventricle more realistically, allowing a separate description of mechanics and adaptation of free walls and septum of the ventricles.
Kroon et al. [83] modeled the adaptive reorientation of cardiac myofibers within the framework proposed by Arts and colleagues, prescribing evolution equations for the structural tensors characterizing anisotropic constitutive parameters. The remodeling law stated that myofibers adapt their direction in order to minimize the shear strain between the fiber and cross-fiber directions.
In a subsequent study, Pluijmert et al. [84] examined the influence of initial and boundary conditions on the shear induced reorientation of fibers. They concluded that physiological boundary conditions are crucial, however, as the available experimental data shows a large disparity, adequate boundary conditions are yet to be defined.
Consequently, Pluijmert et al. [85] utilized the previously established model to examine the influence of myofiber orientation in a biventricular finite element model on the simulated cardiac function. They used their model to alter the fiber direction by letting the myofibers remodel and with that to define the myofiber orientations in finite element models.
For an excellent review and more detailed discussion on this class of models the reader is referred to [86]. Structural adaptation models are a useful tool to study vascular adaptation with computationally cheap models. However, if the spatial distribution of myocardial growth is of interest, one has to utilize the above mentioned continuum mechanical formulations and couple models such as the one proposed by Pluijmert et al. [85] to growth laws.
2.4 Fully Structural Approach
One of the major drawbacks of the above mentioned theories which utilize the multiplicative decomposition of the deformation gradient into an elastic and a growth part is the assumption that the motion is bijective. However, Cowin [87] pointed out that finite volumetric growth including mass change is not bijective, i.e., a material point can disappear by degradation or grow and become multiple points. Thus, there is no one-to-one mapping in tissue growth which includes mass change. In fact, due to this non-bijectivity, the definition of kinematics of finite volumetric growth with mass change is yet an unresolved problem in continuum mechanics.
The only approach aiming to overcome this issue was recently proposed by Lanir [88, 89]. Here, in the earlier study a one dimensional G&R theory was proposed and extended to three dimensions afterwards.
The multi-scale approach is linking turnover events occurring at the constituents’ level with the evolving tissue structure. The structural approach models growth as the adaptation of fiber bundles by change of the number of fibers in each bundle. As the bundles themselves cannot disappear and no new bundles are formed the deformation of a bundle is affine with the global tissue — with this assumption bijectivity of the model is guaranteed. [89]
While this approach seems promising, it is yet restricted to purely collagenous tissues such as tendons and ligaments and has yet to be developed further to be able to be used for complicated multi component tissues such as the heart.
2.5 Hybrid Approaches
2.5.1 Volumetric Constrained Mixture Models, Evolving Recruitment Stretch
Alford et al. [90] were the first to model thick-walled aortic geometries within the framework of constrained mixture theory, combining it with kinematic growth theory to test the influence of several factors, such as elastin distribution, axial pre-stretch, and the effect of wall constituents on the resulting opening angles. Wan et al. [70] also utilized an analytical model to model a thick-walled aorta, calculating local homeostatic pre-stretches with pre-determined distribution functions. A series of studies was published by Watton and co-workers [91, 92, 93, 94, 69, 95], utilizing the constrained mixture theory to model aneurysm enlargement. Instead of tracking different reference configurations of mass increments deposited at different times, they focused on the change in the stress-free configuration by tracking the evolution of a recruitment stretch in an intermediate configuration. In 2017, Grytsan et al. [96] extended this framework to study different cases of volume growth assumptions. They found that assuming isotropic or in-plane growth yielded unphysiological results and should be used with caution in the case of aneurysm growth. Recently, Lin et al. [97, 98] simulated the dilatation of a thick-walled aneurysm. They assumed that the dilatation is due to a local degradation of elastin, accompanied by a stretch-mediated degradation of collagen and an increased production of new collagen, which is deposited dependent on a recruitment variable defining an intermediate configuration where collagen fibers start to bear load. Despite yielding promising results, they encountered a prominent thinning of the vessel wall, which is not physiological.
Finally, it is worth noting that Schmid et al. [68] implemented a 3D finite element model of a hybrid approach based in part on the constrained mixture theory, but instead of being integral based, their approach was rate based.
2.5.2 Homogenized Constrained Mixture Theory
A new model has been introduced by Cyron et al. to avoid keeping track of all past tissue configurations while still being able to account for micro-structural influences. The main difference between constrained mixture and the proposed theory is how mass production and volumetric growth are computed. An inelastic G&R deformation is treated as the product of exchange-related remodeling and growth related deformation for each constituent resulting in the total deformation , [99]. Here, the specific growth law has to be assigned similar to kinematic growth theory. A comparison to established constrained mixture theory based simulations showed marginal differences in the outcome.
Recently, Braeu et al. [100] used the concept of tensional homeostasis (i.e. the assumption that cells remodel in a way to maintain a preferred state of stress) as a driving factor for anisotropic growth. This enabled them to refrain from using a phenomenological growth tensor. Their study was based on two hypotheses stating 1. that tensional homeostasis is the only driving factor for growth and 2. that the mass density is constant during growth.
2.6 Strain-Energy Functions
Dokos et al. [101] performed simple shear experiments on dog hearts that revealed, for the first time, hyperelastic anisotropic behavior of the myocardium. This behaviour has been ever since represented based on Fung-type exponential functions. Different approaches have been chosen, such as modeling the heart as a transversely anisotropic [102] or orthotropic material [103].
Similar shear experiments have been repeated on human myocardium by Sommer et al. which revealed pronounced viscous properties in addition to the previously reported orthotropic behavior [104]. However, there are no data available representing the whole heart and hence hyperelastic models still remain standard.
In 1994 Nevo and Lanir [105] modeled the passive stress response utilizing exponential functions coupled to a undulation density distribution which summed the contribution of individual collagen fibers. They stated however that the quantification of the collagen volume fraction is difficult in the heart.
Later, Holzapfel and Ogden [106] proposed a microstructurally motivated orthotropic model based on Fung-type exponential functions which was later augmented by incorporating fiber dispersion [107]. Following more recent experimental findings on the viscoelastic behavior, orthotropic viscoelastic material models have been proposed in [108, 109]. Wang et al. [110] have modified the model by Holzapfel and Ogden [106] to model tissue remodeling taking place in hypertensive heart failure in rats utilizing image-derived structural parameters representing the growth of perimysial and endomysial collagen.
Using these equations to describe cardiac remodeling remains a challenge due to their phenomenological nature and parameterization, especially in-vivo. Additionally, the microstructure of the heart is not as easily characterized as for other soft tissues such as blood vessels or skin and there is still a profound lack of available data [111].
In 2017, Avazmohammadi et al. [112] used microstructural parameters quantified from histological studies to characterize the passive response of the right ventricle with a constitutive equation on the fiber level, separating mechanical contributions of myofibers and collagen and modeling the connection between these. Aspects of tissue adaptation have been modeled by, e.g., [113, 114], prescribing evolving constitutive equations on the fiber level. Others utilized the adaptation of material parameters to model changes in the microstructure [115] or added new parameters to introduce maximum energy accumulated before failure [116]. Although these models provided some insight into the changes taking place during the pathogenesis of various diseases by changing the constitutive behavior, none of them is able to capture volume changes due to changes in mass. Neither did any of the studies account for changes such as myocyte hypertrophy. A summary table on constitutive equations for the passive myocardium is given in the excellent review by Wang et al. [26].
3 Biological Processes of Growth and Remodeling During Pressure Overload
Over the past years extensive research has been dedicated to studying micro-structural remodeling under pressure overload conditions. Experimental studies relied mostly on animal models where pressure overload was induced by aortic banding using aortic cuffs (e.g. [117, 118, 119, 120, 121, 122][117, 118, 119, 120, 121, 122] for large animals) or, genetically modified mouse or rat models were employed that develop diastolic heart failure and subsequently, if left untreated, systolic heart failure, which resembles the disease progression seen under pressure overload. (e.g. [123, 124]).
The procedure of aortic banding, however, is afflicted with uncertainties. For instance, it has been shown that even minor differences in cuff placement may result in significantly different end-systolic pressure (e.g. in [125] and in [126] in the same animal model).
As it is not possible to study the onset of the disease in patients, animal studies remain a valuable source of information, but caution is warranted when extrapolating to human conditions, not only because of inter-species differences but also because of differences in experimental procedures.
Due to the limited space in this review this section therefore focusses on quantitative data gained in clinical studies over the past three decades. These data can can serve as quantitative input to the formulation of constitutive G&R laws. Further, an overview on the microstructural composition of the LV myocardium in health and disease is given. The sections concludes with a summary of the pathogenesis and an overview over how cells such as fibroblasts or myocytes can sense and react to mechanical stimuli in their environment.
3.1 Heart Constituents under Physiological Conditions
3.1.1 Myocytes
Although only about one third of all cells making up the myocardium are cardiomyocytes, they account for of its volume [127]. Cardiomyocytes are striated muscle cells with a diameter of around and a length of [127]. While myocytes are single nucleated, from a functional point of view they can be viewed as a “syncytium” as they form tight connection to neighboring cells via specialized cell membranes referred to as intercalated disks. Gap junctions within these regions provide low resistance pathways for current flow between adjacent cells [128]. Each myocyte is connected longitudinally to at least two and laterally to at least one neighbouring cell [129, 130]. The cell membrane forms invaginations, called transverse tubuli, that penetrate into the interior of myocytes to facilitate the rapid transmission of the action potential into the cell and to synchronize calcium release throughout the cell to enhance contractile forces [127].
Myocytes require a large number of mitochondria to generate the metabolic energy needed for contraction and relaxation. Sarcomeres are the fundamental contractile units of a myocyte that are bounded by the Z-line. A sarcomere consist of thick myosin filaments (forming the dark A-Bands) which slide along thin actin filaments (forming the light I-bands). The actin filaments are anchored to the Z-line and project about toward the center of the sarcomere. The thick filaments are about in length and are centered around the M-line where thick filaments are connected with each other by radial crosslinks. The maximum force that can be generated by a sarcomere at any sarcomere length is governed by the degree of overlap between thin and thick filaments. Optimal overlap is assumed at a sarcomere length of . Thus stretching beyond the optimal length reduces maximum force down to zero at a length of where no overlap is possible anymore. At shorter sarcomere lengths during contraction maximum force also reduces as a crossover between thin filaments occurs, which impedes effective formation of crossbridges. Under normal conditions sarcomeres operate along the ascending limb of the length-tension relation in the range , which is one mechanism contributing to the Frank-Starling effect [131], that is, the increase in force with preload. The contractile proteins are surrounded by a sarcoplasmic reticulum network, which is the primary calcium ion reservoir Kaplan [127]. Figure 3, (b) shows a detailed schematic of the myocyte’s ultrastructure.
In contrast to other cell types in the human body, the turnover of adult myocytes is very slow, at a rate of approximately per year [132], and myocytes do not multiply by cell division. At birth, there are around billion myocytes available in a healthy human heart and this number does not change significantly in a lifetime [133]. Compared to other constituents, this occurs at a rate slow enough to assume that there is essentially no turnover in the cells themselves [134]. However, myocytes can grow in size due to sarcomerogenesis, where new sarcomere units are created and deposited [134]. In the healthy myocardium, around sarcomeres make up one myofbril, and parallel myofibrils result in a myocyte.
Myocytes are sensible to their environment. Mechanical stimuli are transmitted between the cytoskeleton and the ECM via transmembrane integrin proteins. Bray et al. [135] showed that a modification in the ECM surrounding myocytes results in a dynamic reconfiguration of the shape and intracellular architecture. They cultured myocytes constrained to different shapes and concluded, that the myofibrillar arrangement in square myocytes (corresponding more to myocytes from hearts undergoing concentric hypertrophy) was almost isotropic, whereas for myocytes with a width-to-length ratio of (corresponding to a more healthy myocyte ratio of ) the myofibrils were arranged along the long axis, as shown in Figure 8. Figure 8 shows that for myocytes with a higher length-to-width ratio the focal adhesions (seen in panels ii) were larger in size compared to square samples. Focal adhesions are structures which conduct mechanical and biochemical stimuli from the ECM to the cell and through which a cell connects to the surrounding ECM.
Individual myocytes are surrounded and interconnected by endomysial collagen. These are further connected by perimysial collagen, forming sheets, which are connected via wavy perimysial collagen fibers. This is described in detail in section 3.1.2.
In the healthy myocardium, myocytes are arranged along a defined orientation, see Figure 3. At the LV epicardium the prevailing orientation of myocytes, referred to as ‘fiber orientation’, is around relative to the circumferential equatorial direction and at the endocardium around [136]. Karlon et al. [137] have fitted a distribution function to measure myocyte and eart and observed a relatively small dispersion in myocyte orientation of , which got exacerbated with disease progression.
3.1.2 Collagen
The ECM provides a scaffold defining the geometry and muscular architecture of the heart and is hence responsible for its passive mechanical properties. A detailed knowledge of the structure in health and disease is hence necessary to establish meaningful computational models of G&R.
Collagen, which is a significant part of the ECM, is the main load-bearing structure in the myocardium, although the collagen content in the heart is relatively low with around . Despite the small fraction its remodeling has significant effects of the mechanical behavior throughout the whole cardiac cycle [115].
Collagen type I and III are the fibrillar collagen types of the myocardium [138]. Type I collagen accounts for approximately of the collagen in the heart and consists of cord-like, parallel fibrils, whereas type III collagen consists of a fine network of fibrils and accounts for approximately of the total collagen mass [136]. Collagen has been reported to be degraded and replaced in the healthy heart at a rate of about per day up to per day [139] and a half life of to days [140]. Initially the classification into perimysial and endomysial used for cardiac collagen was defined for skeletal muscle and only afterwards applied to the heart [141] to describe different levels: Epimysial collagen denotes the layer of connective tissue surrounding the myocardium. Perimysial collagen, which consists mainly of collagen type I, envelops and connects groups of myocytes, forming so called sheets [142, 143, 136]. Its fibers are often coiled and capable of storing energy, which can be released during contraction or relaxation at volumes larger or smaller than the unpressurized volume, respectively. In a normal LV the end-systolic volume is below the unpressurized volume, thus release of stored energy promotes re-lengthening of myocytes during early diastolic filling [144], which is referred to as elastic recoil. Endomysial collagen, mainly being formed by collagen type III, connects and surrounds individual myocytes and capillaries. In systole, most of the wall stress is born by myocytes, while endomysial collagen transmits force and keeps myocytes aligned. During diastolic filling, perimysial collagen uncoils and straightens, eventually resisting further extension, which accounts for the steep part of the end-diastolic-pressure-volume-relation, thus protecting myocytes from becoming overstretched [145]. Perimysial collagen may play a key role in cardiac performance, as it interconnects all contractile elements in the myocardium [146].
Macchiarelli et al. [139] examined the microstructure of healthy endomysial collagen of rabbit hearts using a method which allowed the isolation of collagen by removing other ECM components as well as cells. They were able to show that individual myocytes are connected by laminae, which envelop the whole surface of vessels and myocytes, see Figure 4, (a) and (b). They hypothesized that this structure might provide a protection against overstretch of individual myocytes.
Perimysial collagen can be further subdivided into three groups: (1) a web-like structure surrounding muscle layers, (2) long cords which are aligned with the fiber axis, and (3) cords connecting sheets to each other and hence crossing cleavage planes in a perpendicular manner relative to the long axis of myocytes [136]. Robinson et al. [147] examined hearts of rats and hamsters and reported the lateral insertion of perimysial collagen struts into the Z band of myocytes, see Figure 4, (c) and (d). This organization exhibiting tight coupling inside sheets but loose coupling between these provides the potential of significant deformation between the sheets. In the healthy heart, the turnover rate of collagen has been reported to lie around per day [140] to per day [139] is , which is low in comparison to non-collageneous protein turnover ( per day) [140].
3.1.3 Fibroblasts
Fibroblasts are the predominating cells in the myocardium in terms of numbers, making up, together with the other interstitial cells (macrophages, endothelial cells, smooth muscle cells), over of all myocardial cells. They synthesize and regulate the degradation of the ECM and hence maintain the structural integrity of the myocardium [146].
Fibroblasts originate from two sources. Firstly they differentiate from epicardial-derived-cells directly in the heart which originate from events taking place during embryonic development. These cells can alternate between fibroblasts and a -smooth muscle actin expressing myofibroblast phenotype. Eventually most epicardial-derived-cells assume the fibroblast phenotype. However, during certain pathologies fibroblasts can differentiate into myofibroblasts and have a significant influence on the mechanics of the remodeling myocardium, see section 3.2. Additionally, fibroblasts have been recently reported to originate from progenitor stem cells from the circulation [148].
In vitro it has been shown that the arrangement of fibroblasts is highly hierarchical, being arranged in sheets and strands running parallel to muscle fibers and hence being able to maintain the structural integrity within the myocardium. In vivo this arrangement is less clear and has been controverially discussed [149]. Fibroblasts do not only couple electrically between themselves, but also hetero-cellular coupling between fibroblasts and myocytes has been observed [148]. While this is well established in vitro, to which extent this is the case in vivo and whether the coupling is functional and relevant is less clear [150, 149]. In addition to their role in maintaining the integrity of the ECM, fibroblasts ‘communicate’ with myocytes through mechano-electric and electrophysiological signals and are hence able to remodel the myocardium responding to altered states of mechanical loading [151]. Fibrosis has been viewed as an insulator to electrical conductivity until recently. However, recent studies suggest that fibroblasts, although electrically unexcitable, are able to contribute to the electrophysiology of the myocardium. In cell cultures, fibroblasts have been reported to contribute to synchronizing the contraction between individual myocytes [152]. More recently, Kamkin et al. [153] have shown that fibroblasts can alter electrophysiological properties of myocytes in coculture. The transfer of electrical signals occurs through gap-junctions which have been shown to form between myocytes and fibroblasts in co-culture in vitro [154].
Fibroblasts can sense mechanical stimuli through their cytoskeleton, integrins and stretch-activated channels [155] (see Figure 6, (a) for an electron micrograph of the complex cytoskeletal network) and respond to it via changes in their resting potential. The ability to respond to a variety of mechanical, electrical and chemical stimuli is pivotal to maintain normal cardiac function and a unique property compared to fibroblasts from other tissues. Fibroblasts do this by expressing proteolytic enzymes such as matrix metalloproteinases (MMPs) and growth factors, synthesizing collagen, differentiation into the myofibroblast phenotype (see section 3.2), proliferation and migration, see Figure 6, (b). In organs such as the skin, fibroblasts are protected against severe mechanical stimulation, which is one of the main differences to cardiac fibroblasts, which are subjected to cyclic mechanical loads and are able to sense changes to the physiological cyclic loading. [148]
3.1.4 Elastin and Proteoglycans
In a recent review by Fomovsky et al. [145] the authors were surprised to find that despite hints that elastin and proteoglycans may play important roles in the mechanical behavior of the heart, their contribution has received little attention. Additionally, the contribution of all these components is much better understood in other soft tissues such as arteries than in the myocardium.
As the heart muscle exhibits a limited elasticity and as there is less elastin present in the myocardium than in the vasculature the role of myocardial elastin it not yet understood. There have been even less studies on myocardial proteoglycans, although they may play important roles in the lubrication of the myocardial space for contraction and sequestering bioactive proteins such as growth factors for cellular signaling [145].
No data are to be found on the change of these constituents during pressure overload, although they are known to play significant roles in other diseases of the vasculature. This may be an interesting starting point for future research.
3.2 Changes in the Myocardial Structure during Pressure Overload
Altered circumstances such as pressure overload caused by aortic stenosis were reported to trigger significant and complicated remodeling processes in the heart. In the 1980s a series of studies and reviews by Weber et al. (e.g. [156, 138]) shed some light on the underlying mechanisms. After experimental induction of pressure overload, the synthesis of non-collageneous proteins increased by , and returned to control levels after two weeks while pressure overload was experimentally maintained. Myosin synthesis was found to be increased right on the onset of pressure overload, which leads to myocyte hypertrophy. The response of collagen synthesis was much slower but persisted for a longer period of time. A six- to eight-fold increase to per day was observed and remained increased threefold at examination at two and four weeks. As fibroblast proliferation was only seen at a later stage, Weber [140] concluded that collagen synthesis is first carried out by existing fibroblasts, and fibroblast proliferation only follows thereafter. This finding was later reproduced, e.g., in 2002 by Akdemir [157]. At the onset of pressure overload, more collagen type III was found to be deposited, which expresses in thinner fibers [157]. Interestingly, only ventricles directly affected by pressure overload showed an increase in collagen content — this finding excluded the possibility that collagen synthesis was triggered by circulating growth factors, which would trigger collagen growth in the whole heart [157]. During the onset of pressure overload, collagen degradation was observed to increase, but returned to base levels soon after [158]. As myosin synthesis was reported to occur more rapidly at the onset of pressure overload, myocyte hypertrophy and a decline in collagen content can be seen at the early stage of pressure overload [158]. The increase in myocyte diameter is accompanied by little or no change in myocyte length [159]. The lateral expansion of pre-existing myocytes is considered to be the only cellular process to increase the wall width to normalize peak systolic wall stresses [159]. Additionally, the area of the transverse tubuli in myocytes was shown to be elevated [160]. Myocyte growth was reported to stabilize soon [140]. However, collagen synthesis persisted and exceeded its degradation, increasing collagen content significantly above baseline values after four weeks or more [140].
These processes are the beginning of a continuous structural remodeling, resulting in an increased dimension of collagen fibers seen at later stages of hypertrophy, expanded intermuscular spaces being filled with perimysial collagen and an increase in the fibrous mesh-work surrounding myocytes [157]. Additionally, collagen accumulates around small intra-myocardial coronary arteries [157]. Fibrosis without cell necrosis was termed reactive fibrosis and is dominant in earlier stages of hypertrophy due to pressure overload [161]. In the beginning, this adaptive process enhances systolic stiffness but also increases diastolic stiffness. When pressure overload persists, those initially positive, adaptive changes lead to cell necrosis and reparative fibrosis. When cell death occurs and mechanical overload persists, fibroblasts can phenotypically transform into myofibroblasts and express -smooth muscle actin myofilaments [151]. In the beginning, fibroblasts do not yet contain stress fibers [151]. They form from cytoplasmic actins and myosins responding to a mechanical stimulus and produce a “proto-myofibroblast” [151]. These stress fibers end in transmembrane integrin-containing adhesion complexes which are attached to the surrounding ECM and can transmit and also sense mechanical loads [151]. When the elevated mechanical load persists, proto-myofibroblasts fully develop into myofibroblasts with -smooth muscle actin being incorporated into the stress fibers [151]. At this stage myofibroblasts can generate force [151], anchoring to the ECM and contracting, thereby closing spaces vacant after myocyte death [162]. In combination with inflammatory cells, which have a short lived presence at the site of injury, myofibroblasts are responsible for collagen fibrillogenesis and scar genesis by increasing the secretion of ECM-degrading metalloproteinases (MMPs) and collagen turnover [151]. Additionally, Weber et al. [144] reported an adverse cell-to-cell interaction between myofibroblasts and cardiomyocytes, negatively influencing the electrical behavior of the myocardium. Lost cardiomyocytes are replaced by stiff, cross-linked collagen type I, called reparative fibrosis [144]. Additionally, fibroblasts invading from the adventitia of intramural coronary arteries and arterioles can trigger reactive fibrosis [144]. In this case, they again differentiate into myofibroblasts and ensnare cardiomyocytes with a weave of fibrous tissue, causing their atrophy [144]. As a consequence the occurrence of fibrosis is assumed to be implicated in the transition from compensated hypertrophy to systolic pump failure [144]. Eventually this manifests as diastolic failure, where EF is preserved but the capability to increase cardiac output when necessary is impaired [123]. Hypertrophy is accompanied by a significant decrease in capillary density, hence the supply with blood decreases and further promotes myocyte death [3]. At this stage, collagen type I represents more than of all collagen, bridging the gaps which originate from cell loss. The increasingly dense network of collagen fibers surrounding myocytes restricts the stretching of muscle fibers during diastole and hence reduces the length-dependent ability to generate force during systole. These changes lead to myocyte atrophy [140]. A further increase in collagen synthesis is then triggered, as myocardial injury triggers the proliferation of fibroblasts to myofibroblasts and influx of inflammatory cells, which in turn secrete matrix metalloproteinases (MMPs) [136]. This is characterized by an ongoing dilatation of the LV and a reduction in EF.
Hein et al. [3] have proposed a detailed schematic of continuous remodeling in pressure overload after carefully examining myocyte death, fibrosis percentage and other factors in three different groups of patients with aortic stenosis, categorized according to their EF. Based on these findings they proposed a schematic of continuous remodeling in pressure overload induced hypertrophy. Figure 7 shows an adapted version including some findings from this review. Table 4 summarizes the main events of the pathogenesis following pressure overload which are described in this chapter.
For a comparison of healthy myocardium and myocardium affected by pressure overload, see Figure 5. Many experimental and clinical studies have been published in the last years considering pressure overload. However, most of them do not provide any quantification of the data, making them less suitable for computational modeling. Table 3 gives an overview of quantified findings of studies which focused on biopsies from the LV free wall during AVR. As can be seen, absolute values for instance for myocyte diameter vary slightly over a rather narrow range, but others, such as volume fraction of collagen, can vary significantly between studies. For example, the study by [163] found a collagen volume fraction of in healthy myocardium (similar to several other studies), whereas for example [3] reported a value of .
Table 3 additionally includes studies, which grouped patients with aortic sclerosis according to their EF, following the hypothesis that a reduction in EF correlates with the severity of the disease. Other groups, such as, e.g., [4] or more recently [14] performed subsequent biopsies at different time points pre- and post AVR to study the ongoing remodeling, which makes these studies particularly interesting as an input for computational studies. Additionally, clinical characteristics such as heart rate (HR), EF, end diastolic and systolic pressure (EDP and ESP, respectively) and LV wall thickness were included into the table as they may proof useful for the validation of computational studies.
3.3 Mechanotransduction/Mechanosensing
Cells such as myocytes or fibroblasts are able to sense and respond to mechanical stimuli, called mechanosensing, and translate them into intracellular biochemical stimuli, called mechanotransduction. In the heart, increased mechanical stimuli lead to upregulated protein synthesis and myocyte hypertrophy. [144]
Over at least the past years there has been a debate on what type of mechanical signals cells sense. In , Humphrey [164] postulated that cells cannot respond directly to mathematical concepts such as stress, strain, or strain-energy. They rather sense local pushes and pulls due to conformational changes in the environment and respond to these. However, the mathematical concepts of, e.g., stress and strain still remain an invaluable tool to identify empirical correlations and model these. As understanding the fundamental mechanisms of cell response to mechanical stimuli is essential for formulating constitutive equations we give a summary on how cells in the myocardium sense their environment and how they response to mechanical stimuli.
Bray et al. [135] stated that the contractile architecture of a myocyte is highly sensible to changes to the environment and even to intracellular boundary conditions or the positioning of the nucleus relative to the surroundings. As the ECM provides the surroundings to individual myocytes, pathological changes as they occur during pressure overload are clearly changing the myocyte’s boundary conditions and hence contribute significantly to intracellular remodeling.
All eucaryotic cells, such as myocytes or fibroblasts, have a cytoskeleton made of actin, which readily remodels to adjust cell shape. When sarcomeres develop, focal adhesions form at cell membranes and anchor the cytoskeletal elements to the ECM. Through these focal adhesions actin filaments are able to emanate outside. In the myocyte, the connections to the surrounding ECM and hence the transmission of force form the contracting myocyte to the ECM are called costameres. In the course of sarcomere development pre-myofibrils are formed close to the membrane which look like short sarcomeres between Z-bodies. With time they grow apart and develop longer A-bands. Then sarcomeres are assembled with template proteins such as titin, nebulin, and myosin binding protein C and actin capping proteins define the thin filament length [165].
Although the process of sarcomere formation is well understood, it remains still unknown how actin filament insertion during new sarcomere addition in the adult myocyte takes place. Adding to the complexity of this problem, sarcomeres can be added in-parallel or in-series, where the processes are not fully understood yet either [165]. In 1990, Dix and Eisenberg [166] studied myofibrillogenesis in stretched muscle fibers from adult skeletal muscles. They found that sarcomeres are added at the end of fibers near myotendon junctions to accomplish lengthening. The analogous structure in myocytes is the intercalated disc, where Perriard et al. [167] found a denser architecture in myopathic hearts compared to healthy ones, suggesting a possible site where sarcomeres might be added. Other possible locations for sarcomere addition are the middle of the muscle or the laterally oriented Z-disc, which is a lateral extension of the focal adhesion. Although no study has been able yet to confirm
translated there for in-series or in-parallel addition of thin filaments.
Mechanical changes in the cell’s environment can be detected by the above mentioned focal adhesion complex. The mechanical deformation of integrins is most likely the first step in a complex intracellular signaling cascade leading to cytoskeletal rearrangements [155, 165]. For details on the cellular signaling pathways the interested reader is referred to, e.g., Russell et al. [165]. Integrins are trans-membrane proteins, linking across the cell membrane from intracellular actin filaments to specific components in the ECM. They can mediate intracellular signals in both ways — from the ECM to the cell and vice versa. Integrins can mediate cell contraction which in turn activates latent TGF- stored in the ECM. TGF- is a regulator of fibrotic processes throughout the body. The activation takes place through the transmission of intracellular force via integrins. The stiffness of the surrounding ECM has been shown to influence the ability to activate latent TGF- directly, as an increased ECM stiffness results in a higher resistance to cell forces. The release of TGF- has been shown to be higher on stiff substrates compared to compliant ones [151].
In myocytes, another mechanotransduction site is the Z-disc. Here, thin actin filaments insert and reverse the polarity. Additionally, perimysial type I collagen inserts laterally to the Z band [147]. The longest protein known, titin, interacts with multiple proteins within the Z-disc and has elastic sequences in the I-Band. These elastic structures serve as springs which store strain-energy during diastolic filling and recoil during systole. The mechanical load is sensed by this complex and activates signals through thin and intermediate filaments which anchor to the focal adhesion complex, see Figure 9 [168, 169]. Weber et al. [138] and Knöll et al. [168] hypothesized that this linkage might translate elevated mechanical stimuli directly into fibroblast proliferation and sarcomere addition. Knöll et al. [168] have been able to show that the titin/Z-disc structure plays an essential role in a whole complex triggering pathways following mechanical stimuli. Additionally to this purely mechanical trigger, mechanically induced release of peptides from neighbouring cells such as fibroblasts or endothelial cells serve as hormonal stimuli for triggering the above mentioned pathway in the Z-disc. For a detailed description of the pathways the interested reader is referred to [168].
Fibroblasts do not contain stress fibers. However, if they are subjected to a lasting mechanical stimulation they can change their phenotype to myofibroblasts (see section 3.2) which have stress fibers. There, intracellular stress-fibers terminate in the adhesion complexes, connecting myofibroblasts to their surrounding ECM and making it possible to transmit and perceive mechanical stimuli [151]. Integrins link the contractile actin-myosin cytoskeleton to the ECM [170]. In the case of fibroblasts, this linkage allows them to “pull” on the surroundings and hence probe the mechanical state of the environment by matching the extracellular resistance with intracellular force developed by actin/myosin contractility of their stress fibers. Myofibroblasts get activated after injuries such as myocardial infarction where scarring occurs or during overload, where strain stiffening occurs due to the stretched collagen fibers. In both scenarios the cells sense ECM stiffening [151].
It can be concluded that both myocytes and fibroblast exhibit mechanosensing capabilities to react to relative changes to the homeostatic ranges of mechanical stimuli they usually experience. These relative changes of mechanical stimuli act as the triggers of complex signaling cascades, influencing cytoskeletal proteins [151].
4 Discussion
This review summarizes the recent developments in computational models of cardiac G&R, providing extensive summary tables on details of the underlying modeling assumptions. The number of attempts to build comprehensive G&R models for the myocardium under pressure overload is limited, suggesting that there is a pressing need for structure based models of growth and remodeling, as many factors of the pathogenesis leading eventually to heart failure (or to complete or incomplete reverse remodeling in some cases) are not sufficiently well understood.
Microstructurally motivated computational models are able to provide a platform to “explore” with the complex contributions of multiple stimuli and, eventually, make it possible to establish models which are able to provide clinically useful information. Interdisciplinary investigations are needed to tackle this problem, as driving factors are still only suspected but not known, and a better knowledge of the complex interrelations is needed. Detailed quantitative data is essential for model development and sound validation. In our view, kinematic growth models are able to predict growth on a superficial, phenomenological level, which might be enough for some applications. However, to truly enhance the understanding of the basic pathogenesis and hence to contribute towards identifying potential targets for medication or treatments, we believe that the more detailed and microstructurally based constrained mixture models are likely to provide a more powerful framework.
To develop such models, however, more data are needed. This reviews clearly highlights a paucity of data available for characterizing pathological growth due to pressure overload beyond a single time point. Quantitative data on, e.g., myocyte apoptosis, fibroblast or myofibroblast cell density are scarce or not available at all. Also, the quantitative data available on ECM volume fractions indicated rather significant discrepancies between the studies. These are most likely due to the different experimental protocols used and also to inconsistencies in the definitions of collagen and ECM throughout the studies. However, the data are still valuable as at least trends of development can be derived from the quantitative data.
Finally, the question remains which trigger for growth computational models should use. As discussed above, stress or strain are mathematical concepts and cannot be sensed by cells. Nevertheless, they are useful metrics for the environment of continuum mechanics. Hence, it should be clear, that these concepts are mere phenomenological auxiliary constructs. To overcome this problem, Cyron and Humphrey [171] introduced the concept of mechanobiological stability, hypothesizing that aneurysm development might be viewed as a mechanobiological instability. This concept might be more promising than looking for mathematical, phenomenological triggers of growth such as stress or strain.
There are many challenges ahead to improve the current state of computational G&R models. The pathobiology of adaptation processes is highly complex, and further complicated by the presence of various comorbidities (hypertension, diabetes, renal disease, atrial fibrillation, vasculopathy, metabolic syndrome). As the active myocardial state changes due to G&R, he link between active and passive mechanics should be modelled in future models as well. While the mechanistic links between organ-scale biomechanics and biological factors at the cellular size scale remain poorly understood, undoubtedly, a change in the mechanical stimuli experienced by a cell can trigger complex changes within a cell, affecting cytoskeletal proteins and ECM integrity (section 3.3). There have been efforts to include, e.g., cell signaling [172], the role of integrins using a ”mechanical biodomain model” [173] or changes in gene expression or metabolism [174], but microstructurally motivated, rigorously validated computational models of G&R are still in their infancy.
Addressing these various challenges to develop more advanced biologically sound computational G&R models that are able to quantitatively characterize the state of remodeling and allow predictions of the further disease progression will require significant research efforts. However, with the incidence of heart failure increasing dramatically in the ageing population, the benefits of any advances in this direction appear highly rewarding.
Conflict of Interest Statement
The authors declare that the research was conducted in the absence of any commercial or financial relationships that could be construed as a potential conflict of interest.
Author Contributions
Developed the structure and arguments for the paper: JAN. Performed the literature review: JAN. Wrote the first draft of the manuscript: JAN. Contributed to the writing of the manuscript: JAN, CMA, GP. Wrote/designed the abstracts: CMA, GP. Agreed with manuscript results and conclusions: JAN, CMA, GP. Made critical revisions: CMA, GP. All authors reviewed and approved of the final manuscript.
Funding
The research was supported by the Grants F3210-N18 and I2760-B30 from the Austrian Science Fund (FWF), and a BioTechMed-Graz award (Grant No. Flagship Project: ILearnHeart) to GP. Additionally, this project has received funding from the European Union’s Horizon 2020 research and innovation programme under the Marie Skłodowska–Curie Action H2020-MSCA-IF-2016 InsiliCardio, GA No. 750835 to CMA.
References
- Opie et al. [2006] L. H. Opie, P. J. Commerford, B. J. Gersh, M. A. Pfeffer, Controversies in ventricular remodelling, Lancet 367 (2006) 356–367. doi:10.1016/S0140-6736(06)68074-4.
- Grossman et al. [1975] W. Grossman, D. Jones, L. P. McLaurin, Wall stress and patterns of hypertrophy in the human left ventricle., The Journal of clinical investigation 56 (1975) 56–64. doi:10.1172/JCI108079.
- Hein et al. [2003] S. Hein, E. Arnon, S. Kostin, M. Schönburg, A. Elsässer, V. Polyakova, E. P. Bauer, W.-P. Klövekorn, J. Schaper, Progression From Compensated Hypertrophy to Failure in the Pressure-Overloaded Human Heart, Circulation 107 (2003) 984–991. doi:10.1161/01.CIR.0000051865.66123.B7.
- Krayenbuehl et al. [1989] H. P. Krayenbuehl, O. M. Hess, E. S. Monrad, J. Schneider, G. Mall, M. Turina, Left ventricular myocardial structure in aortic valve disease before, intermediate, and late after aortic valve replacement., Circulation 79 (1989) 744–755. doi:10.1161/01.CIR.79.4.744.
- Esposito et al. [2002] G. Esposito, A. Rapacciuolo, S. V. Naga Prasad, H. Takaoka, S. A. Thomas, W. J. Koch, H. A. Rockman, Genetic alterations that inhibit in vivo pressure-overload hypertrophy prevent cardiac dysfunction despite increased wall stress, Circulation 105 (2002) 85–92.
- Heinzel et al. [2015] F. R. Heinzel, F. Hohendanner, G. Jin, S. Sedej, F. Edelmann, Myocardial hypertrophy and its role in heart failure with preserved ejection fraction, Journal of Applied Physiology 119 (2015) 1233–1242. URL: https://www.physiology.org/doi/10.1152/japplphysiol.00374.2015. doi:10.1152/japplphysiol.00374.2015.
- Lips et al. [2003] D. J. Lips, L. J. DeWindt, D. J. Van Kraaij, P. A. Doevendans, Molecular determinants of myocardial hypertrophy and failure: Alternative pathways for beneficial and maladaptive hypertrophy, 2003. URL: https://academic.oup.com/eurheartj/article-lookup/doi/10.1016/S0195-668X(02)00829-1. doi:10.1016/S0195-668X(02)00829-1.
- Kheradvar et al. [2015] A. Kheradvar, E. M. Groves, C. J. Goergen, S. H. Alavi, R. Tranquillo, C. A. Simmons, L. P. Dasi, K. J. Grande-Allen, M. R. K. Mofrad, A. Falahatpisheh, B. Griffith, F. Baaijens, S. H. Little, S. Canic, Emerging trends in heart valve engineering: Part ii. novel and standard technologies for aortic valve replacement, Annals of Biomedical Engineering 43 (2015) 844–857. doi:10.1007/s10439-014-1191-5.
- Nishimura et al. [2017] R. A. Nishimura, C. M. Otto, R. O. Bonow, B. A. Carabello, J. P. Erwin, L. A. Fleisher, H. Jneid, M. J. Mack, C. J. McLeod, P. T. O’Gara, V. H. Rigolin, T. M. Sundt, A. Thompson, 2017 aha/acc focused update of the 2014 aha/acc guideline for the management of patients with valvular heart disease: A report of the american college of cardiology/american heart association task force on clinical practice guidelines, Circulation 135 (2017) e1159–e1195. doi:10.1161/CIR.0000000000000503.
- McConkey et al. [2018] H. McConkey, Z. Zhao, S. Redwood, M. Chen, B. D. Prendergast, Timing and mode of intervention for patients with left sided valvular heart disease: an individualized approach, Precision Clinical Medicine 1 (2018) 118–128. doi:10.1093/pcmedi/pby017.
- Everett et al. [2018] R. J. Everett, M. A. Clavel, P. Pibarot, M. R. Dweck, Timing of intervention in aortic stenosis: A review of current and future strategies, Heart 104 (2018) 2067–2076. doi:10.1136/heartjnl-2017-312304.
- Otto [2006] C. M. Otto, Valvular Aortic Stenosis, Journal of the American College of Cardiology 47 (2006) 2141–2151. doi:10.1016/j.jacc.2006.03.002.
- Rahhab et al. [2019] Z. Rahhab, N. El Faquir, D. Tchetche, V. Delgado, S. Kodali, E. M. Vollema, J. Bax, M. B. Leon, N. M. Van Mieghem, Expanding the indications for transcatheter aortic valve implantation, Nature 41569 (2019) 019–0254.
- Treibel et al. [2018] T. A. Treibel, R. Kozor, R. Schofield, G. Benedetti, M. Fontana, A. N. Bhuva, A. Sheikh, B. López, A. González, C. Manisty, G. Lloyd, P. Kellman, J. Díez, J. C. Moon, Reverse Myocardial Remodeling Following Valve Replacement in Patients With Aortic Stenosis, J. Am. Coll. Cardiol. 71 (2018) 860–871. doi:10.1016/j.jacc.2017.12.035.
- Yarbrough et al. [2012] W. M. Yarbrough, R. Mukherjee, J. S. Ikonomidis, M. R. Zile, F. G. Spinale, Myocardial remodeling with aortic stenosis and after aortic valve replacement: Mechanisms and future prognostic implications, J. Thorac. Cardiovasc. Surg. 143 (2012) 656–664. doi:10.1016/j.jtcvs.2011.04.044.
- Azevedo et al. [2010] C. F. Azevedo, M. Nigri, M. L. Higuchi, P. M. Pomerantzeff, G. S. Spina, R. O. Sampaio, F. Tarasoutchi, M. Grinberg, C. E. Rochitte, Prognostic Significance of Myocardial Fibrosis Quantification by Histopathology and Magnetic Resonance Imaging in Patients With Severe Aortic Valve Disease, J. Am. Coll. Cardiol. 56 (2010) 278–287. doi:10.1016/j.jacc.2009.12.074.
- Lee et al. [2016] L. Lee, G. Kassab, J. Guccione, Mathematical modeling of cardiac growth and remodeling, Wiley Interdisciplinary Reviews: Systems Biology and Medicine 8 (2016) 211–226.
- Skalak et al. [1996] R. Skalak, S. Zargaryan, R. K. Jain, P. A. Netti, A. Hoger, Compatibility and the genesis of residual stress by volumetric growth, J. Math. Biol. 34 (1996) 889–914. doi:10.1007/BF01834825.
- Rodriguez et al. [1994] E. K. Rodriguez, A. Hoger, A. D. McCulloch, Stress-dependent finite growth in soft elastic tissues, J. Biomech. 27 (1994) 455–467. doi:10.1016/0021-9290(94)90021-3.
- van Osta et al. [2019] N. van Osta, L. van der Donk, E. Rondanina, P. Bovendeerd, Modeling cardiac growth: An alternative approach, in: International Conference on Functional Imaging and Modeling of the Heart, Springer, 2019, pp. 258–265.
- Taber [1995] L. A. Taber, Biomechanics of Growth, Remodeling, and Morphogenesis, Appl. Mech. Rev. 48 (1995) 487. doi:10.1115/1.3005109.
- Ambrosi et al. [2011] D. Ambrosi, G. Ateshian, E. Arruda, S. Cowin, J. Dumais, A. Goriely, G. Holzapfel, J. Humphrey, R. Kemkemer, E. Kuhl, J. Olberding, L. Taber, K. Garikipati, Perspectives on biological growth and remodeling, J. Mech. Phys. Solids 59 (2011) 863–883. doi:10.1016/j.jmps.2010.12.011.
- Ateshian and Humphrey [2012] G. Ateshian, J. Humphrey, Continuum Mixture Models of Biological Growth and Remodeling: Past Successes and Future Opportunities, Annu. Rev. Biomed. Eng. 14 (2012) 97–111. doi:10.1146/annurev-bioeng-071910-124726.
- Menzel and Kuhl [2012] A. Menzel, E. Kuhl, Frontiers in growth and remodeling, Mech. Res. Commun. 42 (2012) 1–14. doi:10.1016/j.mechrescom.2012.02.007.
- Cyron and Humphrey [2017] C. J. Cyron, J. D. Humphrey, Growth and remodeling of load-bearing biological soft tissues, Meccanica 52 (2017) 645–664. doi:10.1007/s11012-016-0472-5.
- Wang et al. [2017] V. Y. Wang, J. R. Hussan, H. Yousefi, C. P. Bradley, P. J. Hunter, M. P. Nash, Modelling Cardiac Tissue Growth and Remodelling, J. Elast. 129 (2017) 283–305. doi:10.1007/s10659-017-9640-7.
- Witzenburg and Holmes [2017] C. M. Witzenburg, J. W. Holmes, A comparison of phenomenologic growth laws for myocardial hypertrophy, Journal of Elasticity 129 (2017) 257–281.
- Genet et al. [2015] M. Genet, M. Rausch, L. Lee, S. Choy, X. Zhao, G. Kassab, S. Kozerke, J. Guccione, E. Kuhl, Heterogeneous growth-induced prestrain in the heart, J. Biomech. 48 (2015) 2080–2089. doi:10.1016/j.jbiomech.2015.03.012.
- Rondanina and Bovendeerd [2019] E. Rondanina, P. H. M. Bovendeerd, Evaluation of stimulus-effect relations in left ventricular growth using a simple multiscale model, Biomech. Model. Mechanobiol. (2019). URL: http://link.springer.com/10.1007/s10237-019-01209-2. doi:10.1007/s10237-019-01209-2.
- Hopkins et al. [2018] G. Hopkins, S. Skatulla, L. Moj, T. Ricken, N. Ntusi, E. Meintjes, A biphasic model for full cycle simulation of the human heart aimed at rheumatic heart disease, Computers & Structures (2018).
- Lee [1969] E. H. Lee, Elastic-Plastic Deformation at Finite Strains, J. Appl. Mech. 36 (1969) 1. doi:10.1115/1.3564580.
- Rachev et al. [1998] A. Rachev, N. Stergiopulos, J.-J. Meister, A Model for Geometric and Mechanical Adaptation of Arteries to Sustained Hypertension, J. Biomech. Eng. 120 (1998) 9. doi:10.1115/1.2834313.
- Taber [1998] L. A. Taber, A Model for Aortic Growth Based on Fluid Shear and Fiber Stresses, J. Biomech. Eng. 120 (1998) 348. doi:10.1115/1.2798001.
- Alastrué et al. [2007] V. Alastrué, E. Peña, M. Á. Martínez, M. Doblaré, Assessing the Use of the “Opening Angle Method” to Enforce Residual Stresses in Patient-Specific Arteries, Ann. Biomed. Eng. 35 (2007) 1821–1837. doi:10.1007/s10439-007-9352-4.
- Kuhl et al. [2007] E. Kuhl, R. Maas, G. Himpel, A. Menzel, Computational modeling of arterial wall growth, Biomech. Model. Mechanobiol. 6 (2007) 321–331. doi:10.1007/s10237-006-0062-x.
- Rodríguez et al. [2007] J. Rodríguez, J. M. Goicolea, F. Gabaldón, A volumetric model for growth of arterial walls with arbitrary geometry and loads, J. Biomech. 40 (2007) 961–971. doi:10.1016/j.jbiomech.2006.05.002.
- Sáez et al. [2014] P. Sáez, E. Peña, M. A. Martínez, E. Kuhl, Computational modeling of hypertensive growth in the human carotid artery, Comput. Mech. 53 (2014) 1183–1196. doi:10.1007/s00466-013-0959-z.
- Kroon et al. [2009] W. Kroon, T. Delhaas, T. Arts, P. Bovendeerd, Computational modeling of volumetric soft tissue growth: application to the cardiac left ventricle, Biomech. Model. Mechanobiol. 8 (2009) 301–309. doi:10.1007/s10237-008-0136-z.
- Göktepe et al. [2010a] S. Göktepe, O. J. Abilez, K. K. Parker, E. Kuhl, A multiscale model for eccentric and concentric cardiac growth through sarcomerogenesis, J. Theor. Biol. 265 (2010a) 433–442. doi:10.1016/j.jtbi.2010.04.023.
- Göktepe et al. [2010b] S. Göktepe, O. J. Abilez, E. Kuhl, A generic approach towards finite growth with examples of athlete’s heart, cardiac dilation, and cardiac wall thickening, J. Mech. Phys. Solids 58 (2010b) 1661–1680. doi:10.1016/j.jmps.2010.07.003.
- Lee et al. [2015] L. C. Lee, M. Genet, G. Acevedo-Bolton, K. Ordovas, J. M. Guccione, E. Kuhl, A computational model that predicts reverse growth in response to mechanical unloading, Biomech. Model. Mechanobiol. 14 (2015) 217–229. doi:10.1007/s10237-014-0598-0.
- Sundnes et al. [2014] J. Sundnes, S. Wall, H. Osnes, T. Thorvaldsen, A. McCulloch, Improved discretisation and linearisation of active tension in strongly coupled cardiac electro-mechanics simulations, Comput. Methods Biomech. Biomed. Engin. 17 (2014) 604–615. doi:10.1080/10255842.2012.704368.
- Lee et al. [2016] L. C. Lee, J. Sundnes, M. Genet, J. F. Wenk, S. T. Wall, An integrated electromechanical-growth heart model for simulating cardiac therapies, Biomech. Model. Mechanobiol. 15 (2016) 791–803. doi:10.1007/s10237-015-0723-8.
- Rausch et al. [2011] M. K. Rausch, A. Dam, S. Göktepe, O. J. Abilez, E. Kuhl, Computational modeling of growth: systemic and pulmonary hypertension in the heart, Biomech. Model. Mechanobiol. 10 (2011) 799–811. doi:10.1007/s10237-010-0275-x.
- Guccione et al. [1993] J. M. Guccione, L. K. Waldman, A. D. McCulloch, Mechanics of Active Contraction in Cardiac Muscle: Part II—Cylindrical Models of the Systolic Left Ventricle, J. Biomech. Eng. 115 (1993) 82. doi:10.1115/1.2895474.
- Klepach et al. [2012] D. Klepach, L. C. Lee, J. F. Wenk, M. B. Ratcliffe, T. I. Zohdi, J. L. Navia, G. S. Kassab, E. Kuhl, J. M. Guccione, Growth and remodeling of the left ventricle: A case study of myocardial infarction and surgical ventricular restoration, Mech. Res. Commun. 42 (2012) 134–141. doi:10.1016/j.mechrescom.2012.03.005.
- Kerckhoffs et al. [2012] R. C. Kerckhoffs, J. H. Omens, A. D. McCulloch, A single strain-based growth law predicts concentric and eccentric cardiac growth during pressure and volume overload, Mech. Res. Commun. 42 (2012) 40–50. doi:10.1016/j.mechrescom.2011.11.004.
- Genet et al. [2016] M. Genet, L. C. Lee, B. Baillargeon, J. M. Guccione, E. Kuhl, Modeling Pathologies of Diastolic and Systolic Heart Failure, Ann. Biomed. Eng. 44 (2016) 112–127. doi:10.1007/s10439-015-1351-2.
- Witzenburg and Holmes [2018] C. M. Witzenburg, J. W. Holmes, Predicting the Time Course of Ventricular Dilation and Thickening Using a Rapid Compartmental Model, J. Cardiovasc. Transl. Res. 11 (2018) 109–122. doi:10.1007/s12265-018-9793-1.
- Del Bianco et al. [2018] F. Del Bianco, P. Colli Franzone, S. Scacchi, L. Fassina, Electromechanical effects of concentric hypertrophy on the left ventricle: A simulation study, Comput. Biol. Med. 99 (2018) 236–256. doi:10.1016/j.compbiomed.2018.06.004.
- Peirlinck et al. [2019] M. Peirlinck, F. Sahli Costabal, K. Sack, J. Choy, G. Kassab, J. Guccione, M. De Beule, P. Segers, E. Kuhl, Using machine learning to characterize heart failure across the scales, Biomechanics and modeling in mechanobiology (2019) 1–15.
- Lin and Taber [1995] I.-E. Lin, L. A. Taber, A Model for Stress-Induced Growth in the Developing Heart, J. Biomech. Eng. 117 (1995) 343. doi:10.1115/1.2794190.
- Taber and Chabert [2002] L. A. Taber, S. Chabert, Theoretical and experimental study of growth and remodeling in the developing heart, Biomech. Model. Mechanobiol. 1 (2002) 29–43. doi:10.1007/s10237-002-0002-3.
- Kerckhoffs [2012] R. C. Kerckhoffs, Computational modeling of cardiac growth in the post-natal rat with a strain-based growth law, J. Biomech. 45 (2012) 865–871. doi:10.1016/j.jbiomech.2011.11.028.
- King et al. [2013] J. H. King, C. L.-H. Huang, J. A. Fraser, Determinants of myocardial conduction velocity: implications for arrhythmogenesis, Front. Physiol. 4 (2013) 331–344. doi:10.3389/fphys.2013.00154.
- Nguyen et al. [2014] T. P. Nguyen, Z. Qu, J. N. Weiss, Cardiac fibrosis and arrhythmogenesis: The road to repair is paved with perils, J. Mol. Cell. Cardiol. 70 (2014) 83–91. doi:10.1016/j.yjmcc.2013.10.018.
- Humphrey and Rajagopal [2002] J. Humphrey, K. Rajagopal, A constrained mixture model for growth and remodeling of soft tissues, Mathematical models and methods in applied sciences 12 (2002) 407–430.
- Truesdell and Noll [1965] C. Truesdell, W. Noll, The Non-Linear Field Theories of Mechanics, in: S. Flugge (Ed.), Handbuch der Physik III/3, Springer Berlin Heidelberg, Berlin, Heidelberg, 1965, pp. 1–579. doi:https://doi.org/10.1007/978-3-662-13183-1.
- Valentín et al. [2013] A. Valentín, J. Humphrey, G. Holzapfel, A finite element-based constrained mixture implementation for arterial growth, remodeling, and adaptation: Theory and numerical verification, Int. j. numer. method. biomed. eng. 29 (2013) 822–849. doi:10.1002/cnm.2555.
- Valentín and Holzapfel [2012] A. Valentín, G. Holzapfel, Constrained mixture models as tools for testing competing hypotheses in arterial biomechanics: A brief survey, Mech. Res. Commun. 42 (2012) 126–133. doi:10.1016/j.mechrescom.2012.02.003.
- Gleason and Humphrey [2004] R. Gleason, J. Humphrey, A Mixture Model of Arterial Growth and Remodeling in Hypertension: Altered Muscle Tone and Tissue Turnover, J. Vasc. Res. 41 (2004) 352–363. doi:10.1159/000080699.
- Kroon and Holzapfel [2007] M. Kroon, G. A. Holzapfel, A model for saccular cerebral aneurysm growth by collagen fibre remodelling, J. Theor. Biol. 247 (2007) 775–787. doi:10.1016/j.jtbi.2007.03.009.
- Baek et al. [2005] S. Baek, K. R. Rajagopal, J. D. Humphrey, Competition Between Radial Expansion and Thickening in the Enlargement of an Intracranial Saccular Aneurysm, J. Elast. 80 (2005) 13–31. doi:10.1007/s10659-005-9004-6.
- Valentín and Humphrey [2009] A. Valentín, J. D. Humphrey, Evaluation of fundamental hypotheses underlying constrained mixture models of arterial growth and remodelling, Philos. Trans. R. Soc. A Math. Phys. Eng. Sci. 367 (2009) 3585–3606. doi:10.1098/rsta.2009.0113.
- Figueroa et al. [2009] A. C. Figueroa, S. Baek, C. A. Taylor, J. D. Humphrey, A computational framework for fluid–solid-growth modeling in cardiovascular simulations, Comput. Methods Appl. Mech. Eng. 198 (2009) 3583–3602. doi:10.1016/j.cma.2008.09.013.
- Karšaj et al. [2010] I. Karšaj, J. Sorić, J. Humphrey, A 3-D framework for arterial growth and remodeling in response to altered hemodynamics, Int. J. Eng. Sci. 48 (2010) 1357–1372. doi:10.1016/j.ijengsci.2010.06.033.
- Machyshyn et al. [2010] I. M. Machyshyn, P. H. M. Bovendeerd, A. A. F. van de Ven, P. M. J. Rongen, F. N. van de Vosse, A model for arterial adaptation combining microstructural collagen remodeling and 3D tissue growth, Biomech. Model. Mechanobiol. 9 (2010) 671–687. doi:10.1007/s10237-010-0204-z.
- Schmid et al. [2012] H. Schmid, L. Pauli, A. Paulus, E. Kuhl, M. Itskov, Consistent formulation of the growth process at the kinematic and constitutive level for soft tissues composed of multiple constituents, Comput. Methods Biomech. Biomed. Engin. 15 (2012) 547–561. doi:10.1080/10255842.2010.548325.
- Eriksson et al. [2014] T. Eriksson, P. Watton, X. Luo, Y. Ventikos, Modelling volumetric growth in a thick walled fibre reinforced artery, J. Mech. Phys. Solids 73 (2014) 134–150. doi:10.1016/j.jmps.2014.09.003.
- Wan et al. [2010] W. Wan, L. Hansen, R. L. Gleason, A 3-D constrained mixture model for mechanically mediated vascular growth and remodeling, Biomech. Model. Mechanobiol. 9 (2010) 403–419. doi:10.1007/s10237-009-0184-z.
- Baek et al. [2005] S. Baek, P. B. Wells, K. R. Rajagopal, J. D. Humphrey, Heat-Induced Changes in the Finite Strain Viscoelastic Behavior of a Collaagenous Tissue, J. Biomech. Eng. 127 (2005) 580. doi:10.1115/1.1934222.
- Wu and Shadden [2015] J. Wu, S. C. Shadden, Coupled Simulation of Hemodynamics and Vascular Growth and Remodeling in a Subject-Specific Geometry, Ann. Biomed. Eng. 43 (2015) 1543–1554. doi:10.1007/s10439-015-1287-6.
- Virag et al. [2015] L. Virag, J. S. Wilson, J. D. Humphrey, I. Karšaj, A Computational Model of Biochemomechanical Effects of Intraluminal Thrombus on the Enlargement of Abdominal Aortic Aneurysms, Ann. Biomed. Eng. 43 (2015) 2852–2867. doi:10.1007/s10439-015-1354-z.
- Famaey et al. [2018] N. Famaey, J. Vastmans, H. Fehervary, L. Maes, E. Vanderveken, F. Rega, S. J. Mousavi, S. Avril, Numerical simulation of arterial remodeling in pulmonary autografts, ZAMM - J. Appl. Math. Mech. / Zeitschrift für Angew. Math. und Mech. 98 (2018) 2239–2257. doi:10.1002/zamm.201700351.
- Horvat et al. [2019] N. Horvat, L. Virag, G. A. Holzapfel, J. Sorić, I. Karšaj, A finite element implementation of a growth and remodeling model for soft biological tissues: Verification and application to abdominal aortic aneurysms, Comput. Methods Appl. Mech. Eng. 352 (2019) 586–605. doi:10.1016/j.cma.2019.04.041.
- Latorre and Humphrey [2018] M. Latorre, J. D. Humphrey, A mechanobiologically equilibrated constrained mixture model for growth and remodeling of soft tissues, ZAMM - J. Appl. Math. Mech. / Zeitschrift für Angew. Math. und Mech. 98 (2018) 2048–2071. doi:10.1002/zamm.201700302.
- Mousavi and Avril [2017] S. J. Mousavi, S. Avril, Patient-specific stress analyses in the ascending thoracic aorta using a finite-element implementation of the constrained mixture theory, Biomech. Model. Mechanobiol. 16 (2017) 1765–1777. doi:10.1007/s10237-017-0918-2.
- Arts et al. [1979] T. Arts, R. S. Reneman, P. C. Veenstra, A model of the mechanics of the left ventricle, Annals of biomedical engineering 7 (1979) 299–318.
- Arts et al. [1991] T. Arts, P. Bovendeerd, F. W. Prinzen, R. S. Reneman, Relation between left ventricular cavity pressure and volume and systolic fiber stress and strain in the wall, Biophysical journal 59 (1991) 93–102.
- Arts et al. [1994] T. Arts, F. Prinzen, L. Snoeckx, J. Rijcken, R. Reneman, Adaptation of cardiac structure by mechanical feedback in the environment of the cell: a model study, Biophys. J. 66 (1994) 953–961. doi:10.1016/S0006-3495(94)80876-8.
- Arts et al. [2005] T. Arts, T. Delhaas, P. Bovendeerd, X. Verbeek, F. W. Prinzen, Adaptation to mechanical load determines shape and properties of heart and circulation: the CircAdapt model, Am. J. Physiol. Circ. Physiol. 288 (2005) H1943–H1954. doi:10.1152/ajpheart.00444.2004.
- Lumens et al. [2009] J. Lumens, T. Delhaas, B. Kirn, T. Arts, Three-Wall Segment (TriSeg) Model Describing Mechanics and Hemodynamics of Ventricular Interaction, Annals of Biomedical Engineering 37 (2009) 2234–2255. doi:10.1007/s10439-009-9774-2.
- Kroon et al. [2009] W. Kroon, T. Delhaas, P. Bovendeerd, T. Arts, Computational analysis of the myocardial structure: Adaptation of cardiac myofiber orientations through deformation, Med. Image Anal. 13 (2009) 346–353. doi:10.1016/j.media.2008.06.015.
- Pluijmert et al. [2012] M. Pluijmert, W. Kroon, T. Delhaas, P. Bovendeerd, Adaptive reorientation of cardiac myofibers: The long-term effect of initial and boundary conditions, Mechanics Research Communications 42 (2012) 60–67. doi:10.1016/j.mechrescom.2011.11.011.
- Pluijmert et al. [2017] M. Pluijmert, T. Delhaas, A. F. de la Parra, W. Kroon, F. W. Prinzen, P. H. M. Bovendeerd, Determinants of biventricular cardiac function: a mathematical model study on geometry and myofiber orientation, Biomech. Model. Mechanobiol. 16 (2017) 721–729. doi:10.1007/s10237-016-0825-y.
- Bovendeerd [2012] P. Bovendeerd, Modeling of cardiac growth and remodeling of myofiber orientation, J. Biomech. 45 (2012) 872–881. doi:10.1016/j.jbiomech.2011.11.029.
- Cowin [2010] S. C. Cowin, Continuum kinematical modeling of mass increasing biological growth, Int. J. Eng. Sci. 48 (2010) 1137–1145. doi:10.1016/j.ijengsci.2010.06.008.
- Lanir [2015] Y. Lanir, Mechanistic micro-structural theory of soft tissues growth and remodeling: tissues with unidirectional fibers, Biomech. Model. Mechanobiol. 14 (2015) 245–266. doi:10.1007/s10237-014-0600-x.
- Lanir [2017] Y. Lanir, Fibrous tissues growth and remodeling: Evolutionary micro-mechanical theory, J. Mech. Phys. Solids 107 (2017) 115–144. doi:10.1016/j.jmps.2017.06.011.
- Alford et al. [2008] P. W. Alford, J. D. Humphrey, L. A. Taber, Growth and remodeling in a thick-walled artery model: effects of spatial variations in wall constituents, Biomech. Model. Mechanobiol. 7 (2008) 245–262. doi:10.1007/s10237-007-0101-2.
- Watton et al. [2004] P. N. Watton, N. A. Hill, M. Heil, A mathematical model for the growth of the abdominal aortic aneurysm, Biomech. Model. Mechanobiol. 3 (2004) 98–113. doi:10.1007/s10237-004-0052-9.
- Watton and Hill [2009] P. N. Watton, N. A. Hill, Evolving mechanical properties of a model of abdominal aortic aneurysm, Biomech. Model. Mechanobiol. 8 (2009) 25–42.
- Watton et al. [2009] P. N. Watton, Y. Ventikos, G. A. Holzapfel, Modelling the mechanical response of elastin for arterial tissue, J. Biomech. 42 (2009) 1320–1325. doi:10.1016/j.jbiomech.2009.03.012.
- Watton et al. [2011] P. N. Watton, A. Selimovic, N. B. Raberger, P. Huang, G. A. Holzapfel, Y. Ventikos, Modelling evolution and the evolving mechanical environment of saccular cerebral aneurysms, Biomech. Model. Mechanobiol. 10 (2011) 109–132. doi:10.1007/s10237-010-0221-y.
- Selimovic et al. [2014] A. Selimovic, Y. Ventikos, P. N. Watton, Modelling the Evolution of Cerebral Aneurysms: Biomechanics, Mechanobiology and Multiscale Modelling, Procedia IUTAM 10 (2014) 396–409. doi:10.1016/j.piutam.2014.01.034.
- Grytsan et al. [2017] A. Grytsan, T. Eriksson, P. Watton, T. Gasser, Growth Description for Vessel Wall Adaptation: A Thick-Walled Mixture Model of Abdominal Aortic Aneurysm Evolution, Materials (Basel). 10 (2017) 994. doi:10.3390/ma10090994.
- Lin et al. [2018] W. J. Lin, M. D. Iafrati, R. A. Peattie, L. Dorfmann, Growth and remodeling with application to abdominal aortic aneurysms, J. Eng. Math. 109 (2018) 113–137. doi:10.1007/s10665-017-9915-9.
- Lin et al. [2019] W. Lin, M. Iafrati, R. Peattie, L. Dorfmann, Non-axisymmetric dilatation of a thick-walled aortic aneurysmal tissue, Int. J. Non. Linear. Mech. 109 (2019) 172–181. doi:10.1016/j.ijnonlinmec.2018.11.010.
- Cyron et al. [2016] C. J. Cyron, R. C. Aydin, J. D. Humphrey, A homogenized constrained mixture (and mechanical analog) model for growth and remodeling of soft tissue, Biomech. Model. Mechanobiol. 15 (2016) 1389–1403. doi:10.1007/s10237-016-0770-9.
- Braeu et al. [2018] F. A. Braeu, R. C. Aydin, C. Cyron, Anisotropic stiffness and tensional homeostasis induce a natural anisotropy of volumetric growth and remodeling in soft biological tissues, 2018. doi:10.1007/s10237-018-1084-x.
- Dokos et al. [2002] S. Dokos, B. H. Smaill, A. a. Young, I. J. LeGrice, Shear properties of passive ventricular myocardium, Am. J. Physiol. Circ. Physiol. 283 (2002) H2650–H2659. doi:10.1152/ajpheart.00111.2002.
- Guccione et al. [1991] J. M. Guccione, A. D. McCulloch, L. K. Waldman, Passive Material Properties of Intact Ventricular Myocardium Determined From a Cylindrical Model, J. Biomech. Eng. 113 (1991) 42. doi:10.1115/1.2894084.
- Costa et al. [1999] K. D. Costa, Y. Takayama, A. D. McCulloch, J. W. Covell, Laminar fiber architecture and three-dimensional systolic mechanics in canine ventricular myocardium, Am. J. Physiol. Circ. Physiol. 276 (1999) H595–H607. doi:10.1152/ajpheart.1999.276.2.H595.
- Sommer et al. [2015] G. Sommer, A. J. Schriefl, M. Andrä, M. Sacherer, C. Viertler, H. Wolinski, G. A. Holzapfel, Biomechanical properties and microstructure of human ventricular myocardium, Acta Biomater. 24 (2015) 172–192. doi:10.1016/j.actbio.2015.06.031.
- Nevo and Lanir [1994] E. Nevo, Y. Lanir, The effect of residual strain on the diastolic function of the left ventricle as predicted by a structural model, J. Biomech. 27 (1994) 1433–1446. doi:10.1016/0021-9290(94)90193-7.
- Holzapfel and Ogden [2009] G. A. Holzapfel, R. W. Ogden, Constitutive modelling of passive myocardium: a structurally based framework for material characterization, Philos. Trans. R. Soc. A Math. Phys. Eng. Sci. 367 (2009) 3445–3475. doi:10.1098/rsta.2009.0091.
- Eriksson et al. [2013] T. S. E. Eriksson, A. J. Prassl, G. Plank, G. A. Holzapfel, Modeling the dispersion in electro-mechanically coupled myocardium, Int. J. Numer. Method Biomed. Eng. 29 (2013) 1267–1284.
- Gültekin et al. [2016] O. Gültekin, G. Sommer, G. A. Holzapfel, An orthotropic viscoelastic model for the passive myocardium: continuum basis and numerical treatment, Comput. Methods Biomech. Biomed. Engin. 19 (2016) 1647–1664. doi:10.1080/10255842.2016.1176155.
- Cansız et al. [2015] F. B. C. Cansız, H. Dal, M. Kaliske, An orthotropic viscoelastic material model for passive myocardium: theory and algorithmic treatment, Comput. Methods Biomech. Biomed. Engin. 18 (2015) 1160–1172. doi:10.1080/10255842.2014.881475.
- Wang et al. [2014] H. M. Wang, X. Y. Luo, H. Gao, R. W. Ogden, B. E. Griffith, C. Berry, T. J. Wang, A modified Holzapfel-Ogden law for a residually stressed finite strain model of the human left ventricle in diastole, Biomech. Model. Mechanobiol. 13 (2014) 99–113. doi:10.1007/s10237-013-0488-x.
- Wang et al. [2015] V. Wang, P. Nielsen, M. Nash, Image-Based Predictive Modeling of Heart Mechanics, Annu. Rev. Biomed. Eng. 17 (2015) 351–383. doi:10.1146/annurev-bioeng-071114-040609.
- Avazmohammadi et al. [2017] R. Avazmohammadi, M. R. Hill, M. A. Simon, W. Zhang, M. S. Sacks, A novel constitutive model for passive right ventricular myocardium: evidence for myofiber–collagen fiber mechanical coupling, Biomech. Model. Mechanobiol. 16 (2017) 561–581. doi:10.1007/s10237-016-0837-7.
- Driessen et al. [2005] N. J. B. Driessen, C. V. C. Bouten, F. P. T. Baaijens, A Structural Constitutive Model For Collagenous Cardiovascular Tissues Incorporating the Angular Fiber Distribution, J. Biomech. Eng. 127 (2005) 494. doi:10.1115/1.1894373.
- Hariton et al. [2007] I. Hariton, G. deBotton, T. C. Gasser, G. A. Holzapfel, Stress-driven collagen fiber remodeling in arterial walls, Biomech. Model. Mechanobiol. 6 (2007) 163–175.
- Wang et al. [2016] V. Wang, J. Niestrawska, A. Wilson, G. Sands, A. Young, I. LeGrice, M. Nash, Image-Driven Constitutive Modelling of Myocardial Fibrosis, Int. J. Comput. Methods Eng. Sci. Mech. (2016) 00–00. doi:10.1080/15502287.2015.1082675.
- Volokh and Vorp [2008] K. Volokh, D. Vorp, A model of growth and rupture of abdominal aortic aneurysm, J. Biomech. 41 (2008) 1015–1021. doi:10.1016/j.jbiomech.2007.12.014.
- Omens [1996] J. Omens, Transmural Changes in Stress-free Myocyte Morphology During Pressure Overload Hypertrophy in the Rat, J. Mol. Cell. Cardiol. 28 (1996) 1975–1983. URL: https://linkinghub.elsevier.com/retrieve/pii/S002228289690190X. doi:10.1006/jmcc.1996.0190.
- Nediani et al. [2000] C. Nediani, L. Formigli, A. Perna, L. Ibba-Manneschi, S. Zecchi-Orlandini, C. Fiorillo, V. Ponziani, C. Cecchi, P. Liguori, G. Fratini, P. Nassi, Early Changes Induced in the Left Ventricle by Pressure Overload. An Experimental Study on Swine Heart, J. Mol. Cell. Cardiol. 32 (2000) 131–142. doi:10.1006/jmcc.1999.1060.
- Nagatomo et al. [2000] Y. Nagatomo, B. A. Carabello, M. L. Coker, P. J. McDermott, S. Nemoto, M. Hamawaki, F. G. Spinale, Differential effects of pressure or volume overload on myocardial MMP levels and inhibitory control, Am. J. Physiol. Circ. Physiol. 278 (2000) H151–H161. doi:10.1152/ajpheart.2000.278.1.H151.
- Schubert et al. [2001] A. Schubert, T. Walther, V. Falk, C. Binner, N. Löscher, A. Kanev, S. Bleiziffer, T. Rauch, R. Autschbach, F. W. Mohr, Extracellular matrix gene expression correlates to left ventricular mass index after surgical induction of left ventricular hypertrophy, Basic Res. Cardiol. 96 (2001) 381–387. doi:10.1007/s003950170046.
- Moorjani et al. [2006] N. Moorjani, M. Ahmad, P. Catarino, R. Brittin, D. Trabzuni, F. Al-Mohanna, N. Narula, J. Narula, S. Westaby, Activation of Apoptotic Caspase Cascade During the Transition to Pressure Overload-Induced Heart Failure, J. Am. Coll. Cardiol. 48 (2006) 1451–1458. doi:10.1016/j.jacc.2006.05.065.
- Yarbrough et al. [2012] W. M. Yarbrough, R. Mukherjee, R. E. Stroud, W. T. Rivers, J. M. Oelsen, J. A. Dixon, S. R. Eckhouse, J. S. Ikonomidis, M. R. Zile, F. G. Spinale, Progressive induction of left ventricular pressure overload in a large animal model elicits myocardial remodeling and a unique matrix signature, J. Thorac. Cardiovasc. Surg. 143 (2012) 215–223. doi:10.1016/j.jtcvs.2011.09.032.
- LeGrice et al. [2012] I. J. LeGrice, A. J. Pope, G. B. Sands, G. Whalley, R. N. Doughty, B. H. Smaill, Progression of myocardial remodeling and mechanical dysfunction in the spontaneously hypertensive rat, Am. J. Physiol. Circ. Physiol. 303 (2012) H1353–H1365. doi:10.1152/ajpheart.00748.2011.
- Wilson et al. [2017] A. J. Wilson, V. Y. Wang, G. B. Sands, A. A. Young, M. P. Nash, I. J. LeGrice, Increased cardiac work provides a link between systemic hypertension and heart failure, Physiol. Rep. 5 (2017) e13104. doi:10.14814/phy2.13104.
- Crozatier et al. [1984] B. Crozatier, D. Caillet, O. Bical, Left ventricular adaptation to sustained pressure overload in the conscious dog., Circ. Res. 54 (1984) 21–29. doi:10.1161/01.RES.54.1.21.
- Sasayama et al. [1977] S. Sasayama, D. Franklin, J. Ross, Hyperfunction with normal inotropic state of the hypertrophied left ventricle, Am. J. Physiol. Circ. Physiol. 232 (1977) H418–H425. doi:10.1152/ajpheart.1977.232.4.H418.
- Kaplan [2018] J. A. Kaplan (Ed.), Kaplan’s Essentials of Cardiac Anesthesia (Second Edition), Elsevier, 2018, pp. 62–79.
- Klabunde [2005] R. Klabunde, Cellular Structure and Function, in: Cardiovasc. Physiol. Concepts, 2nd ed., Lippincott Williams & Wilkins, Athens, Ohio, 2005, pp. 41—-58.
- Spach and Heidlage [1995] M. S. Spach, J. F. Heidlage, The stochastic nature of cardiac propagation at a microscopic level: electrical description of myocardial architecture and its application to conduction, Circulation research 76 (1995) 366–380.
- Stinstra et al. [2010] J. Stinstra, R. MacLeod, C. Henriquez, Incorporating histology into a 3d microscopic computer model of myocardium to study propagation at a cellular level, Annals of biomedical engineering 38 (2010) 1399–1414.
- Frank [1895] O. Frank, Zur dynamik des herzmuskels, Z Biol 32 (1895) 370–447.
- Koitabashi and Kass [2012] N. Koitabashi, D. A. Kass, Reverse remodeling in heart failure—mechanisms and therapeutic opportunities, Nature Reviews Cardiology 9 (2012) 147.
- Leri et al. [2015] A. Leri, M. Rota, F. S. Pasqualini, P. Goichberg, P. Anversa, Origin of cardiomyocytes in the adult heart, Circulation research 116 (2015) 150–166.
- Kumar et al. [2005] V. Kumar, A. Abbas, J. Aster, Robbins and Cotran Pathologic Basis of Disease, Elsevier Saunders, 2005.
- Bray et al. [2008] M.-A. Bray, S. P. Sheehy, K. K. Parker, Sarcomere alignment is regulated by myocyte shape, Cell motility and the cytoskeleton 65 (2008) 641–651.
- Leonard et al. [2012] B. L. Leonard, B. H. Smaill, I. J. LeGrice, Structural Remodeling and Mechanical Function in Heart Failure, Microsc. Microanal. 18 (2012) 50–67. doi:10.1017/S1431927611012438.
- Karlon et al. [2000] W. J. Karlon, A. D. McCulloch, J. W. Covell, J. J. Hunter, J. H. Omens, Regional dysfunction correlates with myofiber disarray in transgenic mice with ventricular expression of ras, Am. J. Physiol. Heart Circ. Physiol. 278 (2000) H898–906.
- Weber et al. [1989] K. T. Weber, J. E. Jalil, J. S. Janicki, R. Pick, Myocardial Collagen Remodeling in Pressure Overload Hypertrophy, Am. J. Hypertens. 2 (1989) 931–940. doi:10.1093/ajh/2.12.931.
- Macchiarelli et al. [2002] G. Macchiarelli, O. Ohtani, S. Nottola, A. Camboni, A micro-anatomical model of the distribution of myocardial endomysial collagen Electron microscopy of human gametes in IVF programs. View project Human Reproductive Biology View project, Histol. Histopathol. 17 (2002) 699–706. doi:10.14670/HH-17.699.
- Weber [1989] K. T. Weber, Cardiac interstitium in health and disease: The fibrillar collagen network, J. Am. Coll. Cardiol. 13 (1989) 1637–1652. doi:10.1016/0735-1097(89)90360-4.
- Caulfield and Borg [1979] J. Caulfield, T. Borg, The collagen network of the heart, Lab. Invest. 40 (1979) 364–372.
- LeGrice et al. [1995] I. J. LeGrice, B. H. Smaill, L. Z. Chai, S. G. Edgar, J. B. Gavin, P. J. Hunter, Laminar structure of the heart: ventricular myocyte arrangement and connective tissue architecture in the dog, Am. J. Physiol. Circ. Physiol. 269 (1995) H571–H582. doi:10.1152/ajpheart.1995.269.2.H571.
- Pope et al. [2008] A. J. Pope, G. B. Sands, B. H. Smaill, I. J. LeGrice, Three-dimensional transmural organization of perimysial collagen in the heart, American Journal of Physiology-Heart and Circulatory Physiology 295 (2008) H1243–H1252.
- Weber et al. [2013] K. T. Weber, Y. Sun, S. K. Bhattacharya, R. A. Ahokas, I. C. Gerling, Myofibroblast-mediated mechanisms of pathological remodelling of the heart, Nat. Rev. Cardiol. 10 (2013) 15–26. doi:10.1038/nrcardio.2012.158.
- Fomovsky et al. [2010] G. Fomovsky, S. Thomopoulos, J. W. Holmes, Contribution of extracellular matrix to the mechanical properties of the heart, J. Mol. Cell Cardiol. 48 (2010) 490–496.
- Fedak et al. [2005] P. W. Fedak, S. Verma, R. D. Weisel, R.-K. Li, Cardiac remodeling and failure, Cardiovasc. Pathol. 14 (2005) 49–60. doi:10.1016/j.carpath.2005.01.005.
- Robinson et al. [1987] T. Robinson, S. Factor, J. Capasso, B. Wittenberg, O. Blumenfeld, S. Seifter, Morphology, composition, and function of struts between cardiac myocytes of rat and hamster, Cell Tissue Res. 249 (1987) 247–255. doi:10.1007/BF00215507.
- Porter and Turner [2009] K. E. Porter, N. A. Turner, Cardiac fibroblasts: at the heart of myocardial remodeling, Pharmacology & therapeutics 123 (2009) 255–278.
- Ongstad and Kohl [2016] E. Ongstad, P. Kohl, Fibroblast-myocyte coupling in the heart: Potential relevance for therapeutic interventions., Journal of molecular and cellular cardiology 91 (2016) 238–246. doi:10.1016/j.yjmcc.2016.01.010.
- Kohl and Gourdie [2014] P. Kohl, R. G. Gourdie, Fibroblast-myocyte electrotonic coupling: does it occur in native cardiac tissue?, Journal of molecular and cellular cardiology 70 (2014) 37–46. doi:10.1016/j.yjmcc.2013.12.024.
- van Putten et al. [2016] S. van Putten, Y. Shafieyan, B. Hinz, Mechanical control of cardiac myofibroblasts, J. Mol. Cell. Cardiol. 93 (2016) 133–142. doi:10.1016/j.yjmcc.2015.11.025.
- Goshima and Tonomura [1969] K. Goshima, Y. Tonomura, Synchronized beating of embryonic mouse myocardial cells mediated by fl cells in monolayer culture, Experimental cell research 56 (1969) 387–392.
- Kamkin et al. [2003] A. Kamkin, I. Kiseleva, G. Isenberg, K.-D. Wagner, J. Günther, H. Theres, H. Scholz, Cardiac fibroblasts and the mechano-electric feedback mechanism in healthy and diseased hearts, Progress in biophysics and molecular biology 82 (2003) 111–120.
- Gaudesius et al. [2003] G. Gaudesius, M. Miragoli, S. P. Thomas, S. Rohr, Coupling of cardiac electrical activity over extended distances by fibroblasts of cardiac origin, Circulation research 93 (2003) 421–428.
- Creemers and Pinto [2011] E. E. Creemers, Y. M. Pinto, Molecular mechanisms that control interstitial fibrosis in the pressure-overloaded heart, Cardiovasc. Res. 89 (2011) 265–272. doi:10.1093/cvr/cvq308.
- Weber et al. [1987] K. T. Weber, J. S. Janicki, R. Pick, C. Abrahams, S. G. Shroff, R. I. Bashey, R. M. Chen, Collagen in the hypertrophied, pressure-overloaded myocardium., Circulation 75 (1987) I40–7.
- Akdemir [2002] D. Akdemir, Histologische und immunhistologische Untersuchungen der extrazellulären Matrix bei Patienten mit erworbenen Herzklappenfehlern, Ph.D. thesis, Ruhr-Universität Bochum, 2002.
- Bonnin et al. [1981] C. M. Bonnin, M. P. Sparrow, R. R. Taylor, Collagen synthesis and content in right ventricular hypertrophy in the dog, Am. J. Physiol. Circ. Physiol. 241 (1981) H708–H713. doi:10.1152/ajpheart.1981.241.5.H708.
- Kajstura et al. [2004] J. Kajstura, A. Leri, C. Castaldo, B. Nadal-Ginard, P. Anversa, Myocyte growth in the failing heart, Surg. Clin. North Am. 84 (2004) 161–177. doi:10.1016/S0039-6109(03)00215-9.
- Ferrari [2002] R. Ferrari, Healthy versus sick myocytes: Metabolism, structure and function, Eur. Hear. Journal, Suppl. 4 (2002) 1–12. doi:10.1016/S1520-765X(02)90084-2.
- Weber et al. [1988] K. T. Weber, J. S. Janicki, S. G. Shroff, R. Pick, R. M. Chen, R. I. Bashey, Collagen remodeling of the pressure-overloaded, hypertrophied nonhuman primate myocardium., Circ. Res. 62 (1988) 757–765. doi:10.1161/01.RES.62.4.757.
- Gabbiani [2003] G. Gabbiani, The myofibroblast in wound healing and fibrocontractive diseases, The Journal of Pathology: A Journal of the Pathological Society of Great Britain and Ireland 200 (2003) 500–503.
- Hess et al. [1981] O. M. Hess, J. Schneider, R. Koch, C. Bamert, J. Grimm, H. P. Krayenbuehl, Diastolic function and myocardial structure in patients with myocardial hypertrophy. Special reference to normalized viscoelastic data., Circulation 63 (1981) 360–371. doi:10.1161/01.CIR.63.2.360.
- Humphrey [2001] J. D. Humphrey, Stress, Strain, and Mechanotransduction in Cells, J. Biomech. Eng. 123 (2001) 638. doi:10.1115/1.1406131.
- Russell et al. [2010] B. Russell, M. W. Curtis, Y. E. Koshman, A. M. Samarel, Mechanical stress-induced sarcomere assembly for cardiac muscle growth in length and width, J. Mol. Cell. Cardiol. 48 (2010) 817–823. doi:10.1016/j.yjmcc.2010.02.016.
- Dix and Eisenberg [1990] D. J. Dix, B. R. Eisenberg, Myosin mrna accumulation and myofibrillogenesis at the myotendinous junction of stretched muscle fibers., The Journal of cell biology 111 (1990) 1885–1894.
- Perriard et al. [2003] J.-C. Perriard, A. Hirschy, E. Ehler, Dilated cardiomyopathy: a disease of the intercalated disc?, Trends in cardiovascular medicine 13 (2003) 30–38.
- Knöll et al. [2002] R. Knöll, M. Hoshijima, H. M. Hoffman, V. Person, I. Lorenzen-Schmidt, M.-L. Bang, T. Hayashi, N. Shiga, H. Yasukawa, W. Schaper, et al., The cardiac mechanical stretch sensor machinery involves a z disc complex that is defective in a subset of human dilated cardiomyopathy, Cell 111 (2002) 943–955.
- Miller et al. [2004] M. K. Miller, H. Granzier, E. Ehler, C. C. Gregorio, The sensitive giant: the role of titin-based stretch sensing complexes in the heart, Trends in cell biology 14 (2004) 119–126.
- Wang et al. [1993] N. Wang, J. P. Butler, D. E. Ingber, Mechanotransduction across the cell surface and through the cytoskeleton, Science 260 (1993) 1124–1127.
- Cyron and Humphrey [2014] C. Cyron, J. Humphrey, Vascular homeostasis and the concept of mechanobiological stability, Int. J. Eng. Sci. 85 (2014) 203–223. doi:10.1016/j.ijengsci.2014.08.003.
- Ambrosi et al. [2019] D. Ambrosi, M. Ben Amar, C. J. Cyron, A. DeSimone, A. Goriely, J. D. Humphrey, E. Kuhl, Growth and remodelling of living tissues: perspectives, challenges and opportunities, Journal of the Royal Society Interface 16 (2019) 20190233.
- Sharma and Roth [2018] K. Sharma, B. Roth, The mechanical bidomain model of cardiac muscle with curving fibers, Physical Biology 15 (2018) 066012. doi:10.1088/1478-3975/aadacd.
- Kim et al. [2018] G. H. Kim, N. Uriel, D. Burkhoff, Reverse remodelling and myocardial recovery in heart failure, Nature Reviews Cardiology 15 (2018) 83.
- Borg and Baudino [2011] T. K. Borg, T. A. Baudino, Dynamic interactions between the cellular components of the heart and the extracellular matrix, Pflügers Arch. - Eur. J. Physiol. 462 (2011) 69–74. doi:10.1007/s00424-011-0940-7.
- Ramasubramanian et al. [2006] A. Ramasubramanian, K. S. Latacha, J. M. Benjamin, D. A. Voronov, A. Ravi, L. A. Taber, Computational Model for Early Cardiac Looping, Ann. Biomed. Eng. 34 (2006) 1355–1369. doi:10.1007/s10439-006-9152-2.
- Epstein and Maugin [2000] M. Epstein, G. A. Maugin, Thermomechanics of volumetric growth in uniform bodies, International Journal of Plasticity 16 (2000) 951–978. doi:10.1016/S0749-6419(99)00081-9.
- Kerckhoffs et al. [2003] R. C. P. Kerckhoffs, P. H. M. Bovendeerd, J. C. S. Kotte, F. W. Prinzen, K. Smits, T. Arts, Homogeneity of Cardiac Contraction Despite Physiological Asynchrony of Depolarization: A Model Study, Ann. Biomed. Eng. 31 (2003) 536–547. doi:10.1114/1.1566447.
- Nitenberg et al. [1979] A. Nitenberg, J. Perennec, N. Curien, J. Richalet, F. Veyssiere, P. Hatt, D. Laurent, Etude comparative de la performance ventriculaire gauche et de la structure du myocarde par biopsie endomyocardique dans les cardiopathies valvulaires, Arch Mal Coeur 72 (1979) 1286–1295.
- Schwarz et al. [1981] F. Schwarz, J. Schaper, D. Kittstein, W. Flameng, P. Walter, W. Schaper, Reduced volume fraction of myofibrils in myocardium of patients with decompensated pressure overload., Circulation 63 (1981) 1299–1304. doi:10.1161/01.CIR.63.6.1299.
- Hess et al. [1984] O. M. Hess, M. Ritter, J. Schneider, J. Grimm, M. Turina, H. P. Krayenbuehl, Diastolic stiffness and myocardial structure in aortic valve disease before and after valve replacement., Circulation 69 (1984) 855–865. doi:10.1161/01.CIR.69.5.855.
- Huysman et al. [1989] J. Huysman, H. Vliegen, A. Van Der Laarse, F. Eulderink, Changes in Nonmyocyte Tissue Composition Associated with Pressure Overload of Hypertrophic Human Hearts, Pathol. - Res. Pract. 184 (1989) 577–581. doi:10.1016/S0344-0338(89)80162-1.
- Vliegen et al. [1991] H. W. Vliegen, A. Van der Laarse, C. J. Cornelisse, F. Euldernik, Myocardial changes in pressure overload-induced left ventricular hypertrophy, Eur. Heart J. 12 (1991) 488–494. doi:10.1093/oxfordjournals.eurheartj.a059928.
- Villari et al. [1993] B. Villari, S. E. Campbell, O. M. Hess, G. Mall, G. Vassalli, K. T. Weber, H. P. Krayenbuehl, Influence of collagen network on left ventricular systolic and diastolic function in aortic valve disease, J. Am. Coll. Cardiol. 22 (1993) 1477–1484. doi:10.1016/0735-1097(93)90560-N.
- Villari et al. [1995] B. Villari, G. Vassalli, E. S. Monrad, M. Chiariello, M. Turina, O. M. Hess, Normalization of Diastolic Dysfunction in Aortic Stenosis Late After Valve Replacement, Circulation 91 (1995) 2353–2358. doi:10.1161/01.CIR.91.9.2353.
- Herrmann et al. [2011] S. Herrmann, S. Störk, M. Niemann, V. Lange, J. M. Strotmann, S. Frantz, M. Beer, S. Gattenlöhner, W. Voelker, G. Ertl, F. Weidemann, Low-Gradient Aortic Valve Stenosis, J. Am. Coll. Cardiol. 58 (2011) 402–412. doi:10.1016/j.jacc.2011.02.059.
- Weber [1989] K. T. Weber, Cardiac interstitium in health and disease: The fibrillar collagen network, J. Am. Coll. Cardiol. 13 (1989) 1637–1652.
Figures
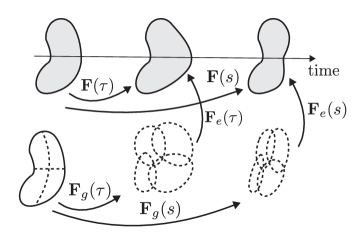
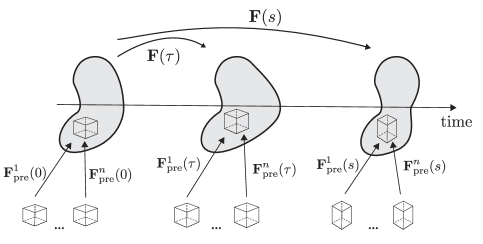

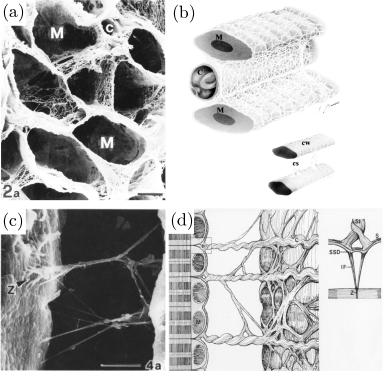
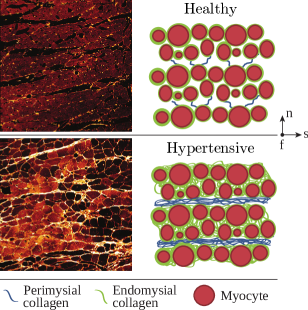
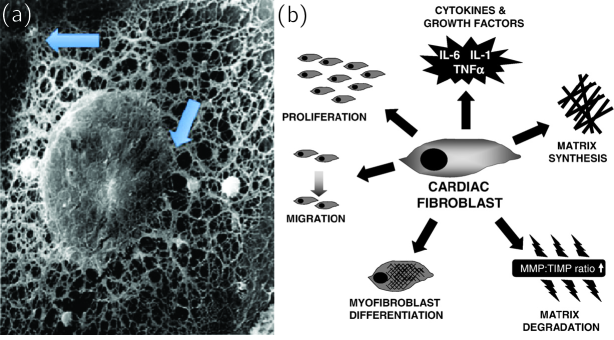
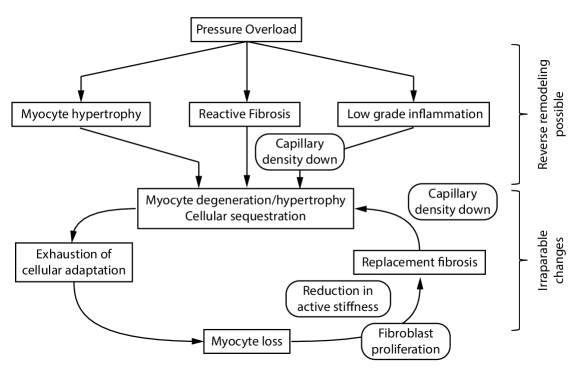
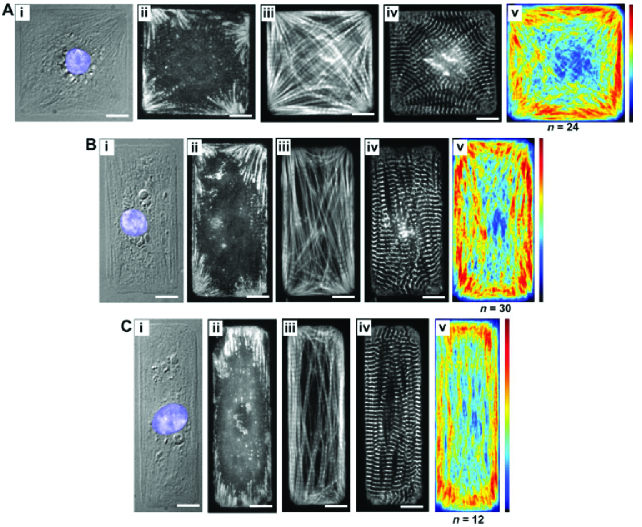
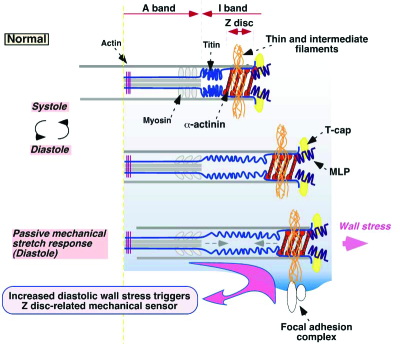
| Model | Geometry and Material | Driving Factor | Growth Laws |
| Kroon et al. [38] | Truncated ellipsoid; | ||
| transversely isotropic [178] | Deviation of myofiber strain from its homeostatic level | , | |
| where is a rate constant | |||
| Göktepe et al. [39] | Regularly shaped bi-ventricular model; isotropic material | Deviation from strain for eccentric growth | |
| Deviation from Mandel stress for concentric growth | |||
| Eccentric growth: | |||
| Concentric growth: | |||
| Rausch et al. [44] | Regularly shaped bi-ventricular model; orthotropic Holzapfel–Ogden [106] | , with the Kirchhoff stress tensor and the baseline pressure level | |
| Klepach et al. [46] | Patient-specific LV; | ||
| transversely isotropic Guccione [102] | Same as Rausch et al. [44] | ||
| Kerckhoffs et al. [47] | Thick-walled truncated ellipsoid; | ||
| transversely isotropic Guccione [102] | Stimulus for axial fiber growth , and radial fiber growth as differences between fiber strain and maximum principal strain of the cross-sectional strain tensor: and set-points | Transversely isotropic, incremental growth tensor, described by sigmoids and dependent on 10 parameters | |
| Lee et al. [43] | Patient-specific LV; | ||
| transversely isotropic Guccione [102] | |||
| Genet et al. [48] | Four-chamber human heart model; | ||
| orthotropic Guccione [102] | , where is a scaling parameter in time and Macaulay brackets | Eccentric growth: | |
| Concentric growth: | |||
| Witzenburg and Holmes [49] | LV treated as thin-walled spherical pressure vessel; time-varying elastance compartmental model | Same as Kerckhoffs et al. [47] | Same as Kerckhoffs et al. [47] |
| Del Bianco et al. [50] | Truncated ellipsoid; | ||
| orthotropic Holzapfel–Ogden [106] | Local growth increments between cycles and : | Same as Göktepe et al. [39] for eccentric growth | |
| Peirlinck et al. [51] | Subject specific LV; | ||
| orthotropic Holzapfel–Ogden [106] | , , where is a scaling parameter and Macaulay brackets |
| Study | Production Rate | Survival Function | Remodeling | Volumetric Growth | Geometry | |
| Collagen | Elastin | Collagen | ||||
| Valentín et al. [59] | ||||||
| Classical | Dependent on deviation from homeostatic stress and homeostatic shear stress. | Exponential decay function | New deposition of collagen in direction of first and second principal directions of deviatoric part of Cauchy stress tensor. | Isotropic | ||
| , | ||||||
| where is a growth dependent penalty function approaching when | 2-layered aorta | |||||
| Eriksson et al. [69] | ||||||
| Hybrid | Axially constrained exponential degradation function | Dependent on deviation of collagen fiber stretch from homeostatic attachment stretch (given as material parameter) | Evolving recruitment stretches | Isotropic | ||
| 2-layered aorta | ||||||
| Wu and Shadden [72] | ||||||
| Classical | Deviation of wall shear stress and collagen fiber stress from homeostatic value and basal value of mass production rate per collagen family | Stepwise decrease normalized by the lifespan of collagen ( days) same as [65] | Stretch ratio of newly produced collagen set to current direction defined as , where is the initial collagen fiber direction | membrane model, no volumetric growth | Patient-specific, infrarenal aorta | |
| Virag et al. [73] | ||||||
| Classical | Driven by the deviation of the overall wall stress from homeostatic value | Exponential decay function depending on half-life of years and increased degradation due to inflammatory factors | Exponential decay function depending on ratio of current and homeostatic fiber tension and the presence of collagenases accelerating degradation | Constant pre-stretch for all constituents | No volumetric growth, semi-analytical solution | Axisymmetric, cylindrical geometry fusiform lesion |
| Famaey et al. [74] | ||||||
| Classical | Dependent on deviation of fiber stress from homeostatic value and basal production rate; Effects of shear wall stress neglected | Exponential decay function dependent on the fiber tension of a certain cohort collagen fiber families and a homeostatic constant decay | Deposition stretch assumed to be known constant for all collagen fibers Elastin prestretch is iteratively found by pressurizing a load-free geometry and prescribing prestretches until the geometry matches the reference configuration | No volumetric growth | Single linear hexahedral element | |
| Grytsan et al. [96] | ||||||
| Hybrid | Deviation of fiber stretch from homeostatic value | Exponential decay function for initiation of aneurysm development, as introduced by [91] | Governed by rate constants and deviation of fiber stretch from target value | Evolving recruitment stretches | Three different growth tensors studies: isotropic, in-plane and in-thickness volumetric growth | Thick walled cylinder |
| Lin et al. [98] | ||||||
| Hybrid | Dependent on deviation of fiber stretch from homeostatic value | Non-axisymmetric degradation function, dependent on axial and circumferential location | Exponential degradation function dependent on time (half-life) and fiber stretch. | of collagen fiber dependent on evolution of recruitment stretch | Isotropic growth , where is the volume change in previous time increment and is a penalty parameter | Thick walled cylinder |
| Horvat et al. [75] | ||||||
| Classical | Deviation of wall shear stress and intramural Cauchy stress from homeostatic values | Exponential decay function for initiation of aneurysm development, as introduced by [91] for symmetric case, non-symmetric case additionally dependent on circumferential direction | Governed by rate constants and deviation of fiber stretch from target value. | Constant pre-stretch for all constituents | Isotropic growth , where is a penalty parameter, and are initial and targeted current total mass | 3-layered, thick walled cylinder |
| Study | Myocyte | Volume Fraction [] | LV Mass | EF | EDP | ESP | HR | LV WT | |||
| [] | Myocytes | ECM | Collagen | [] | [] | [] | [] | [] | [] | ||
| Nitenberg et al. [179] | AS | ||||||||||
| Hess et al. [163] | Control | ||||||||||
| AS | |||||||||||
| Schaper 1981 | |||||||||||
| Schwarz et al. [180] | EF | ||||||||||
| EF | |||||||||||
| Kunkel 1982 | EF | ||||||||||
| EF | |||||||||||
| Hess et al. [181] | Control | ||||||||||
| AS pre AVR | |||||||||||
| AS post AVR | |||||||||||
| Huysman et al. [182] | Control | 73.4 | |||||||||
| AS subendocardial | 61.8 | ||||||||||
| AS subepicardial | 59.8 | ||||||||||
| Krayenbuehl et al. [4] | Control | ||||||||||
| Pre AVR | |||||||||||
| intermediate post AVR | |||||||||||
| 18 Months post AVR | |||||||||||
| Vliegen et al. [183] | Control | ||||||||||
| Moderate | |||||||||||
| Severe | |||||||||||
| Villari et al. [184] | Control | ||||||||||
| Group 1 | |||||||||||
| Group 2 | |||||||||||
| Group 3 | |||||||||||
| Villari et al. [185] | Control | ||||||||||
| Pre AVR | |||||||||||
| Months Post AVR | |||||||||||
| Months Post AVR | |||||||||||
| Akdemir [157] | Control | () | |||||||||
| AS | () | ||||||||||
| Hein et al. [3] | Control | ||||||||||
| EF | |||||||||||
| EF | |||||||||||
| EF | |||||||||||
| Herrmann et al. [186] | Moderate AS | ||||||||||
| Severe AS, High Gradient | |||||||||||
| Severe AS, EF | |||||||||||
| Severe AS, EF | |||||||||||
| Treibel et al. [14] | Pre AVR | () | |||||||||
| 1 year post AVR | |||||||||||
| Time Point | Myocytes | Collagen | Fibroblasts | Inflammatory Cells |
| Immediate reaction 2 weeks | Synthesis rises; area of transverse tubuli rises [156, 160]; hypertrophy, increase in diameter, not in length [159]. | Type III synthesis rises (thin fibers) [187];degradation rises. | ||
| Decline in relative collagen content due to myocyte hypertrophy [158] | ||||
| Mid term weeks | Synthesis stabilized [187]. | Synthesis rises times up to per day; synthesis exceeds degratation; degradation returns to baselevel. [187] | Collagen synthesis carried out by existing fibroblasts [157]. | |
| Fibrosis without cell necrosis: reactive fibrosis. [144] Hypothesis: reverse remodelling still possible. | ||||
| Long term 4 weeks | Get ensnared in dense collagen meshwork [187]. | Synthesis rises 3 times up to per day [157]; expanded intermuscular spaces filled with perimysial collagen [157]; meshwork around myocytes increases [162]; rise around intra-myocardial coronary arteries [162]. | Proliferation occurs, trigger collagen formation [151]. | |
| Cell necrosis: adaptive fibrosis [144]. Hypothesis: reverse remodelling no longer possible | ||||
| Cell death occurs [3]. | Lost myocytes replaced by type I collagen [162]. | Proliferation into myofibroblasts [151]; expression of -actin, closing spaces vacant after myocyte death [162]; scar formation [162]. | Migration to cell death sites; expression of MMPs which degenerate ECM. [136] | |
| Diastolic Heart Failure: EF preserved, capability to increase cardiac output when needed impaired. [123] | ||||
| Further cell death due to decrease in capillary density and inhibited capability to generate force during systole. [3, 144] | Ensnare myocytes, inhibit stretching during diastole; degradation rises due to MMPs from inflammatory sites. [162] | Invade from adventitia of vessels. [151] | Invade from adventitia of vessels; secretion of MMPs, degrading collagen. [136] | |
| Ongoing dilatation of the myocardium due to cell death and collagen degradation by MMPs, | ||||
| resulting eventually in Systolic Heart Failure [144] | ||||